richmond community air quality monitoring program … · richmond community air quality monitoring...
TRANSCRIPT

11/7/2012 Work Plan for Monitoring 1
Richmond Community Air Quality Monitoring Program
Work Plan Issue Date: November 7, 2012
1. Program Overview Chevron is submitting this Work Plan for Monitoring (Work Plan) to the Richmond City Manager’s Office for approval to implement the Richmond Community Air Quality Monitoring Program consistent with the Richmond Tax Settlement Agreement Section I (v) (Tax Settlement). This Work Plan supersedes the Work Plan originally submitted on October 14, 2008 under the Richmond Community Benefits Agreement Section 2 F (2). The Richmond Community Air Quality Monitoring Program includes community and refinery fence line monitoring. Community monitoring stations will be installed in three neighborhoods close to the Chevron Richmond Refinery, North Richmond (to the northeast), Atchison Village (to the east), and Point Richmond (to the southwest). The refinery fence line monitoring will be installed in three locations along the refinery fence line that border those adjacent neighborhoods. This Work Plan describes the scope of the program, provides technical details, describes how monitoring results will be reported, and gives the overall project schedule. For installation of the Richmond Community Air Monitoring Program, Chevron will provide project management and funding. Argos will install the systems with oversight from Chevron and the City Manager’s Office. After project installation, Argos will manage the operation, maintenance, and data reporting with direction from the City Manager’s Office and input from Chevron and community representatives. 2. Community Input Chevron held meetings with the Point Richmond and Atchison Village Neighborhood Councils between September 2011 and October 2012. The neighborhood councils provided input on the locations for the air monitors. Considerations discussed at these meetings included security, noise impacts on residents, proximity to other sources of emissions, and availability of electric power. There was significant discussion on the design of the data reporting system so that results are provided to the community in a meaningful and user-friendly manner. A similar discussion with the Shields-Reid neighborhood council was scheduled in October, but the neighborhood council meeting was cancelled. The discussion has been rescheduled for November 2012. 3. Monitoring System Design The key components of the Richmond Community Air Quality Monitoring Program are:
1. Community monitoring stations, which will be installed at three locations: the Atchison Village community center, the Shields-Reid community center, and the Point Richmond community center or Richmond natatorium. Addresses of the monitoring sites are listed

11/7/2012 Work Plan for Monitoring 2
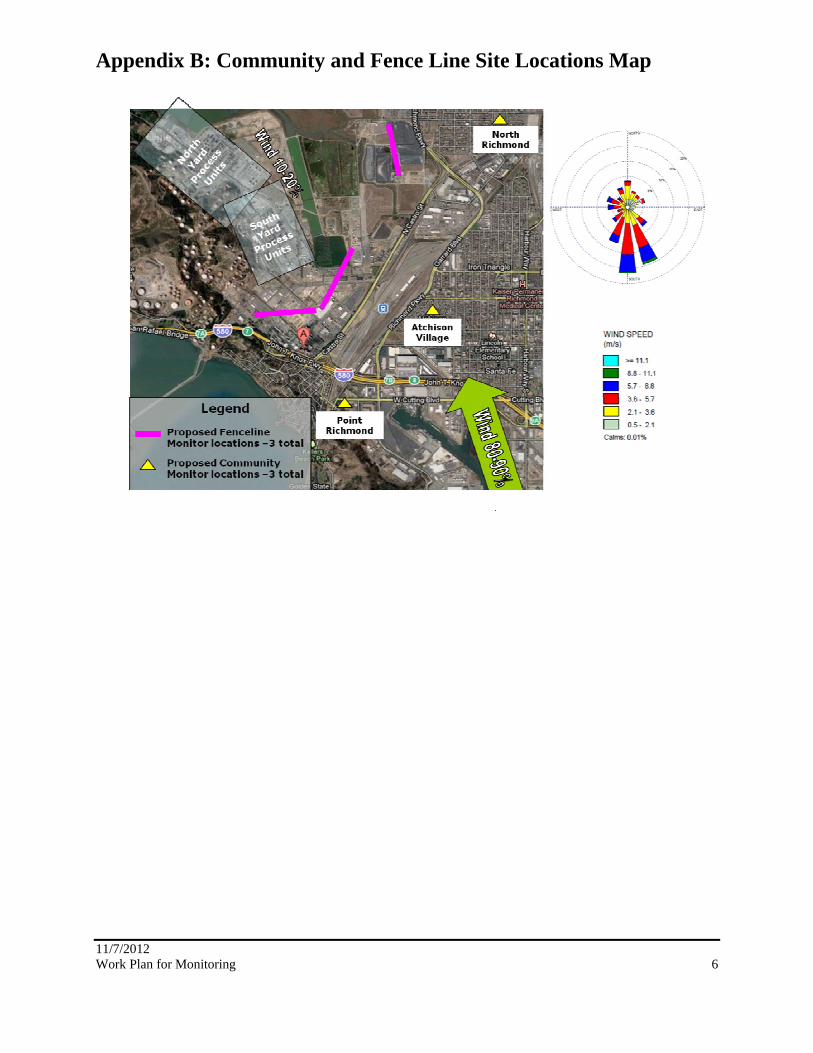
in Appendix A. The locations of the community monitoring sites are depicted on a map in Appendix B.
2. Open-path monitoring in three locations along the refinery fence line, which will be installed in line with the three neighborhoods. The locations of the fence line monitoring sites are depicted on a map in Appendix B.
3. Continuous and discrete monitoring data, which will be made available via a publicly accessible website, quarterly reports and community meetings.
4. Monitoring Methodology The following table summarizes the key compounds that will be monitored. Most monitoring is continuous. Some monitoring is done discretely during an event, and monthly to assure quality after background levels are established. Sampling protocol will be reviewed and adjusted as needed after monitoring data becomes available.
Key Compounds Monitoring System
(Community or Fence Line)Monitoring Type
(Continuous or Discrete)Criteria Air Pollutants PM 2.5 Community Continuous Sulfur Dioxide Fence Line Continuous VOCs (PAHs listed below) Speciated Alkanes
N-Hexane Community Continuous and Discrete 3-Methylpentane Community Continuous N-Heptane Community Continuous and Discrete N-Octane Community Continuous 2,2,4-Trimethylpentane Community Continuous
Aromatic Hydrocarbons Benzene, Toluene, Xylene
Fence Line and Community
Continuous Continuous and Discrete
Ethylbenzene, Trimethylbenzene
Community Continuous and Discrete
Metals Speciated Compounds Community Discrete
PAHs (Polycyclic Aromatic Hydrocarbons)
Speciated Compounds Community Discrete Other Compounds Hydrogen Sulfide Fence Line and Community Continuous Ammonia Community Continuous
Appendix C provides more detail of the community and fence line monitoring methodology, detection limits, and comparisons to other refinery programs and Bay Area Air Quality

11/7/2012 Work Plan for Monitoring 3
Management District (BAAQMD)/California Air Resources Board (CARB) monitoring programs. Appendix D is the detailed Argos Work Plan that contains additional detail on the methodology and equipment. 5. Data Reporting Monitoring data will be reported to the public in multiple forms. Argos will manage all aspects of data collection and reporting. Continuous and discrete monitoring data will be published to a publicly accessible website. In addition to publication on the web, Argos will provide quarterly reports to the City Manager’s Office and Chevron. These reports will be made available to the public as well. In response to requests from the neighborhood councils, Chevron plans to update the community on program implementation and monitoring data through participation in neighborhood council meetings and other appropriate forums. 6. Quality Assurance and Quality Control
The data from the monitoring systems will be reviewed and analyzed by Argos using standard Quality Assurance and Quality Control (QA/QC) protocols. Before monitoring commences, QA/QC Standard Operating Procedures (SOPs) will be written and made available to the public that include protocols for data acceptance. See Appendix D Argos Work Plan for additional information on the QA/QC protocols. 7. Schedule Appendix E presents a schedule for completing the Work Plan monitoring station installation. In keeping with the project schedule that two of the three neighborhood councils have agreed to, Chevron expects to order equipment within a month after approval of plan and work closely with Argos to ensure the equipment is installed and operational by the first quarter of 2013. 8. Program Management For installation of the Richmond Community Air Monitoring Program, Chevron will provide project management and funding. Argos will install the systems with oversight from Chevron and the City Manager’s Office. After project installation, the operation, maintenance, and data reporting will be managed by Argos with direction from the City Manager’s Office and input from Chevron and community representatives. All contractual arrangements for use of and access to the sampling locations as well as program management will be drafted and executed as appropriate.

11/7/2012 Work Plan for Monitoring 4
List of Appendices
A. Addresses of Community Air Monitoring Sites B. Community and Fence line Site Locations Map C. Richmond Community Air Monitoring Program Methodology & Comparisons to Other
Area Monitoring Sites D. Argos Work Plan E. Installation Schedule

11/7/2012 Work Plan for Monitoring 5
Appendix A: Addresses of Community Air Monitoring Sites
Location #1: North Richmond Shields Reid Community Center 1410 Kelsey Street
Location #2: Atchison Village
Atchison Village Community Center 230 Curry Street
Location #3: Point Richmond
Point Richmond Community Center 139 Washington Street Point Richmond, CA or: Point Richmond Natatorium 1 East Richmond Avenue Point Richmond, CA
11/7/2012 Work Plan for Monitoring 6
Appendix B: Community and Fence Line Site Locations Map

11/7/2012 Work Plan for Monitoring 7
Appendix C: Richmond Community Air Monitoring Program Methodology & Comparisons to Other Area Monitoring Sites Community Monitors
Pollutant/ Meterological Station Chevron Instrument TypeRichmond Community Air Monitoring Detection Limit
Phillips 66, Rodeo Detection Limit
Valero, Bencia Detection Limit
BAAQMD, 7th Street Detection Limit
BAAQMD, Rumrill/El Portal
Detection Limit Comments
Particulate Matter (PM 2.5)MetOne Continuous PM 2.5 Particulate Sampling System
6.0 μg/m3 Not Included 6.0 μg/m3 Not Included (PM10) includedAnalyzer at Valero,
Special Study at Conoco-Phillips
Black Carbon Particulate Continuous Black Carbon Monitor 50 ng/m3 Not Included 50 ng/m3 Not Included Not included
Poly Aromatic Hydrocarbons-Speciated Compounds
PAH Sampling System Hardware-Discrete Sampling
TBD Not Included Not Included Unknown Unknown
Hydrogen Sulfide Real-time Continuos H2S Monitor 1 ppb Not Included Not Included Included Not Included Ammonia Real -time continuous NH3 monitor 1 ppb Not Included see below Not Included Not Included
Metal Analysis- Speciated Compounds
PM 10 Sampling System Hardware (Metals Analysis) - Discrete sampling 2.0 ng/m3 Not Included Not Included Not Included Not Included
Speciated AlkanesContinuous Auto Gas Chromatograph -
Ozone Precursors and BTEX
Conoco-Phillips and Valero only measure
benzeneN-Hexane 0.5 ppb Not Included Not Included Unknown Unknown
3-Methylpentane 0.5 ppb Not Included Not Included Unknown UnknownN-Heptane 0.5 ppb Not Included Not Included Unknown UnknownN-Octane 0.5 ppb Not Included Not Included Unknown Unknown
2,2,4-Trimethylpentane 0.5 ppb Not Included Not Included Unknown Unknown
Aromatic Hydrocarbons
Continuous Auto Gas Chromatograph -Ozone Precursors and BTEX
Benzene 0.5 ppb Not Included Not Included Unknown UnknownToluene 0.5 ppb Not Included Not Included Unknown Unknown
Ethylbenzene 0.5 ppb Not Included Not Included Unknown UnknownM,P, Xylene 0.5 ppb Not Included Not Included Unknown Unknown
O-Xylene 0.5 ppb Not Included Not Included Unknown Unknown1,2,4-Trimethylbenzene 0.5 ppb Not Included Not Included Unknown Unknown1,3,5-Trimethylbenzene 0.5 ppb Not Included Not Included Unknown Unknown1,2,3-trimethylbenzene 0.5 ppb 60 ppb 60 ppb Unknown Unknown

11/7/2012 Work Plan for Monitoring 8
Community Monitors (continued)
Pollutant/ Meterological Station Chevron Instrument TypeRichmond Community Air Monitoring Detection Limit
Phillips 66, Rodeo Detection Limit
Valero, Bencia Detection Limit
BAAQMD, 7th Street Detection Limit
BAAQMD, Rumrill/El Portal
Detection Limit Comments
1,3-Butadiene EPA TO-15 Discrete Sampling 0.057 ppb 0.057 ppb 0.057 ppb 0.057 ppb 0.05 ppb
Dichloromethane EPA TO-15 Discrete Sampling 0.1 ppb 0.1 ppb 0.1 ppb 0.1 ppb 0.1 ppbCarbon Tetrachloride EPA TO-15 Discrete Sampling 0.01 ppb 0.01 ppb 0.01 ppb 0.01 ppb 0.01 ppbTetrachloroethylene EPA TO-15 Discrete Sampling 0.005 ppb 0.005 ppb 0.005 ppb 0.005 ppb 0.005 ppb
Vinyl Chloride EPA TO-15 Discrete Sampling 0.1 ppb 0.1 ppb 0.1 ppb 0.1 ppb 0.1 ppbM/P Xylene EPA TO-15 Discrete Sampling 0.04 ppb 0.04 ppb 0.04 ppb 0.04 ppb 0.04 ppb
Benzene EPA TO-15 Discrete Sampling 0.02 ppb 0.02 ppb 0.02 ppb 0.02 ppb 0.02 ppbToluene EPA TO-15 Discrete Sampling 0.04 ppb 0.04 ppb 0.04 ppb 0.04 ppb 0.04 ppb
Ethylbenzene EPA TO-15 Discrete Sampling 0.04 ppb 0.04 ppb 0.04 ppb 0.04 ppb 0.04 ppbO-Xylene EPA TO-15 Discrete Sampling 0.04 ppb 0.04 ppb 0.04 ppb 0.04 ppb 0.04 ppb
Wind Speed/ Wind Direction Continuous Meteorological Station Included Included Included Unknown Unknown*BAAQMD Toxics Air Monitoring Data 2009 Footnote (2): Some samples (especially metals) have individual MDLs for each sample. An average of these MDLs was used to determine 1/2 MDL for the Average Sample Value.
Valero and Phillips 66 use portable open-path UV for ammonia, benzene, sulfur dioxide, toluene, and xylene. The analyzer detection limits (60 ppb) are too high and the 150 meter path lengths are too low to be useful. Auto GC's are better technologies.
Argos to supply list of speciated compound for metals and PAH analyses
Laboratory Anallysis per EPA Method TO-15* (Partial List)

11/7/2012 Work Plan for Monitoring 9
Fence Line Monitors
Pollutant Chevron Instrument typeChevron, Richmond
Detection LimitPhillips 66, Rodeo
Detection LimitValero, Bencia Detection Limit Instrument type
Benzene 5 ppb 5 ppb 5 ppbToluene 5 ppb 5 ppb 5 ppbp-Xylene Continuous Open-Path UV 5 ppb 5 ppb 5 ppbSulfur Dioxide 5 ppb 5 ppb 5 ppbCarbon Disulfide 5 ppb 5 ppb 5 ppb
Hydrogen SulfideContinuous Boreal Tunable
Diode Laser 30 ppb 30 ppbNot included Boreal Tunable Diode Laser
Wind Speed/Direction
Continuous Meterological Station Included Included Included Meterological Station
Conoco Phillips, Rodeo uses open-path FTIR for carbonyl sulfide, 1,3 butadiene, ethanol, ethylene, ammonia, mercaptan,methane, MTBE, total hydrocarbons, carbon monoxide, and nitrous oxide. Open-path FTIRs have proven to be VERY unreliable as fenceline monitors. The Conoco-Phillips FTIRs are currently off-line and have been on-line less than 30% of the time in the past year.
Open-Path UV

11/7/2012 Work Plan for Monitoring 10
Appendix D: Argos Work Plan
Argos Scientific, Inc. Proposal For
Design and Installation of Richmond Community Monitoring Stations
November 6, 2012

11/7/2012 Work Plan for Monitoring 11
1. Introduction
Chevron Products Company, a division of Chevron USA has asked Argos Scientific Inc. to provide a design recommendation for a series of community air monitoring stations located within the communities surrounding the Richmond Refinery. Argos has experience in the measurement of gaseous compounds typically emitted from oil refineries, and has direct experience in the operation of fence line and community monitoring stations in the San Francisco Bay area. Argos technical team representatives have visited the refinery and surrounding communities, inspected the general area in which the systems are to be deployed, and held meetings with Chevron personnel in order to clarify the scope and make a more precise estimate of the operating approach. This proposal is intended to cover the community monitoring portion of the project, and will include a full description of the technology and data presentation methods of the community monitoring systems.
2. Objectives of the Community Air Monitoring Program
The objective of the community air monitoring program is to provide the communities surrounding the Chevron Richmond refinery with a method of determining the source and impact of air pollutants on their community. The monitoring stations include air samplers that provide near real-time air quality data to the public, provide a resource center for local educational institutions, and provide local emergency response personnel with additional tools in the event of an unplanned release of air pollutants. Our experience has shown that the following items are the critical components of an effective community monitoring program.
Install Continuous Air Sampling Equipment
A key element in establishing a community air monitoring station is to install monitoring equipment that can measure ambient gases and particulate matter in the community using continuous analyzers that detect certain indicator species of air pollutants. The indicator species are used to infer the presence of larger sets of gases and particles that originate from emission sources in the vicinity of the air monitoring equipment. The indicator species measured on a continuous basis that will be used at the community monitoring stations are:
a. Particulate Matter 2.5 microns (PM 2.5)
b. Black Carbon
c. Hydrogen Sulfide
d. Organic vapors including aromatics Benzene, Toluene, and Xylene
e. Light Hydrocarbon and ozone precursors
f. Ammonia

11/7/2012 Work Plan for Monitoring 12
Install Air Sampling Equipment for Event Driven Situations
The event driven sampling equipment is designed to activate on a preset sample schedule or manually by emergency response personnel. Once activated, the samplers will collect a grab sample of the ambient air for a preset period of time. The grab samples will capture a broader set of pollutants. The pollutant parameters included in the event driven monitoring equipment will include:
a. Poly Aromatic Hydrocarbons (PAHs)
b. Metals
c. Volatile Organic Compounds (VOCs)
Install Meteorological Equipment
Each air monitoring station will include a Meteorological station that will measure wind speed, wind direction, temperature and relative humidity. Report Data on a Real-Time Community Website
The data from the air monitoring equipment and the meteorological station will be posted to a website that can be accessed by the community.
Provide Quarterly Reports
Data will be summarized on a quarterly basis in a publicly available report that also presents quality assurance/quality control (QA/QC) data to the community.
3. Technical Approach
Argos is recommending that the community monitoring systems include a combination of real-time point sampling stations located within the community centers located in North Richmond, Atchison Village and Point Richmond (the Point Richmond Natatorium may be considered as an alternate location for the Point Richmond Community Center). Each community location will have a full complement of air monitoring equipment along with a real-time Internet feed.
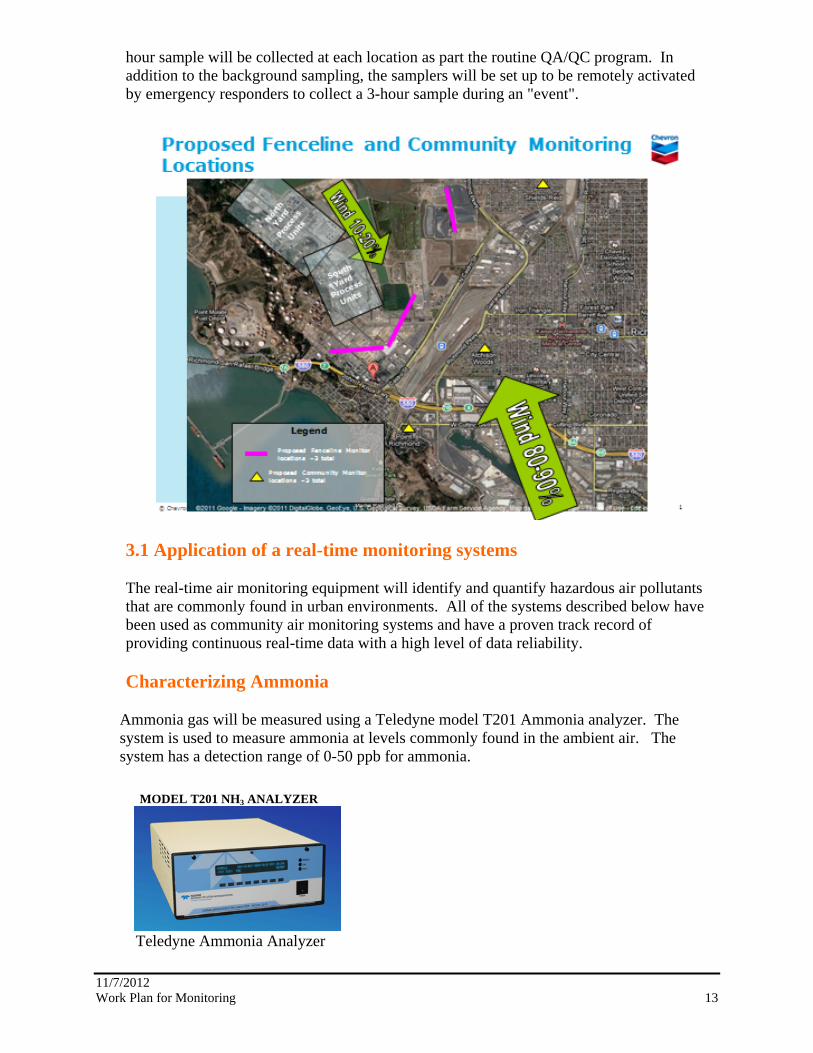
In addition to the real-time data, samplers will be set up at each community monitoring location that have the capability to provide enhanced ambient air sampling for metal, PAHs, and VOCs in situations where “events” are occurring. The systems will be set to have both automated sampling capability (24 hour composite samples) as well as a manual sample trigger that can be set off remotely via Internet connection. For the first two months of operation, 24 hour composite samples for each target analyte group (PAH, metals and VOCs) will be taken on a six day schedule. The samples will be used to determine background levels of each target analyte. Then on a monthly basis, a 24
11/7/2012 Work Plan for Monitoring 13
hour sample will be collected at each location as part the routine QA/QC program. In addition to the background sampling, the samplers will be set up to be remotely activated by emergency responders to collect a 3-hour sample during an "event".
3.1 Application of a real-time monitoring systems
The real-time air monitoring equipment will identify and quantify hazardous air pollutants that are commonly found in urban environments. All of the systems described below have been used as community air monitoring systems and have a proven track record of providing continuous real-time data with a high level of data reliability.
Characterizing Ammonia
Ammonia gas will be measured using a Teledyne model T201 Ammonia analyzer. The system is used to measure ammonia at levels commonly found in the ambient air. The system has a detection range of 0-50 ppb for ammonia.
MODEL T201 NH3 ANALYZER
Teledyne Ammonia Analyzer

11/7/2012 Work Plan for Monitoring 14
Characterizing Particulate Matter of Size 2.5 Microns (PM 2.5) Particulate Matter of size 2.5 microns (PM 2.5) will be analyzed using a MetOne BAM 1020 PM 2.5 particulate monitor. The Bay Area Air Quality Management District uses these systems as part of their ambient air monitoring network.
BAM 1020 PM 2.5 Particulate Monitor
Characterizing Black Carbon
The black carbon air monitoring system detects particles in the air associated with vehicle emissions, soot from wood burning, and particles associated with forest fires. The system that will be used for this study is a Teledyne API Model 633 Black Carbon Monitor.
Teledyne API Black Carbon Monitor
Characterizing Hydrogen Sulfide
Hydrogen Sulfide gas will be measured using a Teledyne model T101 H2S analyzer. The system is used to measure hydrogen sulfide at levels commonly found in the ambient air. The system has a detection range of 0-500 ppb for Hydrogen Sulfide.

11/7/2012 Work Plan for Monitoring 15
Teledyne Real-time H2S Monitor
Characterizing Aromatic Gases and Ozone Precursors
Aromatic gases and ozone precursors will be measured using a real-time gas chromatograph manufactured by Synspec, Inc. The system is capable of detecting multiple gases on a continuous basis. A similar system that measures mercaptans is currently being used at the Benicia Community Air Monitoring station.
Synspec Real-Time Gas Chromatograph
3.2 Air Sampling Equipment for Event Driven Situations
The event driven air monitoring equipment is intended to sample the ambient air for an enhanced set of air pollutants. All of the systems described below have been used as community air monitoring systems and have a proven track record of providing event based air samples with a high level of data reliability. Poly-aromatic hydrocarbons (PAHs)
PAH sampling will entail using a polyurethane foam sampler (PUF) that draws ambient air through a sample filter that captures polycyclic aromatic hydrocarbons (PAHs). Once the sample has drawn ambient air through the filter for a set sample period, the filter is then removed from the sampling system and analyzed at an EPA accredited laboratory.
Tisch PUF Air Sampler

11/7/2012 Work Plan for Monitoring 16
Metals Sampling
Metals sampling will entail using a PM10 air sampler that draws ambient air through a sample filter that captures particulate matter containing metals. Once the sample has drawn ambient air through the filter for a set sample period, the filter is then removed from the sampling system and analyzed at an EPA accredited laboratory.
Met One SASS Speciation Sampler
Enhanced VOC Sampling Enhanced VOC sampling will entail using an air sampler that draws ambient air through into a tedlar bag that captures a sample of the ambient air. Once the sample has been drawn into the tedlar bag, the bag is then removed from the sampling system and analyzed at an EPA accredited laboratory.
Air Sampling Box for Tedlar Bag Sampler
Airflow/Wind Measurements
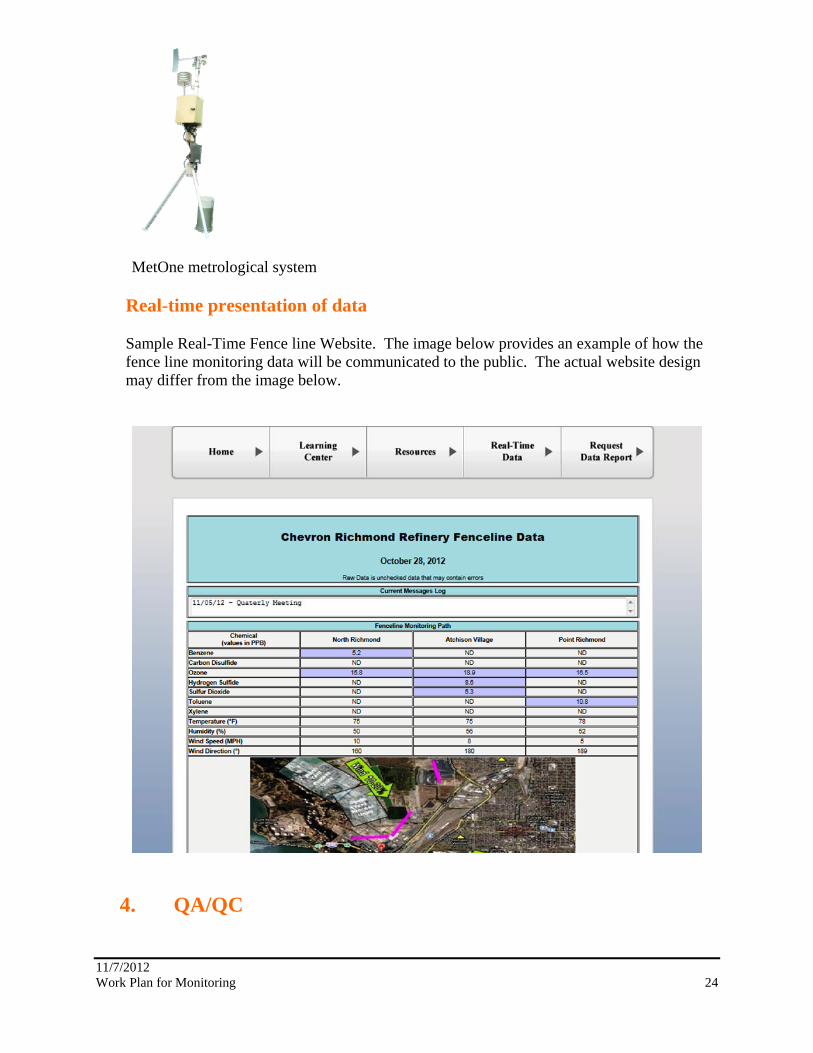
Local wind conditions will be measured using meteorological systems that will measure wind speed, wind direction, temperature, and relative humidity. The wind speed and direction measurements can be used to identify the source of gas detections, as well as predict what direction the plume is travelling. The temperature and relative humidity measurements are used to predict when environmental factors such as fog will be present. Each monitoring location will have a MetOne metrological system.

11/7/2012 Work Plan for Monitoring 17
MetOne metrological system
Real-time presentation of data
Data from the monitoring stations will be combined together and transmitted to an Internet website where the real-time results can be viewed by the public. The real-time website page will be incorporated into a larger website that will present additional resources to assist in the interpretation of the data. The image below provides an example of how the community monitoring data will be communicated to the public. The actual website design may differ from the image below.

11/7/2012 Work Plan for Monitoring 18
3.3 Data Reporting
At the end of each month, the data from the systems will be reviewed and analyzed using standard Quality Assurance and Quality Control protocols. The reviewed data will be put into a report that will be issued on a quarterly basis and can be downloaded via the public access website.
4. QA/QC
Before monitoring commences, Standard Operating Procedures (SOPs) will be written and made available to the public that will include a QA/QC section that includes protocols for data acceptance. The data from the monitoring systems will be reviewed and analyzed by Argos using standard QA/QC protocols specified by the EPA, CARB, BAAQMD or the equipment manufacturers.
5. Project Team
Project Manager- Don Gamiles holds a Ph.D. and has worked in the field of spectral analysis for the past twenty years, having built and designed open path and portable UV and InfraRed air monitoring systems. He is the owner of Argos Scientific, and previously Cerex Environmental, both of which are vendors and operators of air monitoring systems. Don will be assisted by Axel Abellard B.Sc. Eng (Mechanical and Computer Engineering). Additional site personnel will be drawn from the current contractors working with Argos in support of fence line monitoring programs in the San Francisco Bay area.
6. Timelines Systems will be installed and commissioned no later than 120 days after receipt of order.
Disclaimer
The information contained in this document (including any attached or accompanying materials), any other documents produced by Argos, or any related discussions or negotiations, is proprietary to Argos and strictly confidential. This document is intended solely for the use and evaluation of the intended recipient, and it may not be disclosed, used, or reproduced by any person or entity except to the extent expressly authorized in writing by Argos.

11/7/2012 Work Plan for Monitoring 19
Argos Scientific, Inc. Proposal For
Design and Installation of Fence Line Monitoring Stations at the Chevron Richmond Refinery
November 6, 2012

11/7/2012 Work Plan for Monitoring 20
1. Introduction Chevron Products Company, a division of Chevron USA has asked Argos Scientific Inc. to provide a design recommendation for a fence line monitoring system for the Richmond Refinery. Argos has experience in the measurement of gaseous compounds typically emitted from oil refineries, and has direct experience in the operation of fence line and community monitoring stations in the San Francisco Bay area. Argos technical team representatives have visited the refinery and surrounding communities, inspected the general area in which the systems are to be deployed, and held meetings with Chevron personnel in order to clarify the scope and make a more precise estimate of the operating approach. This proposal is intended to cover the fence line monitoring portion of the project, and will include a full description of the technology and data presentation methods of the fence line monitoring systems.
2. Objectives of the Fence line Monitoring Program The objective of the fence line monitoring program is to provide the communities surrounding the Chevron Richmond refinery with a method to measure the air quality at refinery’s fence line. The systems are composed of real-time gas monitoring systems, meteorological stations, and a public access website that presents the data. Combining chemical measurements with meteorological data is a key factor in being able to estimate the source of chemicals in the air, and ultimately tracking their destination. In addition, posting the results of the monitoring effort to a public access website allows for timely dissemination of this information to the community, the refinery, and first responders. All of the systems described below have been used extensively as fence line air monitoring systems at refineries and have a proven track record of providing continuous real-time data with a high level of data reliability. The advantage of this technology is the ability to monitor over long distances with one instrument, as opposed to using multiple singe-point instruments spread out over the same distance. Single point instruments can certainly be used as part of a successful monitoring network, but the use of open path instruments that operate over long paths greatly reduces the chance of missing chemical detections that might otherwise pass between two instruments. The systems were selected based on the fact that cross-interferences and false detections with other gases in the ambient air including water vapor are minimized. Our experience has shown that the following steps are the critical components of an effective fence line monitoring program.
Fence line Monitoring Overview In the context of fence line air monitoring, “indicator gases” refers to compounds that are easy to detect using fence line air monitors which can then be used to infer the presence of a larger set of gases. For example, Sulfur Dioxide, which is easy to detect using open-path instruments, is often present during a release of gases containing sulfur compounds, thus, it is an ideal indicator gas for other gases that cannot be measured using open-path air monitoring systems.

11/7/2012 Work Plan for Monitoring 21
The indicator gases that will be used at Chevron are:
a. Hydrogen Sulfide
b. Organic vapors including Benzene, Toluene, and p-Xylene
c. Sulfur Dioxide
d. Carbon Disulfide
These gases are consistent with the open-path air monitoring systems currently installed at the Phillips 66 Rodeo refinery, and the Valero refinery in Benicia.
Continuously measure the meteorological parameters
Meteorological data including wind speed, wind direction, temperature and relative humidity are used to find the source of a detected gas, as well as predict where the gas is migrating to.
Real-time Website Once data is generated by the air monitors it will be combined into a website that can be accessed by the community.
Summarize Data
Data from the monitoring stations will be combined together and transmitted to an Internet website where the real-time results can be viewed by the public. The real-time website page will be incorporated into a larger website that will present additional resources to assist in the interpretation of the data.
3. Technical Approach
The fence line monitoring system will include a combination of open-path ultra-violet (UV) and infrared (IR) tuneable diode lasers, and real-time meteorological stations located along three paths within the refinery. The three fence line systems will be positioned along paths between the refinery and the communities of North Richmond, Atchison Village, and Point Richmond. Each path will have a full complement of air monitoring equipment along with a real-time Internet feed.

11/7/2012 Work Plan for Monitoring 22
Application of an open path monitoring system Open path monitoring in this context involves the measurement of gas concentrations along a beam path between two instrument components over a long distance. Gases are identified and quantified by comparing the detected gases to a calibrated gas library. An array of two open path units (one Infra-Red and one UV) will be required to effectively measure the range of compounds anticipated to be present. These systems have been selected based on their capability to detect gases that are commonly associated with refinery emissions, as well as their ability to maintain a high level of on-stream efficiency.
Characterizing Hydrogen Sulfide Hydrogen Sulfide (H2S) will be measured by open path Tuneable Diode Lasers (TDLs). Open-path H2S TDLs are currently deployed as part of the Phillips 66 fence line monitoring stations. The units were part of the original fence line installation in the late 1990s.
Boreal Tunable Diode Laser The systems shoot a laser beam out to a reflector approximately 800 yards away. The light will then be reflected back to the TDL where it will be analyzed for hydrogen sulfide. The systems log their results to a field computer every five minutes and the results are transmitted to a website where the community can see the results.

11/7/2012 Work Plan for Monitoring 23
The hydrogen sulfide tunable diode laser air monitoring system was instrumental in detecting a plume of sulfur gases that migrated towards the community of Crockett, California when a storage tank containing sour water ruptured this summer. The system detected the plume and the community website reported the detections as they occurred.
Characterizing organic gases and sulfur dioxide Organic compounds and sulfur dioxide will be measured by open path ultraviolet spectral absorbance analysis. The systems are manufactured by Argos Scientific, and are currently part of the fence line monitoring packages at both the Phillips 66 refinery in Rodeo, and the Valero refinery in Benicia. The systems use ultra-violet (UV) light to detect Benzene, Carbon Disulfide, Sulfur Dioxide, Toluene, and p-Xylene. As with the TDLs, the advantage of being able to cover long distances with a single instrument is well documented not only in theory, but by our real-world experience operating these instruments on a continual basis at industrial facilities. The open-path UV air monitoring systems have consistently shown when emissions containing aromatic and sulfur gases have drifted off-site at the Phillips 66 Rodeo refinery. Many times these detections can be matched with wind speed and wind direction to predict when odor events may occur in the local community.
Argos Open-path UV Analyzer
Airflow/wind measurements Local wind conditions will be measured using meteorological systems that will measure wind speed, wind direction, temperature, and relative humidity. The wind speed and direction measurements can be used to identify the source of gas detections, as well as predict what direction the plume is traveling. The temperature and relative humidity measurements are used to predict when environmental factors such as fog will be present. Each monitoring location will have a MetOne metrological system.
11/7/2012 Work Plan for Monitoring 24
MetOne metrological system
Real-time presentation of data
Sample Real-Time Fence line Website. The image below provides an example of how the fence line monitoring data will be communicated to the public. The actual website design may differ from the image below.
4. QA/QC

11/7/2012 Work Plan for Monitoring 25
Before monitoring commences, QA/QC Standard Operating Procedures (SOPs) will be written and made available to the public that include protocols for data acceptance. Data acceptance criteria will include factors such as downtime due to weather related events such as heavy rain or fog. The open-path air monitoring systems will be evaluated using standard data analysis protocols as outlined in EPA’s Compendium Method TO-16 for the Determination of Toxic Organic Compounds in Ambient Air.
5. Project Team
Project Manager- Don Gamiles holds a Ph.D. and has worked in the field of spectral analysis for the past twenty years, having built and designed open path and portable UV and InfraRed air monitoring systems. He is the owner of Argos Scientific and previously Cerex Environmental, both vendors and operators of air monitoring systems. Don will be assisted by Axel Abellard, BSc Eng (Mechanical and Computer Engineering). Additional site personnel will be drawn from the current contractors working with Argos in support of fence line monitoring programs in the San Francisco Bay area.
6. Timelines
Systems will be installed and commissioned no later than 120 days after receipt of order. Disclaimer
The information contained in this document (including any attached or accompanying materials), any other documents produced by Argos, or any related discussions or negotiations, is proprietary to Argos and strictly confidential. This document is intended solely for the use and evaluation of the intended recipient, and it may not be disclosed, used, or reproduced by any person or entity except to the extent expressly authorized in writing by Argos.

11/7/2012 Work Plan for Monitoring 26
Appendix E: Installation Schedule
Task Name Oct 2012
Work Plan Review
Execute Monitoring Work Plan
Engineering
Equipment procurement
Construction
Commissioning
Stakeholder Communication
Establish contract agreement
Project Reporting
Nov 2012 Dec 2012 Jan 2013 Feb 2013 Mar 2013