rheology of concentrated polymeric dispersions
TRANSCRIPT
Rheology of Concentrated Polymeric Dispersions
Alfonso Arevalillo, Marcelo do Amaral,† and JoseM. Asua*
Institute for Polymeric Materials (POLYMAT) and Grupo de Ingenierı´a Quımica, Facultad de CienciasQuımicas, The UniVersity of the Basque Country, Apdo 1072, 20018 Donostia-San Sebastia´n, Spain
A rheological model that accounts for the effect of the volume fraction, the particle size distribution (PSD),and the shear rate on the dispersion viscosity was developed. The model contains three parameters (k1, k2,andk3) that accounted for the interaction among particles. The model was validated in experiments in whichthe surfactant type and concentration, the volume fraction, the PSD, and the shear rate were widely varied.The parameters were observed to be independent of the volume fraction, the PSD, and the shear rate. Parameterk1 increases with the surfactant content but was independent of the ratio anionic surfactant/nonionic surfactant.On the other hand, under the range of experimental conditions studied,k2 andk3 were not affected by thesurfactant type and concentration.
Introduction
Most commercial polymeric dispersions have solids contentsof >50 wt %.1 Actually, latexes with even higher solids contentare advantageous, because they maximize the reactor capacityduring production, minimize the transport costs, give moreflexibility in product formulation, and allow faster drying rates.2
Polymer latexes are mostly produced by semicontinuous emul-sion polymerization, and the upper limit of the solids contentof the polymeric dispersions is, to a large extent, determinedby the rheology of the concentrated dispersion. Thus, mixingand heat transfer in the reactor are dependent on the viscosity,which increases with the solids content. In a semicontinuousemulsion polymerization, poor mixing may result in localvariations of the concentrations of initiator and surfactant thatare continuously fed into the reactor, leading to coagulation(because the local increase of the ionic strength and the lack ofsurfactant). In addition, the safety of the polymerization processrelies on an efficient removal of the heat generated duringpolymerization, which is compromised by a high viscosity.Rheology also has a crucial role in the applications (e.g., as anadhesive or coating) of the polymeric dispersion. It is well-known that the dispersion viscosity is dependent on the solidscontent (in rheological studies, this parameter is commonlyexpressed as the volume fraction of the dispersed phase), particlesize distribution, and shear rate.
Table 1 summarizes the widely used empirical relationshipsof Krieger and Dougherty3 and Mooney4 for the dependence ofthe viscosity, with respect to the solids content. In theseequations,æ is the volume fraction of the dispersed phase, [η]the intrinsic viscosity, andæn the maximum volume fraction(packing factor) for a particular latex. The equations in Table 1do not include any specific dependence of the viscosity on theparticle size distribution (PSD) and the shear rate.
Sudduth5-8 realized that the equations in Table 1 had the samedifferential form:
where σ is defined as the particle-particle interaction coef-ficient. Sudduth5-8 integrated eq 1, assuming a constantparticle-particle interaction coefficient:
The effect of the PSD on the viscosity was taken into accountby definingæn andσ as follows:
whereæn,ult is the maximum packing factor that can be achievedwith any PSD,æm is the maximum packing factor for mono-dispersed particles, is a constant,σPC and σs are adjustableparameters of the model, andDi was the ratio between theithand the (i - 1)th moments of the PSD. For a dispersioncharacterized by a number density PSD,n(dp), such as the totalnumber of particles,Np, is given by
Di was calculated as follows:
Equation 2 has been found useful to describe the effect ofthe solids content and PSD on the low shear dispersionviscosity.9,10However, the equation does not consider the effectof the shear rate on the viscosity. In addition, it is open to
* To whom correspondence should be addressed. Tel.:+34 943018181. Fax:+34 943 015270. E-mail address: [email protected].
† Present address: IQT, Rua Irmaos Albernaz 300, 12030-190,Taubate, SP, Brazil.
dηη
) [η](1 - ææn
)-σdæ (1)
Table 1. Viscosity Equations
reference equation derivative form
Krieger andDougherty3 η ) η0(1 - æ
æn)-[η]æn dη
η) [η](1 - æ
æn)-1
dæ
Mooney4η ) η0 exp([η]
æ1 - (æ/æn)) dη
η) [η](1 - æ
æn)-2
dæ
ln[ ηη0] ) [η]æn( 1
σ - 1)[(1 - ææn
)1-σ- 1] (for σ * 1)
(2)
æn ) æn,ult - (æn,ult - æm) exp[R(1 -D5
D1)] (3)
σ )σPC
D1+ σs (4)
Np ) ∫0
∞n(dp) d(dp) (5)
Di )∫0
∞dpin(dp) d(dp)
∫0
∞dpi-1n(dp) d(dp)
(6)
3280 Ind. Eng. Chem. Res.2006,45, 3280-3286
10.1021/ie0510371 CCC: $33.50 © 2006 American Chemical SocietyPublished on Web 03/29/2006
discussion that the particle-particle interaction coefficient isindependent of the volume fraction of the dispersed phase.
Krieger and Dougherty3 proposed the following equation forthe effect of shear on the viscosity of dispersions of monodis-perse hard spheres (i.e., without long-range interactions):
whereηr is the relative viscosity,ηr0 and ηr∞ are the relativeviscosities at zero shear limit and at the high shear limit,respectively,b is an adjustable parameter, andτr is the reducedshear stress:
whereτ is the shear stress anda is the particle radius. It hasbeen proposed11 that the volume fraction dependence ofηr0 andηr∞ can be taken into account by the Krieger-Doughertyequation given in Table 1, whereæn for the zero shear and highshear limits should be experimentally determined. This modeldoes not account for the effect of the PSD on viscosity.
Quemada et al.12 proposed a rheological model that includedthe effect of the volume fraction and shear rate on the viscosity.In this model, the dispersion is considered to be a mixture ofindividual particles and groups of them, which have been namedstructural units. Each structural unit includes particles that movetogether as a coherent cluster carrying a volume of liquid thatwas immobilized. Therefore, the apparent volume of the clusteris that of the particles plus that of the immobilized liquid.Consequently, the formation of clusters leads to an increase ofthe apparent volume of the dispersed phase and, hence, to anincrease of the dispersion viscosity. In this context, the shear-thinning behavior is considered to be the result of the clusterbreakdown, which increases the total volume of free liquid. Inthis model, the dispersion viscosity is given by
whereηF is the viscosity of the dispersing fluid,γ is the shearrate, andk0, k∞, λ, andp are parameters of the model.k0 andk∞are dependent in an unknown way on the volume fraction ofthe dispersed phase. Equations 9-11 are able to fit well theeffect of the shear rate on the viscosity for a given dispersion,namely for a given PSD and a given volume fraction of thedispersed phase. However, new parameters should be estimatedwhen either the PSD and/or the solids content vary. Thisrepresents a serious drawback in many practical cases, such asemulsion polymerization (where both the volume fraction andthe PSD vary during the process) and product formulation(where the solids content of the dispersion may be varied).
In this article, a model that explicitly accounts for the effectof the volume fraction of the dispersed phase, the PSD, and theshear rate on the dispersion viscosity is presented.
Viscosity Model
Let us consider a dispersion characterized by a number densityPSD,n(dp), such that the total number of particles (Np) is given
by eq 5 and the number average particle diameter (dp) is givenby
For such a distribution, eq 1 gives the increase in viscosityproduced by an increase of the volume fraction. Integration ofeq 1 yields
For a given PSD, a rigorous calculation of the geometricmaximum packing factor is avaliable:13
where
andφm0 is the porosity of a monodispersed system (φm
0 ) 1 -æm). In this work, the value ofφm
0 that has been given by Lee14
(φm0 ) 0.361) was used. In addition,
Note that the maximum packing factor given by eq 14 is basedon geometric considerations, namely, it is independent of shearrate and variables such as ionic strength. In the present model,the influence of these variables on the viscosity are incorporatedinto the so-called particle-particle interaction coefficient.
Most commercial latexes are stabilized by complex surfactantsystems that include both ionic and nonionic surfactants. Inaddition, stabilization is enhanced by including functionalmonomers such as acrylic acid in the formulation. Theelectrostatic repulsion causes enhancement of the low-shearviscosity and pronounced shear thinning.15,16Steric barriers havea similar effect.17 Therefore, the particle-particle interactioncoefficient in eq 13 should account for these effects.
The interaction potential in electrostatically stabilized disper-sions decreases exponentially with the distance between par-ticles.18 On the other hand, it has been suggested19 that, forpractical purposes, the interaction potential in sterically stabilizedsystems also decreases exponentially with the distance betweenparticles. Therefore, the particle-particle interaction coefficientwas assumed to be dependent exponentially on the averagedistance between particles:
wherek1 andb1 are parameters of the model andh is the averagedistance between particles, which was assumed to be propor-tional to the cubic root of the available volume fraction:
On the other hand, particle-particle interactions are dependenton shear for both ionic20 and nonionic stabilizers.17 In the model,
ηr ) ηr∞ +ηr0 - ηr∞
1 + bτr(7)
τr ) τa3
kT(8)
η ) η∞( 1 + (λγ)p
(η∞
η0)0.5
+ (λγ)p)2
(9)
η0 ) ηF(1 - 0.5k0æ)-2 (10)
η∞ ) ηF(1 - 0.5k∞æ)-2 (11)
dp ) ∫0
∞dpn(dp) d(dp)/Np (12)
ln( ηηF
) ) ∫0
æfinal [η](1 - ææn
)-σdæ (13)
σ ) k1 exp(-b1h) (17)
h ) b2(æn - æ)1/3 (18)
Ind. Eng. Chem. Res., Vol. 45, No. 9, 20063281
this effect was included inb1 as
The combination of eqs 17-19 yields
wherek2 is a pooled parameter includingb2 andb3:
The model incorporates the effect of the PSD throughæn, andthe effect of the shear rate is explicitly taken into account in eq20. In addition, the effect of the volume fraction of the dispersedphase is included in the integral of eq 13. The model containsthree adjustable parameters,k1, k2, andk3, which are expectedto be dependent on the stabilizing system (type and concentrationof surfactants, ionic strength of the aqueous phase, ...), but theyare expected to be independent of the volume fraction of thedispersed phase, the PSD, and the shear rate. The parameterk1
rules the interaction at very short distances among particles,i.e., when (æn - æ) approaches zero (eq 20). The parameterk2
determines how fast the interaction decreases with the distancebetween particles and with the shear rate: the higher the valueof k2, the sharper the decrease of viscosity with dilution. Theparameterk3 accounts for the influence of shear rate onviscosity: the higher the value ofk3, the stronger the shear-thinning behavior.
Experimental Section
Table 2 summarizes the high solids (60-68 wt %) polymericwaterborne dispersions that have been used in this study. Thesedispersions were produced via the semicontinuous (mini)-emulsion copolymerization of 2-ethyl-hexyl acrylate, methylmethacrylate, and acrylic acid (88/10/2, wt/wt) using bothanionic (Dowfax 2A1 supplied by Dow Chemicals, 45% activesubstance) and nonionic (Disponil A3065 supplied by Cognis,65% active substance) surfactants. Note that the preparation ofdispersions with solids content in the range of 60-68 wt %requires precise polymerization procedures.10 Anionic surfactantsare very efficient stabilizing particle precursors during nucleationand allow the fine tuning of the nucleation process and, hence,that of the PSD. However, they do not provide salt and freeze-thaw stability. Because of their size, nonionic surfactants diffuseslowly and, hence, they are not efficient for stabilization of thenewly formed particles formed during nucleation. Nevertheless,once adsorbed, they provide excellent salt, freeze-thaw, and
water resistances. The polymerization of acrylic acid leads tothe in situ formation of additional surfactant. The pH of thedispersions used in this work ranged from 1.5 to 2.2; therefore,the acrylic acid (pKa ) 4.8)21 was protonated and its (co)polymeracted as a nonionic surfactant. In the discussion, the wordsurfactant is used in a broad sense, including the poly(acrylicacid). Table 2 shows that, considering the poly(acrylic acid),the majority of the surfactant was nonionic.
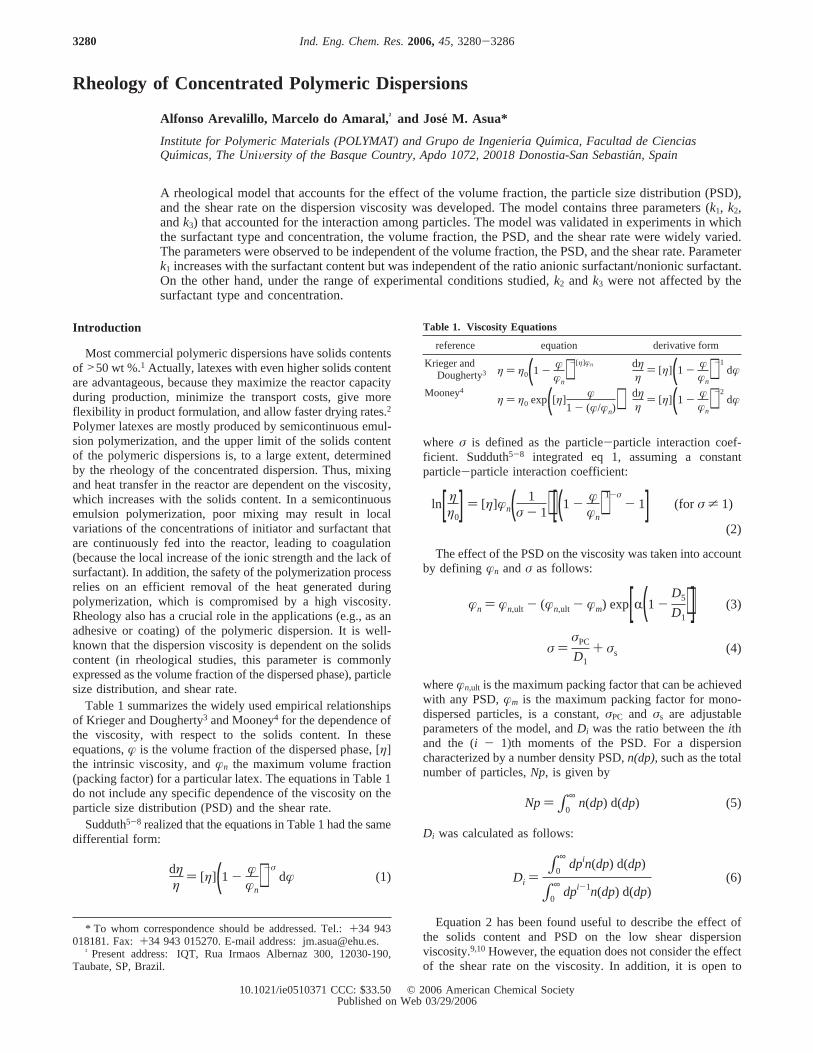
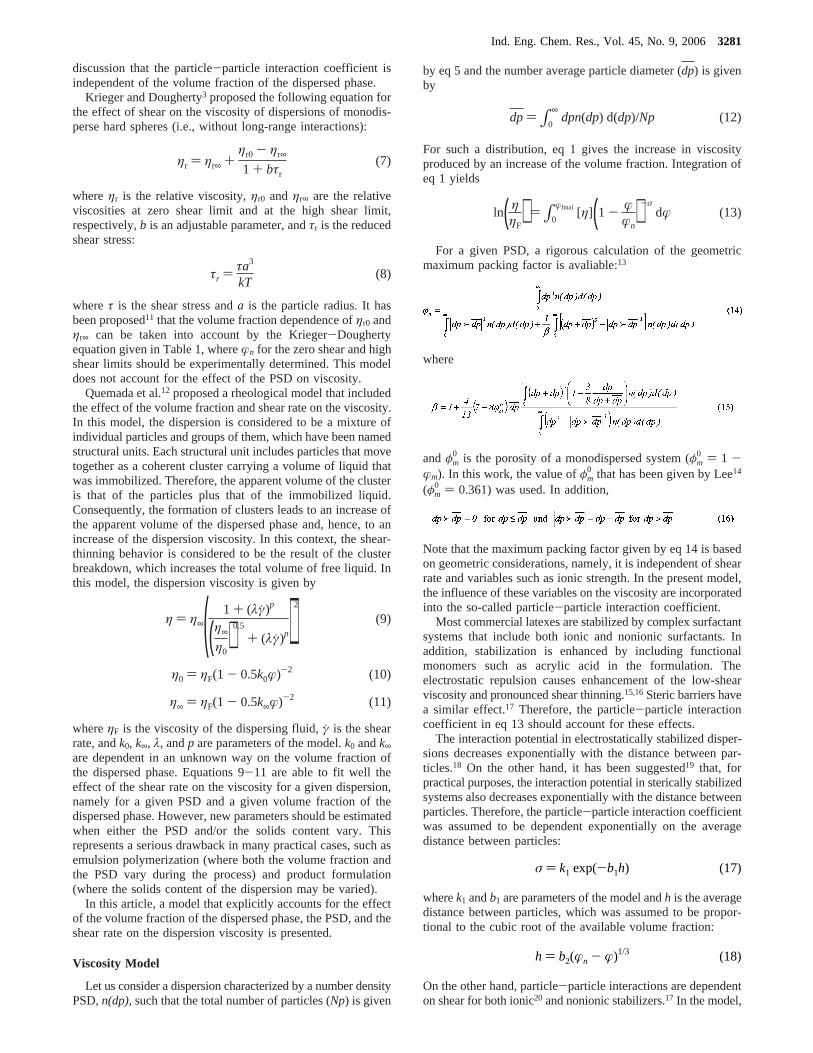
Figures 1-4 present the normalized number (n′(dp)) andweight (w′(dp)) PSDs of these dispersions, as measured bycapillary hydrodynamic fractionation. The normalizations wereas follows:
Latex L1 was a relatively monomodal dispersion. Latex L2had a bimodal PSD (more apparent in the weight PSD), whichwas stabilized with a total amount of surfactant greater thanthat for Latex L1. However, because of the small particle size,the overall surface concentration of surfactant in Latex L2 wassmaller than that in Latex L1. Latexes L3 and L4 contained asimilar amount of surfactants per gram of polymer; however,because of the different PSDs, the surface concentration of
Table 2. Polymeric Dispersions
Stabilizing Systema
dispersionsolids content
(wt %)volume fraction of
the dispersed phase %wt % based on
monomerg/m2 of
particle surfacespecific surface(m2/L(latex))
L1 0.60 0.581 A: 0.23 A: 0.99× 10⁻⁴ 13200B: 0.98 B: 4.3× 10⁻⁴
C: 2.0 C: 8.7× 10⁻⁴
L2 0.66 0.632 A: 1.15 A: 2.1× 10⁻⁴ 35100B: 0.36 B: 0.64× 10⁻⁴
C: 2.0 C: 3.6× 10⁻⁴
L3 0.64 0.617 A: 0.43 A: 3.1× 10⁻⁴ 8986B: 0.14 B: 1.0× 10⁻⁴
C: 2.0 C: 1.4× 10⁻³
L4 0.68 0.649 A: 0.45 A: 4.2× 10⁻⁴ 7120B: 0.18 B: 1.7× 10⁻⁴
C: 2.0 C: 1.9× 10⁻³
a A ) Dowfax 2A1, B ) Disponil A306, and C) acrylic acid.
Figure 1. Number and weight particle size distributions (PSDs) ofdispersion L1.
n′(dp) )n(dp)
∫0
∞n(dp) d(dp)
(22)
w′(dp) )dp3n(dp)
∫0
∞dp3n(dp) d(dp)
(23)
b1 ) b3γk3 (19)
σ ) k1 exp[-k2(æn - æ)1/3γk3] (20)
k2 ) b2b3 (21)
3282 Ind. Eng. Chem. Res., Vol. 45, No. 9, 2006
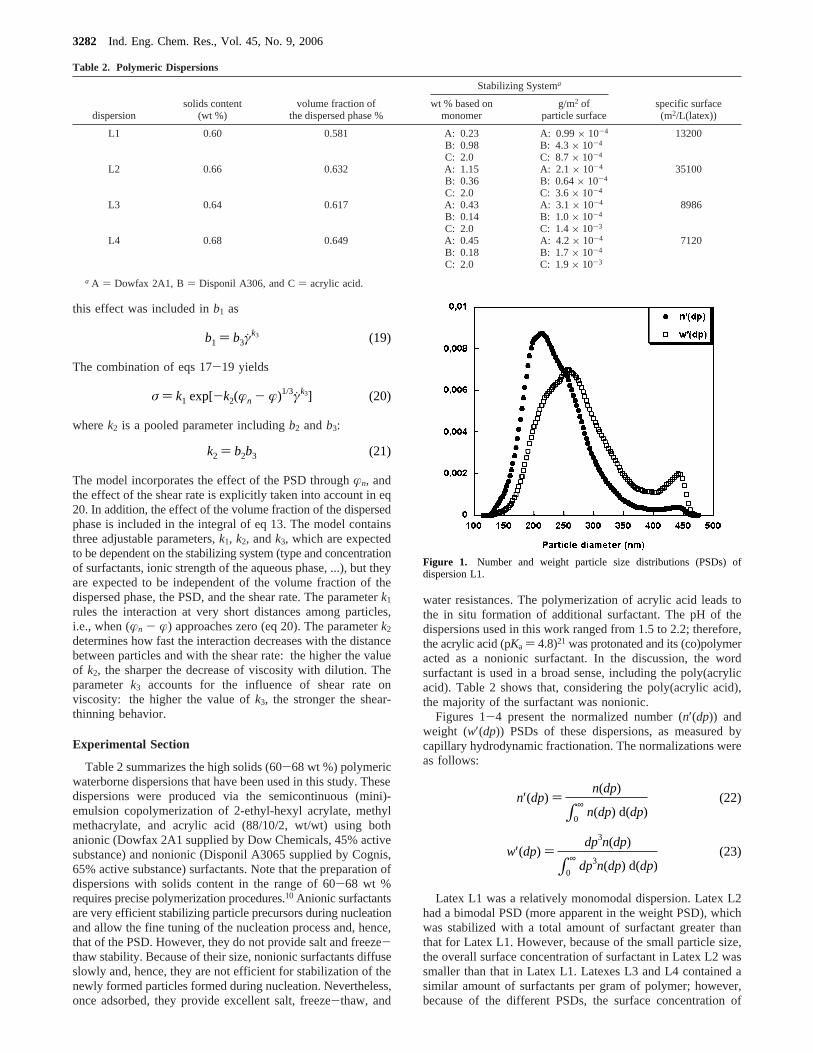
surfactants was different, with that of Latex L4 (the one withthe larger particle size) being higher.
To have several solids contents, the original high-solids-content latexes were diluted with water. This caused a modifica-tion on the surface concentration of surfactant, because somesurfactant moved into the aqueous phase. Nevertheless, this wasnot significant, because the dilution was not substantial (thelowest solids content was 43 wt %).
The viscosity of the latexes was obtained with a controlledstress rheometer that had been fitted with concentric cylinders(Haake model VT500). Measurements of the rheology ofconcentrated dispersions were performed with an MV-1 sensor.On the other hand, the NV sensor was used to determine theviscosity of the dilute dispersions. An SV sensor was used tomeasure Latex L4*. All the tests were conducted at a controlledtemperature of 25°C and in three steps. First, the rheometerwas allowed to reach the desired temperature for the experiment.The latex then was kept at the desired temperature for 2 min;and, finally, the shear rate was progressively increased to thepredetermined maximum value.
Assessment of the Model
The parameters of the model were expected to be independentof the volume fraction of the dispersed phase, the PSD, and theshear rate, although they might be dependent on the surfactantsystem. Therefore, for each latex, the parametersk1, k2, andk3
were estimated from experiments in whichæ andγ were variedby minimizing the following objective function by means ofthe direct search algorithm of Nelder and Mead22 (SubroutineDBCPOL of the IMSL Fortran library):
whereηexp is the measured viscosity andηcal is the viscositycalculated with the model (eqs 13-21).
Preliminary estimations showed that, for each latex, theestimated values ofk2 were similar to 1.55× 10⁻² and thoseof k3 were similar to 0.5. Therefore, it was decided to maintaink2 ) 1.55× 10⁻² andk3 ) 0.5 and to estimate onlyk1.
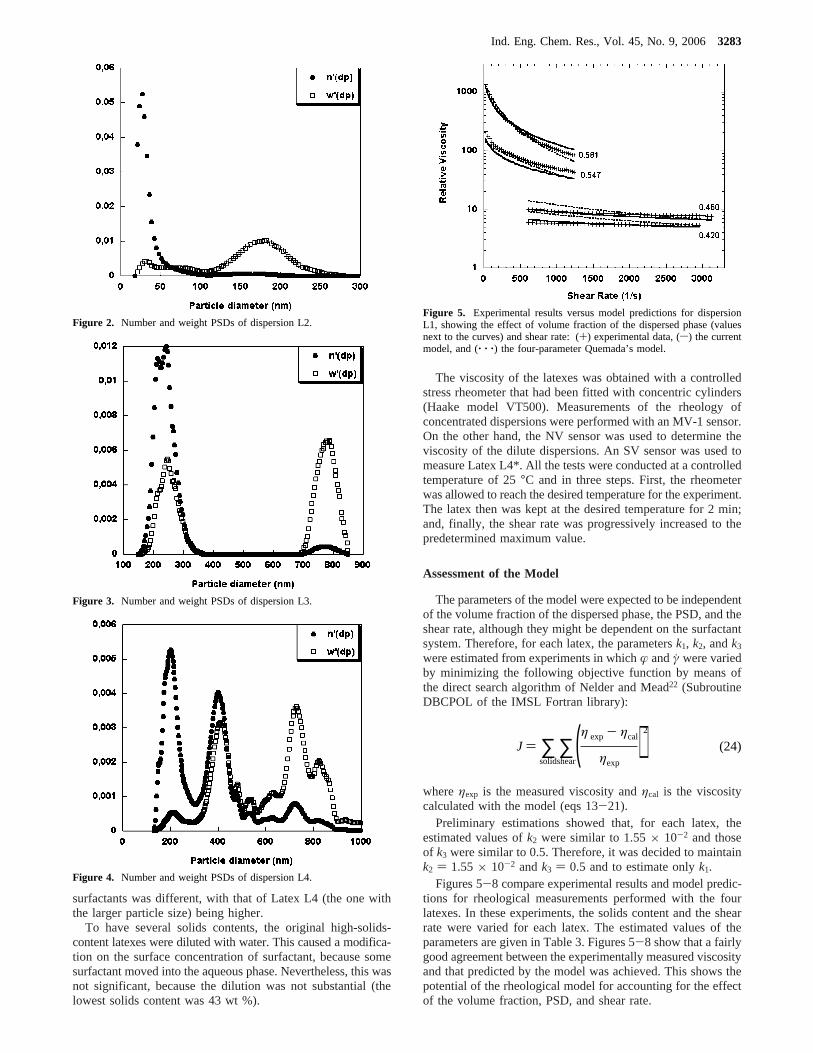
Figures 5-8 compare experimental results and model predic-tions for rheological measurements performed with the fourlatexes. In these experiments, the solids content and the shearrate were varied for each latex. The estimated values of theparameters are given in Table 3. Figures 5-8 show that a fairlygood agreement between the experimentally measured viscosityand that predicted by the model was achieved. This shows thepotential of the rheological model for accounting for the effectof the volume fraction, PSD, and shear rate.
Figure 2. Number and weight PSDs of dispersion L2.
Figure 3. Number and weight PSDs of dispersion L3.
Figure 4. Number and weight PSDs of dispersion L4.
Figure 5. Experimental results versus model predictions for dispersionL1, showing the effect of volume fraction of the dispersed phase (valuesnext to the curves) and shear rate: (+) experimental data, (s) the currentmodel, and (‚ ‚ ‚) the four-parameter Quemada’s model.
J ) ∑solid
∑shear
(η exp - ηcal
ηexp)2
(24)
Ind. Eng. Chem. Res., Vol. 45, No. 9, 20063283
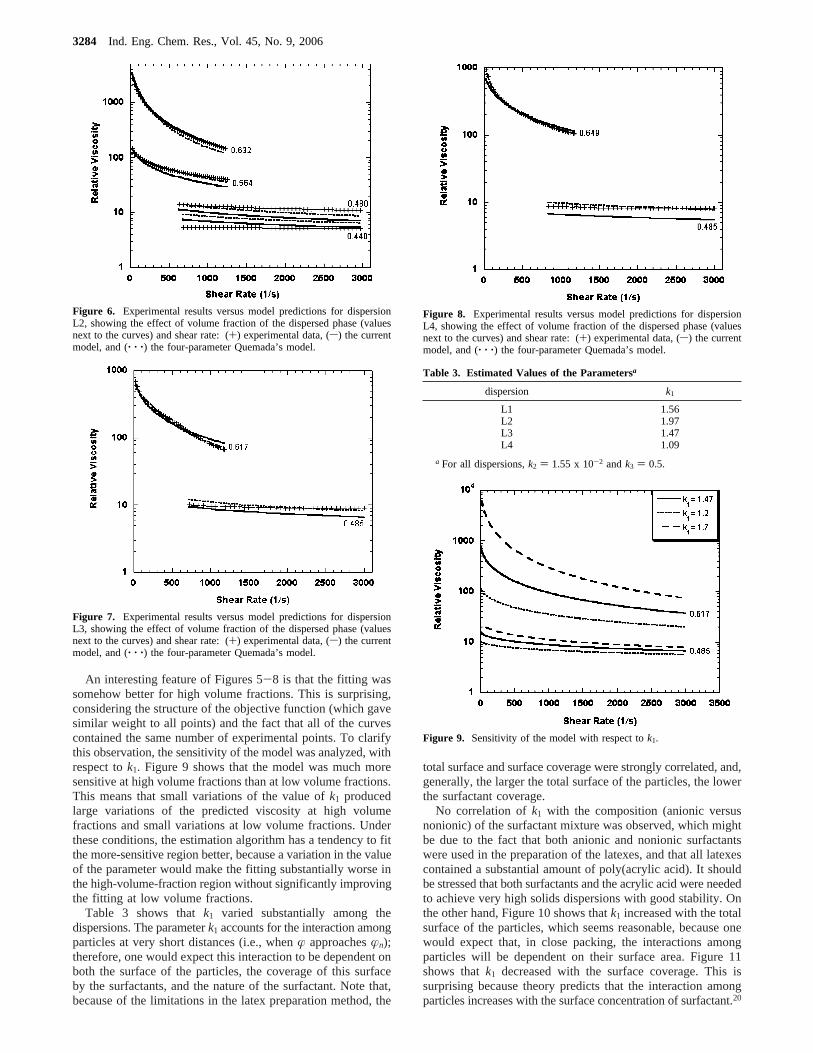
An interesting feature of Figures 5-8 is that the fitting wassomehow better for high volume fractions. This is surprising,considering the structure of the objective function (which gavesimilar weight to all points) and the fact that all of the curvescontained the same number of experimental points. To clarifythis observation, the sensitivity of the model was analyzed, withrespect tok1. Figure 9 shows that the model was much moresensitive at high volume fractions than at low volume fractions.This means that small variations of the value ofk1 producedlarge variations of the predicted viscosity at high volumefractions and small variations at low volume fractions. Underthese conditions, the estimation algorithm has a tendency to fitthe more-sensitive region better, because a variation in the valueof the parameter would make the fitting substantially worse inthe high-volume-fraction region without significantly improvingthe fitting at low volume fractions.
Table 3 shows thatk1 varied substantially among thedispersions. The parameterk1 accounts for the interaction amongparticles at very short distances (i.e., whenæ approachesæn);therefore, one would expect this interaction to be dependent onboth the surface of the particles, the coverage of this surfaceby the surfactants, and the nature of the surfactant. Note that,because of the limitations in the latex preparation method, the
total surface and surface coverage were strongly correlated, and,generally, the larger the total surface of the particles, the lowerthe surfactant coverage.
No correlation ofk1 with the composition (anionic versusnonionic) of the surfactant mixture was observed, which mightbe due to the fact that both anionic and nonionic surfactantswere used in the preparation of the latexes, and that all latexescontained a substantial amount of poly(acrylic acid). It shouldbe stressed that both surfactants and the acrylic acid were neededto achieve very high solids dispersions with good stability. Onthe other hand, Figure 10 shows thatk1 increased with the totalsurface of the particles, which seems reasonable, because onewould expect that, in close packing, the interactions amongparticles will be dependent on their surface area. Figure 11shows thatk1 decreased with the surface coverage. This issurprising because theory predicts that the interaction amongparticles increases with the surface concentration of surfactant.20
Figure 6. Experimental results versus model predictions for dispersionL2, showing the effect of volume fraction of the dispersed phase (valuesnext to the curves) and shear rate: (+) experimental data, (s) the currentmodel, and (‚ ‚ ‚) the four-parameter Quemada’s model.
Figure 7. Experimental results versus model predictions for dispersionL3, showing the effect of volume fraction of the dispersed phase (valuesnext to the curves) and shear rate: (+) experimental data, (s) the currentmodel, and (‚ ‚ ‚) the four-parameter Quemada’s model.
Figure 8. Experimental results versus model predictions for dispersionL4, showing the effect of volume fraction of the dispersed phase (valuesnext to the curves) and shear rate: (+) experimental data, (s) the currentmodel, and (‚ ‚ ‚) the four-parameter Quemada’s model.
Table 3. Estimated Values of the Parametersa
dispersion k1
L1 1.56L2 1.97L3 1.47L4 1.09
a For all dispersions,k2 ) 1.55 x 10⁻² andk3 ) 0.5.
Figure 9. Sensitivity of the model with respect tok1.
3284 Ind. Eng. Chem. Res., Vol. 45, No. 9, 2006
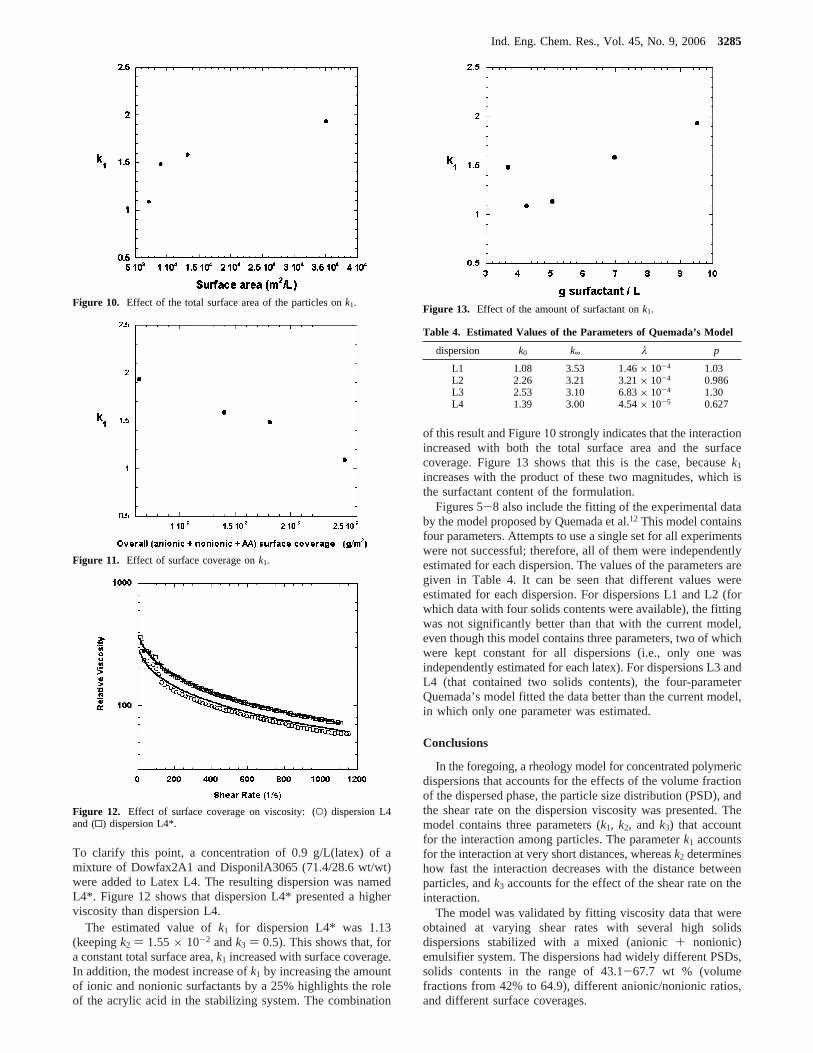
To clarify this point, a concentration of 0.9 g/L(latex) of amixture of Dowfax2A1 and DisponilA3065 (71.4/28.6 wt/wt)were added to Latex L4. The resulting dispersion was namedL4*. Figure 12 shows that dispersion L4* presented a higherviscosity than dispersion L4.
The estimated value ofk1 for dispersion L4* was 1.13(keepingk2 ) 1.55× 10⁻² andk3 ) 0.5). This shows that, fora constant total surface area,k1 increased with surface coverage.In addition, the modest increase ofk1 by increasing the amountof ionic and nonionic surfactants by a 25% highlights the roleof the acrylic acid in the stabilizing system. The combination
of this result and Figure 10 strongly indicates that the interactionincreased with both the total surface area and the surfacecoverage. Figure 13 shows that this is the case, becausek1
increases with the product of these two magnitudes, which isthe surfactant content of the formulation.
Figures 5-8 also include the fitting of the experimental databy the model proposed by Quemada et al.12 This model containsfour parameters. Attempts to use a single set for all experimentswere not successful; therefore, all of them were independentlyestimated for each dispersion. The values of the parameters aregiven in Table 4. It can be seen that different values wereestimated for each dispersion. For dispersions L1 and L2 (forwhich data with four solids contents were available), the fittingwas not significantly better than that with the current model,even though this model contains three parameters, two of whichwere kept constant for all dispersions (i.e., only one wasindependently estimated for each latex). For dispersions L3 andL4 (that contained two solids contents), the four-parameterQuemada’s model fitted the data better than the current model,in which only one parameter was estimated.
Conclusions
In the foregoing, a rheology model for concentrated polymericdispersions that accounts for the effects of the volume fractionof the dispersed phase, the particle size distribution (PSD), andthe shear rate on the dispersion viscosity was presented. Themodel contains three parameters (k1, k2, andk3) that accountfor the interaction among particles. The parameterk1 accountsfor the interaction at very short distances, whereask2 determineshow fast the interaction decreases with the distance betweenparticles, andk3 accounts for the effect of the shear rate on theinteraction.
The model was validated by fitting viscosity data that wereobtained at varying shear rates with several high solidsdispersions stabilized with a mixed (anionic+ nonionic)emulsifier system. The dispersions had widely different PSDs,solids contents in the range of 43.1-67.7 wt % (volumefractions from 42% to 64.9), different anionic/nonionic ratios,and different surface coverages.
Figure 10. Effect of the total surface area of the particles onk1.
Figure 11. Effect of surface coverage onk1.
Figure 12. Effect of surface coverage on viscosity: (O) dispersion L4and (0) dispersion L4*.
Figure 13. Effect of the amount of surfactant onk1.
Table 4. Estimated Values of the Parameters of Quemada’s Model
dispersion k0 k∞ λ p
L1 1.08 3.53 1.46× 10⁻⁴ 1.03L2 2.26 3.21 3.21× 10⁻⁴ 0.986L3 2.53 3.10 6.83× 10⁻⁴ 1.30L4 1.39 3.00 4.54× 10⁻⁵ 0.627
Ind. Eng. Chem. Res., Vol. 45, No. 9, 20063285
The model was able to fit well all the data, which shows itspotential for accounting for the effect of the volume fraction ofthe dispersed phase, the PSD, and the shear rate on viscosity.It was determined that the parameters were independent of thevolume fraction, the PSD, and the shear rate. The parameterk1
increased with the overall surfactant content of the dispersions,which led to a higher total surface area of the particles, whereasit was not affected by the ionic/nonionic ratio. On the otherhand, under the range of experimental conditions studied,k2
andk3 were not affected by the surfactant type and concentra-tion.
Acknowledgment
The authors acknowledge the financial support from theDiputacion Foral de Guipuzkoa and the University of the BasqueCountry. A.A. acknowledges a fellowship from the BasqueGovernment.
Literature Cited
(1) Urban, D., Takamura, K., Eds.Polymer Dispersions and TheirIndustrial Applications; Wiley-VCH: Weinheim, Germany, 2002.
(2) Guyot, A.; Chu, F.; Schneider, M.; Graillat, C.; McKenna, T. F.High solid content latexes.Prog. Polym. Sci.2003, 27, 1573.
(3) Krieger, I. M.; Dougherty, T. J. A mechanism for non-Newtonianflow in suspensions of rigid spheres.Trans. Soc. Rheol.1959, 3, 137.
(4) Mooney, M. The viscosity of a concentrated suspension of sphericalparticles.J. Colloid Sci. 1951, 6, 162.
(5) Sudduth, R. D. A generalized model to predict the viscosity ofsolutions with suspended particles. I.J. Appl. Polym. Sci.1993, 48, 25.
(6) Sudduth, R. D. A new method to predict the maximum packingfraction and the viscosity of solutions with a size distribrution of suspendedparticles. II.J. Appl. Polym. Sci.1993, 48, 37.
(7) Sudduth, R. D. A generalized model to predict the viscosity ofsolutions with suspended particles. III. Effects of particle interaction andparticle size distribution.J. Appl. Polym. Sci.1993, 50, 123.
(8) Sudduth, R. D. A generalized model to predict the viscosity ofsolutions with suspended particles. IV. Determination of optimum particle-by-particle volume fractions.J. Appl. Polym. Sci.1994, 52, 985.
(9) do Amaral, M.; van Es, S.; Asua, J. M. Effect of the particle sizedistribution on the low shear viscosity of high-solid-content latexes.J.Polym. Sci., Part A: Polym. Chem.2004, 42, 3936.
(10) do Amaral, M.; van Es, S.; Asua, J. M. Development of a coupledviscosity-polymerization model for the sintesis of high solids-low viscositylatexes.Macromol. Theor. Simul.2004, 13, 107.
(11) Krieger, I. M. Rheology of monodisperse lattices.AdV. ColloidInterface Sci. 1972, 3, 111.
(12) Quemada, D.; Flaud, P.; Jezequel, P. H. Rheological properties andflow of concentrated dispersed media. I.sModelling of steady and nonsteadybehavior.Chem. Eng. Commun.1985, 32, 61.
(13) Ouchiyama, N.; Tanaka, T. Porosity estimation for random packingof spherical particles.Ind. Eng. Chem. Fundam.1984, 23, 490.
(14) Lee, D. I. Packing of spheres and its effect on the viscosity ofsuspensions.J. Paint Technol.1970, 42, 579.
(15) Krieger, I. M.; Eguiluz, M. The second electroviscous effect inpolymer latexes.Trans. Soc. Rheol.1976, 20, 29.
(16) Buscall, R.; Goodwin, J. W.; Hawkins, M. W.; Ottewill, R. H.Viscoelactic properties of concentrated latexes. Part 1. Methods of examina-tion. J. Chem. Soc., Faraday Trans. 11982, 78, 2873.
(17) Mewis, J.; Frith, W. J.; Strivens, T. A.; Russel, W. B. The rheologyof suspensions containing polymerically stabilized particles.AIChE J. 1989,35, 415.
(18) Hunter, R.Foundations of Colloid Science; Clarendon Press:Oxford, U.K., 1992; Vol. 1, Chapter 7.
(19) Israelachvili, J.Intermolecular and Surface Forces, 3rd Edition;Academic Press: London, 1997.
(20) Buscall, R. Effect of long-range repulsive forces on the viscosityof concentrated lattices: Comparison of experimental data with an effectivehard-sphere model.J. Chem. Soc., Faraday Trans.1991, 87, 1365.
(21) Slawinski, M.Strategic Aspects of the Incorporation of Acrylic Acidin Emulsion Polymers; Universiteitsdrukkerij Technische Universiteit Eind-hoven: Eindhoven, The Netherlands, 1999.
(22) Nelder, J. A.; Mead, R. A simplex method for function minimiza-tion. Comput. J.1965, 7, 308.
ReceiVed for reView September 15, 2005ReVised manuscript receiVed January 30, 2006
AcceptedMarch 8, 2006
IE0510371
3286 Ind. Eng. Chem. Res., Vol. 45, No. 9, 2006