revised 6/30/2015 california sea lion (zalophus ... 6/30/2015 california sea lion (zalophus...
TRANSCRIPT
Revised 6/30/2015
CALIFORNIA SEA LION (Zalophus californianus): U.S. Stock
STOCK DEFINITION AND GEOGRAPHIC RANGE
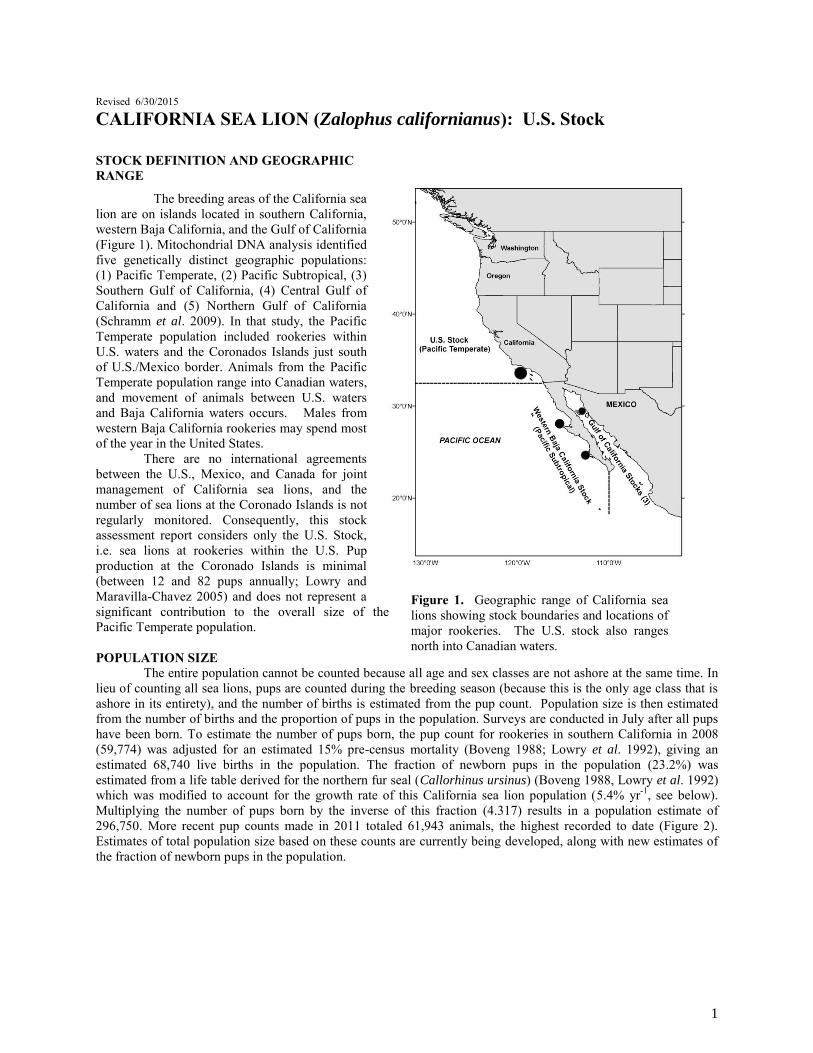
The breeding areas of the California sea lion are on islands located in southern California, western Baja California, and the Gulf of California (Figure 1). Mitochondrial DNA analysis identified five genetically distinct geographic populations: (1) Pacific Temperate, (2) Pacific Subtropical, (3) Southern Gulf of California, (4) Central Gulf of California and (5) Northern Gulf of California (Schramm et al. 2009). In that study, the Pacific Temperate population included rookeries within U.S. waters and the Coronados Islands just south of U.S./Mexico border. Animals from the Pacific Temperate population range into Canadian waters, and movement of animals between U.S. waters and Baja California waters occurs. Males from western Baja California rookeries may spend most of the year in the United States.
There are no international agreements between the U.S., Mexico, and Canada for joint management of California sea lions, and the number of sea lions at the Coronado Islands is not regularly monitored. Consequently, this stock assessment report considers only the U.S. Stock, i.e. sea lions at rookeries within the U.S. Pup production at the Coronado Islands is minimal (between 12 and 82 pups annually; Lowry and Maravilla-Chavez 2005) and does not represent a significant contribution to the overall size of the Pacific Temperate population. POPULATION SIZE The entire population cannot be counted because all age and sex classes are not ashore at the same time. In lieu of counting all sea lions, pups are counted during the breeding season (because this is the only age class that is ashore in its entirety), and the number of births is estimated from the pup count. Population size is then estimated from the number of births and the proportion of pups in the population. Surveys are conducted in July after all pups have been born. To estimate the number of pups born, the pup count for rookeries in southern California in 2008 (59,774) was adjusted for an estimated 15% pre-census mortality (Boveng 1988; Lowry et al. 1992), giving an estimated 68,740 live births in the population. The fraction of newborn pups in the population (23.2%) was estimated from a life table derived for the northern fur seal (Callorhinus ursinus) (Boveng 1988, Lowry et al. 1992) which was modified to account for the growth rate of this California sea lion population (5.4% yr-1, see below). Multiplying the number of pups born by the inverse of this fraction (4.317) results in a population estimate of 296,750. More recent pup counts made in 2011 totaled 61,943 animals, the highest recorded to date (Figure 2). Estimates of total population size based on these counts are currently being developed, along with new estimates of the fraction of newborn pups in the population.
Figure 1. Geographic range of California sea lions showing stock boundaries and locations of major rookeries. The U.S. stock also ranges north into Canadian waters.
1
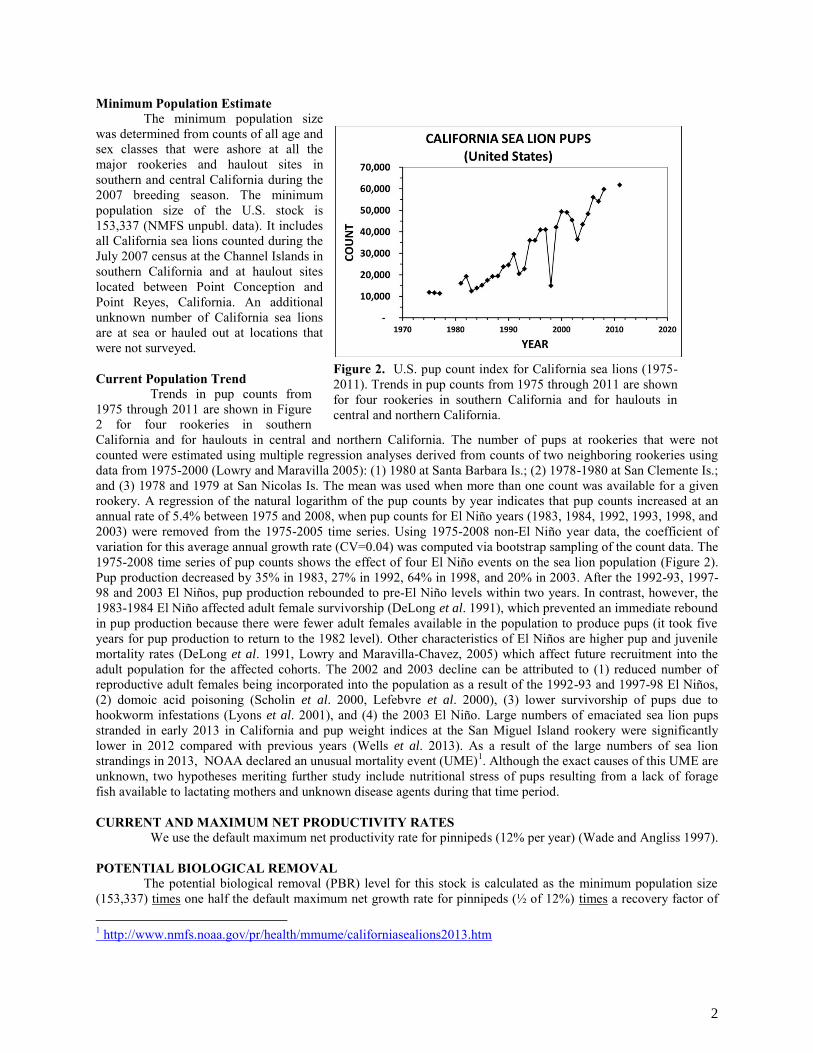
Minimum Population Estimate The minimum population size was determined from counts of all age and sex classes that were ashore at all the major rookeries and haulout sites in southern and central California during the 2007 breeding season. The minimum population size of the U.S. stock is 153,337 (NMFS unpubl. data). It includes all California sea lions counted during the July 2007 census at the Channel Islands in southern California and at haulout sites located between Point Conception and Point Reyes, California. An additional unknown number of California sea lions are at sea or hauled out at locations that were not surveyed. Current Population Trend Trends in pup counts from 1975 through 2011 are shown in Figure 2 for four rookeries in southern California and for haulouts in central and northern California. The number of pups at rookeries that were not counted were estimated using multiple regression analyses derived from counts of two neighboring rookeries using data from 1975-2000 (Lowry and Maravilla 2005): (1) 1980 at Santa Barbara Is.; (2) 1978-1980 at San Clemente Is.; and (3) 1978 and 1979 at San Nicolas Is. The mean was used when more than one count was available for a given rookery. A regression of the natural logarithm of the pup counts by year indicates that pup counts increased at an annual rate of 5.4% between 1975 and 2008, when pup counts for El Niño years (1983, 1984, 1992, 1993, 1998, and 2003) were removed from the 1975-2005 time series. Using 1975-2008 non-El Niño year data, the coefficient of variation for this average annual growth rate (CV=0.04) was computed via bootstrap sampling of the count data. The 1975-2008 time series of pup counts shows the effect of four El Niño events on the sea lion population (Figure 2). Pup production decreased by 35% in 1983, 27% in 1992, 64% in 1998, and 20% in 2003. After the 1992-93, 1997-98 and 2003 El Niños, pup production rebounded to pre-El Niño levels within two years. In contrast, however, the 1983-1984 El Niño affected adult female survivorship (DeLong et al. 1991), which prevented an immediate rebound in pup production because there were fewer adult females available in the population to produce pups (it took five years for pup production to return to the 1982 level). Other characteristics of El Niños are higher pup and juvenile mortality rates (DeLong et al. 1991, Lowry and Maravilla-Chavez, 2005) which affect future recruitment into the adult population for the affected cohorts. The 2002 and 2003 decline can be attributed to (1) reduced number of reproductive adult females being incorporated into the population as a result of the 1992-93 and 1997-98 El Niños, (2) domoic acid poisoning (Scholin et al. 2000, Lefebvre et al. 2000), (3) lower survivorship of pups due to hookworm infestations (Lyons et al. 2001), and (4) the 2003 El Niño. Large numbers of emaciated sea lion pups stranded in early 2013 in California and pup weight indices at the San Miguel Island rookery were significantly lower in 2012 compared with previous years (Wells et al. 2013). As a result of the large numbers of sea lion strandings in 2013, NOAA declared an unusual mortality event (UME)1. Although the exact causes of this UME are unknown, two hypotheses meriting further study include nutritional stress of pups resulting from a lack of forage fish available to lactating mothers and unknown disease agents during that time period. CURRENT AND MAXIMUM NET PRODUCTIVITY RATES We use the default maximum net productivity rate for pinnipeds (12% per year) (Wade and Angliss 1997). POTENTIAL BIOLOGICAL REMOVAL The potential biological removal (PBR) level for this stock is calculated as the minimum population size (153,337) times one half the default maximum net growth rate for pinnipeds (½ of 12%) times a recovery factor of 1 http://www.nmfs.noaa.gov/pr/health/mmume/californiasealions2013.htm
Figure 2. U.S. pup count index for California sea lions (1975-2011). Trends in pup counts from 1975 through 2011 are shown for four rookeries in southern California and for haulouts in central and northern California.
2
1.0 (for a stock of unknown status that is growing, Wade and Angliss 1997); resulting in a PBR of 9,200 sea lions per year. HUMAN-CAUSED MORTALITY AND SERIOUS INJURY Serious Injury Guidelines NMFS uses guidance from previous serious injury workshops, expert opinion, and analysis of historic injury cases to distinguish serious from non-serious injury (Angliss and DeMaster 1998, Andersen et al. 2008, NOAA 2012). NMFS defines serious injury as an “injury that is more likely than not to result in mortality”. Historical Depletion Historic exploitation of California sea lions include harvest for food by native Californians in the Channel Islands 4,000-5,000 years ago (Stewart et al. 1993) and for oil and hides in the mid-1800s (Scammon 1874). More recent exploitation of sea lions for pet food, target practice, bounty, trimmings, hides, reduction of fishery depredation, and sport are reviewed in Helling (1984), Cass (1985), Seagers et al. (1985), and Howorth (1993). There are few historical records to document the effects of such exploitation on sea lion abundance (Lowry et al. 1992). Fisheries Information California sea lions are killed in a variety of trawl, purse seine, and gillnet fisheries along the U.S. west coast (Barlow et al. 1994, Carretta and Barlow 2011, Carretta et al. 2013, Julian and Beeson 1998, Jannot et al. 2011, Stewart and Yochem 1987). Those for which recent observations or estimates of bycatch mortality exist are summarized in Table 1. In addition to bycatch estimates from fishery observer programs, information on fishery-related sea lion deaths and serious injuries comes largely from stranding data (Carretta et al. 2013). Stranding data represent a minimum number of animals killed or injured, as many entanglements are likely unreported or undetected.
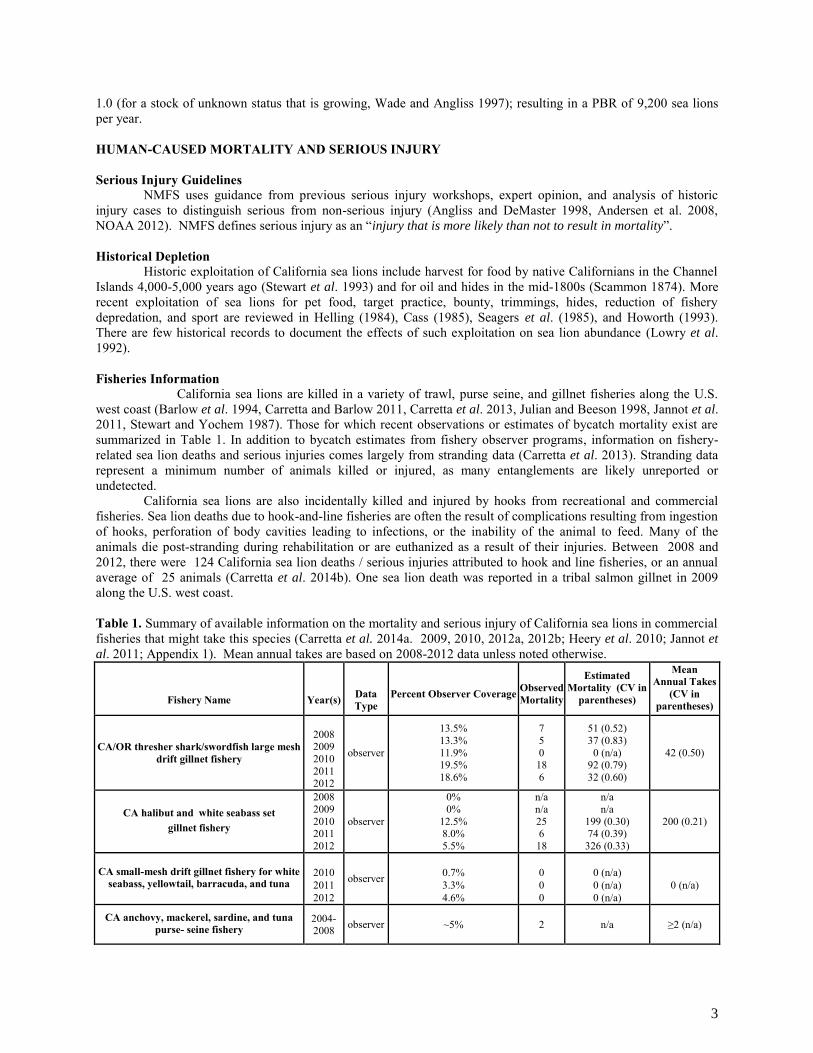
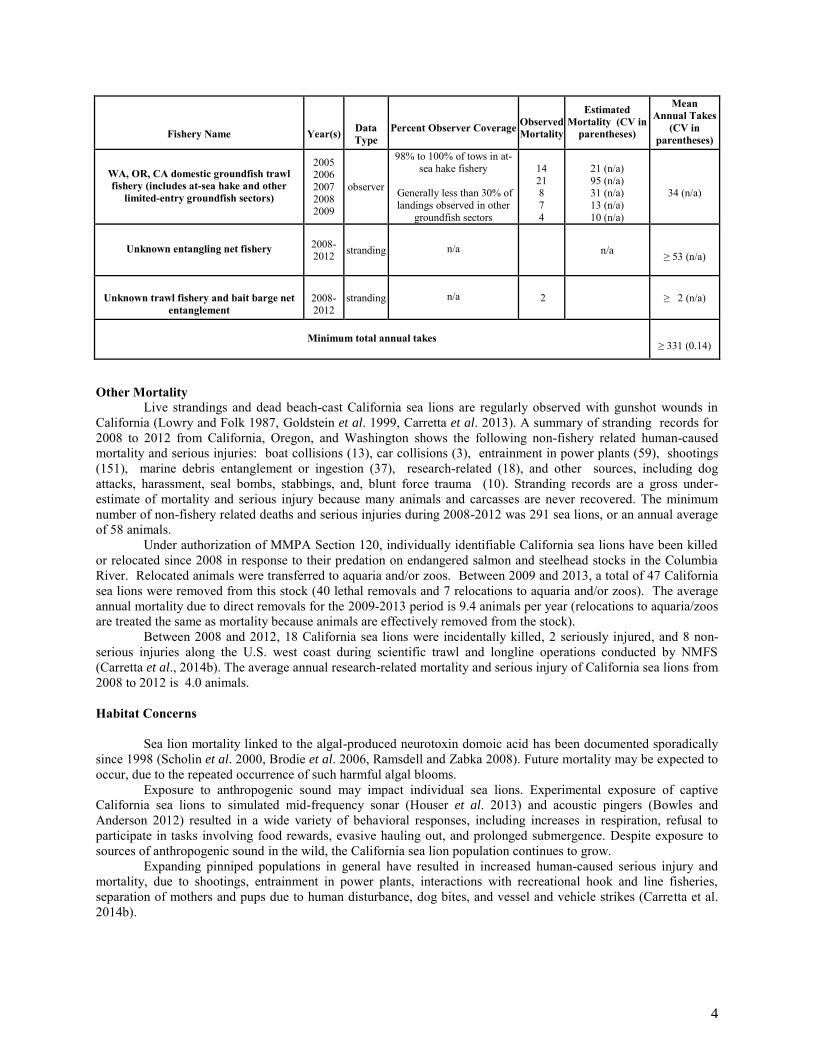
California sea lions are also incidentally killed and injured by hooks from recreational and commercial fisheries. Sea lion deaths due to hook-and-line fisheries are often the result of complications resulting from ingestion of hooks, perforation of body cavities leading to infections, or the inability of the animal to feed. Many of the animals die post-stranding during rehabilitation or are euthanized as a result of their injuries. Between 2008 and 2012, there were 124 California sea lion deaths / serious injuries attributed to hook and line fisheries, or an annual average of 25 animals (Carretta et al. 2014b). One sea lion death was reported in a tribal salmon gillnet in 2009 along the U.S. west coast. Table 1. Summary of available information on the mortality and serious injury of California sea lions in commercial fisheries that might take this species (Carretta et al. 2014a. 2009, 2010, 2012a, 2012b; Heery et al. 2010; Jannot et
al. 2011; Appendix 1). Mean annual takes are based on 2008-2012 data unless noted otherwise.
Fishery Name
Year(s)
Data Type
Percent Observer Coverage
Observed Mortality
Estimated Mortality (CV in
parentheses)
Mean Annual Takes
(CV in parentheses)
CA/OR thresher shark/swordfish large mesh drift gillnet fishery
2008 2009 2010 2011 2012
observer
13.5% 13.3% 11.9% 19.5% 18.6%
7 5 0
18 6
51 (0.52) 37 (0.83)
0 (n/a) 92 (0.79) 32 (0.60)
42 (0.50)
CA halibut and white seabass set gillnet fishery
2008 2009 2010 2011 2012
observer
0% 0%
12.5% 8.0% 5.5%
n/a n/a 25 6
18
n/a n/a
199 (0.30) 74 (0.39)
326 (0.33)
200 (0.21)
CA small-mesh drift gillnet fishery for white seabass, yellowtail, barracuda, and tuna
2010 2011 2012
observer
0.7% 3.3% 4.6%
0 0 0
0 (n/a) 0 (n/a) 0 (n/a)
0 (n/a)
CA anchovy, mackerel, sardine, and tuna purse- seine fishery
2004-2008 observer ~5% 2 n/a ≥2 (n/a)
3
Fishery Name
Year(s)
Data Type
Percent Observer Coverage
Observed Mortality
Estimated Mortality (CV in
parentheses)
Mean Annual Takes
(CV in parentheses)
WA, OR, CA domestic groundfish trawl fishery (includes at-sea hake and other
limited-entry groundfish sectors)
2005 2006 2007 2008 2009
observer
98% to 100% of tows in at-sea hake fishery
Generally less than 30% of landings observed in other
groundfish sectors
14 21 8 7 4
21 (n/a) 95 (n/a) 31 (n/a) 13 (n/a) 10 (n/a)
34 (n/a)
Unknown entangling net fishery
2008-2012
stranding
n/a
n/a ≥ 53 (n/a)
Unknown trawl fishery and bait barge net
entanglement
2008-2012
stranding n/a 2 ≥ 2 (n/a)
Minimum total annual takes ≥ 331 (0.14)
Other Mortality Live strandings and dead beach-cast California sea lions are regularly observed with gunshot wounds in California (Lowry and Folk 1987, Goldstein et al. 1999, Carretta et al. 2013). A summary of stranding records for 2008 to 2012 from California, Oregon, and Washington shows the following non-fishery related human-caused mortality and serious injuries: boat collisions (13), car collisions (3), entrainment in power plants (59), shootings (151), marine debris entanglement or ingestion (37), research-related (18), and other sources, including dog attacks, harassment, seal bombs, stabbings, and, blunt force trauma (10). Stranding records are a gross under-estimate of mortality and serious injury because many animals and carcasses are never recovered. The minimum number of non-fishery related deaths and serious injuries during 2008-2012 was 291 sea lions, or an annual average of 58 animals.
Under authorization of MMPA Section 120, individually identifiable California sea lions have been killed or relocated since 2008 in response to their predation on endangered salmon and steelhead stocks in the Columbia River. Relocated animals were transferred to aquaria and/or zoos. Between 2009 and 2013, a total of 47 California sea lions were removed from this stock (40 lethal removals and 7 relocations to aquaria and/or zoos). The average annual mortality due to direct removals for the 2009-2013 period is 9.4 animals per year (relocations to aquaria/zoos are treated the same as mortality because animals are effectively removed from the stock).
Between 2008 and 2012, 18 California sea lions were incidentally killed, 2 seriously injured, and 8 non-serious injuries along the U.S. west coast during scientific trawl and longline operations conducted by NMFS (Carretta et al., 2014b). The average annual research-related mortality and serious injury of California sea lions from 2008 to 2012 is 4.0 animals. Habitat Concerns
Sea lion mortality linked to the algal-produced neurotoxin domoic acid has been documented sporadically since 1998 (Scholin et al. 2000, Brodie et al. 2006, Ramsdell and Zabka 2008). Future mortality may be expected to occur, due to the repeated occurrence of such harmful algal blooms.
Exposure to anthropogenic sound may impact individual sea lions. Experimental exposure of captive California sea lions to simulated mid-frequency sonar (Houser et al. 2013) and acoustic pingers (Bowles and Anderson 2012) resulted in a wide variety of behavioral responses, including increases in respiration, refusal to participate in tasks involving food rewards, evasive hauling out, and prolonged submergence. Despite exposure to sources of anthropogenic sound in the wild, the California sea lion population continues to grow.
Expanding pinniped populations in general have resulted in increased human-caused serious injury and mortality, due to shootings, entrainment in power plants, interactions with recreational hook and line fisheries, separation of mothers and pups due to human disturbance, dog bites, and vessel and vehicle strikes (Carretta et al. 2014b).
4
STATUS OF STOCK California sea lions in the U.S. are not listed as "endangered" or "threatened" under the Endangered Species
Act or as "depleted" under the MMPA. The optimum sustainable population (OSP) status of this population has not been formally determined. The average annual commercial fishery mortality is 331 animals per year (Table 1). Other sources of human-caused mortality (shootings, direct removals, recreational hook and line fisheries, tribal takes, entrainment in power plant intakes, etc.) average 58 animals per year. Total human-caused mortality of this stock is at least 389 animals per year. California sea lions are not considered "strategic" under the MMPA because total human-caused mortality is less than the PBR (9,200). The total fishery mortality and serious injury rate (389 animals/year) for this stock is less than 10% of the calculated PBR and, therefore, is considered to be insignificant and approaching a zero mortality and serious injury rate. REFERENCES Barlow, J., R. W. Baird, J. E. Heyning, K. Wynne, A. M. Manville II, L. F. Lowry, D. Hanan, J. Sease, and V. N.
Burkanov. 1994. A review of cetacean and pinniped mortality in coastal fisheries along the west coast of the USA and Canada and the east coast of the Russian Federation. Rept. Int. Whaling Comm., Special Issue 15:405-425.
Barlow, J. and G. A. Cameron. 2003. Field experiments show that acoustic pingers reduce marine mammal bycatch in the California drift gillnet fishery. Marine Mammal Science 19(2):265-283.
Bowles, A. E., and R.C. Anderson. 2012. Behavioral responses and habituation of pinnipeds and small cetaceans to novel objects and simulated fishing gear with and without a pinger. Aquatic Mammals, 38(1):161.
Boveng, P. 1988. Status of the California sea lion population on the U.S. west coast. Admin. Rep. LJ-88-07. Southwest Fisheries Science Center, National Marine Fisheries Service, P.O. Box 271, La Jolla, CA 92038. 26 pp.
Brodie, E. C.; Gulland, F. M. D.; Greig, D. J.; Hunter, M.; Jaakola, J.; Leger, J. S.; Leighfield, T.A.; Van Dolah, F. M. 2006. Domoic acid causes reproductive failure in California sea lions (Zalophus californianus). Mar. Mam. Sci., 22(3), 700-707.
Brown, R. F. and S. J. Jeffries. 1993. Preliminary report on estimated marine mammal mortality in Columbia River fall and winter salmon gillnet fisheries, 1991-1992. Columbia River Area Marine Mammal Observer Program, 53 Portway St., Astoria, OR. 13 pp.
Carretta, J.V., L. Enriquez, and Charles Villafana. 2014a. Marine mammal, sea turtle, and seabird bycatch in California gillnet fisheries in 2012. U.S. Dep. Commer., NOAA Tech. Memo. NMFS-SWFSC-526, 16 p.
Carretta, J.V., S.M. Wilkin, M.M. Muto, K. Wilkinson, and J. Rusin. 2014b. Sources of human-related injury and mortality for U.S. Pacific west coast marine mammal stock assessments, 2008-2012. NOAA Technical Memorandum, NOAA-TM-NMFS-SWFSC-533. 110 p.
Carretta, J. V., S. M. Wilkin, M. M. Muto, and K. Wilkinson. 2013. Sources of human-related injury and mortality for U.S. Pacific west coast marine mammal stock assessments, 2007-2011. U.S. Dep. Commer., NOAA Tech. Memo. NMFS-SWFSC-514, 83 p.
Carretta, J.V. and L. Enriquez. 2012a. Marine mammal and seabird bycatch in California gillnet fisheries in 2011. NOAA Technical Memorandum, NOAA-TM-NMFS-SWFSC-500. 14p.
Carretta, J.V. and L. Enriquez. 2012b. Marine mammal and seabird bycatch in California gillnet fisheries in 2010. Administrative Report LJ-12-01. NOAA Fisheries, Southwest Fisheries Science Center, National Marine Fisheries Service, La Jolla, CA 92037. 14 p.Carretta, J.V. and J. Barlow. 2011. Long-term effectiveness, failure rates, and “dinner bell” properties of acoustic pingers in a gillnet fishery. Marine Technology Society Journal 45:7-19.
Carretta, J.V. and L. Enriquez. 2010. Marine mammal and sea turtle bycatch in the California/Oregon swordfish and thresher shark drift gillnet fishery in 2009. Administrative Report LJ-10-03, available from Southwest Fisheries Science Center, 3333 North Torrey Pines Ct., La Jolla, California, 92037. 11p.
Carretta, J.V. and L. Enriquez. 2009. Marine mammal bycatch in the California/Oregon swordfish and thresher shark drift gillnet fishery in 2008. Administrative Report LJ-09-03, available from Southwest Fisheries Science Center, 3333 North Torrey Pines Ct., La Jolla, California, 92037. 10 p.
Carretta, J.V., T. Price, D. Petersen, and R. Read. 2004. Estimates of marine mammal, sea turtle, and seabird
mortality in the California drift gillnet fishery for swordfish and thresher shark, 1996-2002. Marine Fisheries Review 66(2):21-30.
Cass, V.L. 1985. Exploitation of California sea lions, Zalophus californianus, prior to 1972. Marine Fisheries Review 47:36-38.
5
Goldstein, T., S. P. Johnson, A. V. Phillips, K. D. Hanni, D. A. Fauquier, and F. M. D. Gulland. 1999. Human-related injuries observed in live stranded pinnipeds along the central California coast 1986-1998. Aquatic Mammals 25:43-51.
DeLong, R. L., G. A. Antonelis, C. W. Oliver, B. S. Stewart, M. S. Lowry, and P. K. Yochem. 1991. Effects of the 1982-1983 El Niño on several population parameters and diet of California sea lions on the California Channel Islands. In F. Trillmich and K. A. Ono (editors), Pinnipeds and El Niño: Responses to environmental stress. p. 166-172. Springer-Verlag, Berlin Heidelberg New York.
Houser, D.S., S.W. Martin, and J.J. Finneran. 2013. Behavioral responses of California sea lions to mid-frequency (3250 - 3450 Hz) sonar signals. Marine Environmental Research 92:268-278.Helling, H.E. 1984. A follow-up report on available data for California and Stellar sea lion exploitation prior to 1950. Administrative Report LJ-84-45C. National Marine Fisheries Service, Southwest Fisheries Center, La Jolla, CA 92037. 10pp.
Howorth, P.C. 1993. Commercial collection of pinnipeds in the California Channel Islands, 1877-1981. In: Hochberg, F. G. (editor), Third California Islands Symposium: Recent Advances in Research in the California Islands. Santa Barbara, CA, Santa Barbara Museum of Natural History.
Jannot, J., Heery, E., Bellman, M.A., and J. Majewski. 2011. Estimated bycatch of marine mammals, seabirds, and sea turtles in the US west coast commercial groundfish fishery, 2002-2009. West Coast Groundfish Observer Program. National Marine Fisheries Service, NWFSC, 2725 Montlake Blvd E., Seattle, WA 98112.
Julian, F. And M. Beeson. 1998. Estimates for marine mammal, turtle, and seabird mortality for two California gillnet fisheries: 1990-1995. Fish. Bull. 96:271-284.
Lefebvre, K. C. Powell, G. Doucette, J. Silver, P. Miller, P. Hughes, M. Silver, and R. Tjeerdemma. 2000. Domoic acid-producing diatoms: probable cause of neuroexcitotoxicity in California sea lions. Marine Environmental Research 50:485-488.
Lowry, M. S. and R. L. Folk. 1987. Feeding habits of California sea lions from stranded carcasses collected at San Diego County and Santa Catalina Island, California. Admin. Rep. LJ-87-15. Southwest Fisheries Science Center, National Marine Fisheries Service, P.O. Box 271, La Jolla, CA 92038. 33 pp.
Lowry, M. S., P. Boveng, R. J. DeLong, C. W. Oliver, B. S. Stewart, H. DeAnda, and J. Barlow. 1992. Status of the California sea lion (Zalophus californianus californianus) population in 1992. Admin. Rep. LJ-92-32. Southwest Fisheries Science Center, National Marine Fisheries Service, La Jolla, CA 92038. 34 pp.
Lowry, M. S. and O. Maravilla-Chavez. 2005. Recent abundance of California sea lions in western Baja California, Mexico and the United States. In D. K. Garcelon and C. A. Schwemm (editors), Proceedings of the Sixth California Islands Symposium, Ventura, California, December 1-3, 2003. p. 485-497. National Park Service Technical Publication CHIS-05-01, Institute for Wildlife Studies, Arcata, California.
Lyons, E. T., S. R. Melin, R. L. DeLong, A. J. Orr, F. M. Gulland, and S.C. Tolliver. 2001. Current prevalence of adult Uncinaria spp. in northern fur seal (Callorhinus ursinus) and California sea lion (Zalophus
californianus) pups on San Miguel Island, California, with notes on the biology of hookworms. Veterinary Parasitology 97:309-318.
Maldonado, J. E., F. O. Davila, B. S. Stewart, E. Greffen, and R. K Wayne. 1995. Intraspecific genetic differentiation in California sea lions (Zalophus californianus) from southern California and the Gulf of California. Mar. Mamm. Sci. 11(1):46-58.
Ramsdell, J.S. and Zabka T.S. 2008. In Utero Domoic Acid Toxicity: A Fetal Basis to Adult Disease in the California Sea Lion (Zalophus californianus). Marine Drugs. 2008; 6(2):262-290
Scammon, C.M. 1874. The marine mammals of the north-western coast of North America, described and illustrated: Together with an account of the American whale fishery. John H. Carmany and Company, San Francisco, CA. 319p.
Schramm, Y., S.L. Mesnick, J. de la Rosa, D.M. Palacios, M.S. Lowry, D. Aurioles-Gamboa, H.M. Snell, and S.
Escorza-Treviño. 2009. Phylogeography of California and Galapagos sea lions and population structure within the California sea lion. Marine Biology 156:1375-1387.
Seagers, D.J., D.P. DeMaster, and R.L. DeLong. 1985. A survey of historic rookery sites for California and northern sea lions in the Southern California Bight. Administrative Report LJ-85-13, National Marine Fisheries Service, Southwest Fisheries Center, 8604 La Jolla Shores Dr., La Jolla, CA.
Stewart, B. S. and P. K. Yochem. 1987. Entanglement of pinnipeds in synthetic debris and fishing net and line fragments at San Nicolas and San Miguel Islands, California, 1978-1986. Marine Pollution Bulletin 18:336-339.
6
Stewart, B.S., P.K.Yochem, R.L. DeLong, and G.A. Antonelis. 1993. Trends in Abundance and Status of Pinnipeds on the Southern California Channel Islands. In: Hochberg, F. G. (editor), Third California Islands Symposium: Recent Advances in Research in the California Islands. Santa Barbara, CA, Santa Barbara Museum of Natural History. pp 501_516.
Wells, B.K., et al. 2013. State of the California Current 2012-2013: No such thing as an “average” year. CalCOFI Reports Vol. 54:37-71.
7