reviewed condensed group interim financial statements · reviewed condensed group interim financial...
TRANSCRIPT
Reviewed condensed group interim financial statementsfor the six months ended 30 September 2018

Reviewed condensed group interim financial statements | 30 September 2018 1
Contents
Currency of financial statements 1
Approval of the condensed group interim financial statements 2
Independent auditors’ review report on the condensed group interim financial statements to the Minister of Public Enterprises 3
Condensed group statement of financial position 4
Condensed group income statement 5
Condensed group statement of comprehensive income 5
Condensed group statement of changes in equity 6
Condensed group statement of cash flows 7
Selected notes to the condensed group interim financial statements:
Note
1 Structure and activities 8
2 Basis of preparation 8
3 Significant changes in accounting policies 9
4 Critical accounting estimates and judgements 12
5 Segment information 14
6 Issuances, repurchases and repayments of debt securities and borrowings and share capital 14
7 Dividend paid 14
8 Significant events and transactions 15
9 Seasonality of interim results 15
10 Revenue 15
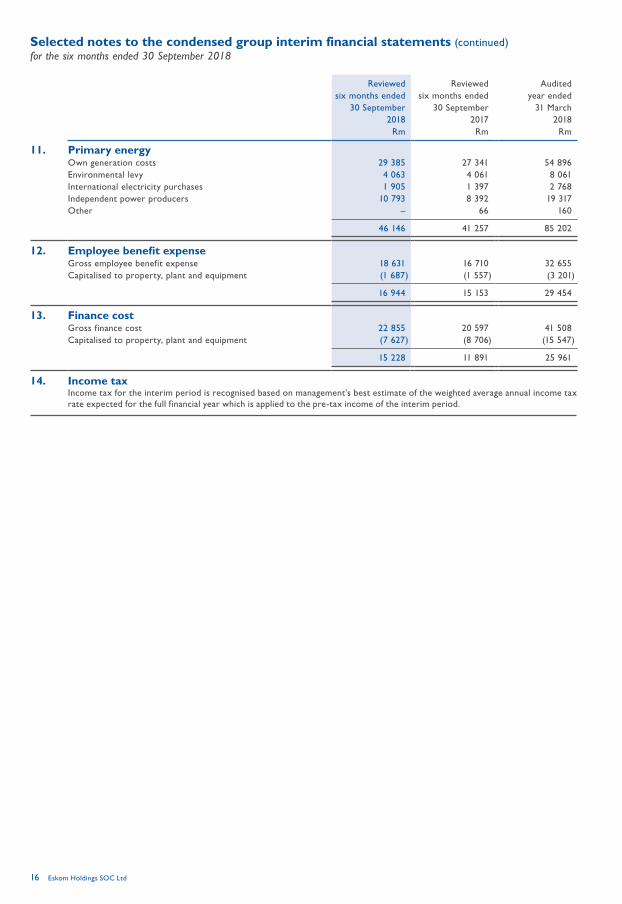
11 Primary energy 16
12 Employee benefit expense 16
13 Finance cost 16
14 Income tax 16
15 Accounting classification and fair value 17
16 Material events subsequent to 30 September 2018 24
17 Reportable irregularities 25
18 New standards and interpretations 27
The reviewed condensed group interim financial statements for the six months ended 30 September 2018 have been prepared under the supervision of the acting chief financial officer (CFO), C Cassim CA(SA). These condensed group interim financial statements have been independently reviewed by the group’s external auditors and were published on 28 November 2018.
Currency of financial statementsThe reviewed condensed group interim financial statements are expressed in South African rand (R).
The following are approximate values of the rand to one unit of the selected currencies:
Average Reporting date mid-spot rate
30 September 31 March 30 September 30 September 31 March 30 September2018 2018 2017 2018 2018 2017
Euro 15.73 15.21 15.02 16.42 14.64 15.95United States dollar (USD) 13.38 13.00 13.19 14.17 11.88 13.52Pound sterling (United Kingdom) 17.78 17.23 17.07 18.45 16.69 18.07Swiss franc 13.59 13.39 13.55 14.51 12.44 13.92Japanese yen 0.12 0.12 0.12 0.12 0.11 0.12
Eskom Holdings SOC Ltd 2
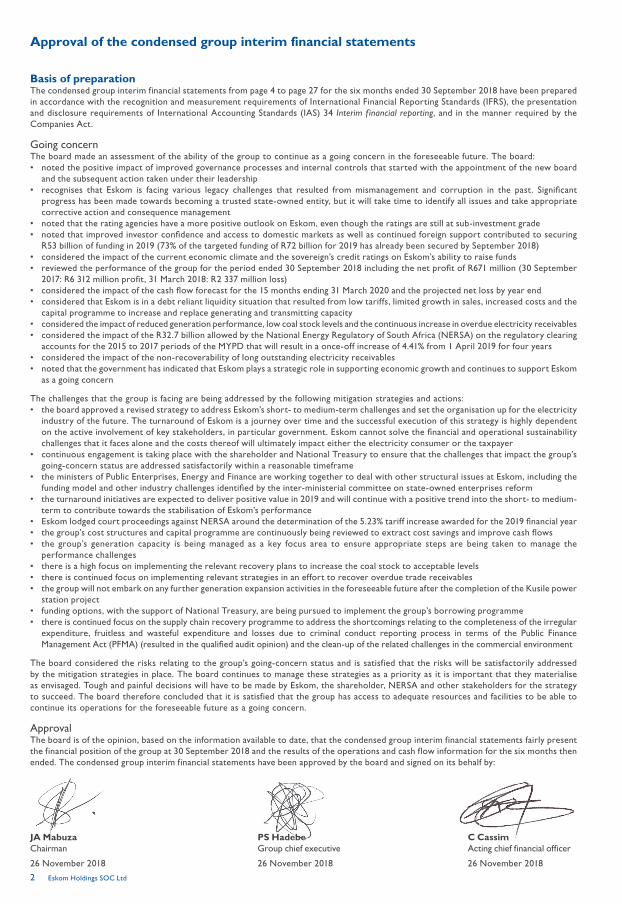
Approval of the condensed group interim financial statements
Basis of preparationThe condensed group interim financial statements from page 4 to page 27 for the six months ended 30 September 2018 have been prepared in accordance with the recognition and measurement requirements of International Financial Reporting Standards (IFRS), the presentation and disclosure requirements of International Accounting Standards (IAS) 34 Interim f inancial reporting, and in the manner required by the Companies Act.
Going concern The board made an assessment of the ability of the group to continue as a going concern in the foreseeable future. The board:• noted the positive impact of improved governance processes and internal controls that started with the appointment of the new board
and the subsequent action taken under their leadership• recognises that Eskom is facing various legacy challenges that resulted from mismanagement and corruption in the past. Significant
progress has been made towards becoming a trusted state-owned entity, but it will take time to identify all issues and take appropriate corrective action and consequence management
• noted that the rating agencies have a more positive outlook on Eskom, even though the ratings are still at sub-investment grade• noted that improved investor confidence and access to domestic markets as well as continued foreign support contributed to securing
R53 billion of funding in 2019 (73% of the targeted funding of R72 billion for 2019 has already been secured by September 2018)• considered the impact of the current economic climate and the sovereign’s credit ratings on Eskom’s ability to raise funds• reviewed the performance of the group for the period ended 30 September 2018 including the net profit of R671 million (30 September
2017: R6 312 million profit, 31 March 2018: R2 337 million loss)• considered the impact of the cash flow forecast for the 15 months ending 31 March 2020 and the projected net loss by year end• considered that Eskom is in a debt reliant liquidity situation that resulted from low tariffs, limited growth in sales, increased costs and the
capital programme to increase and replace generating and transmitting capacity• considered the impact of reduced generation performance, low coal stock levels and the continuous increase in overdue electricity receivables• considered the impact of the R32.7 billion allowed by the National Energy Regulatory of South Africa (NERSA) on the regulatory clearing
accounts for the 2015 to 2017 periods of the MYPD that will result in a once-off increase of 4.41% from 1 April 2019 for four years• considered the impact of the non-recoverability of long outstanding electricity receivables• noted that the government has indicated that Eskom plays a strategic role in supporting economic growth and continues to support Eskom
as a going concern
The challenges that the group is facing are being addressed by the following mitigation strategies and actions:• the board approved a revised strategy to address Eskom’s short- to medium-term challenges and set the organisation up for the electricity
industry of the future. The turnaround of Eskom is a journey over time and the successful execution of this strategy is highly dependent on the active involvement of key stakeholders, in particular government. Eskom cannot solve the financial and operational sustainability challenges that it faces alone and the costs thereof will ultimately impact either the electricity consumer or the taxpayer
• continuous engagement is taking place with the shareholder and National Treasury to ensure that the challenges that impact the group’s going-concern status are addressed satisfactorily within a reasonable timeframe
• the ministers of Public Enterprises, Energy and Finance are working together to deal with other structural issues at Eskom, including the funding model and other industry challenges identified by the inter-ministerial committee on state-owned enterprises reform
• the turnaround initiatives are expected to deliver positive value in 2019 and will continue with a positive trend into the short- to medium-term to contribute towards the stabilisation of Eskom’s performance
• Eskom lodged court proceedings against NERSA around the determination of the 5.23% tariff increase awarded for the 2019 financial year • the group’s cost structures and capital programme are continuously being reviewed to extract cost savings and improve cash flows • the group’s generation capacity is being managed as a key focus area to ensure appropriate steps are being taken to manage the
performance challenges • there is a high focus on implementing the relevant recovery plans to increase the coal stock to acceptable levels• there is continued focus on implementing relevant strategies in an effort to recover overdue trade receivables• the group will not embark on any further generation expansion activities in the foreseeable future after the completion of the Kusile power
station project• funding options, with the support of National Treasury, are being pursued to implement the group’s borrowing programme• there is continued focus on the supply chain recovery programme to address the shortcomings relating to the completeness of the irregular
expenditure, fruitless and wasteful expenditure and losses due to criminal conduct reporting process in terms of the Public Finance Management Act (PFMA) (resulted in the qualified audit opinion) and the clean-up of the related challenges in the commercial environment
The board considered the risks relating to the group’s going-concern status and is satisfied that the risks will be satisfactorily addressed by the mitigation strategies in place. The board continues to manage these strategies as a priority as it is important that they materialise as envisaged. Tough and painful decisions will have to be made by Eskom, the shareholder, NERSA and other stakeholders for the strategy to succeed. The board therefore concluded that it is satisfied that the group has access to adequate resources and facilities to be able to continue its operations for the foreseeable future as a going concern.
ApprovalThe board is of the opinion, based on the information available to date, that the condensed group interim financial statements fairly present the financial position of the group at 30 September 2018 and the results of the operations and cash flow information for the six months then ended. The condensed group interim financial statements have been approved by the board and signed on its behalf by:
JA Mabuza PS Hadebe C CassimChairman Group chief executive Acting chief financial officer
26 November 2018 26 November 2018 26 November 2018
Reviewed condensed group interim financial statements | 30 September 2018 3
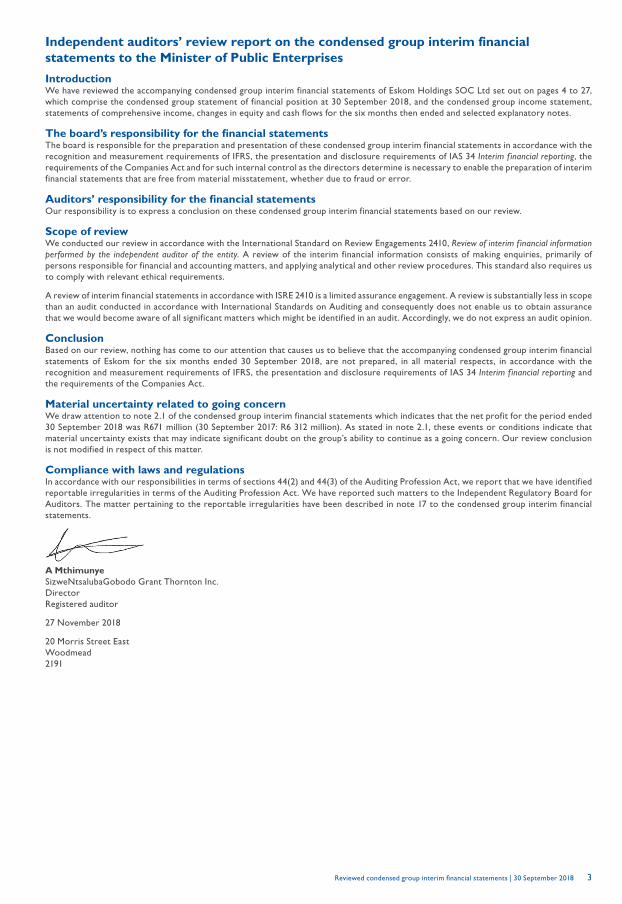
Independent auditors’ review report on the condensed group interim financial statements to the Minister of Public Enterprises
IntroductionWe have reviewed the accompanying condensed group interim financial statements of Eskom Holdings SOC Ltd set out on pages 4 to 27, which comprise the condensed group statement of financial position at 30 September 2018, and the condensed group income statement, statements of comprehensive income, changes in equity and cash flows for the six months then ended and selected explanatory notes.
The board’s responsibility for the financial statementsThe board is responsible for the preparation and presentation of these condensed group interim financial statements in accordance with the recognition and measurement requirements of IFRS, the presentation and disclosure requirements of IAS 34 Interim f inancial reporting, the requirements of the Companies Act and for such internal control as the directors determine is necessary to enable the preparation of interim financial statements that are free from material misstatement, whether due to fraud or error.
Auditors’ responsibility for the financial statementsOur responsibility is to express a conclusion on these condensed group interim financial statements based on our review.
Scope of reviewWe conducted our review in accordance with the International Standard on Review Engagements 2410, Review of interim f inancial information performed by the independent auditor of the entity. A review of the interim financial information consists of making enquiries, primarily of persons responsible for financial and accounting matters, and applying analytical and other review procedures. This standard also requires us to comply with relevant ethical requirements.
A review of interim financial statements in accordance with ISRE 2410 is a limited assurance engagement. A review is substantially less in scope than an audit conducted in accordance with International Standards on Auditing and consequently does not enable us to obtain assurance that we would become aware of all significant matters which might be identified in an audit. Accordingly, we do not express an audit opinion.
ConclusionBased on our review, nothing has come to our attention that causes us to believe that the accompanying condensed group interim financial statements of Eskom for the six months ended 30 September 2018, are not prepared, in all material respects, in accordance with the recognition and measurement requirements of IFRS, the presentation and disclosure requirements of IAS 34 Interim f inancial reporting and the requirements of the Companies Act.
Material uncertainty related to going concernWe draw attention to note 2.1 of the condensed group interim financial statements which indicates that the net profit for the period ended 30 September 2018 was R671 million (30 September 2017: R6 312 million). As stated in note 2.1, these events or conditions indicate that material uncertainty exists that may indicate significant doubt on the group’s ability to continue as a going concern. Our review conclusion is not modified in respect of this matter.
Compliance with laws and regulationsIn accordance with our responsibilities in terms of sections 44(2) and 44(3) of the Auditing Profession Act, we report that we have identified reportable irregularities in terms of the Auditing Profession Act. We have reported such matters to the Independent Regulatory Board for Auditors. The matter pertaining to the reportable irregularities have been described in note 17 to the condensed group interim financial statements.
A MthimunyeSizweNtsalubaGobodo Grant Thornton Inc.DirectorRegistered auditor
27 November 2018
20 Morris Street EastWoodmead2191
Eskom Holdings SOC Ltd 4
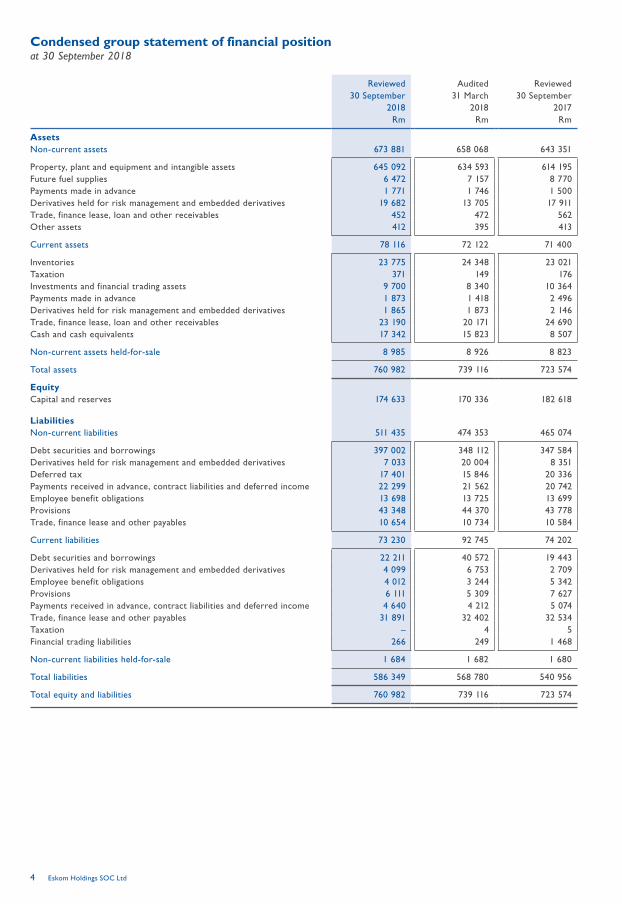
Condensed group statement of financial positionat 30 September 2018
Reviewed Audited Reviewed30 September 31 March 30 September
2018 2018 2017Rm Rm Rm
AssetsNon-current assets 673 881 658 068 643 351
Property, plant and equipment and intangible assets 645 092 634 593 614 195 Future fuel supplies 6 472 7 157 8 770 Payments made in advance 1 771 1 746 1 500 Derivatives held for risk management and embedded derivatives 19 682 13 705 17 911 Trade, finance lease, loan and other receivables 452 472 562 Other assets 412 395 413
Current assets 78 116 72 122 71 400
Inventories 23 775 24 348 23 021 Taxation 371 149 176 Investments and financial trading assets 9 700 8 340 10 364 Payments made in advance 1 873 1 418 2 496 Derivatives held for risk management and embedded derivatives 1 865 1 873 2 146 Trade, finance lease, loan and other receivables 23 190 20 171 24 690 Cash and cash equivalents 17 342 15 823 8 507
Non-current assets held-for-sale 8 985 8 926 8 823
Total assets 760 982 739 116 723 574
EquityCapital and reserves 174 633 170 336 182 618
LiabilitiesNon-current liabilities 511 435 474 353 465 074
Debt securities and borrowings 397 002 348 112 347 584 Derivatives held for risk management and embedded derivatives 7 033 20 004 8 351 Deferred tax 17 401 15 846 20 336 Payments received in advance, contract liabilities and deferred income 22 299 21 562 20 742 Employee benefit obligations 13 698 13 725 13 699 Provisions 43 348 44 370 43 778 Trade, finance lease and other payables 10 654 10 734 10 584
Current liabilities 73 230 92 745 74 202
Debt securities and borrowings 22 211 40 572 19 443 Derivatives held for risk management and embedded derivatives 4 099 6 753 2 709 Employee benefit obligations 4 012 3 244 5 342 Provisions 6 111 5 309 7 627 Payments received in advance, contract liabilities and deferred income 4 640 4 212 5 074 Trade, finance lease and other payables 31 891 32 402 32 534 Taxation – 4 5 Financial trading liabilities 266 249 1 468
Non-current liabilities held-for-sale 1 684 1 682 1 680
Total liabilities 586 349 568 780 540 956
Total equity and liabilities 760 982 739 116 723 574
Reviewed condensed group interim financial statements | 30 September 2018 5
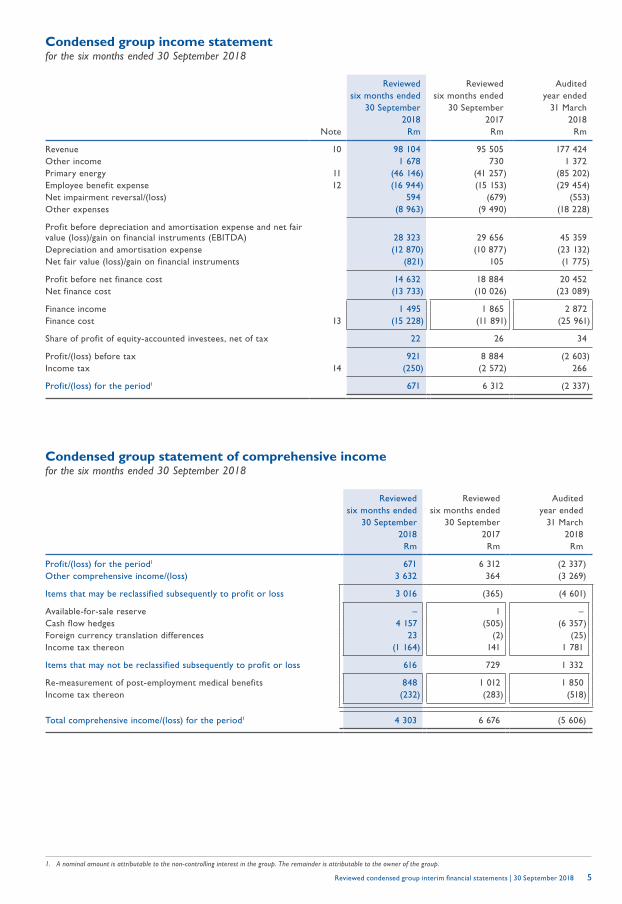
Condensed group income statementfor the six months ended 30 September 2018
Reviewed Reviewed Auditedsix months ended six months ended year ended
30 September 30 September 31 March2018 2017 2018
Note Rm Rm Rm
Revenue 10 98 104 95 505 177 424 Other income 1 678 730 1 372 Primary energy 11 (46 146) (41 257) (85 202)Employee benefit expense 12 (16 944) (15 153) (29 454)Net impairment reversal/(loss) 594 (679) (553)Other expenses (8 963) (9 490) (18 228)
Profit before depreciation and amortisation expense and net fair value (loss)/gain on financial instruments (EBITDA) 28 323 29 656 45 359 Depreciation and amortisation expense (12 870) (10 877) (23 132)Net fair value (loss)/gain on financial instruments (821) 105 (1 775)
Profit before net finance cost 14 632 18 884 20 452 Net finance cost (13 733) (10 026) (23 089)
Finance income 1 495 1 865 2 872 Finance cost 13 (15 228) (11 891) (25 961)
Share of profit of equity-accounted investees, net of tax 22 26 34
Profit/(loss) before tax 921 8 884 (2 603)Income tax 14 (250) (2 572) 266
Profit/(loss) for the period1 671 6 312 (2 337)
1. A nominal amount is attributable to the non-controlling interest in the group. The remainder is attributable to the owner of the group.
Condensed group statement of comprehensive incomefor the six months ended 30 September 2018
Reviewed Reviewed Auditedsix months ended six months ended year ended
30 September 30 September 31 March2018 2017 2018
Rm Rm Rm
Profit/(loss) for the period1 671 6 312 (2 337)Other comprehensive income/(loss) 3 632 364 (3 269)
Items that may be reclassified subsequently to profit or loss 3 016 (365) (4 601)
Available-for-sale reserve – 1 –Cash flow hedges 4 157 (505) (6 357)Foreign currency translation differences 23 (2) (25)Income tax thereon (1 164) 141 1 781
Items that may not be reclassified subsequently to profit or loss 616 729 1 332
Re-measurement of post-employment medical benefits 848 1 012 1 850 Income tax thereon (232) (283) (518)
Total comprehensive income/(loss) for the period1 4 303 6 676 (5 606)
Eskom Holdings SOC Ltd 6
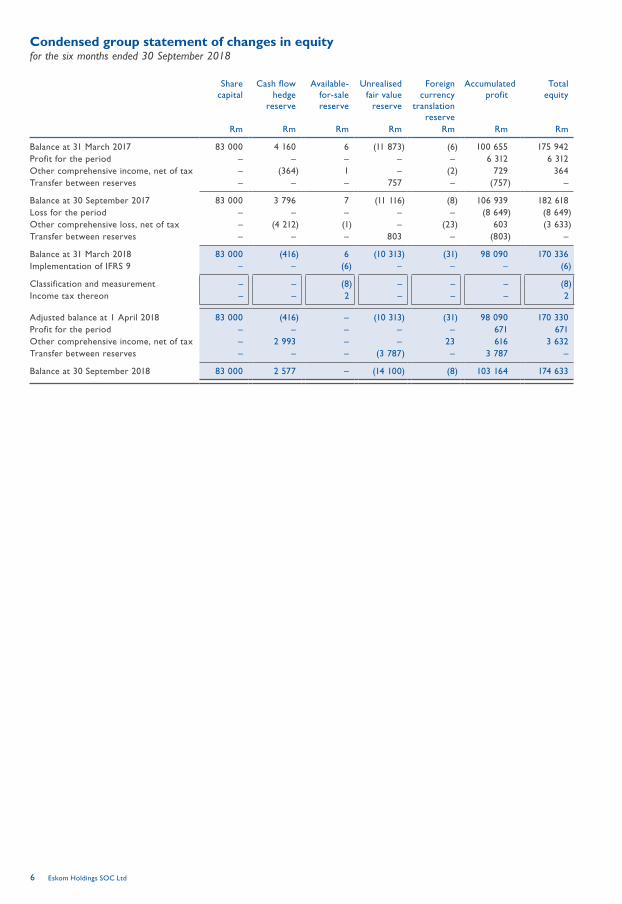
Condensed group statement of changes in equityfor the six months ended 30 September 2018
Share capital
Cash flow hedge
reserve
Available-for-sale reserve
Unrealised fair value
reserve
Foreign currency
translation reserve
Accumulated profit
Total equity
Rm Rm Rm Rm Rm Rm Rm
Balance at 31 March 2017 83 000 4 160 6 (11 873) (6) 100 655 175 942 Profit for the period – – – – – 6 312 6 312 Other comprehensive income, net of tax – (364) 1 – (2) 729 364 Transfer between reserves – – – 757 – (757) –
Balance at 30 September 2017 83 000 3 796 7 (11 116) (8) 106 939 182 618 Loss for the period – – – – – (8 649) (8 649)Other comprehensive loss, net of tax – (4 212) (1) – (23) 603 (3 633)Transfer between reserves – – – 803 – (803) –
Balance at 31 March 2018 83 000 (416) 6 (10 313) (31) 98 090 170 336 Implementation of IFRS 9 – – (6) – – – (6)
Classification and measurement – – (8) – – – (8)Income tax thereon – – 2 – – – 2
Adjusted balance at 1 April 2018 83 000 (416) – (10 313) (31) 98 090 170 330 Profit for the period – – – – – 671 671 Other comprehensive income, net of tax – 2 993 – – 23 616 3 632 Transfer between reserves – – – (3 787) – 3 787 –
Balance at 30 September 2018 83 000 2 577 – (14 100) (8) 103 164 174 633
Reviewed condensed group interim financial statements | 30 September 2018 7
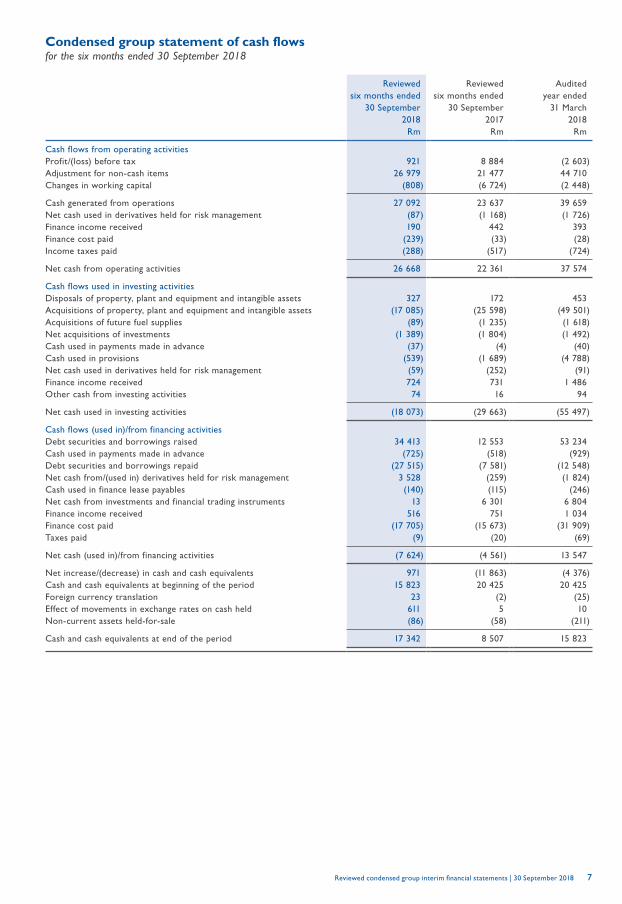
Condensed group statement of cash flowsfor the six months ended 30 September 2018
Reviewed Reviewed Auditedsix months ended six months ended year ended
30 September 30 September 31 March2018 2017 2018
Rm Rm Rm
Cash flows from operating activitiesProfit/(loss) before tax 921 8 884 (2 603)Adjustment for non-cash items 26 979 21 477 44 710 Changes in working capital (808) (6 724) (2 448)
Cash generated from operations 27 092 23 637 39 659 Net cash used in derivatives held for risk management (87) (1 168) (1 726)Finance income received 190 442 393 Finance cost paid (239) (33) (28)Income taxes paid (288) (517) (724)
Net cash from operating activities 26 668 22 361 37 574
Cash flows used in investing activitiesDisposals of property, plant and equipment and intangible assets 327 172 453 Acquisitions of property, plant and equipment and intangible assets (17 085) (25 598) (49 501)Acquisitions of future fuel supplies (89) (1 235) (1 618)Net acquisitions of investments (1 389) (1 804) (1 492)Cash used in payments made in advance (37) (4) (40)Cash used in provisions (539) (1 689) (4 788)Net cash used in derivatives held for risk management (59) (252) (91)Finance income received 724 731 1 486 Other cash from investing activities 74 16 94
Net cash used in investing activities (18 073) (29 663) (55 497)
Cash flows (used in)/from financing activitiesDebt securities and borrowings raised 34 413 12 553 53 234 Cash used in payments made in advance (725) (518) (929)Debt securities and borrowings repaid (27 515) (7 581) (12 548)Net cash from/(used in) derivatives held for risk management 3 528 (259) (1 824)Cash used in finance lease payables (140) (115) (246)Net cash from investments and financial trading instruments 13 6 301 6 804 Finance income received 516 751 1 034 Finance cost paid (17 705) (15 673) (31 909)Taxes paid (9) (20) (69)
Net cash (used in)/from financing activities (7 624) (4 561) 13 547
Net increase/(decrease) in cash and cash equivalents 971 (11 863) (4 376)Cash and cash equivalents at beginning of the period 15 823 20 425 20 425 Foreign currency translation 23 (2) (25)Effect of movements in exchange rates on cash held 611 5 10 Non-current assets held-for-sale (86) (58) (211)
Cash and cash equivalents at end of the period 17 342 8 507 15 823
Eskom Holdings SOC Ltd 8
Selected notes to the condensed group interim financial statementsfor the six months ended 30 September 2018
1. Structure and activitiesEskom Holdings SOC Ltd (Eskom), a state-owned company and holding company of the group, is incorporated and domiciled in the Republic of South Africa. Eskom is a vertically integrated operation that generates, transmits and distributes electricity to local industrial, mining, commercial, agricultural, redistributors (metropolitan and other municipalities) and residential customers and international customers in southern Africa. Eskom also purchases electricity from independent power producers and international suppliers in southern Africa. These represent the significant activities of the group. The business focus of the subsidiaries is primarily to support the electricity business.
2. Basis of preparationThe reviewed condensed group interim financial statements of Eskom as at and for the six months ended 30 September 2018 comprise the company, its subsidiaries, joint ventures, associates and structured entities (together, the group). The reviewed condensed group interim financial statements do not include all of the information required for full financial statements and should be read in conjunction with the Eskom Holdings SOC Ltd 31 March 2018 group annual financial statements. The annual financial statements of the group as at and for the year ended 31 March 2018 are available for inspection at the company’s registered office and on the Eskom website at www.eskom.co.za.
The condensed group interim financial statements are prepared in accordance with the recognition and measurement requirements of IFRS, the presentation and disclosure requirements of IAS 34 Interim f inancial reporting, and in the manner required by the Companies Act.
The condensed group interim financial statements are prepared on the historical-cost basis except for the following items which are measured at fair value:• derivatives held for risk management• embedded derivatives• certain investments and financial trading assets and liabilities
2.1 Going concernThe board made an assessment of the ability of the group to continue as a going concern in the foreseeable future. The board:• noted the positive impact of improved governance processes and internal controls that started with the appointment of the new
board and the subsequent action taken under their leadership• recognises that Eskom is facing various legacy challenges that resulted from mismanagement and corruption in the past.
Significant progress has been made towards becoming a trusted state-owned entity, but it will take time to identify all issues and take appropriate corrective action and consequence management
• noted that the rating agencies have a more positive outlook on Eskom, even though the ratings are still at sub-investment grade• noted that improved investor confidence and access to domestic markets as well as continued foreign support contributed to securing
R53 billion of funding in 2019 (73% of the targeted funding of R72 billion for 2019 has already been secured by September 2018)• considered the impact of the current economic climate and the sovereign’s credit ratings on Eskom’s ability to raise funds• reviewed the performance of the group for the period ended 30 September 2018 including the net profit of R671 million
(30 September 2017: R6 312 million profit, 31 March 2018 R2 337 million loss)• considered the impact of the cash flow forecast for the 15 months ending 31 March 2020 and the projected net loss by year end• considered that Eskom is in a debt reliant liquidity situation that resulted from low tariffs, limited growth in sales, increased costs
and the capital programme to increase and replace generating and transmitting capacity• considered the impact of reduced generation performance, low coal stock levels and the continuous increase in overdue
electricity receivables• considered the impact of the R32.7 billion allowed by the National Energy Regulatory of South Africa (NERSA) on the regulatory
clearing accounts for the 2015 to 2017 periods of the MYPD that will result in a once-off increase of 4.41% from 1 April 2019 for four years
• considered the impact of the non-recoverability of long outstanding electricity receivables• noted that the government has indicated that Eskom plays a strategic role in supporting economic growth and continues to
support Eskom as a going concern
The challenges that the group is facing are being addressed by the following mitigation strategies and actions:• the board approved a revised strategy to address Eskom’s short- to medium-term challenges and set the organisation up for the
electricity industry of the future. The turnaround of Eskom is a journey over time and the successful execution of this strategy is highly dependent on the active involvement of key stakeholders, in particular government. Eskom cannot solve the financial and operational sustainability challenges that it faces alone and the costs thereof will ultimately impact either the electricity consumer or the taxpayer
• continuous engagement is taking place with the shareholder and National Treasury to ensure that the challenges that impact the group’s going-concern status are addressed satisfactorily within a reasonable timeframe
• the ministers of Public Enterprises, Energy and Finance are working together to deal with other structural issues at Eskom, including the funding model and other industry challenges identified by the inter-ministerial committee on state-owned enterprises reform
• the turnaround initiatives are expected to deliver positive value in 2019 and will continue with a positive trend into the short- to medium-term to contribute towards the stabilisation of Eskom’s performance
• Eskom lodged court proceedings against NERSA around the determination of the 5.23% tariff increase awarded for the 2019 financial year
• the group’s cost structures and capital programme are continuously being reviewed to extract cost savings and improve cash flows • the group’s generation capacity is being managed as a key focus area to ensure appropriate steps are being taken to manage the
performance challenges • there is a high focus on implementing the relevant recovery plans to increase the coal stock to acceptable levels• there is continued focus on implementing relevant strategies in an effort to recover overdue trade receivables• the group will not embark on any further generation expansion activities in the foreseeable future after the completion of the
Kusile power station project
Reviewed condensed group interim financial statements | 30 September 2018 9
• funding options, with the support of National Treasury, are being pursued to implement the group’s borrowing programme• there is continued focus on the supply chain recovery programme to address the shortcomings relating to the completeness of
the irregular expenditure, fruitless and wasteful expenditure and losses due to criminal conduct reporting process in terms of the Public Finance Management Act (PFMA) (resulted in the qualified audit opinion) and the clean-up of the related challenges in the commercial environment
The board considered the risks relating to the group’s going-concern status and is satisfied that the risks will be satisfactorily addressed by the mitigation strategies in place. The board continues to manage these strategies as a priority as it is important that they materialise as envisaged. Tough and painful decisions will have to be made by Eskom, the shareholder, NERSA and other stakeholders for the strategy to succeed. The board therefore concluded that it is satisfied that the group has access to adequate resources and facilities to be able to continue its operations for the foreseeable future as a going concern.
3. Significant changes in accounting policiesThe accounting policies are consistent with those applied in the audited financial statements as at 31 March 2018 except for the new statements and interpretations of IFRS which have become effective during the six months ended 30 September 2018 as set out below.
3.1 IFRS 9 Financial instrumentsEskom has applied IFRS 9 which replaces IAS 39 Financial instruments: recognition and measurement from 1 April 2018. IFRS 9 sets out requirements for recognising and measuring financial assets, financial liabilities and some contracts to buy or sell non-financial items.
Eskom applied the IFRS 9 exemption allowing financial assets and liabilities to be classified and measured in terms of IAS 39 for the comparative periods ending 30 September 2017 and 31 March 2018. IFRS 9 has been applied in the current period (beginning 1 April 2018) including:• updating accounting policies• determining the business model within which financial assets are held on the basis of the facts and circumstances then existing• determining the carrying amounts of financial assets and liabilities calculated in terms of IFRS 9 and IAS 39 and recognising
differences and their related tax impacts in opening retained earnings balances
Eskom has elected as its accounting policy, based on the choice presented in IFRS 9, to defer the application of the IFRS 9 general hedge accounting model. Eskom continues to apply the hedge accounting requirements in IAS 39 to all of its hedging relationships. The disclosure requirements relating to hedge accounting, as presented in IFRS 9, have been implemented.
3.1.1 Classification and measurementFinancial assetsAssets at fair value through profit or loss (FVTPL) are initially measured at fair value. Assets at amortised cost or at fair value through other comprehensive income (FVOCI) are initially measured at fair value plus transaction costs directly attributable to their acquisition. Trade and other receivables without a significant financing component are initially measured at transaction price.
Financial assets are subsequently measured based on their IFRS 9 measurement classification (superseding the IAS 39 classifications). This classification is based on the business model in which the financial assets are managed and their contractual cash flow characteristics.
Derivatives embedded in contracts where the host is a financial asset in the scope of the standard are never separated. The hybrid financial instrument as a whole is assessed for classification.
Financial liabilitiesIFRS 9 largely retains the existing requirements in IAS 39 for the classification and measurement of financial liabilities and there was therefore no impact on the group.
Instrument IAS 39 classification and measurement
IFRS 9 classification
Reason for classification
Loans receivable, finance lease receivables and trade and other receivables
Loans and receivables (amortised cost)
Amortised cost
It was assessed that these balances are managed in terms of the IFRS 9 held-to-collect business model and have met the strictly payments of principal and interest (SPPI) criterion
Derivatives held for risk management (excluding cash flow hedges)
Held-for-trading (FVTPL)
FVTPL The business model assessment did not support a conclusion that these items are managed on a held-to-collect and/or for sale model and therefore defaulted to FVTPL
Investments and financial trading assets• Negotiable certif icates of
depositAvailable-for-sale (FVOCI)
Amortised cost
It was assessed that these balances are managed in terms of the IFRS 9 held-to-collect business model and have met the SPPI criterion
• Repurchase agreement Held-for-trading (FVTPL)
Amortised cost
It was assessed that these balances are managed in terms of the IFRS 9 held-to-collect business model and have met the SPPI criterion
• Listed shares Held-for-trading (FVTPL)
FVTPL The business model assessment did not support a conclusion that these items are managed on a held-to-collect and/or for sale model and therefore defaulted to FVTPL
• Government bonds Held-for-trading (FVTPL)
FVTPL The business model assessment did not support a conclusion that these items are managed on a held-to-collect and/or for sale model and therefore defaulted to FVTPL
Eskom Holdings SOC Ltd 10
Selected notes to the condensed group interim financial statements (continued)for the six months ended 30 September 2018
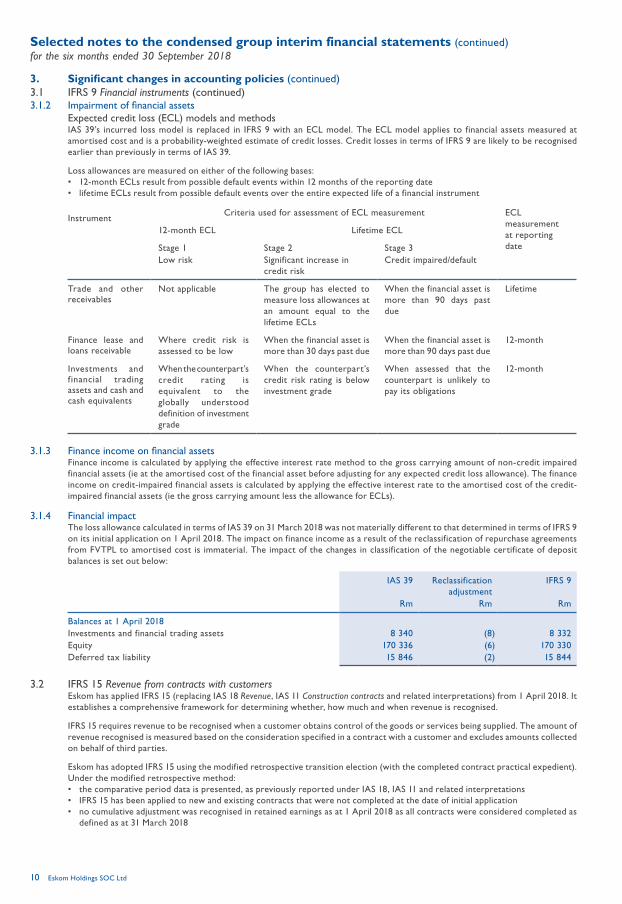
3. Significant changes in accounting policies (continued)3.1 IFRS 9 Financial instruments (continued)3.1.2 Impairment of financial assets
Expected credit loss (ECL) models and methodsIAS 39’s incurred loss model is replaced in IFRS 9 with an ECL model. The ECL model applies to financial assets measured at amortised cost and is a probability-weighted estimate of credit losses. Credit losses in terms of IFRS 9 are likely to be recognised earlier than previously in terms of IAS 39.
Loss allowances are measured on either of the following bases:• 12-month ECLs result from possible default events within 12 months of the reporting date• lifetime ECLs result from possible default events over the entire expected life of a financial instrument
InstrumentCriteria used for assessment of ECL measurement ECL
measurement at reporting date
12-month ECL Lifetime ECL
Stage 1 Stage 2 Stage 3Low risk Significant increase in
credit riskCredit impaired/default
Trade and other receivables
Not applicable The group has elected to measure loss allowances at an amount equal to the lifetime ECLs
When the financial asset is more than 90 days past due
Lifetime
Finance lease and loans receivable
Where credit risk is assessed to be low
When the financial asset is more than 30 days past due
When the financial asset is more than 90 days past due
12-month
Investments and financial trading assets and cash and cash equivalents
When the counterpart’s credit rating is equivalent to the globally understood definition of investment grade
When the counterpart’s credit risk rating is below investment grade
When assessed that the counterpart is unlikely to pay its obligations
12-month
3.1.3 Finance income on financial assetsFinance income is calculated by applying the effective interest rate method to the gross carrying amount of non-credit impaired financial assets (ie at the amortised cost of the financial asset before adjusting for any expected credit loss allowance). The finance income on credit-impaired financial assets is calculated by applying the effective interest rate to the amortised cost of the credit-impaired financial assets (ie the gross carrying amount less the allowance for ECLs).
3.1.4 Financial impactThe loss allowance calculated in terms of IAS 39 on 31 March 2018 was not materially different to that determined in terms of IFRS 9 on its initial application on 1 April 2018. The impact on finance income as a result of the reclassification of repurchase agreements from FVTPL to amortised cost is immaterial. The impact of the changes in classification of the negotiable certificate of deposit balances is set out below:
IAS 39 Reclassification adjustment
IFRS 9
Rm Rm Rm
Balances at 1 April 2018Investments and financial trading assets 8 340 (8) 8 332 Equity 170 336 (6) 170 330 Deferred tax liability 15 846 (2) 15 844
3.2 IFRS 15 Revenue from contracts with customersEskom has applied IFRS 15 (replacing IAS 18 Revenue, IAS 11 Construction contracts and related interpretations) from 1 April 2018. It establishes a comprehensive framework for determining whether, how much and when revenue is recognised.
IFRS 15 requires revenue to be recognised when a customer obtains control of the goods or services being supplied. The amount of revenue recognised is measured based on the consideration specified in a contract with a customer and excludes amounts collected on behalf of third parties.
Eskom has adopted IFRS 15 using the modified retrospective transition election (with the completed contract practical expedient). Under the modified retrospective method:• the comparative period data is presented, as previously reported under IAS 18, IAS 11 and related interpretations• IFRS 15 has been applied to new and existing contracts that were not completed at the date of initial application• no cumulative adjustment was recognised in retained earnings as at 1 April 2018 as all contracts were considered completed as
defined as at 31 March 2018
Reviewed condensed group interim financial statements | 30 September 2018 11
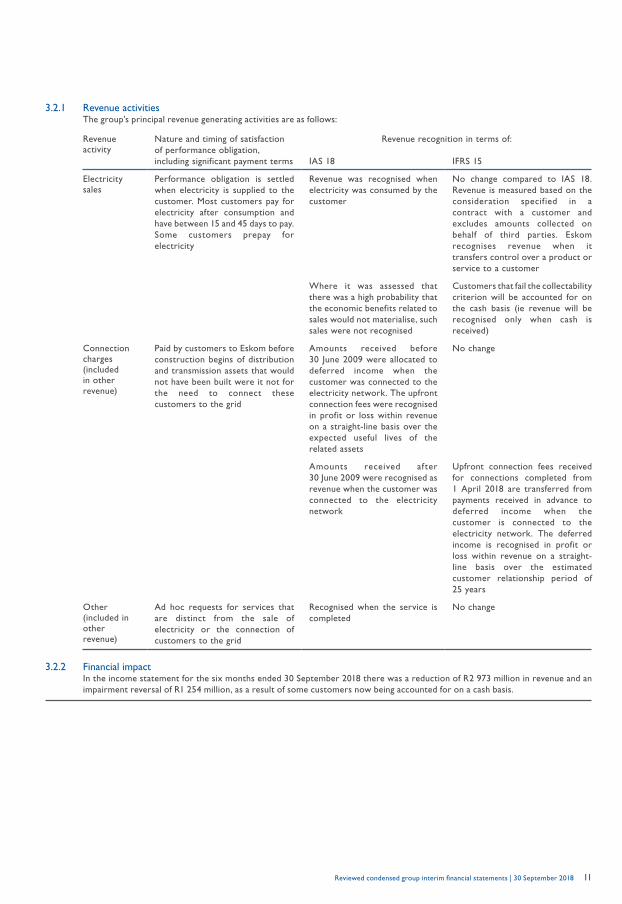
3.2.1 Revenue activitiesThe group’s principal revenue generating activities are as follows:
Revenue activity
Nature and timing of satisfaction of performance obligation, including significant payment terms
Revenue recognition in terms of:
IAS 18 IFRS 15
Electricity sales
Performance obligation is settled when electricity is supplied to the customer. Most customers pay for electricity after consumption and have between 15 and 45 days to pay. Some customers prepay for electricity
Revenue was recognised when electricity was consumed by the customer
No change compared to IAS 18. Revenue is measured based on the consideration specified in a contract with a customer and excludes amounts collected on behalf of third parties. Eskom recognises revenue when it transfers control over a product or service to a customer
Where it was assessed that there was a high probability that the economic benefits related to sales would not materialise, such sales were not recognised
Customers that fail the collectability criterion will be accounted for on the cash basis (ie revenue will be recognised only when cash is received)
Connection charges (included in other revenue)
Paid by customers to Eskom before construction begins of distribution and transmission assets that would not have been built were it not for the need to connect these customers to the grid
Amounts received before 30 June 2009 were allocated to deferred income when the customer was connected to the electricity network. The upfront connection fees were recognised in profit or loss within revenue on a straight-line basis over the expected useful lives of the related assets
No change
Amounts received after 30 June 2009 were recognised as revenue when the customer was connected to the electricity network
Upfront connection fees received for connections completed from 1 April 2018 are transferred from payments received in advance to deferred income when the customer is connected to the electricity network. The deferred income is recognised in profit or loss within revenue on a straight-line basis over the estimated customer relationship period of 25 years
Other (included in other revenue)
Ad hoc requests for services that are distinct from the sale of electricity or the connection of customers to the grid
Recognised when the service is completed
No change
3.2.2 Financial impactIn the income statement for the six months ended 30 September 2018 there was a reduction of R2 973 million in revenue and an impairment reversal of R1 254 million, as a result of some customers now being accounted for on a cash basis.
Eskom Holdings SOC Ltd 12
Selected notes to the condensed group interim financial statements (continued)for the six months ended 30 September 2018
4. Critical accounting estimates and judgementsThe significant estimates and judgements made by management in applying the accounting policies and the key sources of estimation uncertainty were substantially the same as those applied to the financial statements as at and for the year ended 31 March 2018 other than those set out below:
4.1 IFRS 9 Financial instruments4.1.1 ECL
The ECL is calculated using the following formula:
ECL = exposure x PD (probability of default) x LGD (loss given default) x expected lifetime
The exposure is the amount outstanding less any collateral. The PD measures the likelihood that the amount outstanding becomes more than 90 days past due. The LGD measures the expected credit loss in the event that the outstanding amount is more than 90 days overdue.
The financial assets subject to IFRS 9 impairment are stratified using factors such as the balance type, credit risk rating, existence of and type of collateral, remaining term to maturity, delinquency status, and geographical location.
The following details are applicable to the models used for the various financial asset balances:
Financial asset balance Model details
International electricity receivables
The PD estimates are based on the sovereign rating of the country using an external rating scale. The external rating scale is mapped to an internal rating scale and a fitted PD. The LGD approach is based on a default approach that banks may use to estimate their capital requirements
Local large and small power user electricity receivables (excluding municipalities)
ECLs have been calculated using a provision matrix which utilises a transition matrix and post default recoveries. A transition matrix is used to estimate PDs per days past due bucket and recoveries post default to calculate an LGD. The historical loss rates were calculated and applied to groups of trade receivables with similar characteristics. The PD and exposure amount relates to the relevant days past due bucket
Municipality electricity receivables
A scorecard approach was followed. Key financial ratios were calculated based on their latest signed annual financial statements. The PD model was developed using a logistic regression approach and was considered in the development of the LGD model
Other receivables, finance lease receivables and loans receivable
The ECL has been calculated based on an approach that banks may use to categorise counterparties based on their size. Credit ratings have been assigned to these categories which is then used to determine the PD. The LGD approach is based on a default approach that banks may use to estimate their capital requirements
Investments and financial trading assets
The PD estimates are based on the credit rating of the counterparty. The external rating scale is mapped to an internal rating scale and a fitted PD. The LGD approach is based on a default approach that banks may use to estimate their capital requirements
Credit risk rating groupingsThe ECL calculation for municipal electricity, international electricity and other (non-electricity) receivables applied a PD based on credit ratings as determined by ratings agencies. The grouping of these balances by credit rating has been summarised as follows:
Credit rating grouping Risk grouping
BBB- to AAA Low riskB- to BB+ Medium riskBelow BB+ High risk
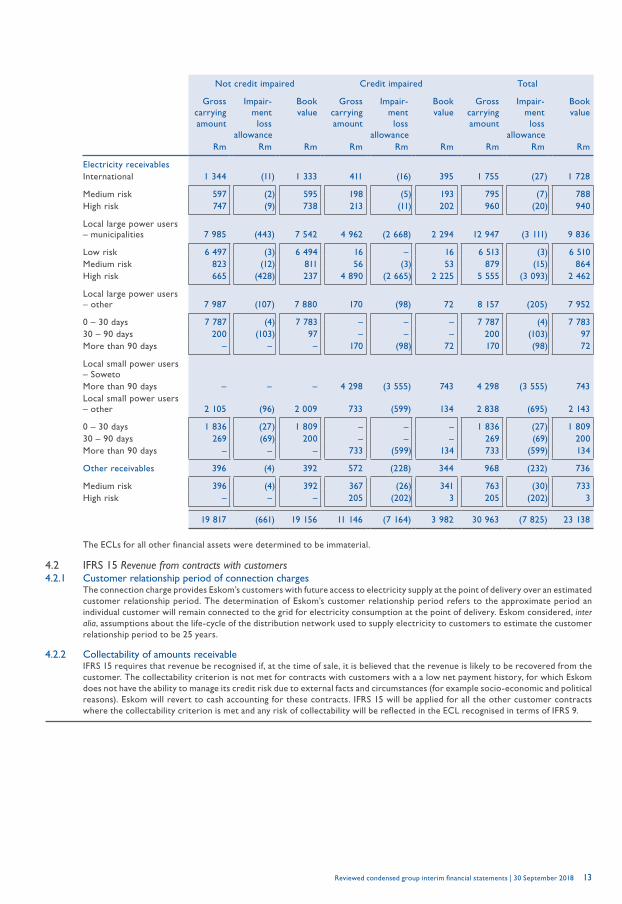
Reviewed condensed group interim financial statements | 30 September 2018 13
Not credit impaired Credit impaired Total
Gross carrying amount
Impair-ment loss
allowance
Bookvalue
Gross carrying amount
Impair-ment loss
allowance
Book value
Gross carrying amount
Impair-ment loss
allowance
Book value
Rm Rm Rm Rm Rm Rm Rm Rm Rm
Electricity receivablesInternational 1 344 (11) 1 333 411 (16) 395 1 755 (27) 1 728
Medium risk 597 (2) 595 198 (5) 193 795 (7) 788 High risk 747 (9) 738 213 (11) 202 960 (20) 940
Local large power users – municipalities 7 985 (443) 7 542 4 962 (2 668) 2 294 12 947 (3 111) 9 836
Low risk 6 497 (3) 6 494 16 – 16 6 513 (3) 6 510 Medium risk 823 (12) 811 56 (3) 53 879 (15) 864 High risk 665 (428) 237 4 890 (2 665) 2 225 5 555 (3 093) 2 462
Local large power users – other 7 987 (107) 7 880 170 (98) 72 8 157 (205) 7 952
0 – 30 days 7 787 (4) 7 783 – – – 7 787 (4) 7 783 30 – 90 days 200 (103) 97 – – – 200 (103) 97 More than 90 days – – – 170 (98) 72 170 (98) 72
Local small power users – SowetoMore than 90 days – – – 4 298 (3 555) 743 4 298 (3 555) 743 Local small power users – other 2 105 (96) 2 009 733 (599) 134 2 838 (695) 2 143
0 – 30 days 1 836 (27) 1 809 – – – 1 836 (27) 1 809 30 – 90 days 269 (69) 200 – – – 269 (69) 200 More than 90 days – – – 733 (599) 134 733 (599) 134
Other receivables 396 (4) 392 572 (228) 344 968 (232) 736
Medium risk 396 (4) 392 367 (26) 341 763 (30) 733 High risk – – – 205 (202) 3 205 (202) 3
19 817 (661) 19 156 11 146 (7 164) 3 982 30 963 (7 825) 23 138
The ECLs for all other financial assets were determined to be immaterial.
4.2 IFRS 15 Revenue from contracts with customers4.2.1 Customer relationship period of connection charges
The connection charge provides Eskom’s customers with future access to electricity supply at the point of delivery over an estimated customer relationship period. The determination of Eskom’s customer relationship period refers to the approximate period an individual customer will remain connected to the grid for electricity consumption at the point of delivery. Eskom considered, inter alia, assumptions about the life-cycle of the distribution network used to supply electricity to customers to estimate the customer relationship period to be 25 years.
4.2.2 Collectability of amounts receivableIFRS 15 requires that revenue be recognised if, at the time of sale, it is believed that the revenue is likely to be recovered from the customer. The collectability criterion is not met for contracts with customers with a a low net payment history, for which Eskom does not have the ability to manage its credit risk due to external facts and circumstances (for example socio-economic and political reasons). Eskom will revert to cash accounting for these contracts. IFRS 15 will be applied for all the other customer contracts where the collectability criterion is met and any risk of collectability will be reflected in the ECL recognised in terms of IFRS 9.
Eskom Holdings SOC Ltd 14
Selected notes to the condensed group interim financial statements (continued)for the six months ended 30 September 2018
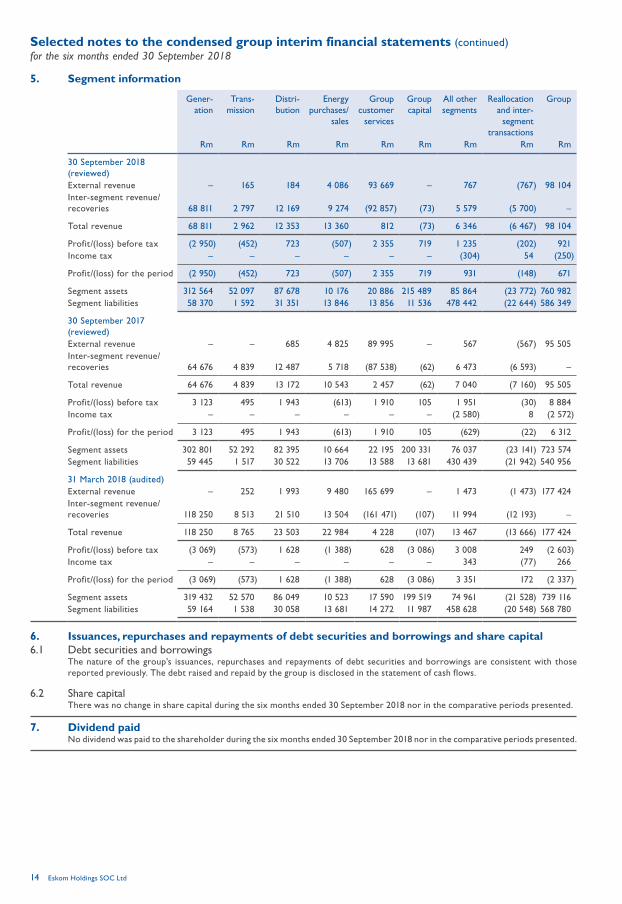
5. Segment information
Gener-ation
Trans-mission
Distri-bution
Energy purchases/
sales
Group customer
services
Group capital
All other segments
Reallocation and inter-
segment transactions
Group
Rm Rm Rm Rm Rm Rm Rm Rm Rm
30 September 2018 (reviewed)External revenue – 165 184 4 086 93 669 – 767 (767) 98 104 Inter-segment revenue/recoveries 68 811 2 797 12 169 9 274 (92 857) (73) 5 579 (5 700) –
Total revenue 68 811 2 962 12 353 13 360 812 (73) 6 346 (6 467) 98 104
Profit/(loss) before tax (2 950) (452) 723 (507) 2 355 719 1 235 (202) 921 Income tax – – – – – – (304) 54 (250)
Profit/(loss) for the period (2 950) (452) 723 (507) 2 355 719 931 (148) 671
Segment assets 312 564 52 097 87 678 10 176 20 886 215 489 85 864 (23 772) 760 982 Segment liabilities 58 370 1 592 31 351 13 846 13 856 11 536 478 442 (22 644) 586 349
30 September 2017 (reviewed)External revenue – – 685 4 825 89 995 – 567 (567) 95 505 Inter-segment revenue/recoveries 64 676 4 839 12 487 5 718 (87 538) (62) 6 473 (6 593) –
Total revenue 64 676 4 839 13 172 10 543 2 457 (62) 7 040 (7 160) 95 505
Profit/(loss) before tax 3 123 495 1 943 (613) 1 910 105 1 951 (30) 8 884 Income tax – – – – – – (2 580) 8 (2 572)
Profit/(loss) for the period 3 123 495 1 943 (613) 1 910 105 (629) (22) 6 312
Segment assets 302 801 52 292 82 395 10 664 22 195 200 331 76 037 (23 141) 723 574 Segment liabilities 59 445 1 517 30 522 13 706 13 588 13 681 430 439 (21 942) 540 956
31 March 2018 (audited)External revenue – 252 1 993 9 480 165 699 – 1 473 (1 473) 177 424 Inter-segment revenue/recoveries 118 250 8 513 21 510 13 504 (161 471) (107) 11 994 (12 193) –
Total revenue 118 250 8 765 23 503 22 984 4 228 (107) 13 467 (13 666) 177 424
Profit/(loss) before tax (3 069) (573) 1 628 (1 388) 628 (3 086) 3 008 249 (2 603)Income tax – – – – – – 343 (77) 266
Profit/(loss) for the period (3 069) (573) 1 628 (1 388) 628 (3 086) 3 351 172 (2 337)
Segment assets 319 432 52 570 86 049 10 523 17 590 199 519 74 961 (21 528) 739 116 Segment liabilities 59 164 1 538 30 058 13 681 14 272 11 987 458 628 (20 548) 568 780
6. Issuances, repurchases and repayments of debt securities and borrowings and share capital6.1 Debt securities and borrowings
The nature of the group’s issuances, repurchases and repayments of debt securities and borrowings are consistent with those reported previously. The debt raised and repaid by the group is disclosed in the statement of cash flows.
6.2 Share capitalThere was no change in share capital during the six months ended 30 September 2018 nor in the comparative periods presented.
7. Dividend paidNo dividend was paid to the shareholder during the six months ended 30 September 2018 nor in the comparative periods presented.
Reviewed condensed group interim financial statements | 30 September 2018 15
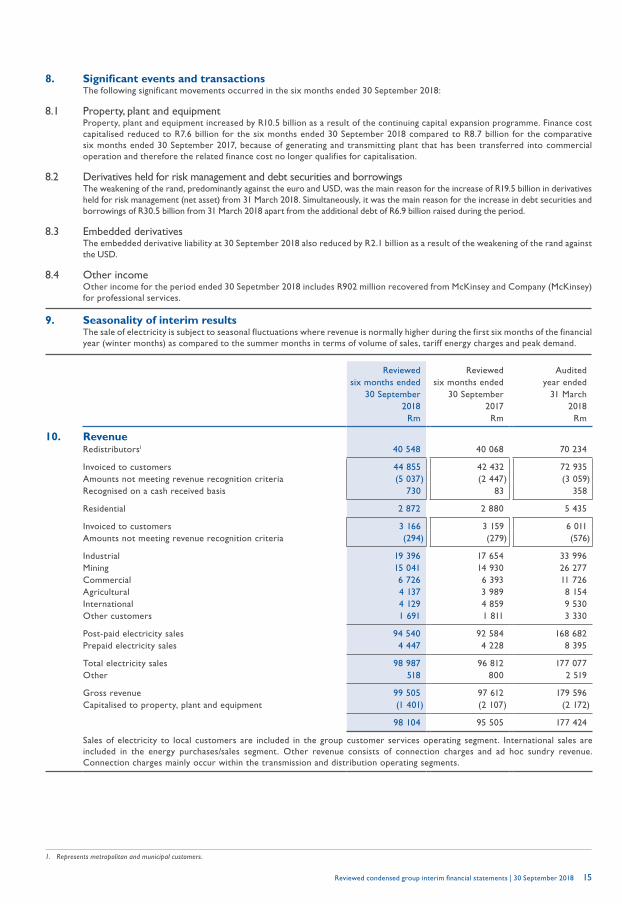
8. Significant events and transactionsThe following significant movements occurred in the six months ended 30 September 2018:
8.1 Property, plant and equipmentProperty, plant and equipment increased by R10.5 billion as a result of the continuing capital expansion programme. Finance cost capitalised reduced to R7.6 billion for the six months ended 30 September 2018 compared to R8.7 billion for the comparative six months ended 30 September 2017, because of generating and transmitting plant that has been transferred into commercial operation and therefore the related finance cost no longer qualifies for capitalisation.
8.2 Derivatives held for risk management and debt securities and borrowingsThe weakening of the rand, predominantly against the euro and USD, was the main reason for the increase of R19.5 billion in derivatives held for risk management (net asset) from 31 March 2018. Simultaneously, it was the main reason for the increase in debt securities and borrowings of R30.5 billion from 31 March 2018 apart from the additional debt of R6.9 billion raised during the period.
8.3 Embedded derivativesThe embedded derivative liability at 30 September 2018 also reduced by R2.1 billion as a result of the weakening of the rand against the USD.
8.4 Other incomeOther income for the period ended 30 Sepetmber 2018 includes R902 million recovered from McKinsey and Company (McKinsey) for professional services.
9. Seasonality of interim resultsThe sale of electricity is subject to seasonal fluctuations where revenue is normally higher during the first six months of the financial year (winter months) as compared to the summer months in terms of volume of sales, tariff energy charges and peak demand.
Reviewed Reviewed Auditedsix months ended six months ended year ended
30 September 30 September 31 March2018 2017 2018
Rm Rm Rm
10. RevenueRedistributors1 40 548 40 068 70 234
Invoiced to customers 44 855 42 432 72 935 Amounts not meeting revenue recognition criteria (5 037) (2 447) (3 059)Recognised on a cash received basis 730 83 358
Residential 2 872 2 880 5 435
Invoiced to customers 3 166 3 159 6 011 Amounts not meeting revenue recognition criteria (294) (279) (576)
Industrial 19 396 17 654 33 996 Mining 15 041 14 930 26 277 Commercial 6 726 6 393 11 726 Agricultural 4 137 3 989 8 154 International 4 129 4 859 9 530 Other customers 1 691 1 811 3 330
Post-paid electricity sales 94 540 92 584 168 682 Prepaid electricity sales 4 447 4 228 8 395
Total electricity sales 98 987 96 812 177 077 Other 518 800 2 519
Gross revenue 99 505 97 612 179 596 Capitalised to property, plant and equipment (1 401) (2 107) (2 172)
98 104 95 505 177 424
Sales of electricity to local customers are included in the group customer services operating segment. International sales are included in the energy purchases/sales segment. Other revenue consists of connection charges and ad hoc sundry revenue. Connection charges mainly occur within the transmission and distribution operating segments.
1. Represents metropolitan and municipal customers.
Eskom Holdings SOC Ltd 16
Selected notes to the condensed group interim financial statements (continued)for the six months ended 30 September 2018
Reviewed Reviewed Auditedsix months ended six months ended year ended
30 September 30 September 31 March2018 2017 2018
Rm Rm Rm
11. Primary energyOwn generation costs 29 385 27 341 54 896 Environmental levy 4 063 4 061 8 061 International electricity purchases 1 905 1 397 2 768 Independent power producers 10 793 8 392 19 317 Other – 66 160
46 146 41 257 85 202
12. Employee benefit expenseGross employee benefit expense 18 631 16 710 32 655 Capitalised to property, plant and equipment (1 687) (1 557) (3 201)
16 944 15 153 29 454
13. Finance costGross finance cost 22 855 20 597 41 508 Capitalised to property, plant and equipment (7 627) (8 706) (15 547)
15 228 11 891 25 961
14. Income taxIncome tax for the interim period is recognised based on management’s best estimate of the weighted average annual income tax rate expected for the full financial year which is applied to the pre-tax income of the interim period.
Reviewed condensed group interim financial statements | 30 September 2018 17
15. Accounting classification and fair value15.1 Accountingclassification
Fair value through profit
or loss
Amortisedcost
Other assets and liabilities
Total
Rm Rm Rm Rm
30 September 2018 (reviewed)Financial assetsInvestments and financial trading assets 1 407 8 293 – 9 700
Negotiable certificates of deposit – 8 236 – 8 236 Repurchase agreements – 57 – 57 Listed shares 1 303 – – 1 303 Government bonds 104 – – 104
Derivatives held for risk management 1 358 – 20 189 21 547
Foreign exchange contracts 1 213 – 193 1 406 Cross-currency swaps 72 – 19 996 20 068 Commodity forwards 46 – – 46 Credit default swaps 9 – – 9 Inflation-linked swaps 18 – – 18
Trade, finance lease, loan and other receivables – 23 210 423 23 633
Loans receivable – 72 – 72 Finance lease receivables – – 423 423 Trade and other receivables1 – 23 138 – 23 138
Cash and cash equivalents – 17 342 – 17 342
Bank balances – 5 710 – 5 710 Unsettled deals – 54 – 54 Fixed deposits – 11 578 – 11 578
2 765 48 845 20 612 72 222
Financial liabilitiesDebt securities and borrowings – 419 213 – 419 213
Eskom bonds – 149 196 – 149 196 Commercial paper – 1 249 – 1 249 Eurorand zero coupon bonds – 6 075 – 6 075 Foreign bonds – 78 306 – 78 306 Development financing institutions – 133 107 – 133 107 Export credit facilities – 34 023 – 34 023 Floating rate notes – 3 982 – 3 982 Other loans – 13 275 – 13 275
Embedded derivatives – – 3 203 3 203 Derivatives held for risk management 2 469 – 5 460 7 929
Foreign exchange contracts 1 656 – 197 1 853 Cross-currency swaps 354 – 5 263 5 617 Commodity forwards 3 – – 3 Credit default swaps 429 – – 429 Inflation-linked swaps 27 – – 27
Trade, finance lease and other payables – 30 688 9 679 40 367
Finance lease payables – – 9 679 9 679 Trade and other payables1 – 30 688 – 30 688
Financial trading liabilities 266 – – 266
Short-sold government bonds 55 – – 55 Repurchase agreements 211 – – 211
2 735 449 901 18 342 470 978
1. VAT receivable and payable to the South African Revenue Service is not included in this f igure as it is not a f inancial instrument.
Eskom Holdings SOC Ltd 18
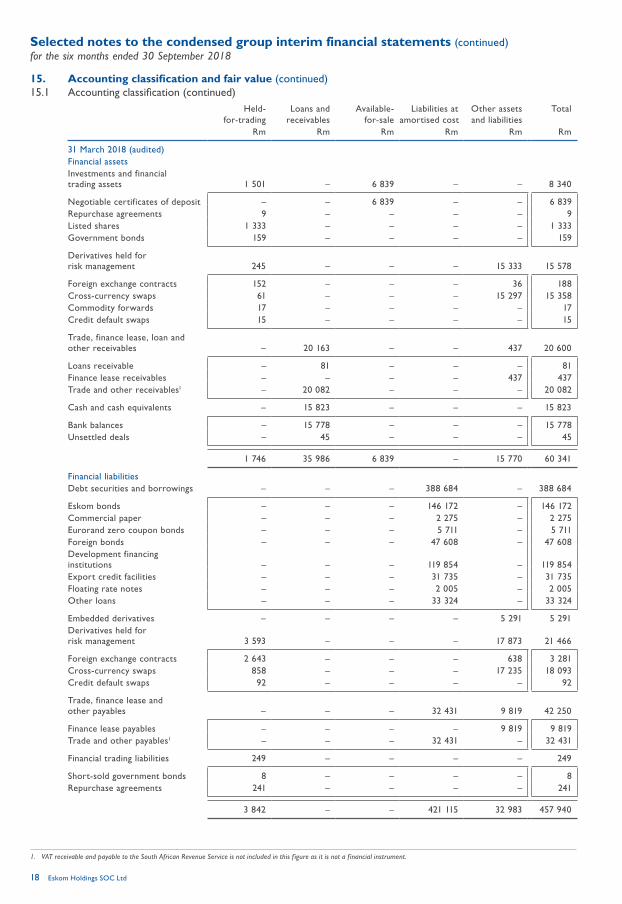
Selected notes to the condensed group interim financial statements (continued)for the six months ended 30 September 2018
15. Accounting classification and fair value (continued)15.1 Accountingclassification(continued)
Held-for-trading
Loans and receivables
Available-for-sale
Liabilities at amortised cost
Other assets and liabilities
Total
Rm Rm Rm Rm Rm Rm
31 March 2018 (audited)Financial assetsInvestments and financial trading assets 1 501 – 6 839 – – 8 340
Negotiable certificates of deposit – – 6 839 – – 6 839 Repurchase agreements 9 – – – – 9 Listed shares 1 333 – – – – 1 333 Government bonds 159 – – – – 159
Derivatives held for risk management 245 – – – 15 333 15 578
Foreign exchange contracts 152 – – – 36 188 Cross-currency swaps 61 – – – 15 297 15 358 Commodity forwards 17 – – – – 17 Credit default swaps 15 – – – – 15
Trade, finance lease, loan and other receivables – 20 163 – – 437 20 600
Loans receivable – 81 – – – 81 Finance lease receivables – – – – 437 437 Trade and other receivables1 – 20 082 – – – 20 082
Cash and cash equivalents – 15 823 – – – 15 823
Bank balances – 15 778 – – – 15 778 Unsettled deals – 45 – – – 45
1 746 35 986 6 839 – 15 770 60 341
Financial liabilitiesDebt securities and borrowings – – – 388 684 – 388 684
Eskom bonds – – – 146 172 – 146 172 Commercial paper – – – 2 275 – 2 275 Eurorand zero coupon bonds – – – 5 711 – 5 711 Foreign bonds – – – 47 608 – 47 608 Development financing institutions – – – 119 854 – 119 854 Export credit facilities – – – 31 735 – 31 735 Floating rate notes – – – 2 005 – 2 005 Other loans – – – 33 324 – 33 324
Embedded derivatives – – – – 5 291 5 291 Derivatives held for risk management 3 593 – – – 17 873 21 466
Foreign exchange contracts 2 643 – – – 638 3 281 Cross-currency swaps 858 – – – 17 235 18 093 Credit default swaps 92 – – – – 92
Trade, finance lease and other payables – – – 32 431 9 819 42 250
Finance lease payables – – – – 9 819 9 819 Trade and other payables1 – – – 32 431 – 32 431
Financial trading liabilities 249 – – – – 249
Short-sold government bonds 8 – – – – 8 Repurchase agreements 241 – – – – 241
3 842 – – 421 115 32 983 457 940
1. VAT receivable and payable to the South African Revenue Service is not included in this f igure as it is not a f inancial instrument.
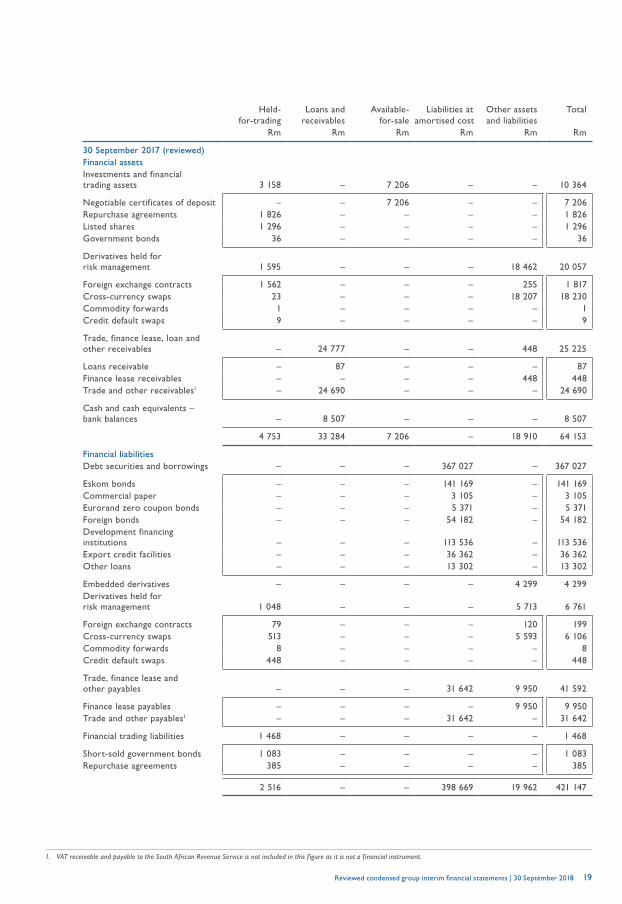
Reviewed condensed group interim financial statements | 30 September 2018 19
Held-for-trading
Loans and receivables
Available-for-sale
Liabilities at amortised cost
Other assets and liabilities
Total
Rm Rm Rm Rm Rm Rm
30 September 2017 (reviewed)Financial assetsInvestments and financial trading assets 3 158 – 7 206 – – 10 364
Negotiable certificates of deposit – – 7 206 – – 7 206 Repurchase agreements 1 826 – – – – 1 826 Listed shares 1 296 – – – – 1 296 Government bonds 36 – – – – 36
Derivatives held for risk management 1 595 – – – 18 462 20 057
Foreign exchange contracts 1 562 – – – 255 1 817 Cross-currency swaps 23 – – – 18 207 18 230 Commodity forwards 1 – – – – 1 Credit default swaps 9 – – – – 9
Trade, finance lease, loan and other receivables – 24 777 – – 448 25 225
Loans receivable – 87 – – – 87 Finance lease receivables – – – – 448 448 Trade and other receivables1 – 24 690 – – – 24 690
Cash and cash equivalents – bank balances – 8 507 – – – 8 507
4 753 33 284 7 206 – 18 910 64 153
Financial liabilitiesDebt securities and borrowings – – – 367 027 – 367 027
Eskom bonds – – – 141 169 – 141 169 Commercial paper – – – 3 105 – 3 105 Eurorand zero coupon bonds – – – 5 371 – 5 371 Foreign bonds – – – 54 182 – 54 182 Development financing institutions – – – 113 536 – 113 536 Export credit facilities – – – 36 362 – 36 362 Other loans – – – 13 302 – 13 302
Embedded derivatives – – – – 4 299 4 299 Derivatives held for risk management 1 048 – – – 5 713 6 761
Foreign exchange contracts 79 – – – 120 199 Cross-currency swaps 513 – – – 5 593 6 106 Commodity forwards 8 – – – – 8 Credit default swaps 448 – – – – 448
Trade, finance lease and other payables – – – 31 642 9 950 41 592
Finance lease payables – – – – 9 950 9 950 Trade and other payables1 – – – 31 642 – 31 642
Financial trading liabilities 1 468 – – – – 1 468
Short-sold government bonds 1 083 – – – – 1 083 Repurchase agreements 385 – – – – 385
2 516 – – 398 669 19 962 421 147
1. VAT receivable and payable to the South African Revenue Service is not included in this f igure as it is not a f inancial instrument.
Eskom Holdings SOC Ltd 20
Selected notes to the condensed group interim financial statements (continued)for the six months ended 30 September 2018
15. Accounting classification and fair value (continued)15.2 Fair value
The relevant disclosure for assets and liabilities that are measured at fair value in the statement of financial position and for fair value measurement using significant unobservable inputs (level 3) are provided below.
Valuation processesThe group has established a control framework with respect to the measurement of fair values. It includes a valuation team that ultimately reports to the chief financial officer and has overall responsibility for all significant fair value measurements.
The valuation team regularly reviews significant unobservable inputs and valuation adjustments. If third party information, such as broker quotes or pricing services, is used to measure fair value, then the valuation team assesses and documents the evidence obtained from the third parties to support their conclusion that such valuations meet the requirements of IFRS, including the level to which the fair value hierarchy that the resulting fair value estimate should be classified.
Principal marketsThe group is involved in various principal markets because of the unique funding activities undertaken. The fair value is determined by each participant in the different principal markets. The principal markets are:• capital and money markets• development financing institutions• export credit agencies
Fair value hierarchyThere was no change in the valuation technique applied. The hierarchy levels are defined as follows:Level 1: Quoted prices (unadjusted) in active markets for identical assets or liabilities.Level 2: Inputs other than quoted prices included within level 1 that are observable for the asset or liability, either directly (ie as
prices) or indirectly (ie derived from prices).Level 3: Inputs for the financial asset or liability that are not based on observable market data (unobservable inputs).
Eskom’s policy for determining when transfers between levels in the hierarchy have occurred includes monitoring of the following factors:• changes in market and trading activity (eg significant increases/decreases in activity)• changes in inputs used in valuation techniques (eg inputs becoming/ceasing to be observable in the market)
The group recognises transfers between levels of the fair value hierarchy at the end of the reporting period during which the transfers have occurred. There were no transfers between level 1, 2 or 3 of the fair value hierarchy during the six months ended 30 September 2018 nor in the comparative periods presented.
The valuation techniques used are as follows:
Level 1: Quoted prices (unadjusted) in active marketsThe fair values of financial instruments traded in active markets are based on quoted market prices at the reporting date. A market is regarded as active when it is a market in which transactions for the asset or liability take place with sufficient frequency and volume to provide pricing information on an ongoing basis. The quoted market price used for financial assets held by the group is the current bid price. For financial liabilities included in level 1, the current ask price is used. Instruments included in level 1 comprise listed investments classified as FVTPL.
Level 2: Inputs other than quoted prices included within level 1 that are observableFinancial instrument Fair value determination
Derivatives held for risk management
Valuation determined with reference to broker quotes as well as use of discounted cash flow and option pricing models. Broker quotes are tested for reasonableness by discounting expected future cash flows using a market interest rate for a similar instrument at the measurement date
Valuations of cross-currency swaps include the credit risk of Eskom (known as debit value adjustment) and counterparties (known as credit value adjustment) where appropriate. A stochastic modelling approach is followed where the expected future exposure to credit risk for Eskom and its counterparties (considering default probabilities and recovery rates derived from market data) is modelled
Non-derivatives A discounted cash flow technique is used, which uses expected cash flows and a market-related discount rate
Reviewed condensed group interim financial statements | 30 September 2018 21
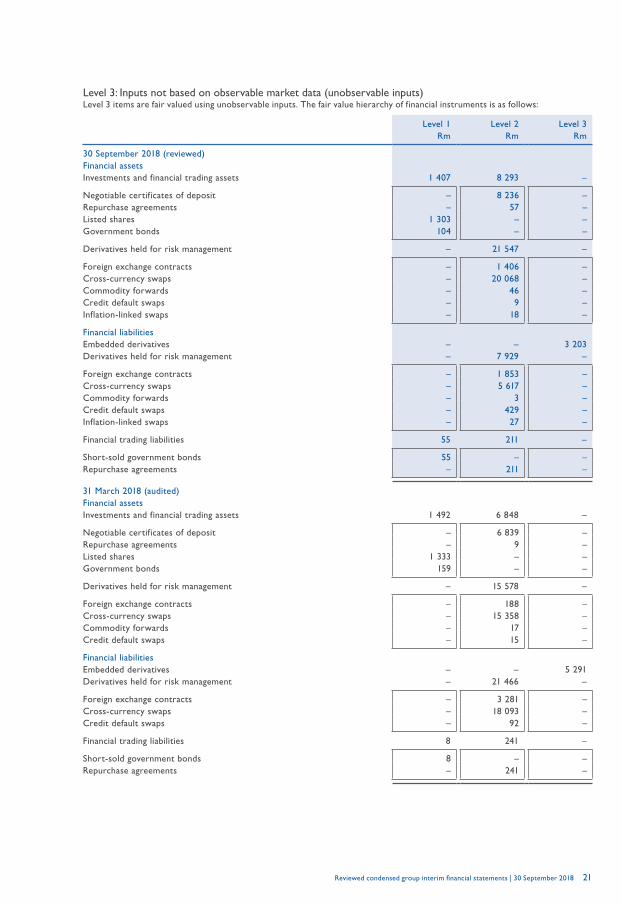
Level 3: Inputs not based on observable market data (unobservable inputs)Level 3 items are fair valued using unobservable inputs. The fair value hierarchy of financial instruments is as follows:
Level 1 Level 2 Level 3Rm Rm Rm
30 September 2018 (reviewed)Financial assetsInvestments and financial trading assets 1 407 8 293 –
Negotiable certificates of deposit – 8 236 – Repurchase agreements – 57 – Listed shares 1 303 – – Government bonds 104 – –
Derivatives held for risk management – 21 547 –
Foreign exchange contracts – 1 406 – Cross-currency swaps – 20 068 – Commodity forwards – 46 – Credit default swaps – 9 – Inflation-linked swaps – 18 –
Financial liabilitiesEmbedded derivatives – – 3 203 Derivatives held for risk management – 7 929 –
Foreign exchange contracts – 1 853 – Cross-currency swaps – 5 617 – Commodity forwards – 3 – Credit default swaps – 429 – Inflation-linked swaps – 27 –
Financial trading liabilities 55 211 –
Short-sold government bonds 55 – – Repurchase agreements – 211 –
31 March 2018 (audited)Financial assetsInvestments and financial trading assets 1 492 6 848 –
Negotiable certificates of deposit – 6 839 – Repurchase agreements – 9 – Listed shares 1 333 – – Government bonds 159 – –
Derivatives held for risk management – 15 578 –
Foreign exchange contracts – 188 – Cross-currency swaps – 15 358 – Commodity forwards – 17 – Credit default swaps – 15 –
Financial liabilitiesEmbedded derivatives – – 5 291 Derivatives held for risk management – 21 466 –
Foreign exchange contracts – 3 281 – Cross-currency swaps – 18 093 – Credit default swaps – 92 –
Financial trading liabilities 8 241 –
Short-sold government bonds 8 – – Repurchase agreements – 241 –
Eskom Holdings SOC Ltd 22
Selected notes to the condensed group interim financial statements (continued)for the six months ended 30 September 2018
15. Accounting classification and fair value (continued)15.2 Fair value (continued)
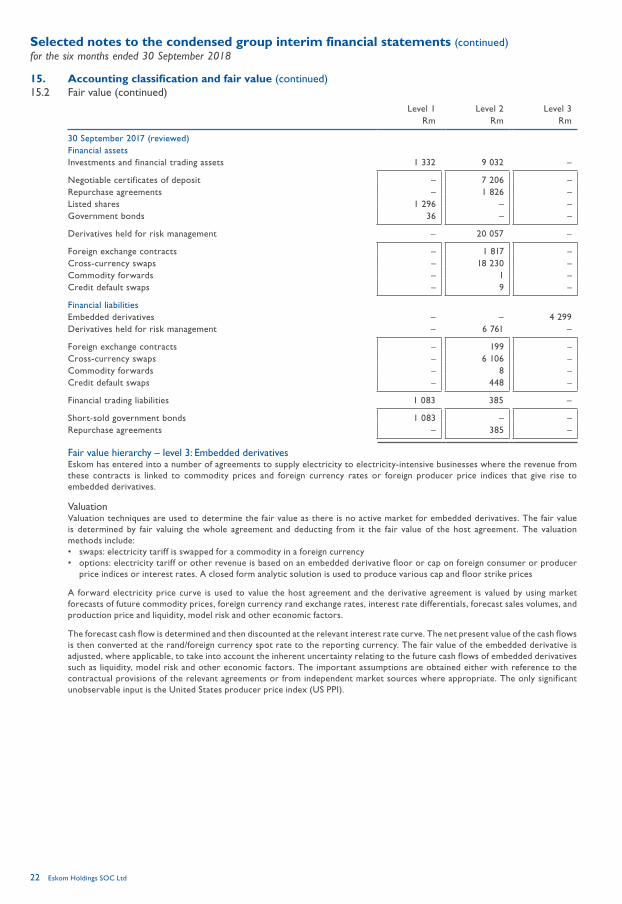
Level 1 Level 2 Level 3Rm Rm Rm
30 September 2017 (reviewed)Financial assetsInvestments and financial trading assets 1 332 9 032 –
Negotiable certificates of deposit – 7 206 – Repurchase agreements – 1 826 – Listed shares 1 296 – – Government bonds 36 – –
Derivatives held for risk management – 20 057 –
Foreign exchange contracts – 1 817 – Cross-currency swaps – 18 230 – Commodity forwards – 1 – Credit default swaps – 9 –
Financial liabilitiesEmbedded derivatives – – 4 299 Derivatives held for risk management – 6 761 –
Foreign exchange contracts – 199 – Cross-currency swaps – 6 106 – Commodity forwards – 8 – Credit default swaps – 448 –
Financial trading liabilities 1 083 385 –
Short-sold government bonds 1 083 – – Repurchase agreements – 385 –
Fair value hierarchy – level 3: Embedded derivativesEskom has entered into a number of agreements to supply electricity to electricity-intensive businesses where the revenue from these contracts is linked to commodity prices and foreign currency rates or foreign producer price indices that give rise to embedded derivatives.
ValuationValuation techniques are used to determine the fair value as there is no active market for embedded derivatives. The fair value is determined by fair valuing the whole agreement and deducting from it the fair value of the host agreement. The valuation methods include:• swaps: electricity tariff is swapped for a commodity in a foreign currency• options: electricity tariff or other revenue is based on an embedded derivative floor or cap on foreign consumer or producer
price indices or interest rates. A closed form analytic solution is used to produce various cap and floor strike prices
A forward electricity price curve is used to value the host agreement and the derivative agreement is valued by using market forecasts of future commodity prices, foreign currency rand exchange rates, interest rate differentials, forecast sales volumes, and production price and liquidity, model risk and other economic factors.
The forecast cash flow is determined and then discounted at the relevant interest rate curve. The net present value of the cash flows is then converted at the rand/foreign currency spot rate to the reporting currency. The fair value of the embedded derivative is adjusted, where applicable, to take into account the inherent uncertainty relating to the future cash flows of embedded derivatives such as liquidity, model risk and other economic factors. The important assumptions are obtained either with reference to the contractual provisions of the relevant agreements or from independent market sources where appropriate. The only significant unobservable input is the United States producer price index (US PPI).
Reviewed condensed group interim financial statements | 30 September 2018 23
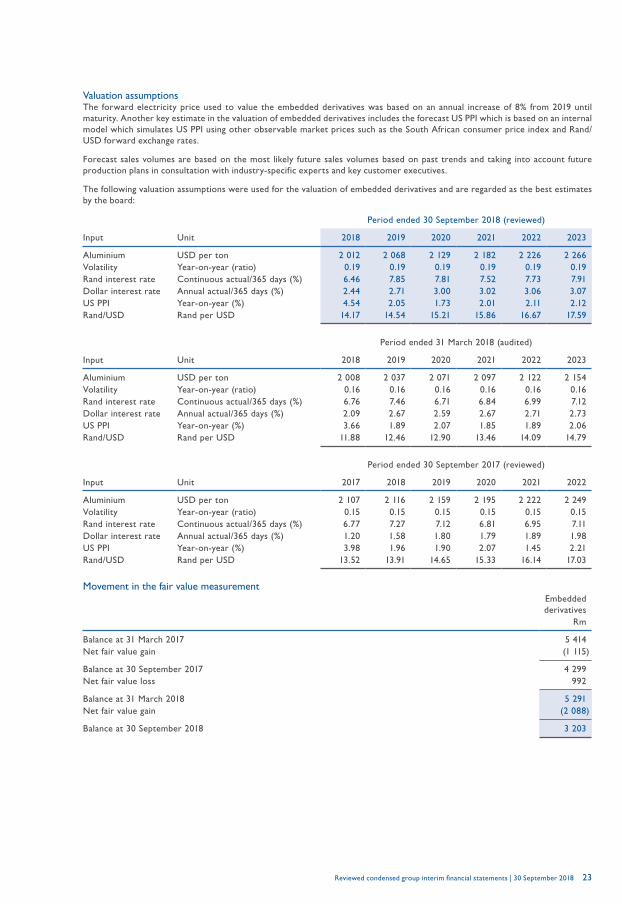
Valuation assumptionsThe forward electricity price used to value the embedded derivatives was based on an annual increase of 8% from 2019 until maturity. Another key estimate in the valuation of embedded derivatives includes the forecast US PPI which is based on an internal model which simulates US PPI using other observable market prices such as the South African consumer price index and Rand/USD forward exchange rates.
Forecast sales volumes are based on the most likely future sales volumes based on past trends and taking into account future production plans in consultation with industry-specific experts and key customer executives.
The following valuation assumptions were used for the valuation of embedded derivatives and are regarded as the best estimates by the board:
Period ended 30 September 2018 (reviewed)
Input Unit 2018 2019 2020 2021 2022 2023
Aluminium USD per ton 2 012 2 068 2 129 2 182 2 226 2 266 Volatility Year-on-year (ratio) 0.19 0.19 0.19 0.19 0.19 0.19 Rand interest rate Continuous actual/365 days (%) 6.46 7.85 7.81 7.52 7.73 7.91 Dollar interest rate Annual actual/365 days (%) 2.44 2.71 3.00 3.02 3.06 3.07 US PPI Year-on-year (%) 4.54 2.05 1.73 2.01 2.11 2.12 Rand/USD Rand per USD 14.17 14.54 15.21 15.86 16.67 17.59
Period ended 31 March 2018 (audited)
Input Unit 2018 2019 2020 2021 2022 2023
Aluminium USD per ton 2 008 2 037 2 071 2 097 2 122 2 154 Volatility Year-on-year (ratio) 0.16 0.16 0.16 0.16 0.16 0.16 Rand interest rate Continuous actual/365 days (%) 6.76 7.46 6.71 6.84 6.99 7.12 Dollar interest rate Annual actual/365 days (%) 2.09 2.67 2.59 2.67 2.71 2.73 US PPI Year-on-year (%) 3.66 1.89 2.07 1.85 1.89 2.06 Rand/USD Rand per USD 11.88 12.46 12.90 13.46 14.09 14.79
Period ended 30 September 2017 (reviewed)
Input Unit 2017 2018 2019 2020 2021 2022
Aluminium USD per ton 2 107 2 116 2 159 2 195 2 222 2 249Volatility Year-on-year (ratio) 0.15 0.15 0.15 0.15 0.15 0.15Rand interest rate Continuous actual/365 days (%) 6.77 7.27 7.12 6.81 6.95 7.11Dollar interest rate Annual actual/365 days (%) 1.20 1.58 1.80 1.79 1.89 1.98US PPI Year-on-year (%) 3.98 1.96 1.90 2.07 1.45 2.21Rand/USD Rand per USD 13.52 13.91 14.65 15.33 16.14 17.03
Movement in the fair value measurementEmbedded derivatives
Rm
Balance at 31 March 2017 5 414 Net fair value gain (1 115)
Balance at 30 September 2017 4 299 Net fair value loss 992
Balance at 31 March 2018 5 291 Net fair value gain (2 088)
Balance at 30 September 2018 3 203
Eskom Holdings SOC Ltd 24
Selected notes to the condensed group interim financial statements (continued)for the six months ended 30 September 2018
15. Accounting classification and fair value (continued)15.2 Fair value (continued)
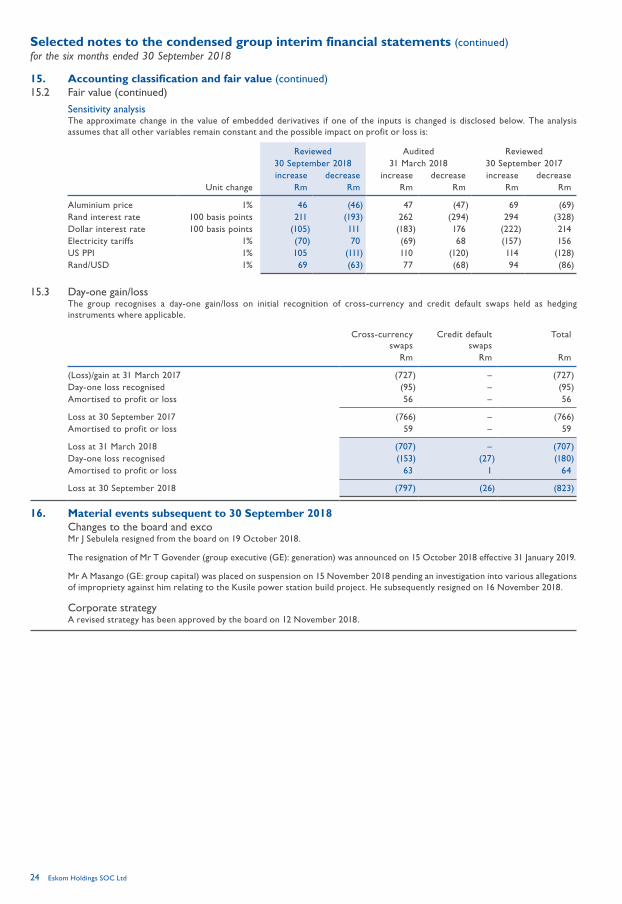
Sensitivity analysisThe approximate change in the value of embedded derivatives if one of the inputs is changed is disclosed below. The analysis assumes that all other variables remain constant and the possible impact on profit or loss is:
Reviewed Audited Reviewed30 September 2018 31 March 2018 30 September 2017increase decrease increase decrease increase decrease
Unit change Rm Rm Rm Rm Rm Rm
Aluminium price 1% 46 (46) 47 (47) 69 (69)Rand interest rate 100 basis points 211 (193) 262 (294) 294 (328)Dollar interest rate 100 basis points (105) 111 (183) 176 (222) 214 Electricity tariffs 1% (70) 70 (69) 68 (157) 156 US PPI 1% 105 (111) 110 (120) 114 (128)Rand/USD 1% 69 (63) 77 (68) 94 (86)
15.3 Day-one gain/lossThe group recognises a day-one gain/loss on initial recognition of cross-currency and credit default swaps held as hedging instruments where applicable.
Cross-currency swaps
Credit default swaps
Total
Rm Rm Rm
(Loss)/gain at 31 March 2017 (727) – (727)Day-one loss recognised (95) – (95)Amortised to profit or loss 56 – 56
Loss at 30 September 2017 (766) – (766)Amortised to profit or loss 59 – 59
Loss at 31 March 2018 (707) – (707)Day-one loss recognised (153) (27) (180)Amortised to profit or loss 63 1 64
Loss at 30 September 2018 (797) (26) (823)
16. Material events subsequent to 30 September 2018Changes to the board and excoMr J Sebulela resigned from the board on 19 October 2018.
The resignation of Mr T Govender (group executive (GE): generation) was announced on 15 October 2018 effective 31 January 2019.
Mr A Masango (GE: group capital) was placed on suspension on 15 November 2018 pending an investigation into various allegations of impropriety against him relating to the Kusile power station build project. He subsequently resigned on 16 November 2018.
Corporate strategyA revised strategy has been approved by the board on 12 November 2018.
Reviewed condensed group interim financial statements | 30 September 2018 25
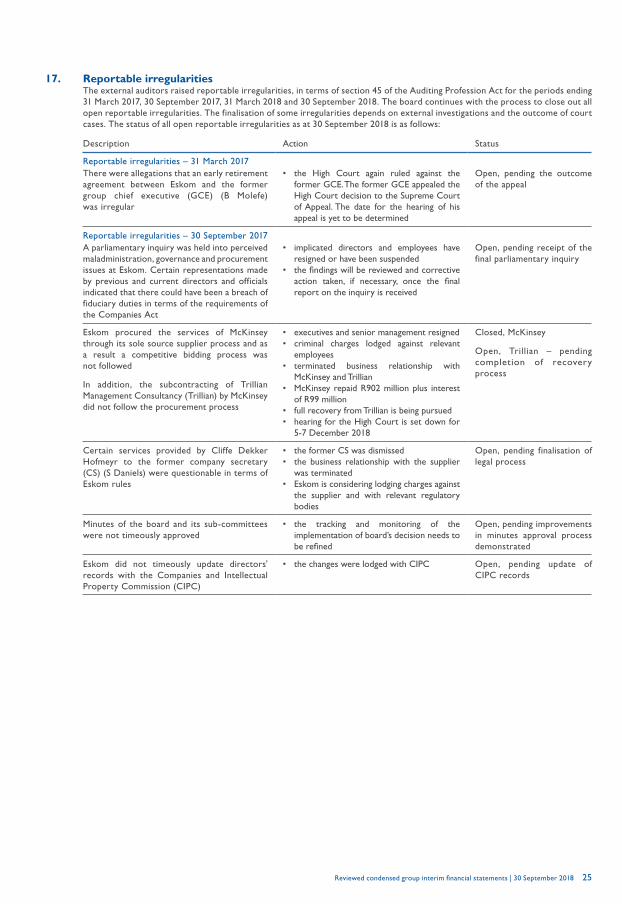
17. Reportable irregularitiesThe external auditors raised reportable irregularities, in terms of section 45 of the Auditing Profession Act for the periods ending 31 March 2017, 30 September 2017, 31 March 2018 and 30 September 2018. The board continues with the process to close out all open reportable irregularities. The finalisation of some irregularities depends on external investigations and the outcome of court cases. The status of all open reportable irregularities as at 30 September 2018 is as follows:
Description Action Status
Reportable irregularities – 31 March 2017There were allegations that an early retirement agreement between Eskom and the former group chief executive (GCE) (B Molefe) was irregular
• the High Court again ruled against the former GCE. The former GCE appealed the High Court decision to the Supreme Court of Appeal. The date for the hearing of his appeal is yet to be determined
Open, pending the outcome of the appeal
Reportable irregularities – 30 September 2017A parliamentary inquiry was held into perceived maladministration, governance and procurement issues at Eskom. Certain representations made by previous and current directors and officials indicated that there could have been a breach of fiduciary duties in terms of the requirements of the Companies Act
• implicated directors and employees have resigned or have been suspended
• the findings will be reviewed and corrective action taken, if necessary, once the final report on the inquiry is received
Open, pending receipt of the final parliamentary inquiry
Eskom procured the services of McKinsey through its sole source supplier process and as a result a competitive bidding process was not followed
In addition, the subcontracting of Trillian Management Consultancy (Trillian) by McKinsey did not follow the procurement process
• executives and senior management resigned• criminal charges lodged against relevant
employees• terminated business relationship with
McKinsey and Trillian• McKinsey repaid R902 million plus interest
of R99 million• full recovery from Trillian is being pursued• hearing for the High Court is set down for
5-7 December 2018
Closed, McKinsey
Open, Trillian – pending completion of recovery process
Certain services provided by Cliffe Dekker Hofmeyr to the former company secretary (CS) (S Daniels) were questionable in terms of Eskom rules
• the former CS was dismissed• the business relationship with the supplier
was terminated• Eskom is considering lodging charges against
the supplier and with relevant regulatory bodies
Open, pending finalisation of legal process
Minutes of the board and its sub-committees were not timeously approved
• the tracking and monitoring of the implementation of board’s decision needs to be refined
Open, pending improvements in minutes approval process demonstrated
Eskom did not timeously update directors' records with the Companies and Intellectual Property Commission (CIPC)
• the changes were lodged with CIPC Open, pending update of CIPC records
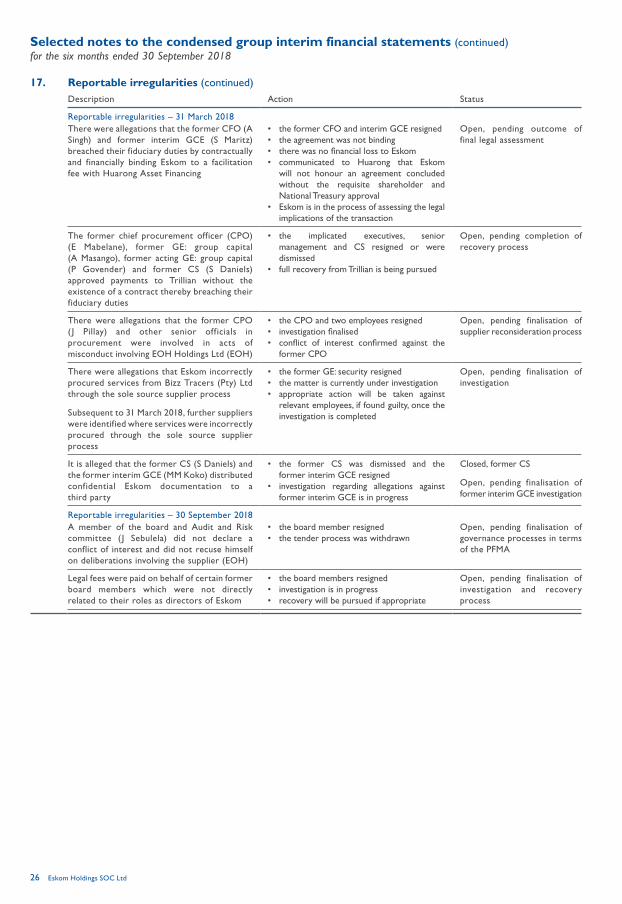
Eskom Holdings SOC Ltd 26
Selected notes to the condensed group interim financial statements (continued)for the six months ended 30 September 2018
17. Reportable irregularities (continued)Description Action Status
Reportable irregularities – 31 March 2018There were allegations that the former CFO (A Singh) and former interim GCE (S Maritz) breached their fiduciary duties by contractually and financially binding Eskom to a facilitation fee with Huarong Asset Financing
• the former CFO and interim GCE resigned• the agreement was not binding• there was no financial loss to Eskom• communicated to Huarong that Eskom
will not honour an agreement concluded without the requisite shareholder and National Treasury approval
• Eskom is in the process of assessing the legal implications of the transaction
Open, pending outcome of final legal assessment
The former chief procurement officer (CPO) (E Mabelane), former GE: group capital (A Masango), former acting GE: group capital (P Govender) and former CS (S Daniels) approved payments to Trillian without the existence of a contract thereby breaching their fiduciary duties
• the implicated executives, senior management and CS resigned or were dismissed
• full recovery from Trillian is being pursued
Open, pending completion of recovery process
There were allegations that the former CPO (J Pillay) and other senior officials in procurement were involved in acts of misconduct involving EOH Holdings Ltd (EOH)
• the CPO and two employees resigned• investigation finalised• conflict of interest confirmed against the
former CPO
Open, pending finalisation of supplier reconsideration process
There were allegations that Eskom incorrectly procured services from Bizz Tracers (Pty) Ltd through the sole source supplier process
Subsequent to 31 March 2018, further suppliers were identified where services were incorrectly procured through the sole source supplier process
• the former GE: security resigned• the matter is currently under investigation• appropriate action will be taken against
relevant employees, if found guilty, once the investigation is completed
Open, pending finalisation of investigation
It is alleged that the former CS (S Daniels) and the former interim GCE (MM Koko) distributed confidential Eskom documentation to a third party
• the former CS was dismissed and the former interim GCE resigned
• investigation regarding allegations against former interim GCE is in progress
Closed, former CS
Open, pending finalisation of former interim GCE investigation
Reportable irregularities – 30 September 2018A member of the board and Audit and Risk committee (J Sebulela) did not declare a conflict of interest and did not recuse himself on deliberations involving the supplier (EOH)
• the board member resigned• the tender process was withdrawn
Open, pending finalisation of governance processes in terms of the PFMA
Legal fees were paid on behalf of certain former board members which were not directly related to their roles as directors of Eskom
• the board members resigned• investigation is in progress• recovery will be pursued if appropriate
Open, pending finalisation of investigation and recovery process
Reviewed condensed group interim financial statements | 30 September 2018 27
18. New standards and interpretationsEskom is in the process of implementing the following standard that will be applicable in the 2020 financial year:
Topic Summary of requirements Comment
IFRS 16 Leases (1 January 2019)
IFRS 16 replaces IAS 17 Leases, IFRIC 4 Determining whether an arrangement contains a lease, SIC-15 Operating leases – incentives and SIC-27 Evaluating the substance of transactions involving the legal form of a lease
Lessee accounting
IFRS 16 introduces a single, on-balance sheet lease accounting model for lessees. A lessee is required to recognise a right-of-use asset representing its right to use the underlying leased asset and a lease liability representing its obligation to make lease payments. There are recognition exemptions for short-term leases and leases of low-value items
A lessee measures right-of-use assets similarly to other non-financial assets (such as property, plant and equipment) and lease liabilities similarly to other financial liabilities. As a consequence, a lessee recognises depreciation of the right-of-use asset and interest on the lease liability, and also classifies cash repayments of the lease liability into a principal portion and an interest portion and presents them in the statement of cash flows applying IAS 7 Statement of cash flows
Assets and liabilities arising from a lease are initially measured on a present value basis. The measurement includes non-cancellable lease payments (including inflation-linked payments), and also includes payments to be made in optional periods if the lessee is reasonably certain to exercise an option to extend the lease, or not to exercise an option to terminate the lease
Lessees will need to apply judgement in deciding on the information to disclose to meet the objective of providing a basis for users of financial statements to assess the effect that leases have on the financial position, financial performance and cash flows of the lessee
IFRS 16 can be applied using either a retrospective approach or a modified retrospective approach with optional practical expedients for lessees. The lessee will have to apply any elections consistently to all of its leases
When applying the modified retrospective approach to leases previously classified as operating leases under IAS 17, the lessee can elect, on a lease-by-lease basis, whether to apply a number of practical expedients on transition
The group is preparing for the transition to IFRS 16 with effect from 1 April 2019 and has developed a detailed plan to assess the impact of IFRS 16 on initial adoption as well as thereafter
A detailed review of a representative sample of contracts is being analysed to determine the impact of the new lease definition under IFRS 16
The new standard may potentially result in additional assets and liabilities to be recognised. The quantification of the impact will be performed as part of the implementation project
Financial statement disclosures will be updated to ensure compliance with IFRS 16 requirements, including the implications of adoption of the various transition options
Lessor accounting
IFRS 16 substantially carries forward the lessor accounting requirements in IAS 17. Accordingly, a lessor continues to classify its leases as operating or finance leases, and to account for those two types of leases differently
IFRS 16 also requires enhanced disclosures to be provided about a lessor’s risk exposure, particularly to residual value risk
Eskom Holdings SOC Ltd 28
Contact details
Telephone numbers Websites and email addresses
Eskom head office +27 11 800 8111 Eskom website www.eskom.co.za [email protected]
Eskom Media Desk +27 11 800 3304+27 11 800 3309+27 11 800 3343 +27 11 800 3378+27 82 805 7278
Eskom Media Desk [email protected]
Investor Relations +27 11 800 2775 Investor Relations [email protected]
Eskom Corporate Affairs +27 11 800 2323 Eskom integrated results www.eskom.co.za/IR2018
Toll-free Crime Line 0800 112 722 Feedback on our report [email protected]
Eskom Development Foundation
+27 11 800 8111 Eskom Development Foundation
www.eskom.co.za/[email protected]
National Call Centre 08600 ESKOM or08600 37566
Promotion of Access to Information Act requests
Customer SMS line 35328 Integrated demand management and energy advice
CS (customer service) mobile Dial *120*6937566# or *120*myeskom#
Customer Service [email protected]
MyEskom mobi-site www.myeskom.co.za MyEskom app
EskomSouthAfrica Twitter Eskom_SA
Physical address Postal address
Eskom Megawatt Park 2 Maxwell Drive Sunninghill Sandton2157
PO Box 1091 Johannesburg 2000
Company secretary Company registration number
Office of the company secretaryPO Box 1091Johannesburg 2000
Eskom Holdings SOC Ltd 2002/015527/30
Contact details

JOINT VENTURE [0003]
