review of maryland approaches to state assessments...
TRANSCRIPT

Review of Maryland Approaches to State Assessments Measures
Annapolis
September 17, 2014
Jack Smith, Chief Academic Officer Dave Volrath, Planning and Development Officer
Ben Feldman, Subject Matter Expert

The Mandate
• The Education Reform Act of 2010 introduces Student Growth as a “significant” portion of the principal and teacher evaluation.
• Growth requires multiple measures, of which none can exceed 35 percentage points.
• RTTT language expands this to require the use of the State Assessment where it exists.
• Over the first four years of the RTTT grant, through give and take, the Assessment contribution was established as 20 percentage points.
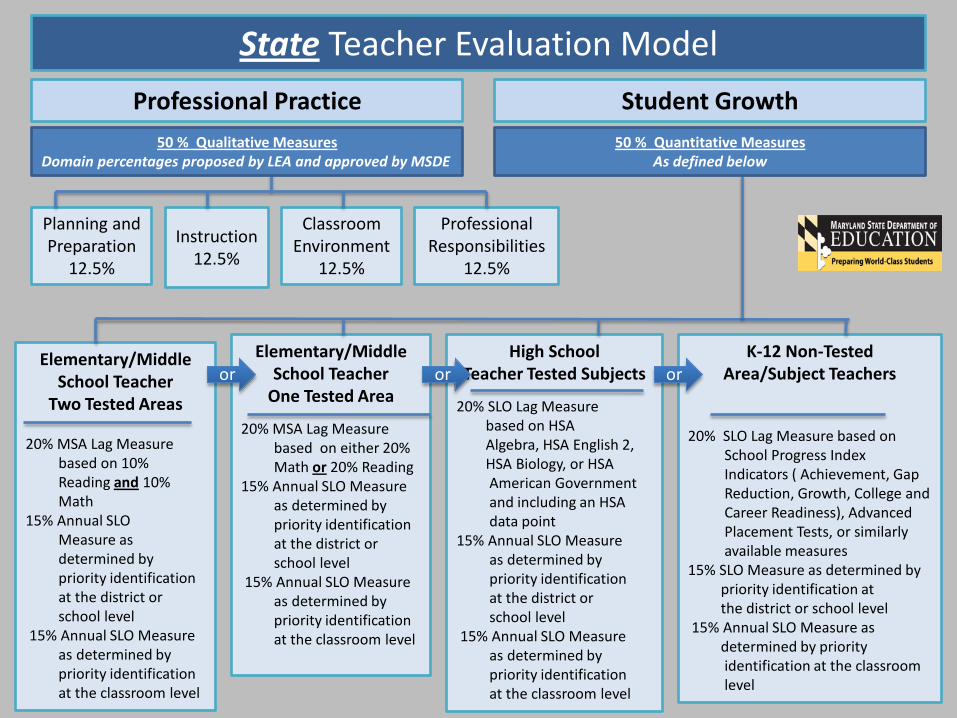
State Teacher Evaluation Model Professional Practice Student Growth
Planning and Preparation
12.5%
Instruction 12.5%
Classroom Environment
12.5%
Professional Responsibilities
12.5%
Elementary/Middle School Teacher
Two Tested Areas 20% MSA Lag Measure based on 10% Reading and 10% Math 15% Annual SLO Measure as determined by priority identification at the district or school level 15% Annual SLO Measure as determined by priority identification at the classroom level
Elementary/Middle School Teacher
One Tested Area
20% MSA Lag Measure based on either 20% Math or 20% Reading 15% Annual SLO Measure as determined by priority identification at the district or school level 15% Annual SLO Measure as determined by priority identification at the classroom level
K-12 Non-Tested Area/Subject Teachers
20% SLO Lag Measure based on School Progress Index Indicators ( Achievement, Gap Reduction, Growth, College and Career Readiness), Advanced Placement Tests, or similarly available measures 15% SLO Measure as determined by priority identification at the district or school level 15% Annual SLO Measure as determined by priority identification at the classroom level
High School Teacher Tested Subjects
20% SLO Lag Measure based on HSA Algebra, HSA English 2, HSA Biology, or HSA American Government and including an HSA data point 15% Annual SLO Measure as determined by priority identification at the district or school level 15% Annual SLO Measure as determined by priority identification at the classroom level
50 % Qualitative Measures Domain percentages proposed by LEA and approved by MSDE
or
50 % Quantitative Measures As defined below
or or
Challenges
• The existing assessments, the Maryland School Assessments or MSAs, are criterion referenced, not norm referenced.
• MSAs do not have a vertical scale nor do they assess the same material, year to year.
• Thus they do NOT support a simple model: Growth = 2014 score – 2013 score
Review of MSDE Past Experiments The 1st Approach: VAM
• In the original RTTT grant application, Maryland suggested it would explore the “Tennessee” model.
• This is a “Value Added Model” or VAM developed by William Saunders of the SAS Institute. In Tennessee this is called TVAAS and SAS sells this as EVAAS.
• This and similar VAMs are used in various states.
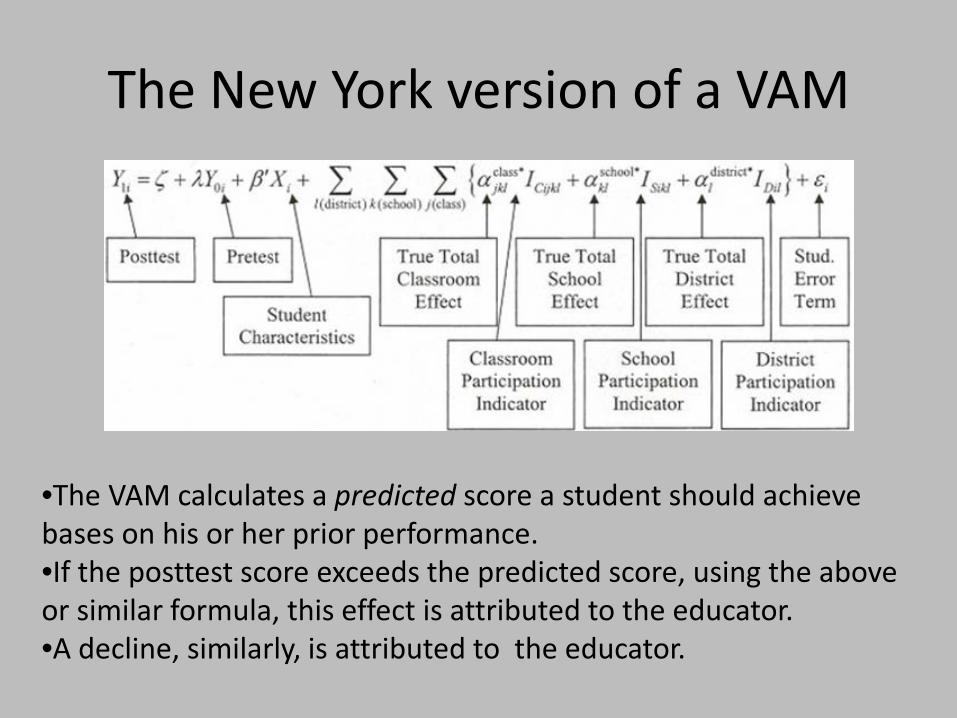
The New York version of a VAM
•The VAM calculates a predicted score a student should achieve bases on his or her prior performance. •If the posttest score exceeds the predicted score, using the above or similar formula, this effect is attributed to the educator. •A decline, similarly, is attributed to the educator.
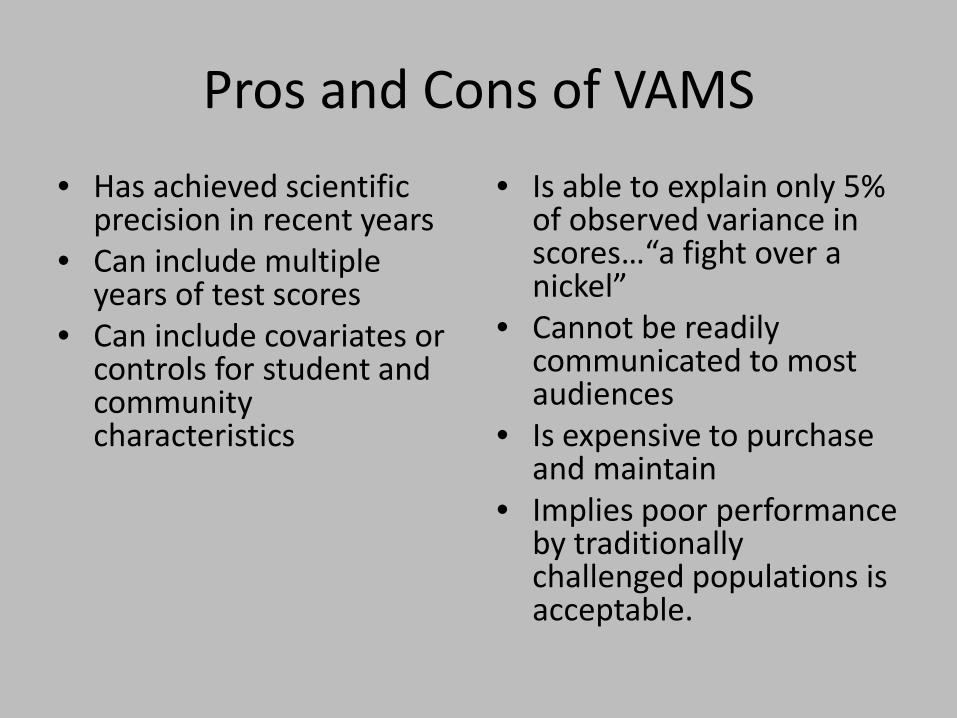
Pros and Cons of VAMS • Has achieved scientific
precision in recent years • Can include multiple
years of test scores • Can include covariates or
controls for student and community characteristics
• Is able to explain only 5% of observed variance in scores…“a fight over a nickel”
• Cannot be readily communicated to most audiences
• Is expensive to purchase and maintain
• Implies poor performance by traditionally challenged populations is acceptable.
2nd Approach: Student Growth Percentiles
• Based on the work of Damian Betebenner, developed in Colorado, and used by a large consortium of states, is the Student Growth Percentile, or SGPs
• Used by MSDE for the SFSF-required “Teacher Impact Report” in Fall 2011
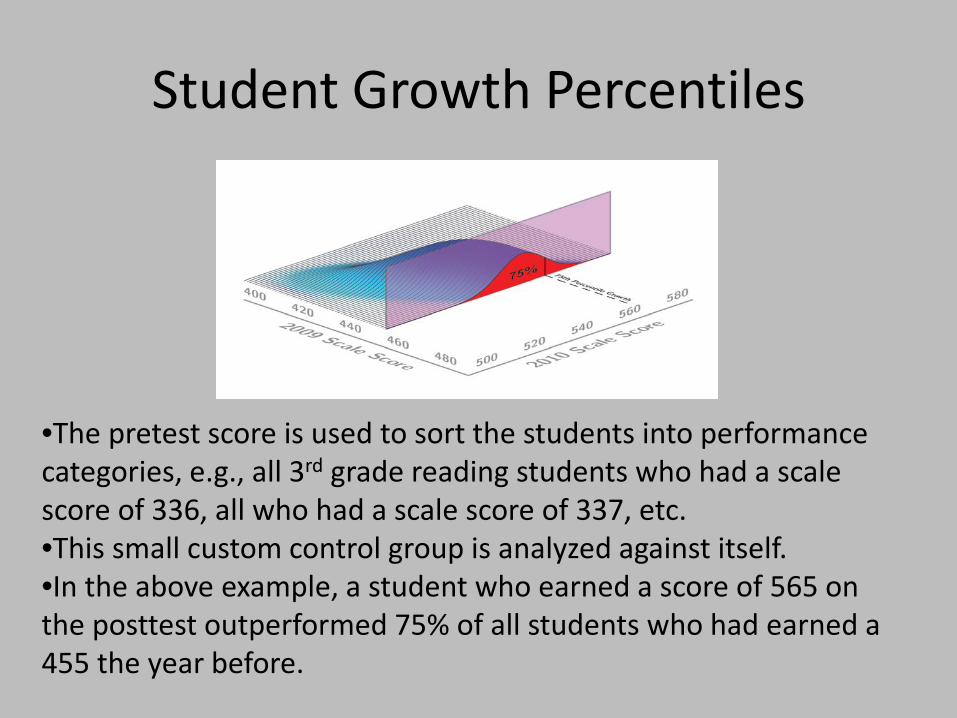
Student Growth Percentiles
•The pretest score is used to sort the students into performance categories, e.g., all 3rd grade reading students who had a scale score of 336, all who had a scale score of 337, etc. •This small custom control group is analyzed against itself. •In the above example, a student who earned a score of 565 on the posttest outperformed 75% of all students who had earned a 455 the year before.
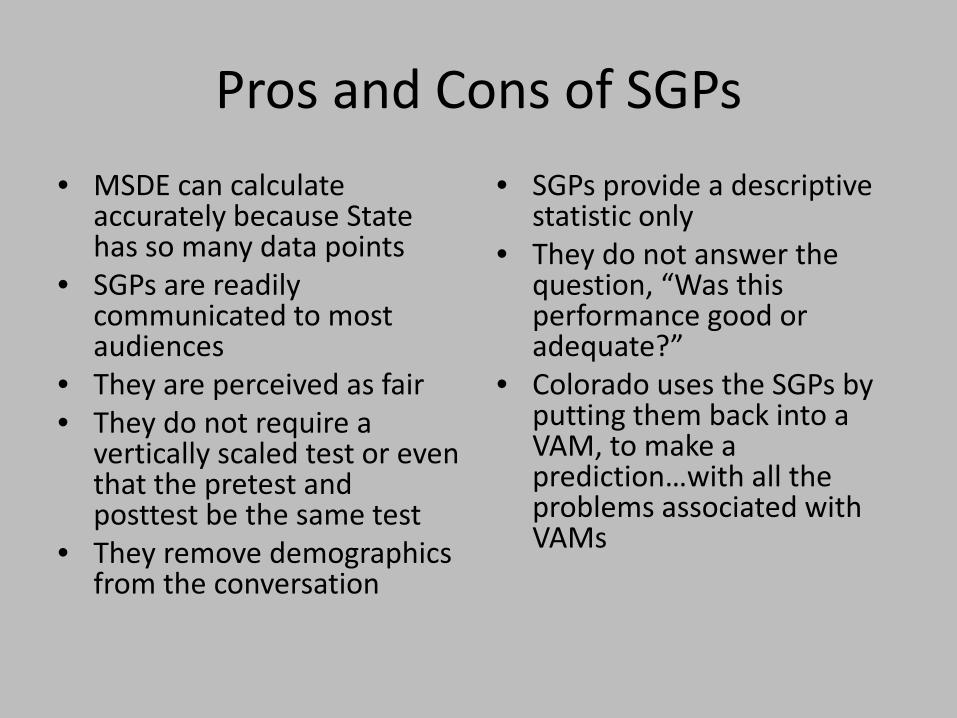
Pros and Cons of SGPs • MSDE can calculate
accurately because State has so many data points
• SGPs are readily communicated to most audiences
• They are perceived as fair • They do not require a
vertically scaled test or even that the pretest and posttest be the same test
• They remove demographics from the conversation
• SGPs provide a descriptive statistic only
• They do not answer the question, “Was this performance good or adequate?”
• Colorado uses the SGPs by putting them back into a VAM, to make a prediction…with all the problems associated with VAMs
SGPs in Maryland
• One LEA continues to use SGPs. The teacher’s average SGP is compared to the district’s average, using a test of statistical significance. If the teacher’s result is statistically significant, this result—good or bad—is the teacher’s MSA growth score.
• This particular LEA is very high performing; an average score there would be good. This model would not work for the several LEAs in the state that have struggled with their performance.
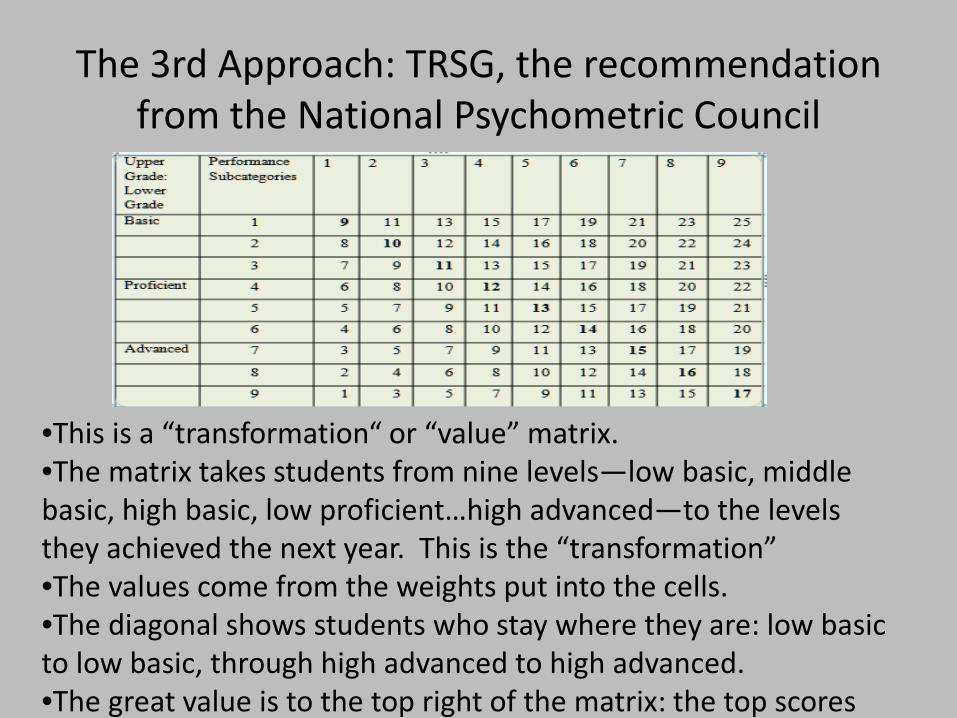
The 3rd Approach: TRSG, the recommendation from the National Psychometric Council
•This is a “transformation“ or “value” matrix. •The matrix takes students from nine levels—low basic, middle basic, high basic, low proficient…high advanced—to the levels they achieved the next year. This is the “transformation” •The values come from the weights put into the cells. •The diagonal shows students who stay where they are: low basic to low basic, through high advanced to high advanced. •The great value is to the top right of the matrix: the top scores
Pros and Cons of the TRSG Matrix
• Provides an elegant number pattern
• Stable: that is, it did not move much from year to year
• The National Psychometric Council endorsed it
• TRSG was universally criticized by all practitioner groups
• Teachers argued that success would depend entirely on the luck of the draw: getting good students
• Field testing with real data confirmed these concerns
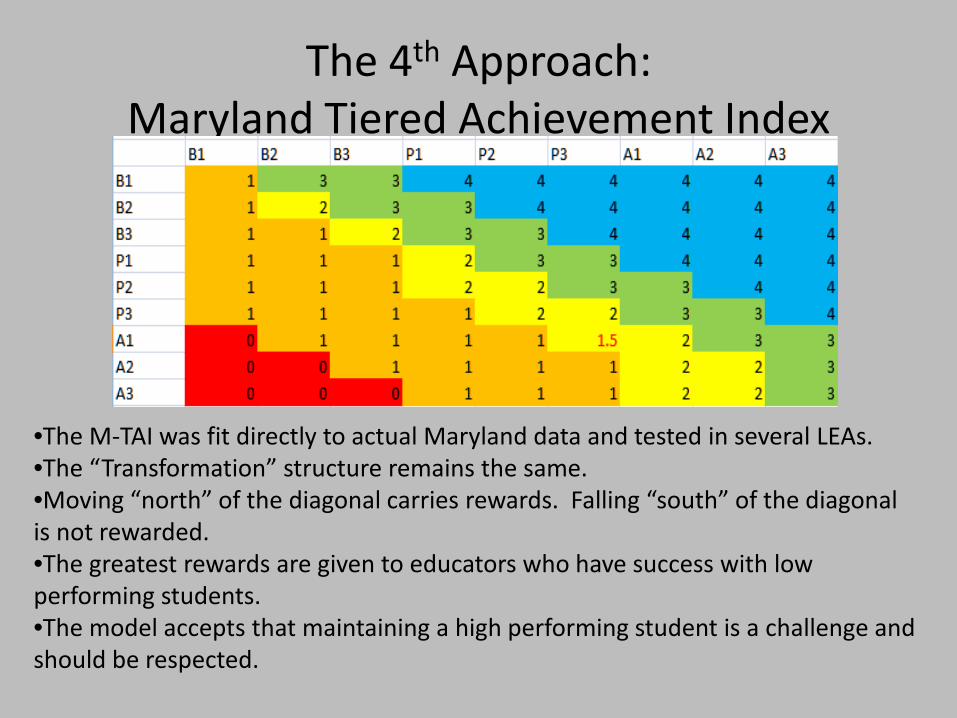
The 4th Approach: Maryland Tiered Achievement Index
•The M-TAI was fit directly to actual Maryland data and tested in several LEAs. •The “Transformation” structure remains the same. •Moving “north” of the diagonal carries rewards. Falling “south” of the diagonal is not rewarded. •The greatest rewards are given to educators who have success with low performing students. •The model accepts that maintaining a high performing student is a challenge and should be respected.
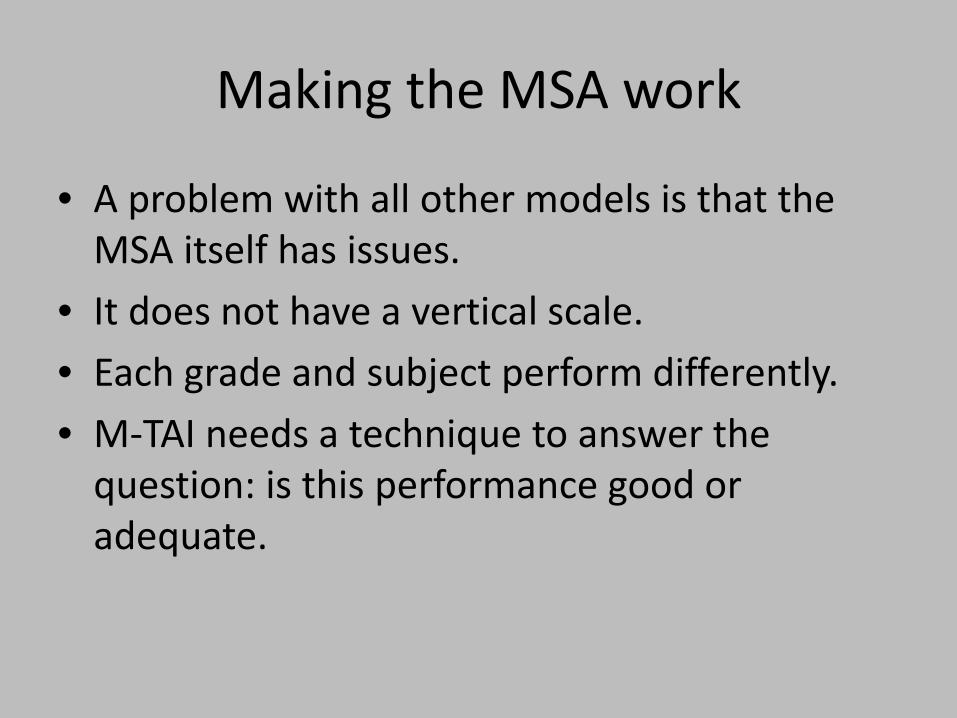
Making the MSA work
• A problem with all other models is that the MSA itself has issues.
• It does not have a vertical scale. • Each grade and subject perform differently. • M-TAI needs a technique to answer the
question: is this performance good or adequate.

The Technique for the M-TAI
1. All the teachers students are loaded into the cell that reflects their performance.
2. The teacher gets the numeric average of these students.
3. This average is compared to the Statewide standard deviations for that grade and subject.
4. Using the following approach, determinations from unacceptable to highly acceptable can be made.
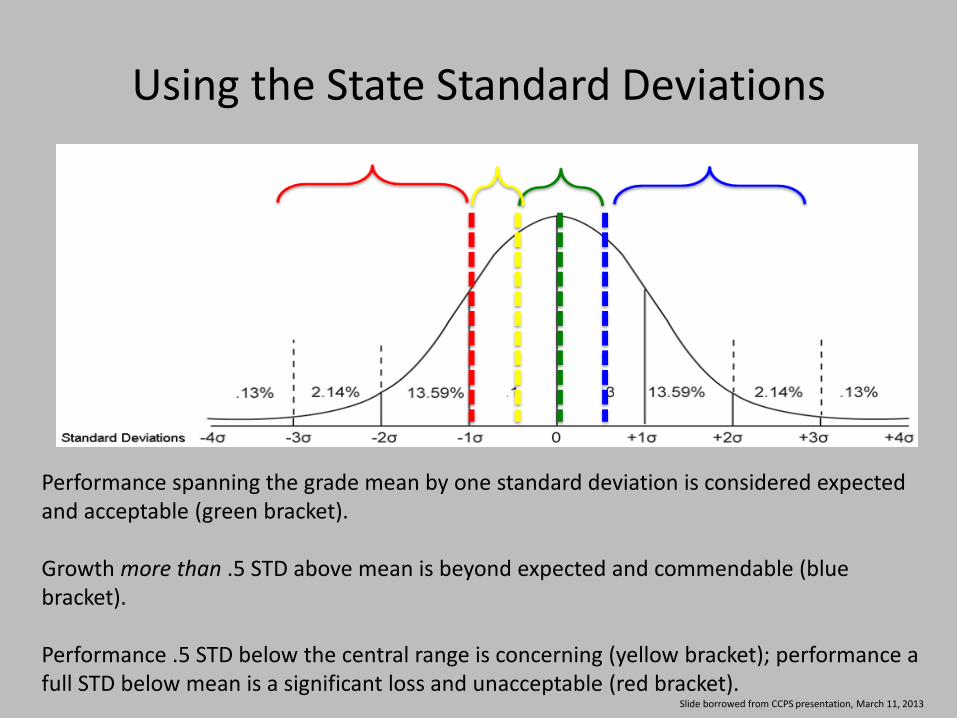
Using the State Standard Deviations
Performance spanning the grade mean by one standard deviation is considered expected and acceptable (green bracket). Growth more than .5 STD above mean is beyond expected and commendable (blue bracket). Performance .5 STD below the central range is concerning (yellow bracket); performance a full STD below mean is a significant loss and unacceptable (red bracket).
Slide borrowed from CCPS presentation, March 11, 2013
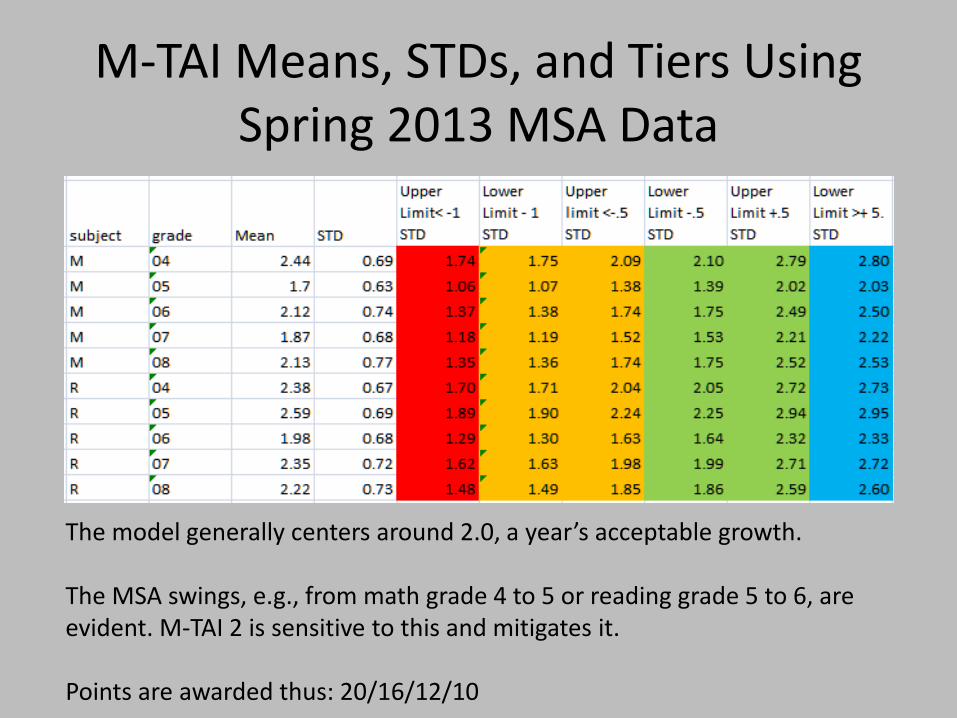
M-TAI Means, STDs, and Tiers Using Spring 2013 MSA Data
The model generally centers around 2.0, a year’s acceptable growth. The MSA swings, e.g., from math grade 4 to 5 or reading grade 5 to 6, are evident. M-TAI 2 is sensitive to this and mitigates it. Points are awarded thus: 20/16/12/10
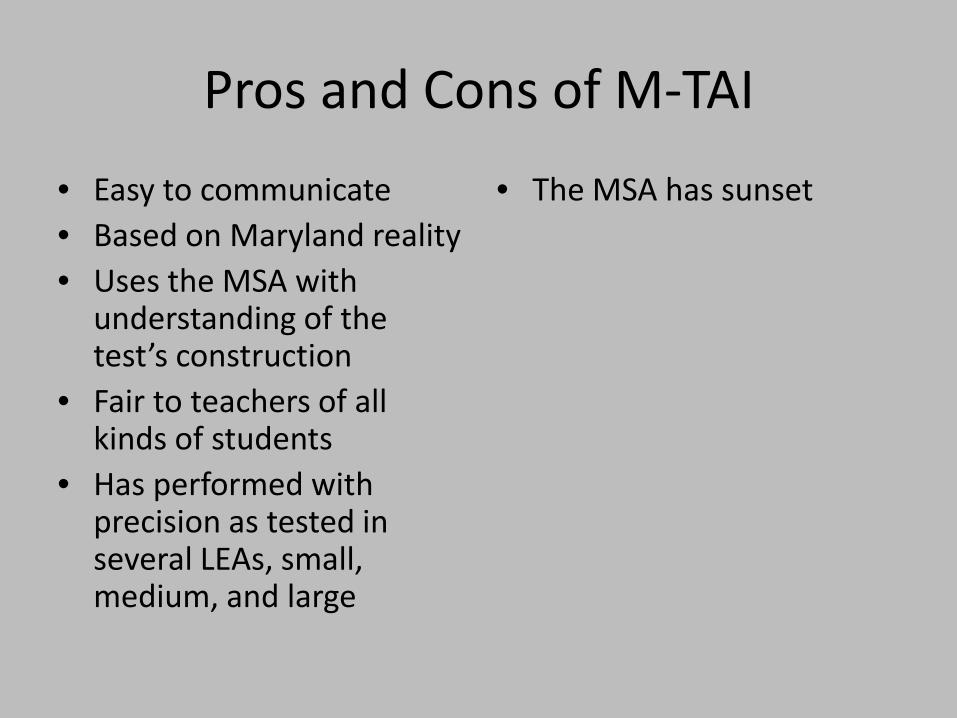
Pros and Cons of M-TAI • Easy to communicate • Based on Maryland reality • Uses the MSA with
understanding of the test’s construction
• Fair to teachers of all kinds of students
• Has performed with precision as tested in several LEAs, small, medium, and large
• The MSA has sunset
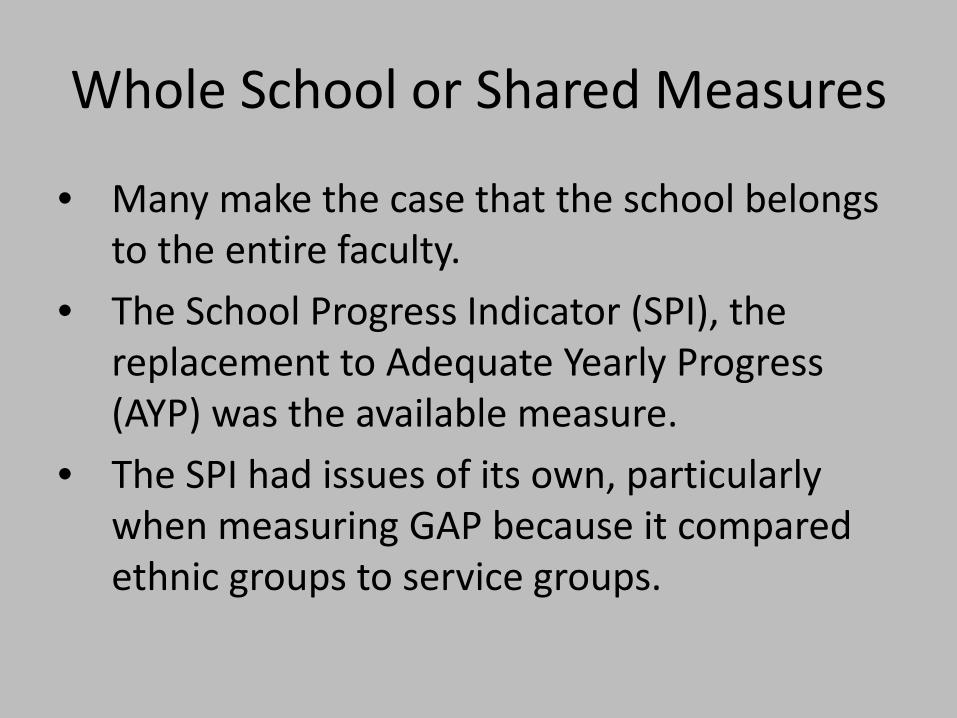
Whole School or Shared Measures
• Many make the case that the school belongs to the entire faculty.
• The School Progress Indicator (SPI), the replacement to Adequate Yearly Progress (AYP) was the available measure.
• The SPI had issues of its own, particularly when measuring GAP because it compared ethnic groups to service groups.

When Using the SPI, Teachers were Disproportionately Hurt (3 to 1) by Including the SPI
This illustrates the top and bottom sort of one medium sized LEA. It illustrates the negative delta of introducing the SPI to replace 10% of the MSA.

Pros and Cons of Shared Measures • Nothing for the LEA to
calculate • Makes intuitive sense to
treat the faculty as the proxy for the school
• The SPI hurts teaches much more than it helps
• Allows weak teacher to hide in good schools and punishes good teachers in bad schools
• Incentifies the wrong thing • The longitudinal nature of
the SPI does not work for teachers as it might for principals; a different measure might work better

Moving Forward with PARCC
•PARCC will return 5 levels, 4 and 5 being “Career and College Ready.” •This will allow a 5 * 5 transformation matrix. •The blue shading suggests what a possible distribution how Maryland student scores might look like. •The numbers reflect the experience with M-TAI and seeks to reward achievement with struggling students and respect the hard work of sustaining high performing students at high levels.
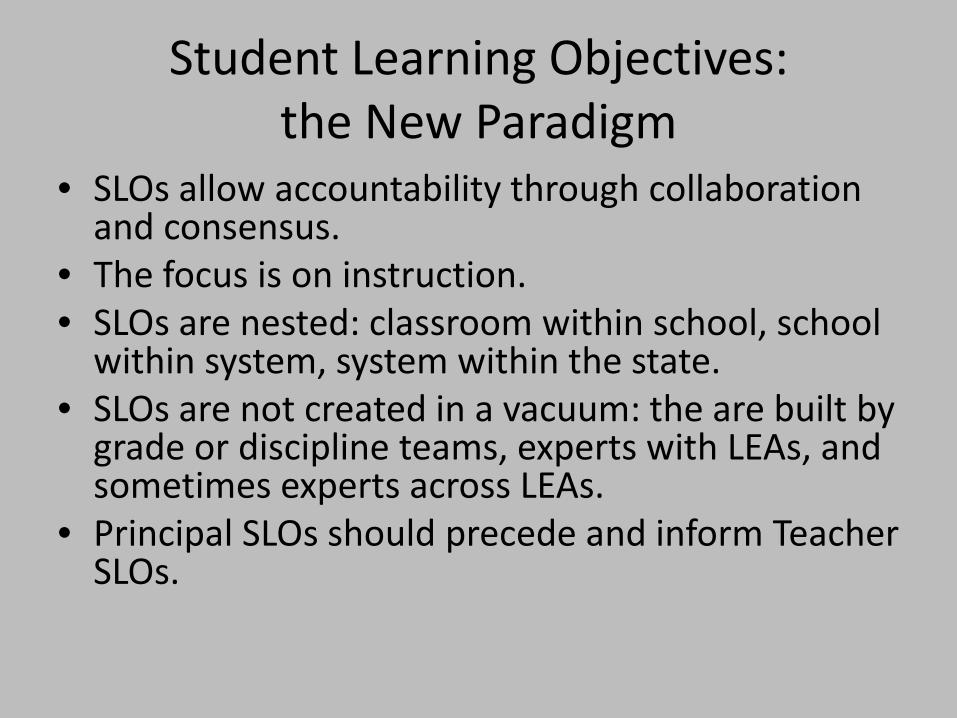
Student Learning Objectives: the New Paradigm
• SLOs allow accountability through collaboration and consensus.
• The focus is on instruction. • SLOs are nested: classroom within school, school
within system, system within the state. • SLOs are not created in a vacuum: the are built by
grade or discipline teams, experts with LEAs, and sometimes experts across LEAs.
• Principal SLOs should precede and inform Teacher SLOs.

SLOs: the Next Statistical Step
• Early adopters used SLOs to interpret other statistics, e.g., the outcome measure of an SLO could be a Student Growth Percentile.
• SLOs are flexible; they use local benchmarks, end-of-course tests, and other 3rd party assessments not part of State Assessments.
• SLOs can use a portfolio approach, putting qualitative data into a quantitative context.
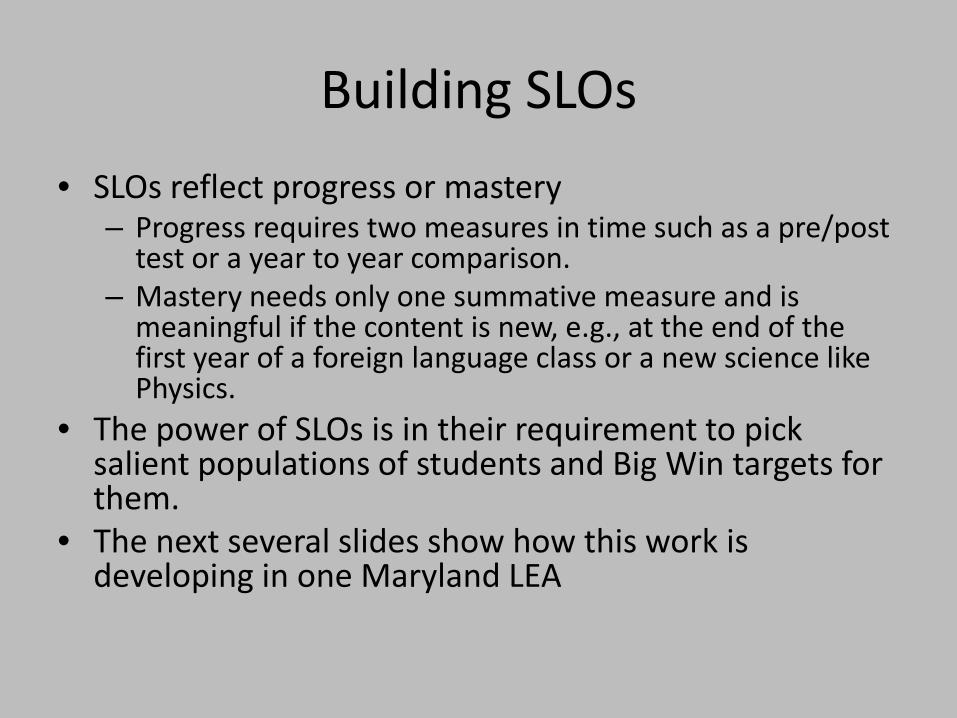
Building SLOs • SLOs reflect progress or mastery
– Progress requires two measures in time such as a pre/post test or a year to year comparison.
– Mastery needs only one summative measure and is meaningful if the content is new, e.g., at the end of the first year of a foreign language class or a new science like Physics.
• The power of SLOs is in their requirement to pick salient populations of students and Big Win targets for them.
• The next several slides show how this work is developing in one Maryland LEA
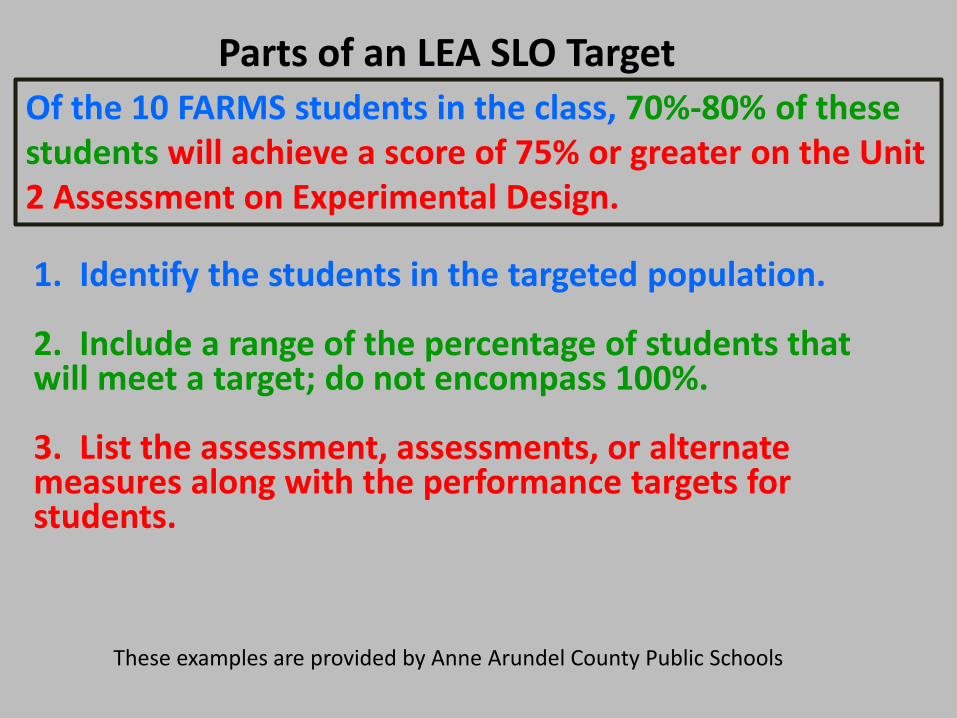
1. Identify the students in the targeted population. 2. Include a range of the percentage of students that will meet a target; do not encompass 100%. 3. List the assessment, assessments, or alternate measures along with the performance targets for students.
Parts of an LEA SLO Target Of the 10 FARMS students in the class, 70%-80% of these
students will achieve a score of 75% or greater on the Unit 2 Assessment on Experimental Design.
These examples are provided by Anne Arundel County Public Schools
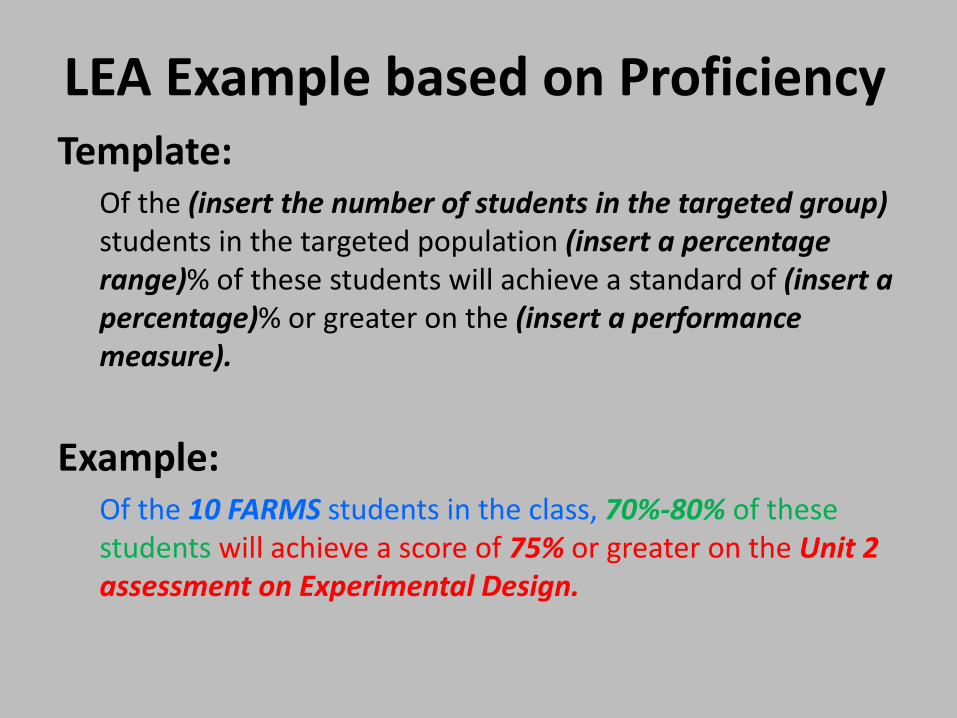
LEA Example based on Proficiency Template:
Of the (insert the number of students in the targeted group) students in the targeted population (insert a percentage range)% of these students will achieve a standard of (insert a percentage)% or greater on the (insert a performance measure).
Example: Of the 10 FARMS students in the class, 70%-80% of these students will achieve a score of 75% or greater on the Unit 2 assessment on Experimental Design.
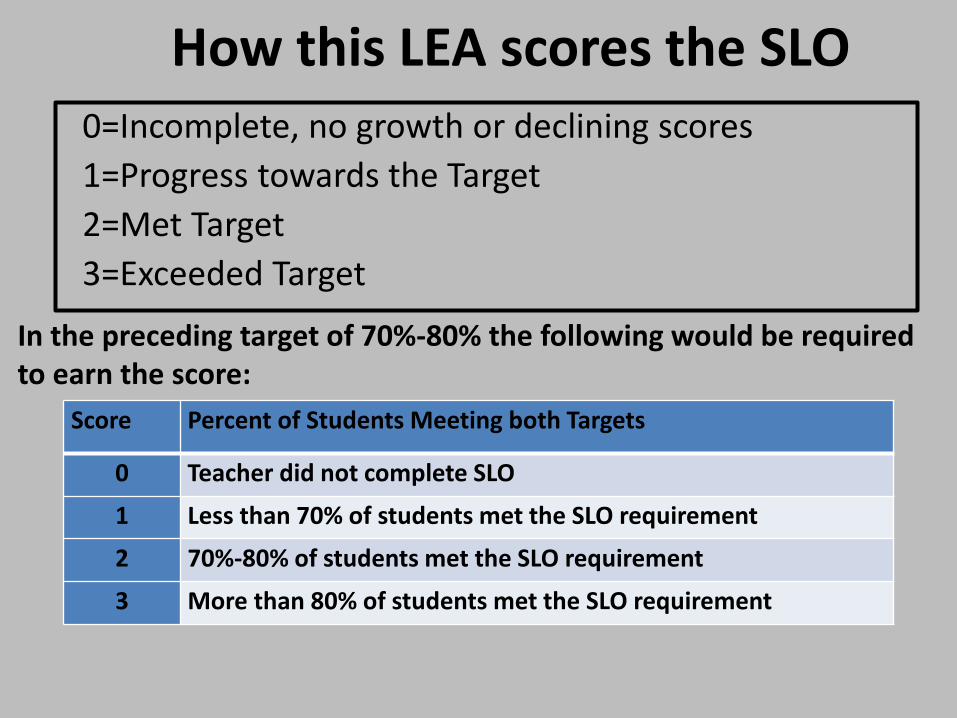
How this LEA scores the SLO 0=Incomplete, no growth or declining scores 1=Progress towards the Target 2=Met Target 3=Exceeded Target In the preceding target of 70%-80% the following would be required
to earn the score: Score Percent of Students Meeting both Targets
0 Teacher did not complete SLO
1 Less than 70% of students met the SLO requirement
2 70%-80% of students met the SLO requirement
3 More than 80% of students met the SLO requirement
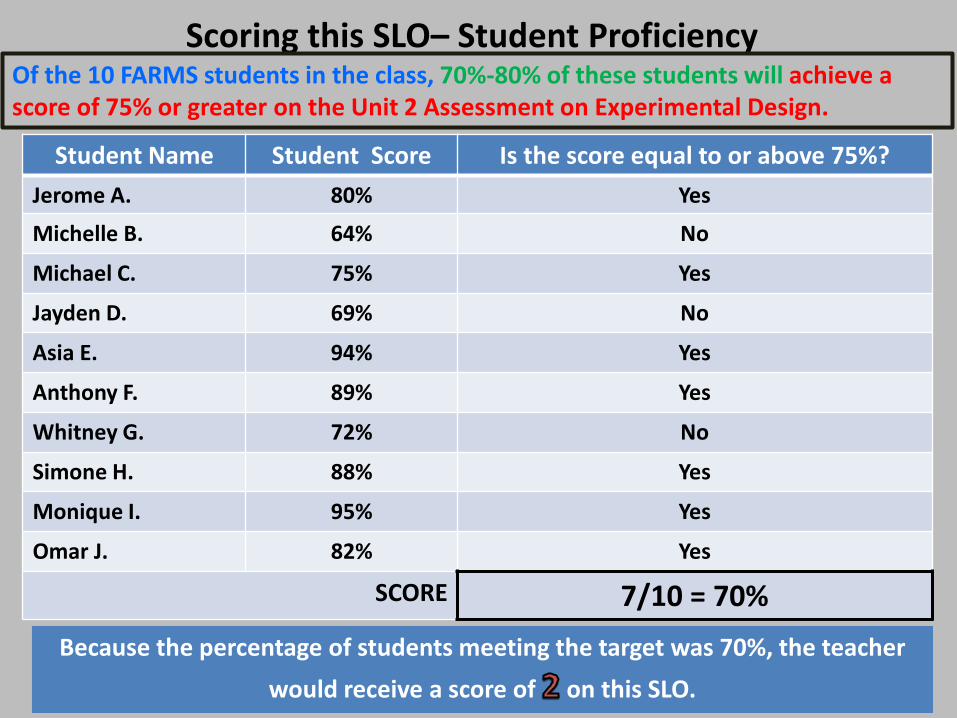
Scoring this SLO– Student Proficiency Of the 10 FARMS students in the class, 70%-80% of these students will achieve a score of 75% or greater on the Unit 2 Assessment on Experimental Design.
Student Name Student Score Is the score equal to or above 75%? Jerome A. 80% Yes
Michelle B. 64% No
Michael C. 75% Yes
Jayden D. 69% No
Asia E. 94% Yes
Anthony F. 89% Yes
Whitney G. 72% No
Simone H. 88% Yes
Monique I. 95% Yes
Omar J. 82% Yes
SCORE 7/10 = 70% Because the percentage of students meeting the target was 70%, the teacher
would receive a score of on this SLO.
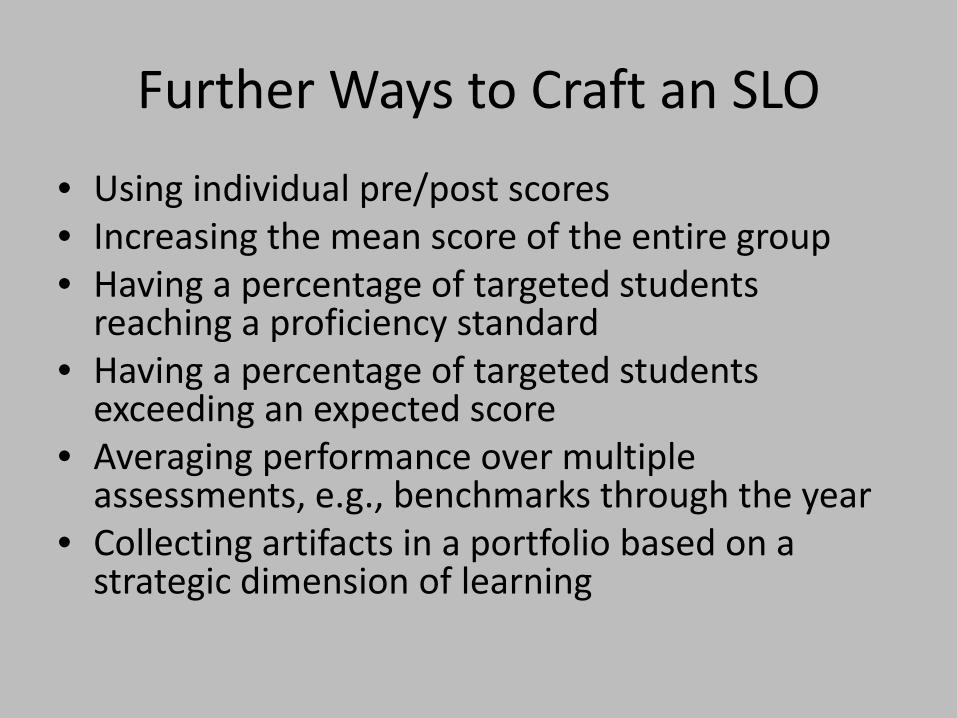
Further Ways to Craft an SLO
• Using individual pre/post scores • Increasing the mean score of the entire group • Having a percentage of targeted students
reaching a proficiency standard • Having a percentage of targeted students
exceeding an expected score • Averaging performance over multiple
assessments, e.g., benchmarks through the year • Collecting artifacts in a portfolio based on a
strategic dimension of learning

Tying SLOs to Assessments
• SLOs can use State Assessments as the outcome measure.
• Without these assessments as an outcome, State Assessments can “inform” the SLO, particularly identifying the salient population or the kinds of targets that are big wins.
• As PARCC matures, its informing role can become more precise specific.
• Ultimately PARCC can become an outcome measure, and the SLO become the permanent framework for evaluation.

Contacts
Jack Smith, Chief Academic Officer [email protected] 410 767 0651
Dave Volrath, Planning and Development Officer
[email protected] , 410 767 0504
Ben Feldman, TPE Team [email protected] , 410 767 0142