review of best practice road safety initiatives€¦ · monash universit y accident research centr...
TRANSCRIPT
M O N A S H U N I V E R S I T Y
A C C I D E N T R E S E A R C H C E N T R E
REVIEW OF BEST PRACTICE ROAD SAFETY INITIATIVES IN THE CORPORATE
AND/OR BUSINESS ENVIRONMENT
by Narelle Haworth
Claes Tingvall Naomi Kowadlo
March 2000
Report No. 166

ii MONASH UNIVERSITY ACCIDENT RESEARCH CENTRE
BEST PRACTICE IN FLEET AND CORPORATE ROAD SAFETY iii
MONASH UNIVERSITY ACCIDENT RESEARCH CENTRE REPORT DOCUMENTATION PAGE
Report No. Date ISBN Pages
166 March 2000 0 7326 1465 1 119 Title and sub-title: Review of best practice road safety initiatives in the corporate and/or business environment Author(s) Type of Report & Period Covered: N. Haworth, C. Tingvall and N. Kowadlo Final; 1999 Sponsoring Organisation(s): This project was commissioned by the Fleet and Corporate Road Safety Working Party which comprises representatives from: Roads Corporation (VicRoads) Royal Automobile Club of Transport Accident Commission Victoria (RACV) Ltd Victoria Police Abstract: This project investigated the potential to introduce road safety based initiatives in the corporate environment. The report includes: • a literature review • a review of European research and programs • interviews with government and corporate representatives • a review of the occupational health and safety legal perspective From the literature review it was concluded that the fleet safety initiatives which have potential to be effective are: • selecting safer vehicles • some particular driver training and education programs • incentives (not rewards) • company safety programs in companies with an overall safety emphasis. European research and programs varies widely from the incorporation of fleet safety into quality assurance of transport in Sweden to the use of driver training and driver discussion groups in other jurisdictions. In Europe, as in Australia and other parts of the world, evaluation of the effectiveness of fleet safety initiatives is rarely undertaken. The current OHS legislation in Victoria allows considerable opportunity for promotion of best practice injury prevention measures. However, the lack of regulations specifically targeting vehicle and driver safety in the occupational setting means that enforcement is only relevant to a small range of fleet safety problems. Key Words: Disclaimer road safety, fleet management Reproduction of this page is authorised Monash University Accident Research Centre,
Wellington Road, Clayton, Victoria, 3800, Australia. Telephone: +61 3 9905 4371, Fax: +61 3 9905 4363

iv MONASH UNIVERSITY ACCIDENT RESEARCH CENTRE
BEST PRACTICE IN FLEET AND CORPORATE ROAD SAFETY v
Contents
Executive Summary xi Acknowledgments xiv 1.0 Introduction 1 1.1 Background 1 1.2 Project objectives and tasks 1 1.3 Project and report structure 2 2.0 An overview of fleet safety issues 3 2.1 Defining fleet vehicles 3 2.2 Fleets in Australia 3 2.3 Size of the road safety problem 3 2.4 Relative safety of company car drivers 5 2.4.1 Telecom crash study 6 2.5 Road safety issues for fleet drivers 7 2.6 The new approach to fleet safety 8 2.7 Taxis 8 2.8 Rental cars 11 3.0 Summary of literature review 13 3.1 Types of initiatives identified 13 3.2 Fleet safety guidelines 13 3.3 Driver selection and induction 14 3.4 Vehicle selection 15 3.4.1 Likely benefits of selecting safer vehicles 15 3.4.2 Fleet demand for safer vehicles 16 3.4.3 Airbags and antilock braking systems 16 3.4.4 Other features 17 3.4.5 Maintenance 17 3.5 Driver training and education 18 3.6 Driver management 18 3.7 Incentives and disincentives 20 3.7.1 General principles 20 3.7.2 Reported effects of incentives and disincentives 20 3.8 Examples of fleet safety programs 21 3.8.1 Hertz Rental Cars 21 3.8.2 Tokyo Electric Power 22 3.8.3 BHP Iron Ore 23 3.8.4 Local government FleetSafe Project 23 3.9 Conclusions 24
vi MONASH UNIVERSITY ACCIDENT RESEARCH CENTRE
4.0 Review of European research and programs 27 4.1 Fleet and corporate safety in Sweden 27 4.1.1 Televerket study 27 4.1.2 Fleet and corporate road safety in Vision Zero 28 4.1.3 Linking road safety and environmental goals 29 4.1.4 Swedish National Road Administration Travel Policy 30 4.1.5 Purchasing safe transport services, Borlange local government 30 4.1.6 Taxi company safety and environmental policy in Sodertalje 30 4.1.7 Purchasing of taxi and tram transport in Gothenburg 30 4.1.8 Guidelines for vehicle policy, YNNOR 31 4.1.9 Folksam insurance – environmental and safety requirements 31 4.2 Fleet and corporate safety in France 32 4.2.1 Road safety and private companies 32 4.2.2 Clubs Entreprises 32 4.3 Fleet and corporate safety in other European countries 33 4.3.1 Germany 33 4.3.2 United Kingdom 33 5.0 Interviews with government and corporate representatives 35 5.1 Australasian Fleet Managers Association awards 35 5.2 Orica 36 5.3 Lumley General Insurance 38 5.4 Q-Fleet 38 5.5 Wodonga Rural City Council 39 5.6 Brotherhood of St Laurence 41 5.7 Fleet SA 42 5.7.1 Driver Training and Education Program 42 5.7.2 Revised Excessive Wear and Tear policy initiatives 45 5.7.3 Load barriers fitted to all wagons 46 5.7.4 Option of higher level equipped vehicles 46 5.7.5 Overall changes in accident costs and frequencies 46 5.7.6 Initiatives planned for the future 47 5.8 University of South Australia 48 5.9 Holden’s Fleet Sales 49 6.0 Occupational health and safety legal perspective 51 6.1 General principles of occupational health and safety legislation 51 6.2 Application of the principles of occupational health and safety legislation to fleet safety 52 6.2.1 Vehicle as workplace or plant 52 6.2.2 Work and non-work related driving 53 6.2.3 Ownership of the vehicle 53 6.2.4 Duties to the public 53
BEST PRACTICE IN FLEET AND CORPORATE ROAD SAFETY vii
6.3 Managing OHS in fleets 54 6.3.1 Application of risk management principles 54 6.3.2 Transport Industry Guide to Meeting OHS Duty of Care 54 6.3.3 Vehicle selection 55 6.3.4 Vehicle maintenance 55 6.3.5 Driver training and management 55 6.4 Discussions with WorkCover Victoria 56 6.5 Other issues related to OHS and fleet safety 56 6.5.1 Compatibility of fleet and occupational health and safety data 56 6.5.2 Telstra dispute regarding forward control vehicles 58 6.6 Conclusions 59 7.0 Discussion and conclusions 61 7.1 Fleet safety issues 61 7.2 Main points from literature review 62 7.3 Main points from interviews with government and corporate representatives 63 7.4 European approaches 63 7.5 Occupational health and safety legal perspective 64 7.6 Issues for smaller businesses 65 7.7 Corporate road safety 65 References 67 Appendix 1: Literature review 73 A1.1 Objectives of fleet management 73 A1.2 Fleet safety guidelines 73 A1.2.1 Federal Office of Road Safety booklet 74 A1.2.2 FORS/NCA Fleet Safety Manual 74 A1.2.3 VicRoads Safe Driving Policy 75 A1.2.4 New South Wales Roads and Traffic Authority Safe Driving Policy 76 A1.2.5 Western Australian Guidelines 77 A1.2.6 Queensland Transport Workplace Fleet Safety Self Audit Book and Workbook 78 A1.2.7 Network of Employers for Fleet Safety 79 A1.3 Driver selection and induction 79 A1.4 Vehicle selection 81 A1.4.1 Likely benefits of selecting safer vehicles 81 A1.4.2 Fleet demands for safer vehicles 82 A1.4.3 Airbags and antilock braking systems 82 A1.4.4 Other features 83 A1.4.5 Intelligent Transport Systems 84 A1.4.6 Maintenance 84 A1.5 Driver training and education 85 A1.5.1 Descriptions of various programs 85
viii MONASH UNIVERSITY ACCIDENT RESEARCH CENTRE
A1.6 Driver management 89 A1.7 Incentives and disincentives 90 A1.7.1 General principles 90 A1.7.2 Reported effects of incentives and disincentives 91 A1.8 Crash reporting 93 A1.9 Examples of fleet safety programs 94 A1.9.1 Hertz Rental Cars 94 A1.9.2 MMI Driver Safety Program 94 A1.9.3 AMP 94 A1.9.4 American International Group Inc. 95 A1.9.5 Tokyo Electric Power 95 A1.9.6 Janssen Pharmaceuticals 97 A1.9.7 BHP Iron Ore 98 A1.9.8 Finemores Transport 98 A1.9.9 Local government FleetSafe Project 99 Appendix 2: Policy for Purchase and Use of Vehicles at MUARC and background document 103
BEST PRACTICE IN FLEET AND CORPORATE ROAD SAFETY ix
Tables
Table 1. Sales of new cars in 1997 to fleet and private buyers by segment 5 Table 2. Third party premium relativities for 1999/2000 for taxis, private hire cars and drive-yourself (rental) motor cars 9 Table 3. Summary of fleet safety guidelines identified in the literature review 14 Table 4. Summary of initiatives in driver selection and induction and vehicle selection identified in the literature review 15 Table 5. Summary of initiatives in driver training and education identified in the literature review 18 Table 6. Summary of initiatives in driver management and incentives and disincentives identified in the literature review 19 Table 7. Summary of company safety programs identified in the literature review 21 Table 8. Likely effectiveness of fleet safety initiatives 25 Table 9. Approximate attendance at Fleet SA driving courses for the period February 1997 to July 1999 43 Table 10. Accident costs and frequencies for Fleet SA 47
Figures Figure 1. Percentages of new passenger vehicles that were sold to private or fleet buyers in Australia. 4 Figure 2. Percentages of fleet and private sales of new passenger vehicles in Australia by manufacturer 4

x MONASH UNIVERSITY ACCIDENT RESEARCH CENTRE
BEST PRACTICE IN FLEET AND CORPORATE ROAD SAFETY xi
EXECUTIVE SUMMARY
In response to an increasing awareness of the role of work-related driving in crashes and the related costs, many private and government organisations have developed programs to improve fleet safety. While many of these programs have focused on the management and driving of company vehicles, some have taken a broader approach. These programs have sought to prevent road trauma and the associated costs of absence from work resulting from non-work-related crashes. Recently, the Corporate and Fleet Safety Working Party was formed, with representation from VicRoads, Transport Accident Commission, Victoria Police and the RACV. It reports to the Road Safety Reference Group and its long-term aim is to implement a program (or programs) that is likely to be well accepted in the business environment and which will reduce casualty crashes. The Corporate and Fleet Safety Working Party commissioned this project to investigate the potential to introduce road safety based initiatives in the corporate environment. The scope of the project is limited to light commercial vehicles and cars, including taxis and rental cars. This report defines fleet vehicles widely as vehicles over which a business has some degree of influence in their selection and operation. It is assumed that the degree of influence is likely to decrease as the type of vehicle moves from the fleet towards the private end of the continuum. The distinction between fleet and corporate road safety programs becomes somewhat blurred when there is considerable private use of fleet vehicles. Literature review The literature review identified a large number of references to fleet safety in industry magazines and relatively few references in the scientific literature. There were numerous claims of likely or possible crash savings resulting from fleet safety programs. However, the number of initiatives which had been evaluated were few. From the literature review it can be concluded that the fleet safety initiatives which have potential to be effective are: • selecting safer vehicles • some particular driver training and education programs (e.g. Hertz study by National
Safety Council in Kedjidjian, 1995; the Swedish Televerket Study) • incentives (not rewards) • company safety programs in companies with an overall safety emphasis. Safety considerations may influence which level of car is purchased within a manufacturer’s range (or which options are selected). Vehicle selection is generally a choice of the safest possible car within reasonably tight constraints, rather than the safest possible car on the market.
xii MONASH UNIVERSITY ACCIDENT RESEARCH CENTRE
There was very little literature available about the effects of fleet safety programs on safety of non-work-related driving by employees. The restricted nature of data collection undertaken may mean that employers know little about this – and state accident databases are not suited to monitoring this. In general, the literature review demonstrated the need to tailor programs to the types of vehicles, types of use and role that driving plays in the employment of different employees of the organisation. The critical role of management interest and support was emphasised in a number of studies. Fleet safety appears to be emphasised in organisations where there is a strong general safety ethos. These organisations are likely to have better incident data monitoring systems that allow them to identify the magnitude of the safety problem comprised by fleet safety. European research and programs The Swedish Televerket study suggests that group discussion meetings may be as effective as off-road driver training in reducing crashes (with considerable cost savings). In the Swedish approach, fleet safety is part of quality management of the transport component of the enterprise (whether government or private). Quality assurance of transport aims to ensure that people and goods arrive at the right place, at the right time and in the right way (i.e. without danger of serious injury or damage to the goods or the environment in connection with the transport). Thus there is a linking of road safety and environmental outcomes. There is an emphasis on ensuring the quality of outsourced transport as well as the use of owned vehicles. The Swedish approach to vehicle safety in fleets focuses more on the rated crashworthiness of vehicles, rather than a specific list of safety features. In this way it differs from the general approach in Australia and the United States identified elsewhere in the report. The Swedish example suggests that a possible approach to occupant protection for Victorian road safety agencies is to focus on a market-driven approach and target fleets – particularly the government fleet. In France, there has been a program to increase the involvement of private companies in road safety related to their use of vehicles. Agreements have been drawn up between government, insurance companies, the national occupational health fund and volunteer companies. Employees of the companies form groups interested in road safety and sign a charter. The programs focus on motivating companies to undertake road safety programs by increasing the knowledge of the cost of road crashes to the company and by decreasing workers compensation and vehicle insurance premiums if programs are implemented. Some of the programs have concentrated on drink driving because of its large role in both work- and non-work-related road crashes in France. The German Traffic Safety Council has promoted the establishment of voluntary safety circles in which employees from the company vehicle fleet meet together to discuss critical points and devise solutions under the leadership of an experienced moderator. It also runs a one-day training course in “Safe, Economical and Environmentally Friendly Driving”.
BEST PRACTICE IN FLEET AND CORPORATE ROAD SAFETY xiii
In the United Kingdom, various measures have been implemented to improve road safety within organisations. They include driver training programs, incentive schemes, penalties, accident reviews, driver monitoring systems and driver feedback procedures. It is unclear whether these measures have had an effect. Interviews with government and corporate representatives Some companies are changing the content of driver training programs away from improving driving skills to improving driver attitudes and reducing risks. There was relatively little emphasis on driver management. Sometimes this may have occurred because fleet management is a centralised function and there is little direct contact with the drivers. The move to maximise resale values has led to programs to take better care of cars and also consideration of the resale implications of some safety features (this can possibly encourage airbag fitting). In fleet management, there is a general emphasis on counting accidents (particularly “preventable” accidents) and repair costs, rather than injuries. This may be because injury accidents are much less common than property damage accidents. Many organisations do not appear to count the hidden costs of crashes (e.g. lost time and productivity). Many fleet safety programs are undertaken in response to a period of poor road safety performance or in response to the interest of someone in management. There are very few evaluations undertaken, even by best practice companies. Benchmarking is one of the few examples of evaluation, but benchmarking only hints at why some organisations may have lower crash rates or costs than others. Review of occupational health and safety legal perspective The examination of the OHS legislation has shown that vehicles can be considered to be workplaces (on public roads) and plant (when not on public roads). Thus there is a requirement to ensure that the vehicles and the ways in which they are used provide, so far as practicable, a working environment that is safe and without risks to health. The current OHS legislation in Victoria allows considerable opportunity for promotion of ideal best practice injury prevention measures. However, the lack of regulations specifically targeting vehicle and driver safety in the occupational setting means that enforcement is only relevant to a small range of fleet safety problems. Thus, promotion of improvements to fleet safety should be considered the appropriate approach in the short-term, accompanied by encouragement of longer-term legislative changes.
xiv MONASH UNIVERSITY ACCIDENT RESEARCH CENTRE
ACKNOWLEDGMENTS We would like to thank the following individuals and their staff for providing detailed information on fleet safety initiatives in their organisations: • Ms Gail Casey, Fleet SA • Mr Les Clarence, Q-Fleet • Mr Rob Cook, Brotherhood of St Laurence • Mr Phil Hetherington, Lumley General Insurance • Mr Ted Jewell, Orica • Mr Andrew Norton, Fleet SA • Ms Marnie Payne, Q-FLEET • Mr John Robertson, Main Roads Western Australia • Mr Ralph Stevenson, General Motors-Holden’s Australia • Mr Neville Thiele, University of South Australia • Ms Marja Thompson, Australasian Fleet Managers Association We would like to express our appreciation to representatives of the WorkCover Authority and the Victorian Road Transport Association. Mr George Rechnitzer of MUARC provided very helpful introductions. Thank you also to the members of the Corporate and Fleet Safety Working Party for their support and guidance.
BEST PRACTICE IN FLEET AND CORPORATE ROAD SAFETY 1
1.0 INTRODUCTION 1.1 BACKGROUND Business use of vehicles comprises a large segment of travel on Australian roads and the human and economic costs of crashes involving these vehicles are significant. About 30% of the registered vehicles in Australia are used in business and 60% of all new vehicles are purchased initially for commercial purposes (Wheatley, 1997). Business travel accounts for about a third of all travel and over half, if commuting to and from work is included (Wheatley, 1997). For example, Harrison, Fitzgerald, Pronk, and Fildes (1998) found that between 36% and 47% of car drivers interviewed by the roadside between 12 noon and 8 pm were on a business trip. In response to increasing awareness of the role of work-related driving in crashes and the related costs, many private and government organisations have developed programs to improve fleet safety. While many of these programs have focused on the management and driving of company vehicles, some have taken a broader approach. These programs have sought to prevent road trauma and the associated costs of absence from work resulting from non-work-related crashes. Recently, the Corporate and Fleet Safety Working Party was formed, with representation from VicRoads, Transport Accident Commission, Victoria Police and the RACV. It reports to the Road Safety Reference Group and its long-term aim is to implement a program (or programs) that is likely to be well accepted in the business environment and which will reduce casualty crashes. 1.2 PROJECT OBJECTIVES AND TASKS The Corporate and Fleet Safety Working Party commissioned this project to investigate the potential to introduce road safety based initiatives in the corporate environment. This will be undertaken by reporting on: • the types of initiatives that have been undertaken within corporations in Australia and
internationally that have been successful in reducing crash numbers • the types of initiatives that have been undertaken within smaller businesses in Australia
and internationally that have been successful in reducing crash numbers • the research and/or evaluation that has been undertaken in relation to these initiatives • the key targets for these programs e.g. fleet managers, occupational health and safety
managers • the legislative support that exists for the introduction of road safety initiatives into
businesses • the best delivery mechanisms and/or channels for introduction of the programs e.g. fleet
managers, private providers, Community Road Safety Councils, Local Government
2 MONASH UNIVERSITY ACCIDENT RESEARCH CENTRE
The scope of the project is limited to light commercial vehicles and cars, including taxis and rental cars. 1.3 PROJECT AND REPORT STRUCTURE This report includes the following components: 1. a literature review 2. a review of European research and programs 3. interviews with government and corporate representatives 4. a review of the occupational health and safety legal perspective
BEST PRACTICE IN FLEET AND CORPORATE ROAD SAFETY 3
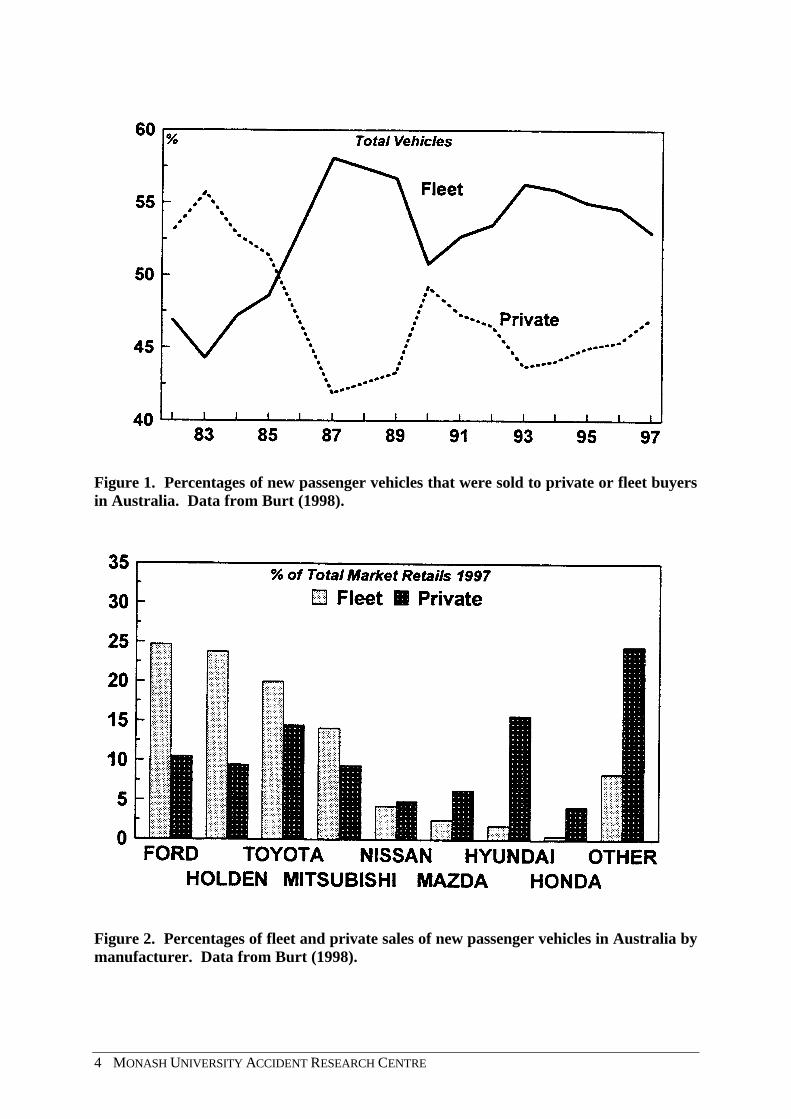
2.0 AN OVERVIEW OF FLEET SAFETY ISSUES 2.1 DEFINING FLEET VEHICLES AUSTROADS (1991, cited in Luk and Richardson, 1997) has estimated that the percentage of company cars in the national car fleet could be as high as 15%. Yet the interpretation of figures such as these is difficult in the absence of a definition of a “fleet vehicle”. Fleet and private vehicles are no longer distinct categories. Rather, there appears to have emerged an ownership continuum, with vehicles owned by companies and used exclusively for business purposes at one end and vehicles owned by individuals in which companies have no financial interest and the use of these vehicles is totally private at the other. In between these ends of the continuum there are vehicles owned by companies for which part-private use is allowed, vehicles which are provided by employers as part of salary packages, vehicles which are the subject of novated leases and other arrangements. An added level of complexity is that many fleet vehicles are leased, rather than owned. This report defines fleet vehicles widely as vehicles over which a business has some degree of influence in their selection and operation. It is assumed that the degree of influence is likely to decrease as the type of vehicle moves from the fleet towards the private end of the continuum. The distinction between fleet and corporate road safety programs becomes somewhat blurred when there is considerable private use of fleet vehicles (e.g. novated leases). 2.2 FLEETS IN AUSTRALIA The largest passenger car fleets are likely to be those operated by Telstra and the Australian Defence Forces. Since 1986, fleet vehicles have comprised the majority of new car sales (see Figure 1). This is true for the Australian-based car manufacturers (and particularly so for Ford and Holden) but not for the other manufacturers (see Figure 2). In 1997, Ford and Holden sold 72% of their new vehicles to fleets. The corresponding figure for Toyota and Mitsubishi was 61%. More than 60% of new cars sold to fleets in 1997 were in the “upper medium” size class, compared to about 15% of sales to private individuals (see Table 1). 2.3 SIZE OF THE ROAD SAFETY PROBLEM Road crashes are the most common form of work-related death. In 1989-92 there were 541 persons killed in road crashes while they were working and 628 persons killed in road crashes while they were commuting to and from work (National Occupational Health and Safety Commission, 1998). This represents 23% and 26%, respectively, of the 2,389 work-related deaths. From another perspective, it represents 6% and 7%, respectively, of the 9,219 road fatalities during that period (Federal Office of Road Safety, 1999). These figures do not count the other persons who were killed or injured as a result of these work-related road crashes.
4 MONASH UNIVERSITY ACCIDENT RESEARCH CENTRE
Figure 1. Percentages of new passenger vehicles that were sold to private or fleet buyers in Australia. Data from Burt (1998).
Figure 2. Percentages of fleet and private sales of new passenger vehicles in Australia by manufacturer. Data from Burt (1998).
BEST PRACTICE IN FLEET AND CORPORATE ROAD SAFETY 5
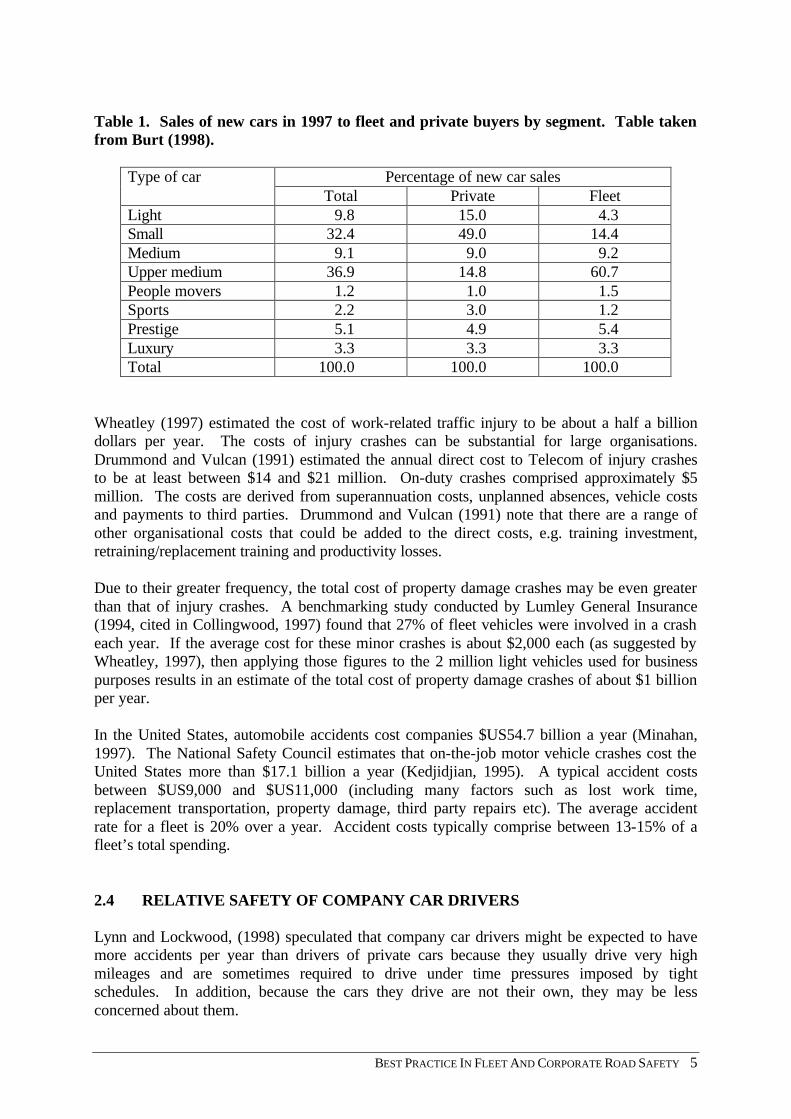
Table 1. Sales of new cars in 1997 to fleet and private buyers by segment. Table taken from Burt (1998).
Type of car Percentage of new car sales Total Private Fleet Light 9.8 15.0 4.3 Small 32.4 49.0 14.4 Medium 9.1 9.0 9.2 Upper medium 36.9 14.8 60.7 People movers 1.2 1.0 1.5 Sports 2.2 3.0 1.2 Prestige 5.1 4.9 5.4 Luxury 3.3 3.3 3.3 Total 100.0 100.0 100.0
Wheatley (1997) estimated the cost of work-related traffic injury to be about a half a billion dollars per year. The costs of injury crashes can be substantial for large organisations. Drummond and Vulcan (1991) estimated the annual direct cost to Telecom of injury crashes to be at least between $14 and $21 million. On-duty crashes comprised approximately $5 million. The costs are derived from superannuation costs, unplanned absences, vehicle costs and payments to third parties. Drummond and Vulcan (1991) note that there are a range of other organisational costs that could be added to the direct costs, e.g. training investment, retraining/replacement training and productivity losses. Due to their greater frequency, the total cost of property damage crashes may be even greater than that of injury crashes. A benchmarking study conducted by Lumley General Insurance (1994, cited in Collingwood, 1997) found that 27% of fleet vehicles were involved in a crash each year. If the average cost for these minor crashes is about $2,000 each (as suggested by Wheatley, 1997), then applying those figures to the 2 million light vehicles used for business purposes results in an estimate of the total cost of property damage crashes of about $1 billion per year. In the United States, automobile accidents cost companies $US54.7 billion a year (Minahan, 1997). The National Safety Council estimates that on-the-job motor vehicle crashes cost the United States more than $17.1 billion a year (Kedjidjian, 1995). A typical accident costs between $US9,000 and $US11,000 (including many factors such as lost work time, replacement transportation, property damage, third party repairs etc). The average accident rate for a fleet is 20% over a year. Accident costs typically comprise between 13-15% of a fleet’s total spending. 2.4 RELATIVE SAFETY OF COMPANY CAR DRIVERS Lynn and Lockwood, (1998) speculated that company car drivers might be expected to have more accidents per year than drivers of private cars because they usually drive very high mileages and are sometimes required to drive under time pressures imposed by tight schedules. In addition, because the cars they drive are not their own, they may be less concerned about them.
6 MONASH UNIVERSITY ACCIDENT RESEARCH CENTRE
The Transport Research Laboratory investigated the accident liability (expected number of accidents per year) of company car drivers using a postal questionnaire technique (Lynn and Lockwood, 1998). The survey aimed to achieve a random sample of all drivers in Great Britain who drove a company-owned or company-financed car or van (up to about 1.5 tonnes) as a necessary and frequent part of their job (at least once per week, not including driving to and from work). The survey excluded drivers who did not drive during working time, even if their company provided them with a car for private use. The survey found that company drivers drove more than twice the annual distance that private car drivers drove. On average, company car drivers drove 20,000 miles as part of the job and an additional 7,000 miles for non-work activities. In the study, an accident was defined as ‘any incident, however small, that involved damage to your vehicle or another vehicle, damage to any property, or injury to any person including yourself’. Accidents not on public roads, outside Great Britain or while travelling as a passenger were not included. Company car drivers reported an average of 0.19 accidents per year, of which 0.10 occurred while driving for work and 0.08 occurred during non-work driving. Younger, less experienced drivers had a higher accident rate than older, more experienced drivers. Accident liability increased with annual mileage, but less than proportionally. After differences in demographic and exposure variables had been considered, company car drivers had about 50% more accidents than private drivers. Following on from Lynn and Lockwood’s study, Downs, Keigan, Maycock and Grayson (1999) conducted interviews and focus groups to determine why British company car drivers have a higher accident risk than the general driving population. Fleet trainers, fleet managers, fleet drivers and the insurance industry were included. This research indicated that the driving culture within an organisation may stress business needs, such as delivery quotas, before safety. It was also found that a strong ‘safety culture’ within a company will positively impact on safety concerns being addressed more rigorously in that company. In addition, companies with strong safety cultures were found to be more satisfied with the outcomes of safety measures that had been implemented. 2.4.1 Telecom crash study Drummond and Vulcan (1991) compared a sample of injury crashes involving Telecom vehicles in Victoria with a random sample of injury crashes involving non-Telecom vehicles. They speculated that exposure differences may have contributed to crashes involving Telecom vehicles being more likely to occur between 4 am and 4 pm, involve drivers aged 26 to 50 years and involve male drivers than other crashes. However, crashes involving Telecom vehicles were more likely to involve collisions with pedestrians, occur at intersections, occur while overtaking and involve the Telecom vehicle as the “hitting” vehicle in rear-end crashes. These findings were less likely to reflect exposure differences.
BEST PRACTICE IN FLEET AND CORPORATE ROAD SAFETY 7
2.5 ROAD SAFETY ISSUES FOR FLEET DRIVERS There is some evidence that particular road safety problems may be more prominent among those driving for business than for private drivers. Harrison, Fitzgerald, Pronk, and Fildes (1998) found that higher driving speeds were associated with business or work car use, driving a large, relatively new car owned by someone other than the driver, a relatively high level of driving exposure, being on a long trip and driving relatively little in built-up areas. Adams-Guppy and Guppy (1995) conducted a study in Britain that examined risk and utility in relation to speeding among company car drivers. Self-completion questionnaires were mailed to 1078 employees with company vehicles. Overall, 572 drivers completed and returned the questionnaires. The questionnaires covered the following five sections: • reported frequency of risk taking in relation to speeding above the legal limit, • driver biographical and driving history information (how many years driving experience
and how many miles per week), • driver self-perception of skill and control (e.g., drivers asked to decide where they fall on
a scale from attentive to inattentive, and to indicate on a five-point Likert scale their position on the statement ‘I feel that my safety is mainly in the hands of other road users’),
• perceived probability of adverse events (e.g., being stopped by police if they were speeding or having a minor accident in the coming year), and
• utility elements (response to the statements: ‘If I have an accident in my company vehicle, it is unlikely that I would be badly hurt’ and ‘It is important to get to your destination on time, even if this means breaking the speed limit’, and perception of the relative importance of excess speed as a general accident causation factor).
Speeding was common for over half the sample, and excessive speeding was common for 13% of the sample. The most influential reason was found to be a desire to arrive at meetings on time, even if this meant breaking the speed limit. This was combined with a reduced perception of excess speeding as an important accident risk factor and lower driving experience. Those who were excessive speeders were more likely to believe that speeding was an accident risk factor (they possibly thought the results would be less severe than those who did not speed). There was no association between speeding and the belief that they would be apprehended for a speeding violation. The overall deterrent of a crash may not be as high among this group, as the company will pay for costs such as repairs and lost time. Speeding drivers were more likely to view themselves as more confident and aware and less sociable. Working and work-related travel also appear to play a significant role in driver fatigue. Fell and Black (1996) reported that in the Northern Region of NSW, over a third of driver fatigue crashes or near crashes occurred on trips related to work. When drivers in the Sydney region were interviewed, 43% of respondents who had a fatigue incident (a crash, near miss or moved out of their lane because of fatigue) stated that their trip was work-related. Among the respondents who said that they had insufficient sleep, 55% attributed this to long working hours or overtime.
8 MONASH UNIVERSITY ACCIDENT RESEARCH CENTRE
2.6 THE NEW APPROACH TO FLEET SAFETY More recently, a new conceptualisation of fleet safety has been proposed. Under this model, fleet safety is seen as important, not just for fleet operators, but as a strategic approach to improving the safety of the entire vehicle fleet. Corporate purchasers of vehicles and transport services can specify high safety standards and thus create an economic imperative for providers of vehicles and transport services to meet these standards. While regulatory mechanisms to improve the safety of vehicles are notoriously slow and constrained by international compatibility issues, using the fleet market to demand particular features will result in a speedier introduction of those features. For volume production reasons, these features are likely to be also offered to private buyers. Seat belt interlocks, alcohol interlocks and intelligent speed limiters are in-vehicle devices which have potential to effectively address the driver behaviour issues of nonuse of restraints, drink driving and speeding. One way of promoting their widespread introduction is to form an alliance of fleet buyers of cars that will gradually start to demand vehicles with these devices. The roles of insurance companies and building partnerships with the automotive industry should not be underestimated. As noted earlier, a substantial proportion of vehicle travel occurs in business vehicles. Incorporating quality systems into the use of the road transport system by fleet vehicles has the potential to significantly affect issues like speed, fatigue, purchase of safe cars etc. It seems important to see this as a demand-driven process rather than regulatory in the short-term. Quality of transport within a corporate behaviour strategy would benefit also from finding synergies with economic and environmental issues. In the short term, a “safe” way of using the road transport system should be defined, in order to help the market, preferably in a way that suits modern quality management systems, such as ISO 9000 and 14000. Examples of two recent approaches to improving fleet safety have been the Swedish approach in which the government sets an example and the linking of road safety and environmental goals. These are described in Section 4. 2.7 TAXIS There is considerable anecdotal evidence that taxi drivers around the world drive in a manner the rest of the public considers to be unsafe (e.g., Fisher, 1997; McCarthy, 1999; Tomita, Ohzeki and Maruyama, 1991). Yet, road safety issues within the taxi industry are not widely studied. In contrast, there have been a number of investigations of the public safety aspects of taxi use, particularly the personal safety of taxi drivers (Crime Prevention Committee, 1993; Keatsdale Pty Ltd, 1996, both cited by STAYSAFE Committee, 1997). Some studies of road safety measures have involved taxis (as a high-mileage vehicle) but these studies have not been directly interested in taxi safety. For example, Sagberg, Fosser and Saetermo (1997) examined the risk compensation behaviour of taxi drivers who were driving vehicles with airbags and ABS (antilock) brakes. Their results indicated that there
BEST PRACTICE IN FLEET AND CORPORATE ROAD SAFETY 9
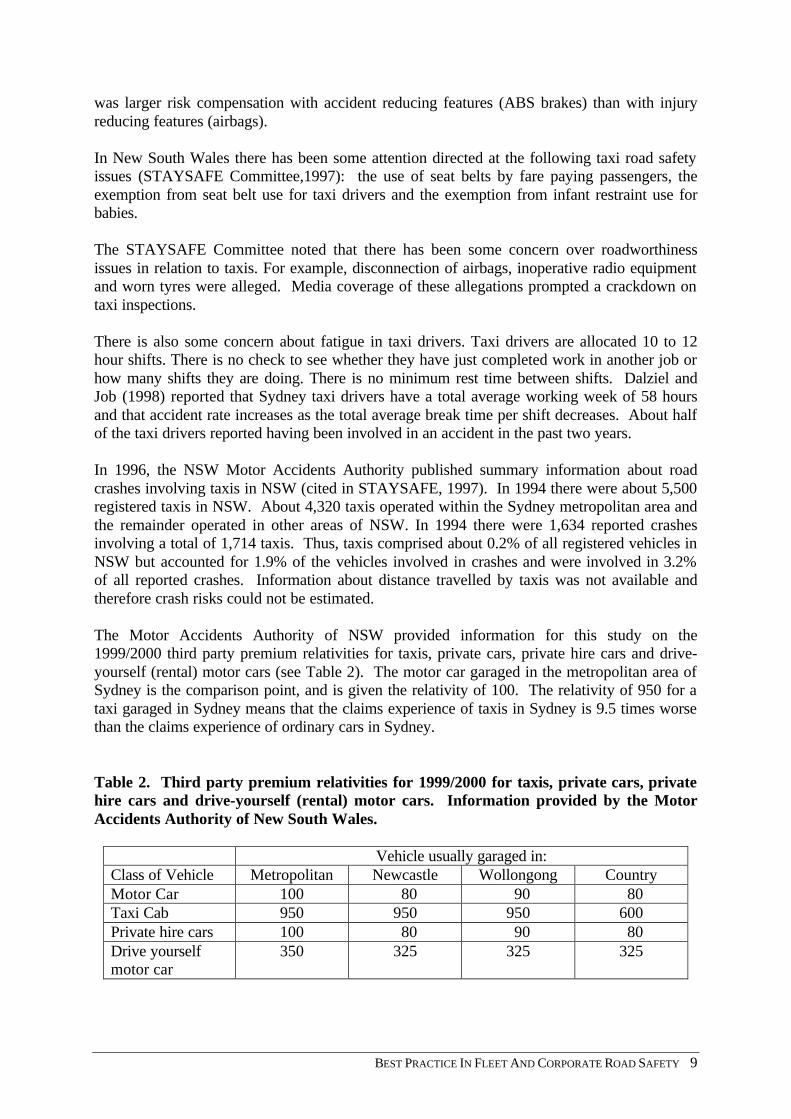
was larger risk compensation with accident reducing features (ABS brakes) than with injury reducing features (airbags). In New South Wales there has been some attention directed at the following taxi road safety issues (STAYSAFE Committee,1997): the use of seat belts by fare paying passengers, the exemption from seat belt use for taxi drivers and the exemption from infant restraint use for babies. The STAYSAFE Committee noted that there has been some concern over roadworthiness issues in relation to taxis. For example, disconnection of airbags, inoperative radio equipment and worn tyres were alleged. Media coverage of these allegations prompted a crackdown on taxi inspections. There is also some concern about fatigue in taxi drivers. Taxi drivers are allocated 10 to 12 hour shifts. There is no check to see whether they have just completed work in another job or how many shifts they are doing. There is no minimum rest time between shifts. Dalziel and Job (1998) reported that Sydney taxi drivers have a total average working week of 58 hours and that accident rate increases as the total average break time per shift decreases. About half of the taxi drivers reported having been involved in an accident in the past two years. In 1996, the NSW Motor Accidents Authority published summary information about road crashes involving taxis in NSW (cited in STAYSAFE, 1997). In 1994 there were about 5,500 registered taxis in NSW. About 4,320 taxis operated within the Sydney metropolitan area and the remainder operated in other areas of NSW. In 1994 there were 1,634 reported crashes involving a total of 1,714 taxis. Thus, taxis comprised about 0.2% of all registered vehicles in NSW but accounted for 1.9% of the vehicles involved in crashes and were involved in 3.2% of all reported crashes. Information about distance travelled by taxis was not available and therefore crash risks could not be estimated. The Motor Accidents Authority of NSW provided information for this study on the 1999/2000 third party premium relativities for taxis, private cars, private hire cars and drive-yourself (rental) motor cars (see Table 2). The motor car garaged in the metropolitan area of Sydney is the comparison point, and is given the relativity of 100. The relativity of 950 for a taxi garaged in Sydney means that the claims experience of taxis in Sydney is 9.5 times worse than the claims experience of ordinary cars in Sydney. Table 2. Third party premium relativities for 1999/2000 for taxis, private cars, private hire cars and drive-yourself (rental) motor cars. Information provided by the Motor Accidents Authority of New South Wales.
Vehicle usually garaged in: Class of Vehicle Metropolitan Newcastle Wollongong Country Motor Car 100 80 90 80 Taxi Cab 950 950 950 600 Private hire cars 100 80 90 80 Drive yourself motor car
350 325 325 325
10 MONASH UNIVERSITY ACCIDENT RESEARCH CENTRE
The STAYSAFE Committee (1997) presented an analysis of information about crashes involving taxis derived from the NSW RTA’s road crash database. Using a number of assumptions where data were not available, they concluded that: • The number of deaths per 10,000 taxis on register is more than four-and-a-half times that
of the general vehicle fleet. • The number of deaths per 10,000 taxi driver authorities on issue is probably between one
and two times the rate than that of the general population of licensed drivers. • The number of fatalities per 100 million taxi kilometres travelled is probably about half of
the general population rate. They noted that taxis commonly operate in areas where there are a lot of pedestrians, a situation that has potential for danger. The STAYSAFE Committee (1997) commented that there is a multiplicity of Government Departments regulating and overseeing the taxi industry, which makes road safety initiatives in this area more difficult to implement. In a US study, Ferguson, Wells, Williams and Feldman (1999) commented that one reason for high injury/fatality rates among occupants of taxis might be the low seatbelt usage rate among taxi drivers and passengers. Some US taxi drivers say they do not wear seat belts because they get and out of their vehicles frequently. The reasons why passengers are not wearing seatbelts may include that in the US people do not generally wear seatbelts in the back seat, lack of familiarity with the belt system (Welkon and Reisinger, 1977, cited in Ferguson et al., 1999), belt inaccessibility and the fact that most trips are brief. There are laws for seat belt use by private drivers in 49 US states and the District of Columbia. However, it is compulsory for taxi drivers to wear seat belts in only 37 states, and belts are required for rear-seated adult taxi passengers in only eight states. From October 1997, non-use of seatbelts became a primary offence in the District of Columbia (D.C.) resulting in a $50 fine and two licence penalty points. This included taxi drivers and passengers. The current study could therefore examine the effect of a primary law with strong penalties on a population of drivers who could be adversely affected by the accumulation of license points, that is, taxi drivers. In October 1997 (after a six-month period of warnings with no penalties) about 50 D.C. taxi drivers were interviewed informally at an airport in Virginia (a bordering state). Drivers indicated high awareness of the law and heightened concern about the possibility of losing their licences if they did not obey the law. In the present study, taxi driver belt use was observed in the District of Columbia, and in two bordering states, Maryland and Virginia. In Maryland, non-use of seat belts is a primary offence and in Virginia it is a secondary offence for the general public. However, neither state requires taxi drivers to wear seat belts. Observers were located at a number of signalised intersections in Maryland and Virginia and at two sites in the District of Columbia between April and May 1998. Correct shoulder belt use by taxi drivers was noted, and jurisdiction was determined by number plate. Observation
BEST PRACTICE IN FLEET AND CORPORATE ROAD SAFETY 11
points in the bordering states were placed both near and further away from D.C. Around 1,800 taxis were observed altogether and they were evenly divided between jurisdictions. For taxi drivers in their own jurisdictions, belt use rates were much higher in D.C. than in the other two states, being 74%, compared to 38% for Virginia taxi drivers and 20% for Maryland. D.C. taxi drivers were also significantly more likely to be wearing seatbelts in the other two states than drivers licensed in those jurisdictions. In Maryland, belt use rates for D.C. taxi drivers were 76% and in Virginia they were 64%. Belt use rates were typically higher for taxi drivers from Maryland and Virginia when they were close to D.C. than when they were well into their own jurisdiction. The results of this study suggest that the fear of losing a driver’s licence may provide a strong incentive to use seat belts. 2.8 RENTAL CARS There is very little information available about rental cars. Rental cars are generally relatively new and therefore are likely to have higher levels of crashworthiness than the fleet as a whole. However, the range of sizes of vehicles (and related crashworthiness) is quite broad and therefore they may be relatively less safe (in terms of crashworthiness) than taxis. Third party insurance premiums for rental cars in Queensland are about 2-3 times that for an average private car, which suggests that the crash ratio may be of that order (Vulcan, Personal communication). Table 2 shows that the third party claims experience of rental cars in New South Wales is about 3.5 times greater than private cars. With the exception of Western Australia, rental cars are not identifiable in crash databases.

12 MONASH UNIVERSITY ACCIDENT RESEARCH CENTRE
BEST PRACTICE IN FLEET AND CORPORATE ROAD SAFETY 13
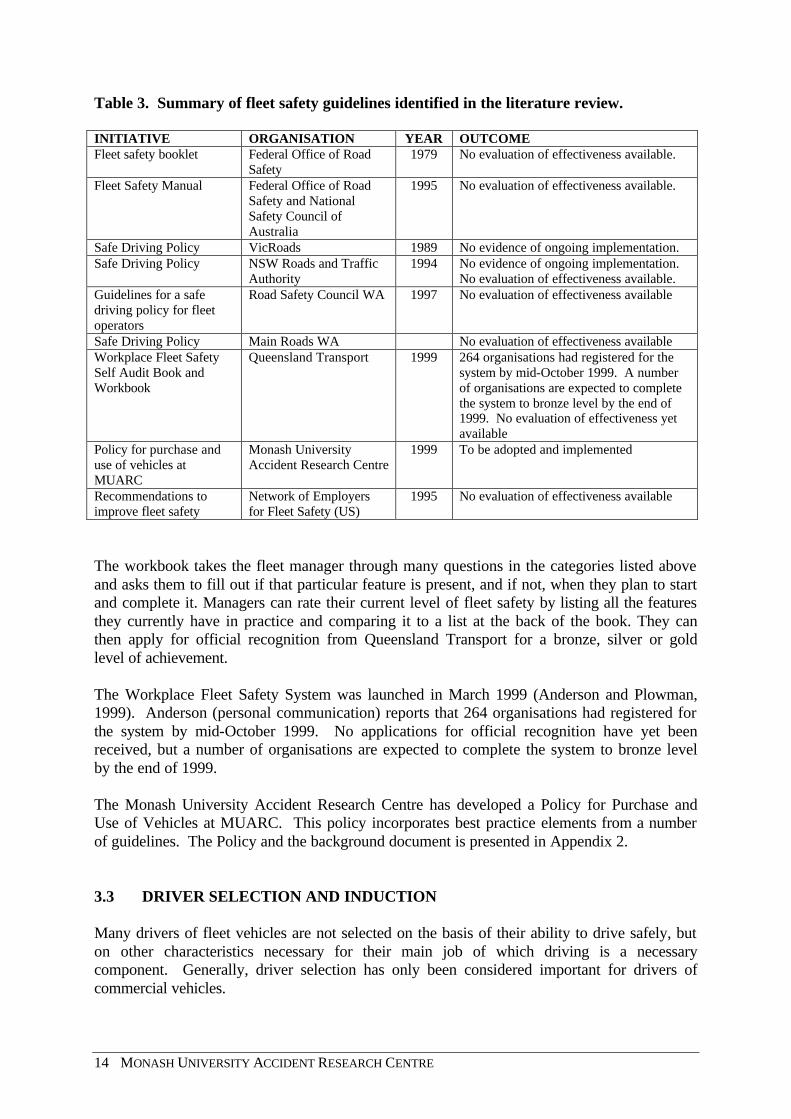
3.0 SUMMARY OF LITERATURE REVIEW The literature review commenced with a search of publications databases to identify published research in the area of fleet and corporate safety initiatives. This identified a large number of books, journal articles and commissioned reports. Additional material was sourced from conference proceedings and contacts with personnel in other jurisdictions. This section presents a summary of the literature review. The full text of the literature review is presented in the Appendix. 3.1 TYPES OF INITIATIVES IDENTIFIED The literature review found that fleet safety initiatives could be classified into the following categories: • fleet safety guidelines developed by road safety organisations • driver selection and induction procedures • vehicle selection • driver training and education • driver management • incentives and disincentives • company safety programs 3.2 FLEET SAFETY GUIDELINES Road safety organisations in Australia and overseas have, at various times, provided guidelines to improve the safety of fleets. In addition, some large corporations have published their fleet safety guidelines. A summary of the guidelines is presented in Table 3. Unfortunately, there has been no scientific evaluation of the effectiveness in safety terms for any of the guidelines. The only guidelines which appear to be actively being promoted are the Guidelines for a safe driving policy for fleet operators developed by the Road Safety Council of WA and Queensland Transport’s Workplace Fleet Safety Self Audit Book and Workbook. No details were available relating to the number of companies who were using the WA Guidelines. The Queensland Transport Workplace Fleet Safety Self Audit Book and Workbook allows companies to easily assess their safety standard and record in relation to their vehicle fleets (Queensland Transport, 1998a and 1998b). The self-audit guide shows how to conduct an audit and contains Australian standards for fleet management. It includes a Best Practice Mapping Chart.
14 MONASH UNIVERSITY ACCIDENT RESEARCH CENTRE
Table 3. Summary of fleet safety guidelines identified in the literature review. INITIATIVE ORGANISATION YEAR OUTCOME Fleet safety booklet Federal Office of Road
Safety 1979 No evaluation of effectiveness available.
Fleet Safety Manual Federal Office of Road Safety and National Safety Council of Australia
1995 No evaluation of effectiveness available.
Safe Driving Policy VicRoads 1989 No evidence of ongoing implementation. Safe Driving Policy NSW Roads and Traffic
Authority 1994 No evidence of ongoing implementation.
No evaluation of effectiveness available. Guidelines for a safe driving policy for fleet operators
Road Safety Council WA 1997 No evaluation of effectiveness available
Safe Driving Policy Main Roads WA No evaluation of effectiveness available Workplace Fleet Safety Self Audit Book and Workbook
Queensland Transport 1999 264 organisations had registered for the system by mid-October 1999. A number of organisations are expected to complete the system to bronze level by the end of 1999. No evaluation of effectiveness yet available
Policy for purchase and use of vehicles at MUARC
Monash University Accident Research Centre
1999 To be adopted and implemented
Recommendations to improve fleet safety
Network of Employers for Fleet Safety (US)
1995 No evaluation of effectiveness available
The workbook takes the fleet manager through many questions in the categories listed above and asks them to fill out if that particular feature is present, and if not, when they plan to start and complete it. Managers can rate their current level of fleet safety by listing all the features they currently have in practice and comparing it to a list at the back of the book. They can then apply for official recognition from Queensland Transport for a bronze, silver or gold level of achievement. The Workplace Fleet Safety System was launched in March 1999 (Anderson and Plowman, 1999). Anderson (personal communication) reports that 264 organisations had registered for the system by mid-October 1999. No applications for official recognition have yet been received, but a number of organisations are expected to complete the system to bronze level by the end of 1999. The Monash University Accident Research Centre has developed a Policy for Purchase and Use of Vehicles at MUARC. This policy incorporates best practice elements from a number of guidelines. The Policy and the background document is presented in Appendix 2. 3.3 DRIVER SELECTION AND INDUCTION Many drivers of fleet vehicles are not selected on the basis of their ability to drive safely, but on other characteristics necessary for their main job of which driving is a necessary component. Generally, driver selection has only been considered important for drivers of commercial vehicles.
BEST PRACTICE IN FLEET AND CORPORATE ROAD SAFETY 15
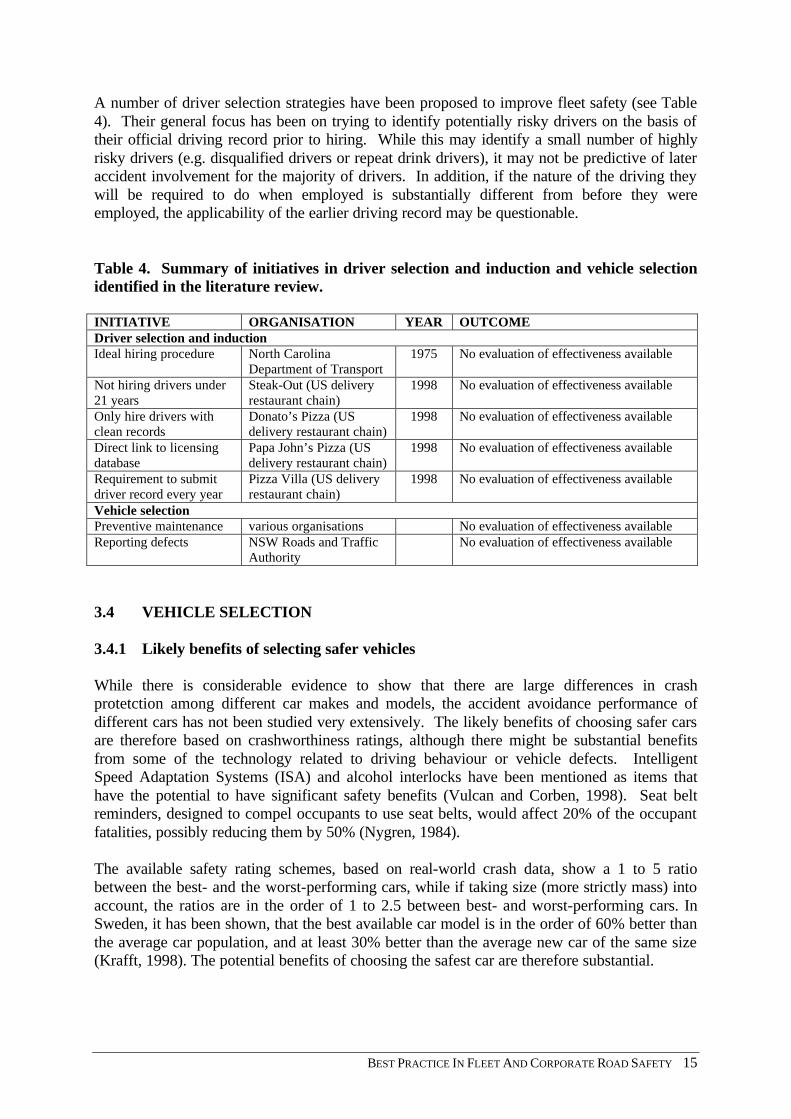
A number of driver selection strategies have been proposed to improve fleet safety (see Table 4). Their general focus has been on trying to identify potentially risky drivers on the basis of their official driving record prior to hiring. While this may identify a small number of highly risky drivers (e.g. disqualified drivers or repeat drink drivers), it may not be predictive of later accident involvement for the majority of drivers. In addition, if the nature of the driving they will be required to do when employed is substantially different from before they were employed, the applicability of the earlier driving record may be questionable. Table 4. Summary of initiatives in driver selection and induction and vehicle selection identified in the literature review. INITIATIVE ORGANISATION YEAR OUTCOME Driver selection and induction Ideal hiring procedure North Carolina
Department of Transport 1975 No evaluation of effectiveness available
Not hiring drivers under 21 years
Steak-Out (US delivery restaurant chain)
1998 No evaluation of effectiveness available
Only hire drivers with clean records
Donato’s Pizza (US delivery restaurant chain)
1998 No evaluation of effectiveness available
Direct link to licensing database
Papa John’s Pizza (US delivery restaurant chain)
1998 No evaluation of effectiveness available
Requirement to submit driver record every year
Pizza Villa (US delivery restaurant chain)
1998 No evaluation of effectiveness available
Vehicle selection Preventive maintenance various organisations No evaluation of effectiveness available Reporting defects NSW Roads and Traffic
Authority No evaluation of effectiveness available
3.4 VEHICLE SELECTION 3.4.1 Likely benefits of selecting safer vehicles While there is considerable evidence to show that there are large differences in crash protetction among different car makes and models, the accident avoidance performance of different cars has not been studied very extensively. The likely benefits of choosing safer cars are therefore based on crashworthiness ratings, although there might be substantial benefits from some of the technology related to driving behaviour or vehicle defects. Intelligent Speed Adaptation Systems (ISA) and alcohol interlocks have been mentioned as items that have the potential to have significant safety benefits (Vulcan and Corben, 1998). Seat belt reminders, designed to compel occupants to use seat belts, would affect 20% of the occupant fatalities, possibly reducing them by 50% (Nygren, 1984). The available safety rating schemes, based on real-world crash data, show a 1 to 5 ratio between the best- and the worst-performing cars, while if taking size (more strictly mass) into account, the ratios are in the order of 1 to 2.5 between best- and worst-performing cars. In Sweden, it has been shown, that the best available car model is in the order of 60% better than the average car population, and at least 30% better than the average new car of the same size (Krafft, 1998). The potential benefits of choosing the safest car are therefore substantial.
16 MONASH UNIVERSITY ACCIDENT RESEARCH CENTRE
The size of the car, or rather the mass, also plays a major role in crash protection. In general, the risk of a serious injury is reduced by 5-10% for every extra 100 kg of car mass, in two car collisions (Buzeman, 1997; Nygren, 1984). For some vehicles, there are additional, optional safety features. While a driver-side airbag is accepted as improving the safety of the vehicle, other options are also likely to be effective. In general, crash protection features like side airbags and anti-whiplash protection are of high value and might add benefits in the order of 5 to 25% (Hell, Langwieder, Walz, Muser, Kramer and Hartwig, 1999). Other features like stability control or intelligent cruise control are not fully understood in terms of benefits. 3.4.2 Fleet demand for safer vehicles Traditionally, vehicle selection has been largely guided by operational needs and budget. However, in parallel with an increase in vehicle safety concerns by private motorists, vehicle safety has increased in importance as an issue in vehicle selection. Annual acquisition surveys sponsored by the National Association of Fleet Administrators (NAFA) have found that United States and Canadian fleet managers rate safety among the top factors when selecting vehicles. ‘In most cases, fleet buyers rank the safety record of a vehicle just behind its initial cost, suitability for a particular job, and depreciation/resale value’ (Minahan, 1997, p.65). General improvements in vehicle safety (whether driven by regulation or the market) play a large role in improving the safety of corporate fleets as many non-safety-conscious fleet managers will buy whatever comes standard, or whatever they can afford (Minahan, 1997). Safety considerations may influence which level of car is purchased within a manufacturer’s range (or which options are selected). Vehicle selection is generally a choice of the safest possible car within reasonably tight constraints, rather than the safest possible car on the market. 3.4.3 Airbags and antilock braking systems Air bags and anti-lock braking are increasingly becoming standard items on corporate cars (Minahan, 1997). The 1997 National Association of Fleet Administrators (NAFA) survey (in Minahan, 1997) found that more than half of fleet managers say they will only order vehicles with air bags, and 33% say they select air bags when offered an option. This is an increase from previous years. About 41% say they will only buy vehicles with anti-lock braking, which is also an increase, but not as high as for airbags. There is a general perception that ABS is a prevention measure, rather than an airbag which is seen as too late. There appears to be an emphasis on crash prevention, rather than injury prevention. This is understandable given that the very large majority of fleet vehicle crashes involve vehicle damage (and the resultant repair costs) but no injury. It is unclear how much relative costs of ABS and airbags (and the reusability of ABS) are considered a factor. An Australian study conducted for FORS by the Roy Morgan Research Centre in 1992 examined the amount of money that new car buyers (or renters) were willing to pay for safety features. The main drivers of fleet cars were more willing to pay for safety features than private buyers. It was estimated that 90% of the main drivers of fleet cars would be willing to pay the best estimated retail price or more for the non-airbag package, and 81% would be

BEST PRACTICE IN FLEET AND CORPORATE ROAD SAFETY 17
willing to pay the best estimated retail price or more for the airbag package. All of the fleet managers who were responsible for the purchase of cars within their organisation (for both public and private organisations) were willing to pay the best estimated retail price or more for the non-airbag package. Over 80% were willing to pay the best estimated price or more for the airbag package. Renters of short term hire cars were asked about their willingness to pay an increased daily charge if the above-mentioned safety features were present. It was found that over 90% of renters were willing to pay for the industry estimated increases in rental fees. While the detailed findings of this study may now be outdated, the general finding that fleet buyers are more willing to pay for safety features than private buyers may still be valid. 3.4.4 Other features Air conditioning is specified for most fleet vehicles, to improve comfort rather than for safety reasons. On the basis of laboratory research, air conditioning could be expected to reduce the development of fatigue in warm conditions (Mackie and O’Hanlon, 1977). Air conditioning may also be viewed as a safety feature because it can be used to de-mist the windows rapidly. Daytime running lights (DRLs) have been recommended as a good safety feature in the United States (Minahan, 1997). Australian fleet buyers have stated that they will purchase this feature – once it is proved that it works. A small-scale fleet study in Western Australia has found that vehicles equipped with DRLs were more than eight times safer than non-DRL vehicles for conspicuity-related crashes and five times safer when rear-end collisions were considered (Poole, 1999). Estimates of the benefit:cost ratio ranged from 3.3:1 to 5.7:1. Intelligent Transport Systems (ITS) are emerging. Three examples are personal in-vehicle information systems, fleet management systems and radio data system-traffic message channel (Kujawa, 1999). Intelligent Vehicle and Highway Systems (IVHS) can improve fleet management (Sanderson, 1992) and on-board global positioning systems are being used to improve fleet safety (Minahan, 1997). 3.4.5 Maintenance Preventive maintenance has been promoted in a number of articles (e.g. Zygmont, 1997). The extent to which it contributes to safety (rather than reduced unscheduled maintenance costs) is unclear, however. There is a perception that less regulated fleet environments may have a risk of insufficient preventive maintenance being carried out. Zygmont (1997) recommends that one way to maintain cars in good form is to provide coupons for drivers to redeem at regular intervals for preventative maintenance. The NSW Roads and Traffic Authority has produced an information sheet for fleet owners and operators in New South Wales about reporting vehicle defects in fleet cars. Regulation 92 of the NSW Motor Traffic Act requires vehicle fleet operators to provide forms for drivers to record any faults in vehicles. These forms must be kept for a minimum of six months.
18 MONASH UNIVERSITY ACCIDENT RESEARCH CENTRE
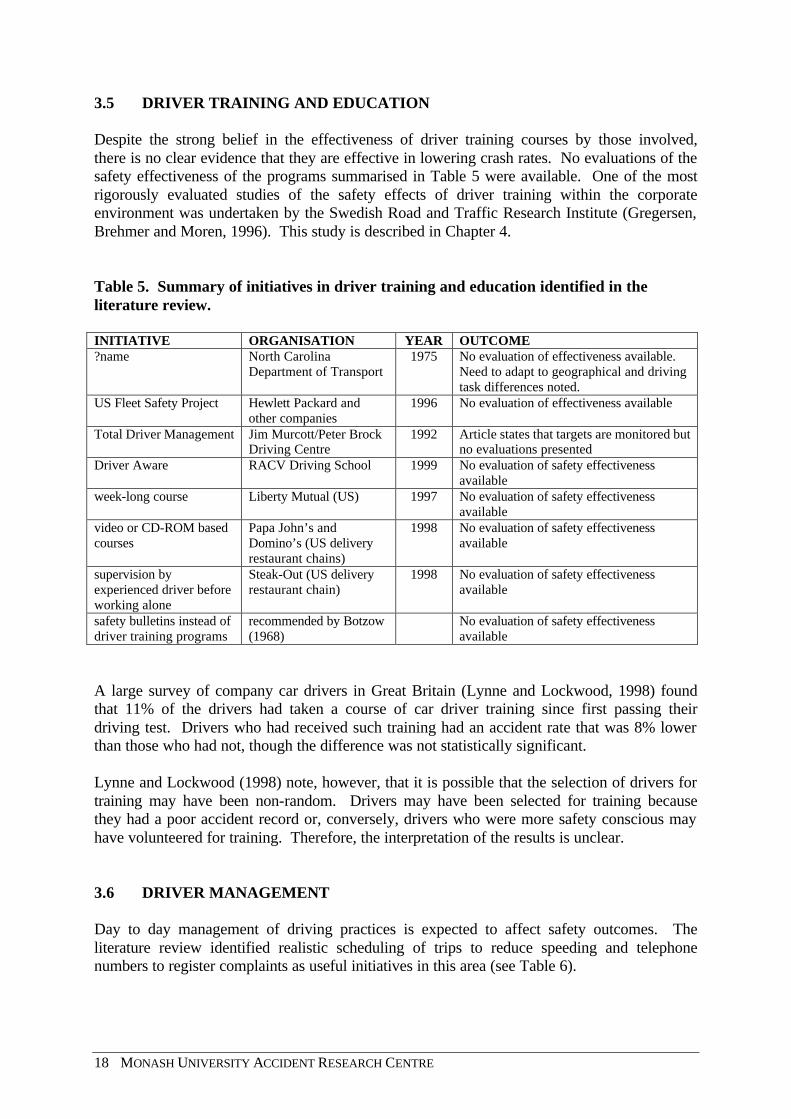
3.5 DRIVER TRAINING AND EDUCATION Despite the strong belief in the effectiveness of driver training courses by those involved, there is no clear evidence that they are effective in lowering crash rates. No evaluations of the safety effectiveness of the programs summarised in Table 5 were available. One of the most rigorously evaluated studies of the safety effects of driver training within the corporate environment was undertaken by the Swedish Road and Traffic Research Institute (Gregersen, Brehmer and Moren, 1996). This study is described in Chapter 4. Table 5. Summary of initiatives in driver training and education identified in the literature review. INITIATIVE ORGANISATION YEAR OUTCOME ?name North Carolina
Department of Transport 1975 No evaluation of effectiveness available.
Need to adapt to geographical and driving task differences noted.
US Fleet Safety Project Hewlett Packard and other companies
1996 No evaluation of effectiveness available
Total Driver Management Jim Murcott/Peter Brock Driving Centre
1992 Article states that targets are monitored but no evaluations presented
Driver Aware RACV Driving School 1999 No evaluation of safety effectiveness available
week-long course Liberty Mutual (US) 1997 No evaluation of safety effectiveness available
video or CD-ROM based courses
Papa John’s and Domino’s (US delivery restaurant chains)
1998 No evaluation of safety effectiveness available
supervision by experienced driver before working alone
Steak-Out (US delivery restaurant chain)
1998 No evaluation of safety effectiveness available
safety bulletins instead of driver training programs
recommended by Botzow (1968)
No evaluation of safety effectiveness available
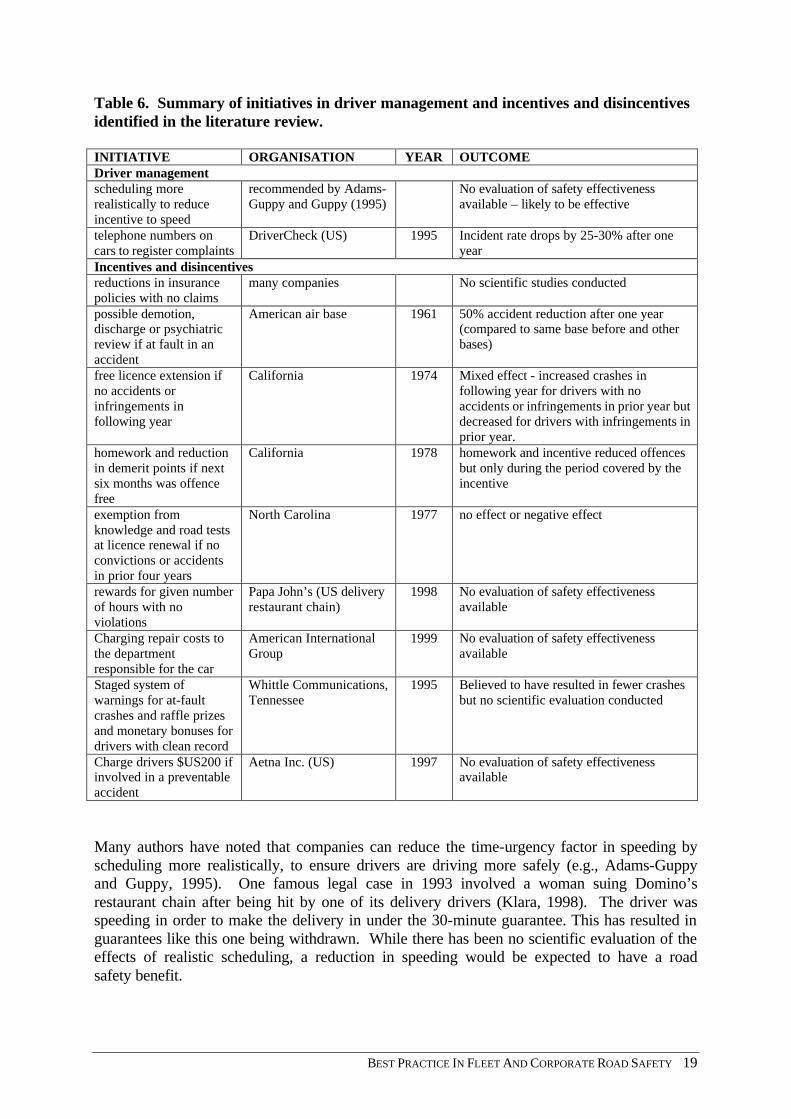
A large survey of company car drivers in Great Britain (Lynne and Lockwood, 1998) found that 11% of the drivers had taken a course of car driver training since first passing their driving test. Drivers who had received such training had an accident rate that was 8% lower than those who had not, though the difference was not statistically significant. Lynne and Lockwood (1998) note, however, that it is possible that the selection of drivers for training may have been non-random. Drivers may have been selected for training because they had a poor accident record or, conversely, drivers who were more safety conscious may have volunteered for training. Therefore, the interpretation of the results is unclear. 3.6 DRIVER MANAGEMENT Day to day management of driving practices is expected to affect safety outcomes. The literature review identified realistic scheduling of trips to reduce speeding and telephone numbers to register complaints as useful initiatives in this area (see Table 6).
BEST PRACTICE IN FLEET AND CORPORATE ROAD SAFETY 19
Table 6. Summary of initiatives in driver management and incentives and disincentives identified in the literature review. INITIATIVE ORGANISATION YEAR OUTCOME Driver management scheduling more realistically to reduce incentive to speed
recommended by Adams-Guppy and Guppy (1995)
No evaluation of safety effectiveness available – likely to be effective
telephone numbers on cars to register complaints
DriverCheck (US) 1995 Incident rate drops by 25-30% after one year
Incentives and disincentives reductions in insurance policies with no claims
many companies No scientific studies conducted
possible demotion, discharge or psychiatric review if at fault in an accident
American air base 1961 50% accident reduction after one year (compared to same base before and other bases)
free licence extension if no accidents or infringements in following year
California 1974 Mixed effect - increased crashes in following year for drivers with no accidents or infringements in prior year but decreased for drivers with infringements in prior year.
homework and reduction in demerit points if next six months was offence free
California 1978 homework and incentive reduced offences but only during the period covered by the incentive
exemption from knowledge and road tests at licence renewal if no convictions or accidents in prior four years
North Carolina 1977 no effect or negative effect
rewards for given number of hours with no violations
Papa John’s (US delivery restaurant chain)
1998 No evaluation of safety effectiveness available
Charging repair costs to the department responsible for the car
American International Group
1999 No evaluation of safety effectiveness available
Staged system of warnings for at-fault crashes and raffle prizes and monetary bonuses for drivers with clean record
Whittle Communications, Tennessee
1995 Believed to have resulted in fewer crashes but no scientific evaluation conducted
Charge drivers $US200 if involved in a preventable accident
Aetna Inc. (US) 1997 No evaluation of safety effectiveness available
Many authors have noted that companies can reduce the time-urgency factor in speeding by scheduling more realistically, to ensure drivers are driving more safely (e.g., Adams-Guppy and Guppy, 1995). One famous legal case in 1993 involved a woman suing Domino’s restaurant chain after being hit by one of its delivery drivers (Klara, 1998). The driver was speeding in order to make the delivery in under the 30-minute guarantee. This has resulted in guarantees like this one being withdrawn. While there has been no scientific evaluation of the effects of realistic scheduling, a reduction in speeding would be expected to have a road safety benefit.
20 MONASH UNIVERSITY ACCIDENT RESEARCH CENTRE
Some companies use toll-free telephone numbers printed on the cars to monitor their drivers. DriverCheck in Atlanta is a company that operates such a system on behalf of fleet customers (Kedjidjian, 1995). Following a telephone report to DriverCheck, the company to whom the vehicle belongs receives an incident report. The driver is called in to speak to a manager. The manager will praise the driver if it was a positive report. If it is a negative report, the driver is given the opportunity to give their perspective, and then appropriate action is taken. Appropriate action includes re-emphasising company focus on driver safety, presenting a verbal or written warning, encouraging attendance at a defensive driving course or suspending or terminating the driver. DriverCheck claims that, on average, companies reduce their incident rate 25-30% after one year on the program (Kedjidjian, 1995). The incident rate then drops slightly again, and plateaus at the third year. The initiative has then become part of the corporate culture. 3.7 INCENTIVES AND DISINCENTIVES 3.7.1 General principles Theoretically, the most effective incentive programs (Hagenzieker, 1988; Wilde, 1988, both cited in Janssen, 1991): • provide an incentive that is proportional to the actual reduction in accident rates achieved, • are based on group (rather than individual) contingency, • provide a large incentive to a small number of eligible drivers (selected by lottery), rather
than a small incentive to all eligible drivers. Wilde and Murdoch (1982) proposed that an accident prevention strategy derived from Risk Homeostasis Theory would: • decrease the perceived benefits of risky behaviour (e.g., pay taxi drivers per time unit, not
distance), • decrease the perceived costs of cautious behaviour (e.g., make safety features in vehicles
cheaper), • increase the perceived benefits of cautious behaviour (e.g., institute incentives and
rewards for accident-free and violation-free driving), and • increase the perceived costs of risky behaviour (e.g., reduce financial rewards to
employees who do not wear seatbelts). 3.7.2 Reported effects of incentives and disincentives The incentive and disincentive programs reported in the literature are summarised in Table 6. Some programs had negative effects. Waller et al. (1977, cited in Wilde and Murdoch, 1982) concluded that incentive programs (where benefits are conditional upon future safe driving) were superior to reward programs (where benefits are conditional upon previous safe driving). Incentive programs appear to be most effective when the time period in which the desired outcome is expected is short, and their power to prevent accidents is increased once they have been earned. They may also be more effective in younger drivers. There is evidence to indicate that drivers with good records who are given a reward either show no difference or an increase their accident rate.
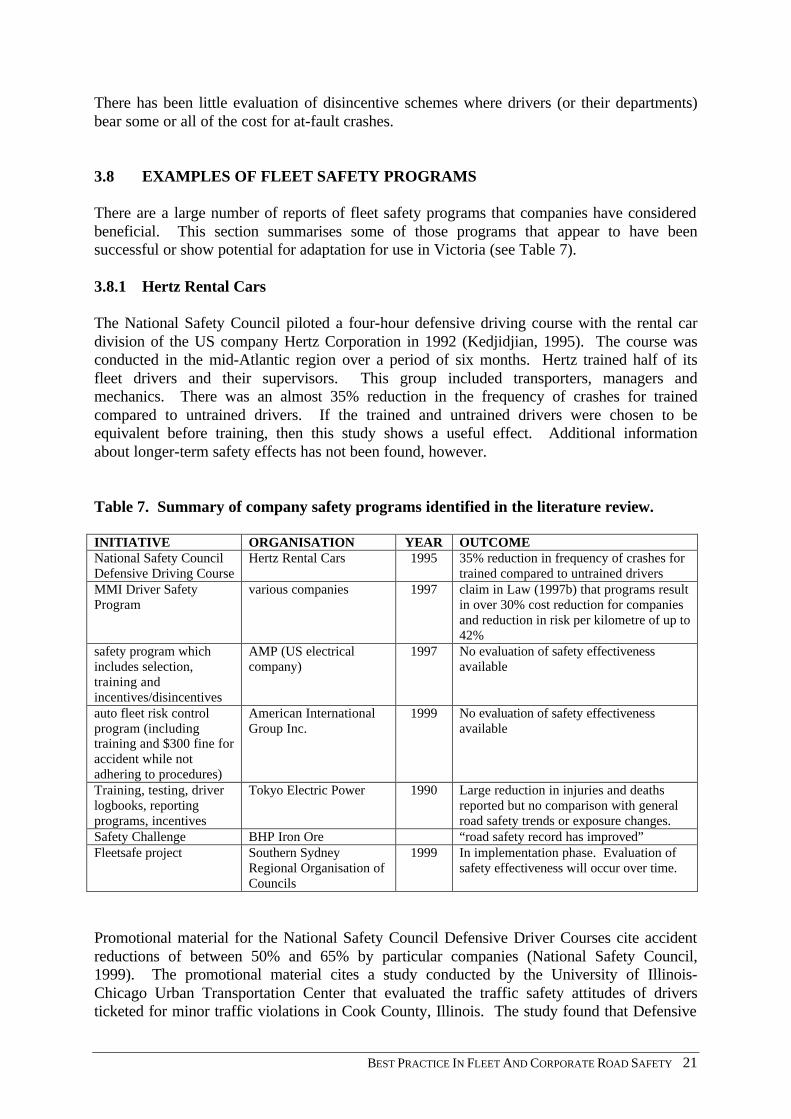
BEST PRACTICE IN FLEET AND CORPORATE ROAD SAFETY 21
There has been little evaluation of disincentive schemes where drivers (or their departments) bear some or all of the cost for at-fault crashes. 3.8 EXAMPLES OF FLEET SAFETY PROGRAMS There are a large number of reports of fleet safety programs that companies have considered beneficial. This section summarises some of those programs that appear to have been successful or show potential for adaptation for use in Victoria (see Table 7). 3.8.1 Hertz Rental Cars The National Safety Council piloted a four-hour defensive driving course with the rental car division of the US company Hertz Corporation in 1992 (Kedjidjian, 1995). The course was conducted in the mid-Atlantic region over a period of six months. Hertz trained half of its fleet drivers and their supervisors. This group included transporters, managers and mechanics. There was an almost 35% reduction in the frequency of crashes for trained compared to untrained drivers. If the trained and untrained drivers were chosen to be equivalent before training, then this study shows a useful effect. Additional information about longer-term safety effects has not been found, however. Table 7. Summary of company safety programs identified in the literature review. INITIATIVE ORGANISATION YEAR OUTCOME National Safety Council Defensive Driving Course
Hertz Rental Cars 1995 35% reduction in frequency of crashes for trained compared to untrained drivers
MMI Driver Safety Program
various companies 1997 claim in Law (1997b) that programs result in over 30% cost reduction for companies and reduction in risk per kilometre of up to 42%
safety program which includes selection, training and incentives/disincentives
AMP (US electrical company)
1997 No evaluation of safety effectiveness available
auto fleet risk control program (including training and $300 fine for accident while not adhering to procedures)
American International Group Inc.
1999 No evaluation of safety effectiveness available
Training, testing, driver logbooks, reporting programs, incentives
Tokyo Electric Power 1990 Large reduction in injuries and deaths reported but no comparison with general road safety trends or exposure changes.
Safety Challenge BHP Iron Ore “road safety record has improved” Fleetsafe project Southern Sydney
Regional Organisation of Councils
1999 In implementation phase. Evaluation of safety effectiveness will occur over time.
Promotional material for the National Safety Council Defensive Driver Courses cite accident reductions of between 50% and 65% by particular companies (National Safety Council, 1999). The promotional material cites a study conducted by the University of Illinois-Chicago Urban Transportation Center that evaluated the traffic safety attitudes of drivers ticketed for minor traffic violations in Cook County, Illinois. The study found that Defensive
22 MONASH UNIVERSITY ACCIDENT RESEARCH CENTRE
Driver Course students showed a marked improvement in driver attitudes about traffic safety and this improvement was evident across sex, age and ethnicity. 3.8.2 Tokyo Electric Power Tokyo Electric Power is a large electric company in Japan with an excellent safety record (Motor fleet management at an enterprise, 1990). The company fleet consists of approximately 8,000 four-wheeled vehicles and 400 two-wheeled vehicles. The average distance covered over one year is 57 million kilometres. General safety is part of the company culture. Management takes it as their responsibility, and takes it seriously. The company philosophy focuses on prevention rather than cure and safety measures are adapted to the local environment. The company examined the trends of road accidents that had occurred within the previous three years, and then developed countermeasures to combat the problems. As part of the program, all crashes are reported and studied by management in order to prevent similar accidents from occurring. Training is tailored to the types of accidents that occur. Near misses are used as formal learning experiences. They are reported monthly and discussed biannually. Information about crashes in which a vehicle is damaged is sent to each office regularly so that they can learn from it. Within Tokyo Electric Power there is a company authorised driver licensing system that has been in place since 1965. This sets the criteria that drivers must reach in terms of driving skill and manners. There is a standard procedure that is adapted for the different offices. This comprises training and a test. Those who fail are given additional training. Once passed, a certificate is given. Each driver possess a personalised handbook that contains their driving record (qualifications, any training, how many hours they have been driving etc) and they are required to fill it out every day. They must record their health, how much sleep they have had, and how much driving they did the previous day. This has to be approved by a supervisor, who may give advice depending on what they find. Each vehicle is fitted with a tachometer and speed alarm to monitor the drivers. Offices and drivers with no accidents are commended for their record regularly. Sometimes prizes are given for outstanding performance. Traffic safety campaigns are conducted by the company at the same time as national traffic safety programs are conducted, as well as at other times. Activities are tailored to each office, and are designed in conjunction with the local community. Safety campaigns have included training to foresee traffic dangers, case studies of previous crashes, emphasis on seatbelt wearing and anticipating the behaviour of pedestrians. There have been no deaths from accidents reported since 1983. According to the records, about 100 people a year were reported as either being injured or dying in traffic accidents in the 1960s, about 50 in the early 1970s, and about 10 a year in the last few years.
BEST PRACTICE IN FLEET AND CORPORATE ROAD SAFETY 23
3.8.3 BHP Iron Ore BHP Iron Ore set out to improve their road safety record after the company experienced a number of serious road crashes, including a fatality (The Government of Western Australia and the Road Safety Council, undated). The BHP Iron Ore Safety Challenge aimed to • reduce the number of vehicle crashes, • improve the level of medical treatment available if a crash did occur, • increase the skill level and practical experience of employees and contractors. Over a two year period, BHP addressed the following issues: • speeding, • inexperience, • fatigue, • poorly equipped vehicles, • alcohol and drugs. A Driver Training Program was introduced. This involved targeting the type of driving skill every driver required and employees were banned from driving company vehicles until they reached the required level of competency. The fleet itself was overhauled, new safety equipment was installed and weekly vehicle inspections were carried out. Extensive education campaigns, a scheme to detect alcohol and drugs in the workplace, new signs and warning lights at major intersections and a campaign of reducing exposure to at-risk driving were introduced. The road safety record at BHP improved as a result of these initiatives. The BHP program was a winner in the 1997 Western Australian Best Practice Road Safety Awards. 3.8.4 Local government FleetSafe Project The FleetSafe Project has developed a policy and procedures to improve fleet safety in 12 Councils in southern Sydney. These Councils have a combined fleet of about 2,720 light and heavy vehicles. The FleetSafe Project was coordinated by the Southern Sydney Regional Organisation of Councils (SSROC). Funding for the project was provided by the Roads and Traffic Authority of NSW. The motivation for the initiative was that the 12 Councils had an annual accident rate of about 50%, which is approximately double the average for fleets. This corresponded to a $1.2 million annual repair bill and annual insurance premiums of approximately $900,000. The FleetSafe policies and procedures were developed by a team from all of the Councils which covered a range of disciplines involved in Council fleet management including risk management, occupational health and road safety. The FleetSafe Project was the joint winner of the 1999 Local Government Excellence in Road Safety Awards. The Project was described by the judges as a sustainable model with statewide applications in both government and industry.
24 MONASH UNIVERSITY ACCIDENT RESEARCH CENTRE
The FleetSafe program is divided into three sections: • Model FleetSafe Policy - This is a general model that Councils can incorporate with minor
individual changes. • Recommended Guidelines - A detailed set of best practice procedures. • Implementing and Maintaining the FleetSafe Program - A guide to successful
implementation. The Model FleetSafe Policy The Policy defines vehicles as workplaces for the purposes of Occupational Health and Safety policy as many staff are required to drive them in the course of their work. This document urges Councils to take responsibility for vehicle safety within their organisations, rather than leaving it up to external organisations such as government agencies. Recommended Guidelines These guidelines represent best practice according to the knowledge of the SSROC members and expert staff. They represent the practical implementation of the policy and can be modified somewhat by individual Councils. Implementing and maintaining the FleetSafe Program It is hoped that by the end of 2001, all Councils that follow the FleetSafe Program will have improved fleet safety records. The SSROC is setting up a FleetSafe Steering Group to assist Councils to implement FleetSafe effectively. The SSROC also has a number of other strategies to assist Councils, such as procuring government funding to produce educational material and approaching insurance companies to assist with safe driving initiatives. 3.9 CONCLUSIONS The literature review identified a large number of references to fleet safety in industry magazines and relatively few references in the scientific literature. There were numerous claims of likely or possible crash savings resulting from fleet safety programs (e.g. Law, 1997b; Lloyd in Anonymous (what should driver education mean), 1993; Martin in Kedjidjian, 1995; Motor fleet management at an enterprise, 1990; Murcott, 1992, Smith in Kedjidjian, 1995; Williams in Minahan, 1997). However, the number of initiatives which had been evaluated were few (e.g. Hertz study by National Safety Council in Kedjidjian, 1995; and the Swedish Televerket Study in the next section). The likely effectiveness of different types of fleet safety initiatives is summarised in Table 8. There was very little literature available about the effects of fleet safety programs on safety of non-work-related driving by employees. The restricted nature of data collection undertaken may mean that employers know little about this – and state accident databases are not suited to monitoring this.
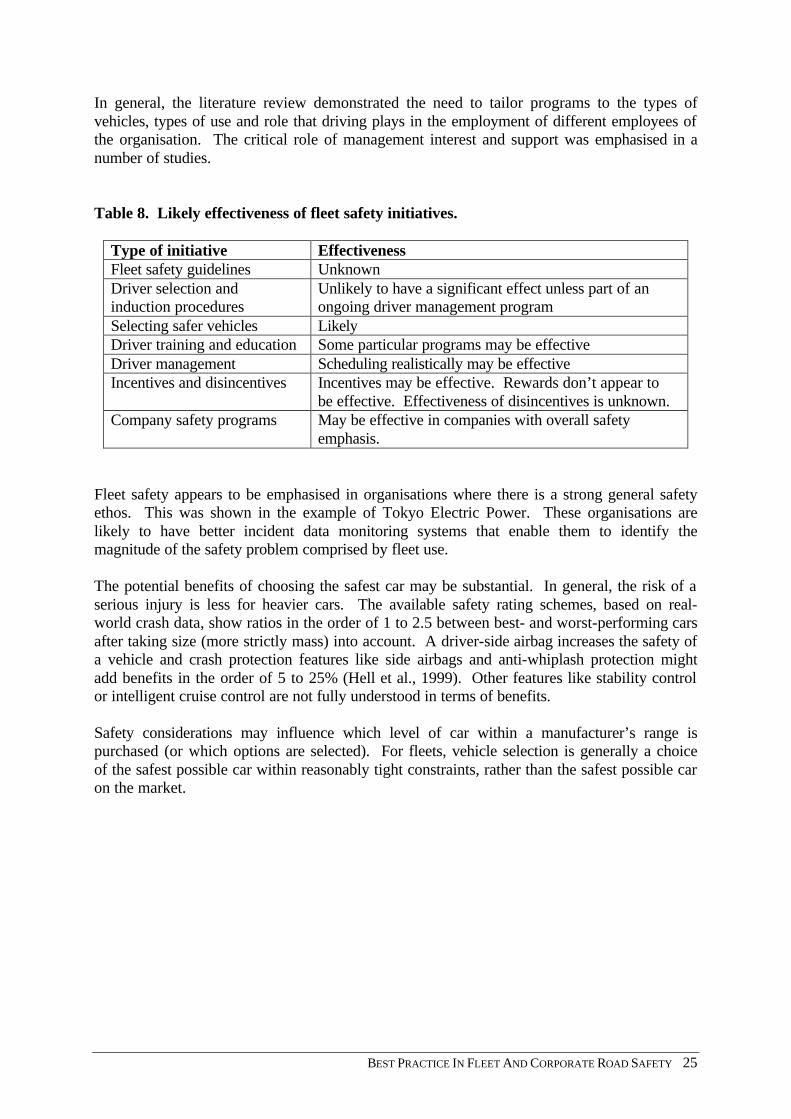
BEST PRACTICE IN FLEET AND CORPORATE ROAD SAFETY 25
In general, the literature review demonstrated the need to tailor programs to the types of vehicles, types of use and role that driving plays in the employment of different employees of the organisation. The critical role of management interest and support was emphasised in a number of studies. Table 8. Likely effectiveness of fleet safety initiatives.
Type of initiative Effectiveness Fleet safety guidelines Unknown Driver selection and induction procedures
Unlikely to have a significant effect unless part of an ongoing driver management program
Selecting safer vehicles Likely Driver training and education Some particular programs may be effective Driver management Scheduling realistically may be effective Incentives and disincentives Incentives may be effective. Rewards don’t appear to
be effective. Effectiveness of disincentives is unknown. Company safety programs May be effective in companies with overall safety
emphasis. Fleet safety appears to be emphasised in organisations where there is a strong general safety ethos. This was shown in the example of Tokyo Electric Power. These organisations are likely to have better incident data monitoring systems that enable them to identify the magnitude of the safety problem comprised by fleet use. The potential benefits of choosing the safest car may be substantial. In general, the risk of a serious injury is less for heavier cars. The available safety rating schemes, based on real-world crash data, show ratios in the order of 1 to 2.5 between best- and worst-performing cars after taking size (more strictly mass) into account. A driver-side airbag increases the safety of a vehicle and crash protection features like side airbags and anti-whiplash protection might add benefits in the order of 5 to 25% (Hell et al., 1999). Other features like stability control or intelligent cruise control are not fully understood in terms of benefits. Safety considerations may influence which level of car within a manufacturer’s range is purchased (or which options are selected). For fleets, vehicle selection is generally a choice of the safest possible car within reasonably tight constraints, rather than the safest possible car on the market.

26 MONASH UNIVERSITY ACCIDENT RESEARCH CENTRE
BEST PRACTICE IN FLEET AND CORPORATE ROAD SAFETY 27
4.0 REVIEW OF EUROPEAN RESEARCH AND PROGRAMS 4.1 FLEET AND CORPORATE SAFETY IN SWEDEN Sweden is a country where corporate behaviour strategies have been fairly well developed, although there are few documented outcome studies so far. Swedish research and initiatives in fleet and corporate safety include: • The Swedish Telecom study. • Swedish National Road Administration’s (SNRA) own travel and vehicle rent/purchasing
policy as well as safety/environmental parameters used in tendering processes for different kinds of transport services.
• SNRA material on transport quality used to stimulate local governments, commercial
companies and state authorities. • a Swedish book on how corporations can buy and use vehicles that give better economy,
safety and environmental impact. 4.1.1 Televerket study Gregersen, Brehmer and Moren (1996) undertook an experimental study in a large company, the Swedish telecommunications company, ‘Televerket’. This company has about 15,000 drivers. In the previous eight years, the ten deaths in the company were all in car crashes. There were five groups of around 900 drivers each: • a driver training group, • a campaign group, • a group discussion group, • a bonus group and • a control group. The groups were constrained to be similar to each other by matching small groups of working units around the country. The driver training group experienced training in three areas, each lasting around 2.5 hours (making a complete course of 7.5 to 8 hours). The aim of training was to teach drivers their limitations as well as some skills, which is different to most driver training programs. The three components were manoeuvring (familiarise the driver with the car during normal driving), skid training (basic knowledge about icy roads and to teach the driver their limitations) and commentary driving (to improve the drivers perception and interpretation of events, and to influence driver behaviour). The campaign group was exposed to information on various safe driving techniques over the period of a year. Each season, tips for safer driving during that season were given to the drivers in this group, and all the information was summarised at the end of the year. In addition, videos were watched and pamphlets were given out over the year.

28 MONASH UNIVERSITY ACCIDENT RESEARCH CENTRE
The group discussion group met three times for about one hour each time. They met in small, local groups of 8-15 drivers and discussed specific and well-known road safety problems and solutions. The discussions were led by specially trained members of the groups. The bonus group was offered a monetary bonus for the whole group based on group (rather than individual) driving results. Drivers were told the details of the bonus at an introductory meeting. There was no follow up information given. The details were as follows. A set amount was allocated to the group at the start of the year depending on the size of the group. Each accident resulted in an amount being deducted from the initial sum. This amount varied depending on the severity of the crash. At the end of the year the group was given the money to do with as they pleased. The control group were not exposed to any interventions and were not aware that they were a control group. Accident risk was calculated as accidents in relation to mileage two years before and two years after the measures were introduced. Accident severity was measured by accident cost. One statistical limitation of the study was that dropouts were not monitored. Dropouts have been estimated at between 10 to 20%. The results do not take dropouts into account. The results indicated that there were reductions in accident risk for the driver training, group discussion and bonus groups, with the bonus group showing the least reduction. The campaign group and the control group showed no reduction. All experimental groups showed a reduction in costs, with the group discussion group showing the largest reduction. The control group showed no reduction in costs. It appears that the campaign group did not have a reduction in the number of crashes, but did have a reduction in the severity of crashes. The group discussion and special form of driver training were the most effective measures. The cheapest measure was the group discussions and the most expensive measure was the driver training. It is possible that group discussion was so effective because drivers in these groups made personal decisions about their driving. In contrast, a campaign does not link intention and action (Lewin, 1947, in Gregersen, Brehmer and Moren, 1996). It also made the group norms more explicit and was a forum for information exchange. 4.1.2 Fleet and corporate road safety in Vision Zero The operational strategy of Vision Zero includes a move to public authorities applying quality assurance principles to work-related travel. “The operational strategy of Vision Zero means that public authorities should, for example, take considerably greater responsibility for the quality assurance of their road transports, official business trips, and trips to and from work, so-called work-related trips from a road safety and environmental point of view. If this is done in an organized way throughout society, there will be significant impact on the road traffic safety within the country” (Ministry of Transport and Communications, 1997, p.40). Under this model, the Government is an influential customer, no longer only a regulator. According to the Swedish model “further demands [on transport service providers] can be made under the condition that they occur in open competition in a non-discriminatory manner” (Belin, Johansson, Lindberg and Tingvall, 1997, p.9).
BEST PRACTICE IN FLEET AND CORPORATE ROAD SAFETY 29
Quality assurance of transport aims to ensure that people and goods arrive at the right place, at the right time and in the right way (i.e. without danger of serious injury or damage to the goods or the environment in connection with the transport). Quality assurance from a road safety and environmental point of view involves: • influencing the need for road transport • influencing how road transport is implemented • influencing the choice of vehicle, equipment and fuel. According to the Ministry of Transport and Communications, management is responsible for setting up goals and establishing policy for quality assurance, providing organisational and financial backing for the work and ensuring that the outcomes are monitored. 4.1.3 Linking road safety and environmental goals Traditionally, road safety and environmental concerns have been viewed as conflicting. More recently, particularly in Sweden and the Netherlands, many road safety and environmental measures have been shown to be mutually beneficial. For example, a reduction in speeding is likely to result in a reduction in fuel consumption. A number of speed management systems improve traffic flow and thus reduce fuel consumption. Importantly, any efforts to reduce travel for environmental reasons are likely to reduce levels of road trauma. Fuel consumption and emissions are related to each other, as well as to safety (in terms of speed and non-aggressive driving). Fuel consumption can be used as a performance indicator for all transport operations. Linking road safety and environmental goals may serve to increase support for both types of goals. In addition, concepts and implementation processes used in the environmental movement may have the potential to provide models for road safety planning and implementation. For example, environmentalists appear to have been more successful in making the point that the environment is paramount, than road safety agencies have been in stating that safety is paramount. There are a number of reasons to try to merge road safety and the environment. There are true areas of mutual benefit, such as reduced energy consumption that is related to pollution, carbon dioxide emissions and speed which is related to safety. A more even distribution of vehicles, with less power, is also beneficial, as well as redesign of built-up areas. Given the strong role of the environmental area, this could mean that there is more and stronger support for safety issues. It is likely to be easier to achieve an attractive road transport system for the future if safety and environmental interests and solutions have synergies instead of being in conflict.
30 MONASH UNIVERSITY ACCIDENT RESEARCH CENTRE
4.1.4 Swedish National Road Administration Travel Policy The ”travel policy” of the Swedish National Road Administration (SNRA) was introduced in January 1998. This policy relates to fleet cars and rental cars used by the employees. The safety specification relates to frontal and side protection, weight of the vehicle and ABS brakes. The use of the vehicle in terms of safety has also been specified. The main environmental issue was fuel consumption. Several agencies and corporations have followed the example, and it is expected that the Swedish government will decide that all state agencies should have a similar travel policy. This will include outsourced vehicles and transport as well as transport made within the organisation. A process evaluation is underway but no data are currently available. 4.1.5 Purchasing safe transport services, Borlänge local government In 1997, Borlänge Municipality in Sweden commenced to a program to purchase transport services in which safety is one of the key elements. Providers of transport have to deliver the transport service in a way that is safe in terms of vehicle used, drivers used and the way the vehicle is driven. In the contracts between the local government and the providers, it is specified that the provider must have a quality system in place to be able to guarantee that the standard is followed. A local non-govermental traffic safety organisation was contracted to do some of the audits to ensure that safety systems were in place. A trial of electronic speed monitoring is being undertaken by the Borlänge Municipality and the Swedish Association of Local Authorities. The purpose of the trial is to test and develop technical solutions for vehicle-based speed control of publicly procured road transport. The work involves a number of transport firms. GIS/GPS systems have been installed in vehicles for quality assurance of speed. When a vehicle exceeds the speed limit, and the driver does not slow down, the speeding is recorded and dealt with within the quality management system of the supplier. This is gradually developing, not only in Borlänge. 4.1.6 Taxi company safety and environmental policy in Sodertalje The taxi company in Sodertalje, a city with many large companies, has developed and implemented a safety and environmental policy in order to provide especially the large clients with a safe and environmentally sound transport service. The policy is seen to create a better market position, and the taxi company claims they have more clients than before. It is also seen as positive from some of their very large clients. The policy relates mainly to driving, requiring that speed limits should be kept and that special consideration should be paid to unprotected road users. 4.1.7 Purchasing of taxi and tram transport in Gothenburg Local government in Gothenburg purchases bus and tram services from a corporation. In the contracts, specific requirements in terms of speed etc. are built into the contract. The speeds mentioned go beyond the speed limits in terms of lower speeds in certain areas. If speed limits are exceeded, the contract is used to negotiate the consequenses. This is an example where actual road user legislation is combined with contracts. While road user regulation is used in
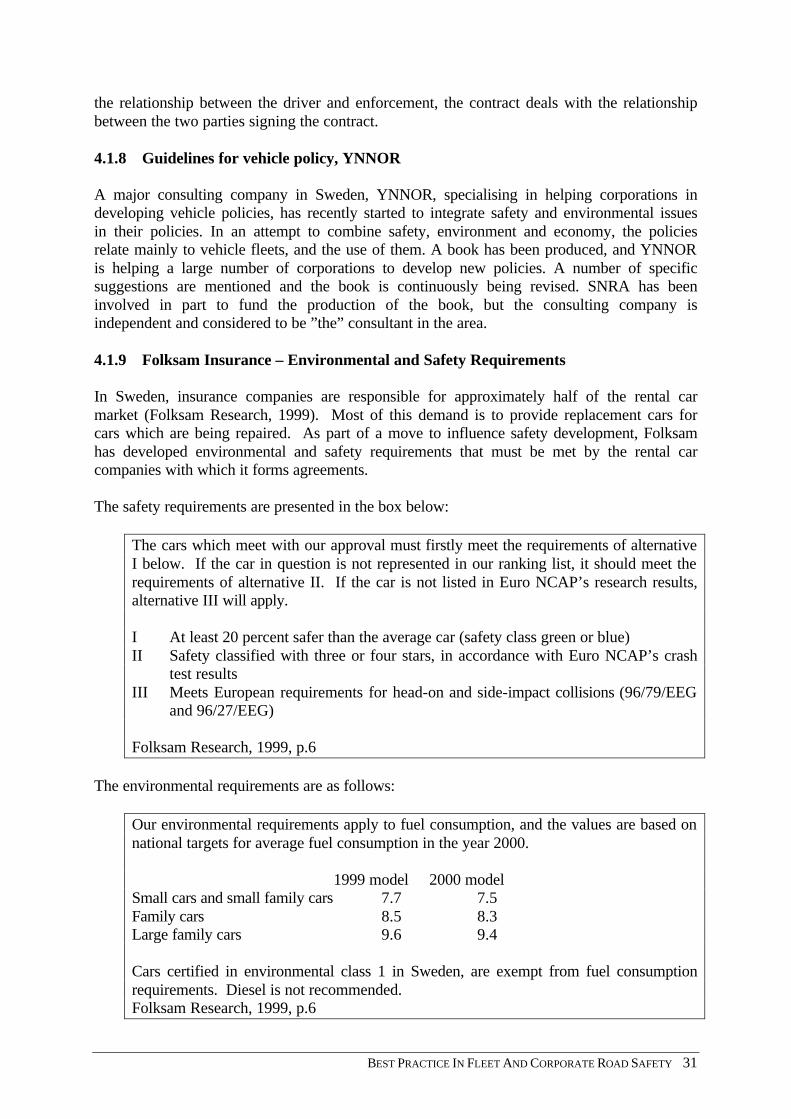
BEST PRACTICE IN FLEET AND CORPORATE ROAD SAFETY 31
the relationship between the driver and enforcement, the contract deals with the relationship between the two parties signing the contract. 4.1.8 Guidelines for vehicle policy, YNNOR A major consulting company in Sweden, YNNOR, specialising in helping corporations in developing vehicle policies, has recently started to integrate safety and environmental issues in their policies. In an attempt to combine safety, environment and economy, the policies relate mainly to vehicle fleets, and the use of them. A book has been produced, and YNNOR is helping a large number of corporations to develop new policies. A number of specific suggestions are mentioned and the book is continuously being revised. SNRA has been involved in part to fund the production of the book, but the consulting company is independent and considered to be ”the” consultant in the area. 4.1.9 Folksam Insurance – Environmental and Safety Requirements In Sweden, insurance companies are responsible for approximately half of the rental car market (Folksam Research, 1999). Most of this demand is to provide replacement cars for cars which are being repaired. As part of a move to influence safety development, Folksam has developed environmental and safety requirements that must be met by the rental car companies with which it forms agreements. The safety requirements are presented in the box below:
The cars which meet with our approval must firstly meet the requirements of alternative I below. If the car in question is not represented in our ranking list, it should meet the requirements of alternative II. If the car is not listed in Euro NCAP’s research results, alternative III will apply. I At least 20 percent safer than the average car (safety class green or blue) II Safety classified with three or four stars, in accordance with Euro NCAP’s crash
test results III Meets European requirements for head-on and side-impact collisions (96/79/EEG
and 96/27/EEG) Folksam Research, 1999, p.6
The environmental requirements are as follows:
Our environmental requirements apply to fuel consumption, and the values are based on national targets for average fuel consumption in the year 2000. 1999 model 2000 model Small cars and small family cars 7.7 7.5 Family cars 8.5 8.3 Large family cars 9.6 9.4 Cars certified in environmental class 1 in Sweden, are exempt from fuel consumption requirements. Diesel is not recommended. Folksam Research, 1999, p.6
32 MONASH UNIVERSITY ACCIDENT RESEARCH CENTRE
4.2 FLEET AND CORPORATE SAFETY IN FRANCE 4.2.1 Road safety and private companies In France, there has been a program to increase the involvement of private companies in road safety related to their use of vehicles. Agreements have been drawn up between government, insurance companies, the national occupational health fund and volunteer companies. Employees of the companies form groups interested in road safety and sign a charter. The first aspect is dealing with the initial lack of data because companies do not feel that persons driving are as much their responsibility, because the company has less control over them than over workers on their premises. The second aspect is that the induced cost of road accidents for the company is not well known. They have to change this by doing the calculations of costs, including calculation of benefit cost ratios. Unfortunately, there have been difficulties with availability of data from the occupational health fund in the past. As part of the program, the national occupational health fund will decrease premiums if programs are implemented. There is also a reduction in vehicle insurance premiums. After World War II and again in the 1950s, the government forced insurance companies to help in road safety. Therefore, the government can put pressure on insurance companies. 4.2.2 Clubs Entreprises In France, 1,300 road fatalities per year are work-related. This comprises more than 10% of all road deaths and more than 55% of industrial fatalities (Leclercq and Virenque, 1997). In 1994 the Department of Development, Housing, Transport and Tourism recommended the establishment of “Clubs Entreprises”. The Clubs are organised as associations in nine regions. Leclercq and Virenque state that the association in Haute-Garonne has 38 partner companies which correspond to about 69,000 employees, 17,500 vehicles and 218 million kilometres of vehicle travel per year. The objectives of the association are • to lessen the human and economic costs of road accidents, in promoting actions of
awareness, prevention and traffic safety • to work cooperatively • to mobilise companies about a common plan, and • to facilitate the exchange of ideas and experiences among the partners. The actions undertaken by the Clubs include training in road safety inspection, communication (publication of a newsletter and campaigns and promotions) and increasing awareness. The awareness activities include: • a book for observations which allows employees to notify dangerous situations or
defective facilities in traffic safety. Each form is transmitted to the relevant department and is personally answered
• establishment of a diagnostic form to monitor trends in traffic accidents in firms, completed by an action form
• management of a departmental plan for traffic safety called “Saturday evening, think to Sunday morning”
• a variety of competitions.
BEST PRACTICE IN FLEET AND CORPORATE ROAD SAFETY 33
Given the high level of misuse of alcohol in France, Clubs Entreprises have been concerned about drink driving in the work situation. While there are no clear statistics available, it is estimated that alcohol abuse could be involved in about 15 percent of work-related traffic accidents (Dally, 1993; Gisselman, 1989; both cited in Leclercq and Virenque, 1997). The association of Clubs Entreprises in Haute-Garonne has organised seminars on “alcohol when driving and in the firm”. The lecturers are volunteers or paid by the company. The seminars comprise presentations on: • the size and cost of the problem (presented by an emergency physician or insurance agent) • the rules: checks, sanctions and penalties (presented by a policeman) • the consequences at insurance level (presented by an insurance agent) • the clinical and psychological aspects, detection and treatment (presented by an
emergency physician) • examples of successful prevention programs in firms (presented by a work physician and
a person responsible for prevention of alcohol risk) • the task of associations for the prevention of alcoholism (presented by a person
responsible for prevention of alcohol risk). The material presented in the seminars has been published and can be used as reference material by prevention personnel in the firms. A set of transparencies has also been developed. There was a program similar to the French Clubs Entreprises in Spain which was very successful. 4.3 FLEET AND CORPORATE SAFETY PROGRAMS IN OTHER EUROPEAN COUNTRIES 4.3.1 Germany The German Traffic Safety Council is a registered association which has entitled its current program “Safety All The Way” (Schork, 1997). It has undertaken programs in conjunction with the German occupational accident insurance funds to improve traffic safety in companies. The programs have been accepted because of their economic and environmental benefits. The Council promoted the establishment of voluntary safety circles in which employees from the company vehicle fleet met together to discuss critical points and devise solutions under the leadership of an experienced moderator. A new one-day training course in “Safe, Economical and Environmentally Friendly Driving” is proving popular. 4.3.2 United Kingdom Unlike the rest of Europe, a large proportion of the vehicle population in the United Kingdom consists of cars that are owned or financed by companies, with over half of all new cars sold being registered in the name of a business. Thus the private/fleet vehicle mix in the United Kingdom is somewhat more like that in Australia. An estimated 16% of car miles driven annually in the UK are for business purposes (Department of Transport National Travel Survey, 1997, cited in Bibbings, 1997).
34 MONASH UNIVERSITY ACCIDENT RESEARCH CENTRE
Company cars are on average younger and larger than those that make up the general car population (Downs et al., 1999). Company drivers are more likely to be male, non-manual workers who live in high-income households. As mentioned in Section 2.4, drivers of company cars in Britain are involved in a disproportionate number of road accidents even after age of drivers and mileage are taken into account (Downs et al., 1999). There is legislation in the UK covering health and safety at work which encompasses occupational driving. These laws require that employers create safe systems of work for employees so far as is ‘reasonably practicable’ (Bibbings, 1997). Various measures have been implemented across Britain to improve road safety within organisations. They include driver training programs, incentive schemes, penalties, accident reviews, driver monitoring systems and driver feedback procedures. It is unclear whether these measures have had an effect. However, Downs et al. (1999) found that organisations using a package of different measures to combat road safety problems, rather than one measure alone (eg driver training), were the organisations who felt they had achieved the most in terms of road safety. The study concluded that ‘there are clear indications that fleet safety is most likely to be improved by the introduction of an integrated set of measures based on a strong safety culture within the organisation’ (Downs et al., 1999, p 15). Royal Society for the Prevention of Accidents training programs In the United Kingdom, the Royal Society for the Prevention of Accidents (ROSPA) takes an Occupational Health and Safety perspective, promulgating the benefits of road safety training to the employer and the community. Approximately 800 out of the 3500 fatalities annually are work-related, so major fleet operators can have a significant effect. British Telecom, for example, has 55,000 vehicles, mainly light commercial or passenger. Employer organisations are reached through respective Chambers of Commerce. Similarly, local government has a large stake in road safety and operate large fleets, so they are asked “is your own house in order”, i.e. are they encouraging and facilitating safe driving practice in their own fleets?
BEST PRACTICE IN FLEET AND CORPORATE ROAD SAFETY 35
5.0 INTERVIEWS WITH GOVERNMENT AND CORPORATE REPRESENTATIVES
The approach taken to identify best practice initiatives among Australian organisations was identification (through government and industry contacts) of organisations that are likely to have successful programs and then a targeted follow-up of these organisations. It was considered that this approach would be more efficient than surveying a random sample of organisations. As part of this component of the project, discussions were held with the Australian Fleet Managers Association to identify examples of best practice for further follow-up and for the relationship between fleet safety and corporate safety. 5.1 AUSTRALASIAN FLEET MANAGERS ASSOCIATION AWARDS The Australasian Fleet Managers Association (AfMA) has three annual awards: the Fleet Safety Award, the Fleet Manager of the Year and the Fleet Environmental Award. Award winners have been: Fleet Safety Award 1997 Lumley General Insurance 1998 Orica Australia Pty Ltd and Q-Fleet 1999 Lumley General Insurance Fleet Manager of the Year 1996 Mr Neville Thiele, Manager Services University of South Australia 1997 Mr Rob Cook, Administration Manager Brotherhood of St Laurence 1998 Mrs Gail Casey, Director Fleet SA 1999 Mr James Maher, Asset Management Officer Wodonga Rural City Council Fleet Environment Protection Award 1999 State Transit Authority of NSW Where possible, representatives from these organisations were interviewed by telephone. The following issues were addressed: • what fleet or corporate safety initiatives have been undertaken • which have been successful • how were the initiatives implemented • who was involved in implementation • how were the initiatives evaluated • what were the benefits to the organisation
36 MONASH UNIVERSITY ACCIDENT RESEARCH CENTRE
• what did the intervention cost • how could the initiative and/or the process have been improved • are there any characteristics of the organisation that affected the success of the
intervention (size, nature, location, tasks) • what initiatives are planned for the future 5.2 ORICA Mr Ted Jewell, Fleet Manager for Orica, was interviewed. Over the past few years Orica has introduced a general safety policy that covers all aspects of safety for employees, both in and out of the workplace. The aim of the safety policy is that there are no injuries to anyone at any time. The policy incorporates 24-hour safety. In terms of motor vehicles, this policy has had an extensive influence and a number of initiatives have been undertaken to improve fleet safety within the company. The first of these is a driver training course run by Jim Murcott for Orica. The course has been designed by Orica to reflect their needs and has been run for the past three years. The standard Murcott course has been analysed, 95% of the skills training has been removed and replaced with driver attitude information. The course is compulsory for all drivers who receive a company car, or have their car replaced, and must be undertaken within six months of receiving the new car. Fleet cars are replaced every 18 months to four years, depending on kilometres travelled. Thus, every driver should complete the driver training course once every 18 months to four years. The driver training course is also open to those who drive company cars on an irregular basis (eg. a secretary who will take a company car to complete some official business). On recommendation from their manager, these employees and others who may never drive a company car, are able to complete the driver training course at company cost. The course is also available to members of the families of employees at the same cost as to the company. A second driver training initiative undertaken by Orica recently is a rewriting of the company procedure document on accident prevention. It now includes all relevant company rules regarding motor vehicles. It also includes a driver evaluation form which is used in the following way. Once a year, company drivers have an in-car evaluation with their manager. The manager fills out the driver evaluation form and sends it back to Fleet Management. The idea of this initiative is to keep the focus of driver safety at the front of everyone’s mind, rather than being a test of skill. The Driver Information Booklet has been revised and sent out to all drivers. This includes driver safety messages and an address from the Chief Executive Officer. Orica has produced stickers on which is printed ‘Driving Safety’. Some of these stickers have an Orica label and some have a Dulux label. Stickers are distributed to employees who may stick them on their cars, around the office, around the home, or wherever else they please. It is not compulsory to stick them on company cars. Training has been very successful in lowering accident incidence and severity. However, the effect of the driver training course is beginning to wear off. People don’t want to repeat the
BEST PRACTICE IN FLEET AND CORPORATE ROAD SAFETY 37
same course more than once or twice. Fleet Management would like to revamp the driver training course. Currently, figures are being calculated for company accident rates, including motor vehicle accidents, before and after the award program was introduced a few years ago. The company acknowledges that is difficult to evaluate whether successes are due to company initiatives or other road safety factors such as increased police action and exposure to TAC advertisements. One problem that the company has noted is that speeding infringements have recently increased dramatically. The company does not pay for these fines; the driver does. These infringements are generally less than 10 km/h over the speed limit. Fleet Management is attempting to work out why there has been such an increase lately. The company is recording infringement and accident numbers. They are going to compare those who have accidents with those who have had infringements and those who have completed the driver training course. The impetus for a safety policy originally came from the Chief Executive Officer of a few years ago; Warren Haynes. He was enthusiastic and devoted to issues of safety for all workers at all times. The safety program is still valued by the current Chief Executive Officer and company directors. The impetus has dropped off slightly lately. However, there is a healthy push from Fleet Management as well as the Motor Vehicle Safety Committee. This is a committee that meets once every six weeks. It is made up of the Fleet Manager (Ted Jewell), the garage administrator/training coordinator, the Safety Health and Environment manager, one employee from Dulux, one from the explosives area and one sales manager from the chemical area who is in charge of 15 to 20 sales representatives. Driver training has cost around $350,000 per year over the past four years. It has cost around an extra $5-6 thousand a year for other fleet safety initiatives, not including any costs for the Motor Vehicle Safety Committee. In the future, Orica would like to see a revamping of the driver training program and will continue to record and measure accidents, infringements and training in order to compare the figures. They would like to see improvements in reaffirming the importance of driver safety to all employees from the Chief Executive Officer down, and to maintain a push from the top of the company. The major characteristic of the organisation that affects driver safety initiatives is the push of the general safety ideal of no injuries to anyone at any time. It has created a safety culture within the organisation that has helped create a positive attitude toward driver training. As a final comment, Ted Jewell repeated that unless there is a push from the top it is difficult to make anything happen. This has been reflected in the number of people attending the driver training course over time.
38 MONASH UNIVERSITY ACCIDENT RESEARCH CENTRE
5.3 LUMLEY GENERAL INSURANCE Phil Hetherington, the National Manager of Marketing and Government at Lumleys was interviewed. His predecessor, Colin Tizzard has recently left the company, and Phil is currently responsible for Colin’s portfolio, although this is not his area of expertise. Lumley General Insurance is a company that insures the fleets of other companies. Most of their fleet safety initiatives are focused on the fleets of their clients, rather than their own. Lumley’s fleet is fragmented and small. Employees of Lumley are exposed to the initiatives created for their clients. In terms of formal internal fleet safety, there is a written policy that includes information on safe driving techniques. About 50% of Lumley drivers of company cars have completed a training course at company cost. Managers within the company select those who undertake this course. There is no particular reason why some drivers are recommended to complete this course and others are not. In terms of initiatives focused on clients, there are a number of things Lumley does. Statistical information is supplied to clients. This provides benchmarks about how they are performing, and how they compare with other clients. There is a Loss Control Manual given to clients which outlines best practice from who to hire, to training, to continuing education. A number of places in driver training courses that Lumley believes are useful courses are provided to companies as part of their premium. Companies can send their own staff and so can evaluate these courses themselves. To date, 5 videos have been produced, and 15 pamphlets which are distributed to clients at no charge. The pamphlets outline superior driving techniques on various topics, such as driving at roundabouts and driving on country roads. There are also safety give-aways to clients, such as tyre gauges. Phil believes that it is all the initiatives in combination that contribute to the success of the program. He believes the benchmarking is the most effective of all the initiatives. This is, in effect, an identification of the problem that is given to clients. It is then up to them to deal with it. Future plans include rewriting the Fleet Risk Control Manual, producing new Superior Driver Technique pamphlets, holding new seminars for clients and producing a new video. 5.4 Q-FLEET Q-Fleet supplied their nomination details for the 1998 AfMA Fleet Safety Award and their entry into the 1998 Premier’s Awards for Excellence in Public Sector Management (Category: Services to Rural and Regional Queensland). Q-FLEET is the Queensland Government’s fleet manager. Their literature states that ‘Q-FLEET’s safety program is based on a total approach to safety, encompassing people, their workplace, and the community.’ In 1997, benchmarking by the AfMA and Lumley Insurance indicated that a higher percentage of all crashes by Q-FLEET drivers were at-fault crashes, compared to others in the industry. They attributed this to over-confidence created by the defensive driver training program they were using. A low-risk driver training program was developed called the Q-FLEET Driver Excellence Program. This program aims to change the way drivers think about
BEST PRACTICE IN FLEET AND CORPORATE ROAD SAFETY 39
their safety, as opposed to teaching vehicle control skills only. This course is available in metropolitan and rural areas for Q-FLEET drivers. In addition, specialised courses are offered by Q-FLEET, such as a four-wheel drive course. These were also revised to assess that the low-risk content was adequate. Feedback about the Driver Excellence Program has been enthusiastic. Another useful intervention has been the addition of vehicle accident statistics to Q-FLEET’s Client Access System (CAS). All incidents are recorded through an ‘Accident Report and Claim Form’ that is completed by the driver of the vehicle. This information is then entered into the networked database. The CAS system provides accident information as well as other information and allows clients to monitor their own fleets. Examples of the advantages of this system include the fact that clients are provided with information on which of their cars are due for a service and are provided with their insurance and accident statistics as benchmarked against Q-FLEET as a whole. This system is especially important in maintaining links with rural areas. CAS has recently been put on a password protected internet site for easier access. Other initiatives in place include a regular ‘Road Safety Review’ column in the monthly staff newsletter, insurance discounts or loadings given based on clients’ safety records, new product launches, education seminars and others. In terms of vehicle safety, Q-FLEET only fits manufacturer approved accessories and ensures all maintenance is carried out by trade qualified professionals. In 1995, Q-FLEET performed better overall than 24 other major benchmarked clients. From 97/98 to 98/99, the driver at fault rate per 100 crashes has gone down from 11.80 to 11.12 and the average direct cost of crashes has gone down from $1,700 (adjusted for inflation) to $1,603. Recently (exact year unknown, but probably 1998), in relation to benchmarking, Q-FLEET performed above average in terms of accident rate, percentage of accidents in which the driver was at fault, average cost of a crash and cost per vehicle. In addition, Q-FLEET sponsors a number of existing community programs to help metropolitan and rural areas. These include a ‘Road Awareness and Accident Prevention Program for Young Drivers’ which is an educational program that travels around the state and a ‘Road Safety Education Program’ for young children that includes special components on bicycle and bus safety. Through sponsorship by Q-FLEET, a number of safety programs have been able to expand their areas of operation. 5.5 WODONGA RURAL CITY COUNCIL An interview was conducted with Mr Jim Maher, Asset Management Officer for the Wodonga Rural City Council. Most of the fleet safety initiatives within the Wodonga Rural City Council are focused on heavy vehicles. There are a few initiatives focused on light vehicles also. About 70% of Council vehicles are heavy vehicles, with the remainder being cars and light utilities. There are about 30 cars in the light vehicle fleet. The main initiative in fleet safety undertaken recently was for heavy vehicles. There was a push from strict OH&S rules regarding heavy vehicle safety. As a result of new regulations, the council installed various safety features on all heavy vehicles in the fleet at a cost of
40 MONASH UNIVERSITY ACCIDENT RESEARCH CENTRE
around $3-4,000. In addition, each driver is assessed in-car every 12 months by an external assessor, and those who require training are sent to a training course. The main problem the Wodonga Council had with light vehicles was dints and scratches on cars. There were four countermeasures implemented. The first was that there was an informal educational program designed to instill a sense of ownership in the drivers of fleet vehicles. One way this was done was that when a new car was given to an employee to drive, the features of the car were reviewed with that employee. The second was that employees were made aware of the financial cost of a fleet car. They were told of the effect of damage to the vehicle on resale value and also on the effect this has on their work budget, as vehicle costs are a major cost of many contracts. They were told that when a vehicle was traded in, it must be in perfect condition. The third was that when a new driver was employed, their driving skill was appraised in a number of ways. During interviews, their age, driving experience, number of crashes and how they felt about their own driving skill were assessed. If it was felt that a prospective employee’s driving skill was questionable, they drove Jim Maher a short distance and were assessed in-car. If it was concluded that their driving skill was not acceptable, they were sent to a driver training program at the local car school. The fourth is that cruise control has been installed on all vehicles. This has cut down the number of speeding fines received by council. They receive around eight speeding fines a year. All fines are paid for by drivers. Jim believes instilling a sense of ownership in combination with making employees aware of the financial cost of a fleet vehicle have been the most instrumental in terms of improving vehicle safety. There have been no crashes and no insurance claims for the past 12 months. In addition, residual values on vehicles have increased and Jim believes Wodonga City Council’s cars are spotless when traded in. He is especially proud of this fact as he believes community service vehicles are generally in poor condition when they are traded in. Costs involved in light vehicle safety initiatives include accident management. This involves being able to track trends about who is having crashes and which cars are involved in crashes. In terms of how these countermeasures could have been improved, it would have been beneficial to implement initiatives such as these earlier. The changes were driven by the changes in local government a few years back. It should have been on people’s minds before the issue was forced. The characteristic of the organisation that most affected the changes was the new culture that came with the changes to local government. It is notable that the push was driven from the bottom up in the context of this new culture. For the future, Jim hopes to continue with the initiatives in place at the moment.
BEST PRACTICE IN FLEET AND CORPORATE ROAD SAFETY 41
5.6 BROTHERHOOD OF ST LAURENCE An interview was conducted with Mr Rob Cook, Administration Manager of the Brotherhood of St Laurence. Additional material was obtained from a presentation that he made to the 1998 AfMA Conference. Prior to 1997 the Brotherhood of St Laurence was alerted to the fact that they had a serious fleet safety problem because their insurance premium was continually increasing. Crashes were frequent, significant and growing in number. The Brotherhood was also aware of the hidden costs of crashes, such as lost time. They felt it was necessary to tackle the problem and a number of interventions were introduced. The first was that crash statistics were compiled. Reporting of crashes improved significantly when management of the fleet was outsourced at this time and any repairs required an authority. It was found that most at fault crashes were due to inattention, carelessness or ignorance. Thus improving driver skill was a priority. All staff with a company vehicle were sent to a car control course. This course taught them emergency control skills as well as educating them about defensive and protective driving skills to prevent them from finding themselves in a dangerous situation in the first place. Family members of staff could also participate in the course at their own cost but at the corporate rate. The course was also offered to staff who were allocated a car for the first time after the beginning of this intervention as well as those under 25 years old. Unfortunately, this intervention resulted in an increase in crashes. Constant follow up and changing attitudes were believed to be the missing ingredients. Thus: • Defensive and protective driver discussion groups were introduced as a follow up
intervention to the driver course. These discussion groups included dissemination of information and videos.
• A quarterly newsletter was distributed advising staff of company performance as well as current road issues.
• Random safety and condition checks of cars were conducted. • A competition was run in which staff who completed a 12 month crash- and infringement-
free period and kept their car in good condition were entered into a draw for a holiday. Another competition was launched where drivers were grouped into teams and the group with the lowest crashes per kilometer ratio at the end of the year was reimbursed their insurance premium.
• Relevant articles about vehicle safety issues were distributed throughout the organisation. • The Brotherhood installed a crash/infringement recording and analysis computer program.
The program records many aspects of the crashes so that they can be analysed to see which area need attention.
• New employees were given advice on the expectations of the organisation regarding company cars as soon as they started their jobs.
As a result of these new interventions, the total number of crashes decreased by 13% and the number of at fault crashes decreased by 47% from 94/95 to 95/96. Also, the average cost per crash more than halved over this year. The Brotherhood’s record for 96/97 compares very favourably with the average when looking at the AfMA Lumley Benchmarks. Further interventions were planned to further reduce crashes.
42 MONASH UNIVERSITY ACCIDENT RESEARCH CENTRE
• Pre-employment checks will be conducted to identify at-risk drivers. Those found to be at–risk drivers would be required to complete a driving course or be denied a car.
• A post incident questionnaire will be filled out by those who have a crash so that they can self-assess the incident.
• Those who accrue a poor driving record may be required to undergo one-on-one road tuition or may have their car withdrawn.
• A working party has been established to help tackle the issue. The Brotherhood recommends the following to other organisations: • Start with an attitude that crashes are not inevitable. • The commitment of the organisation from the top down is essential. • Ensure all data is collected. • Maintain driver interest. The Brotherhood is about to implement some new interventions. These are: • Reinforce messages about awareness and attitudes. • Conduct Driver Performance Assessment as part of Job Performance Assessment. These
are carried out annually for each staff member. • An OH&S officer was appointed in May 99. Her duties cover motor vehicles as they are
seen as part of the workplace. Her work has not been completely implemented yet. The cost of crashes seems to be creeping up a little, but the number of crashes seems to be stable. One characteristic of the organisation that has affected the implementation of the fleet safety interventions has been the compassionate culture in the organisation. As it is an organisation that focuses on charity and giving, it is difficult to criticise people, including their driving style. 5.7 FLEET SA Information was provided by Mr Andrew Norton of Fleet SA. Fleet SA has undertaken a number of initiatives to address fleet safety across the South Australian Government fleet. These are: • Introduction of a Whole of Government Driver Training and Education Program. • Revised Excessive Wear & Tear (identified damage to lease vehicles upon return at end of
hire) Policy initiatives have been introduced. • Load barriers fitted to all wagons. • Option of higher level equipped vehicles available to Fleet SA Customers (ie.
Commodore Executive vs Commodore Acclaim) • Ongoing Customer Information campaigns. 5.7.1 Driver Training and Education Program The driver training and education program has been moderately successful to date. It was implemented in January 1997. Awareness of OH&S obligations with regards to vehicles in
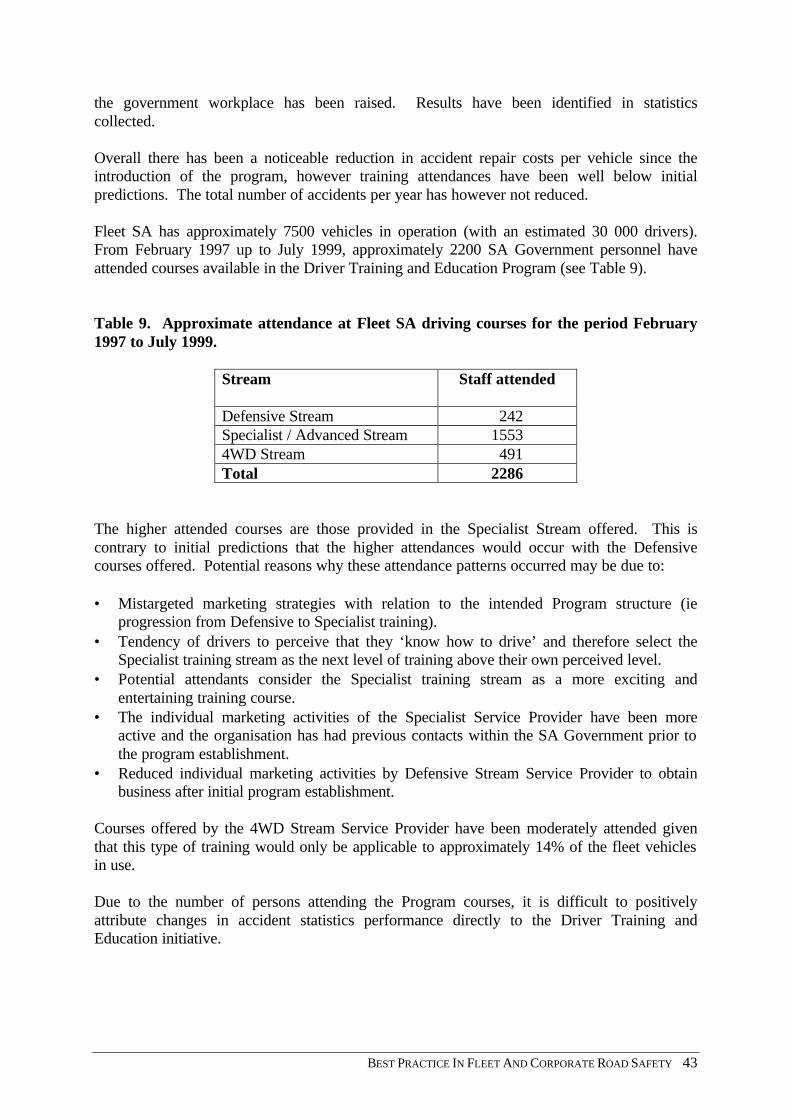
BEST PRACTICE IN FLEET AND CORPORATE ROAD SAFETY 43
the government workplace has been raised. Results have been identified in statistics collected. Overall there has been a noticeable reduction in accident repair costs per vehicle since the introduction of the program, however training attendances have been well below initial predictions. The total number of accidents per year has however not reduced. Fleet SA has approximately 7500 vehicles in operation (with an estimated 30 000 drivers). From February 1997 up to July 1999, approximately 2200 SA Government personnel have attended courses available in the Driver Training and Education Program (see Table 9). Table 9. Approximate attendance at Fleet SA driving courses for the period February 1997 to July 1999.
Stream
Staff attended
Defensive Stream 242 Specialist / Advanced Stream 1553 4WD Stream 491 Total 2286
The higher attended courses are those provided in the Specialist Stream offered. This is contrary to initial predictions that the higher attendances would occur with the Defensive courses offered. Potential reasons why these attendance patterns occurred may be due to: • Mistargeted marketing strategies with relation to the intended Program structure (ie
progression from Defensive to Specialist training). • Tendency of drivers to perceive that they ‘know how to drive’ and therefore select the
Specialist training stream as the next level of training above their own perceived level. • Potential attendants consider the Specialist training stream as a more exciting and
entertaining training course. • The individual marketing activities of the Specialist Service Provider have been more
active and the organisation has had previous contacts within the SA Government prior to the program establishment.
• Reduced individual marketing activities by Defensive Stream Service Provider to obtain business after initial program establishment.
Courses offered by the 4WD Stream Service Provider have been moderately attended given that this type of training would only be applicable to approximately 14% of the fleet vehicles in use. Due to the number of persons attending the Program courses, it is difficult to positively attribute changes in accident statistics performance directly to the Driver Training and Education initiative.

44 MONASH UNIVERSITY ACCIDENT RESEARCH CENTRE
The following steps were involved in the implementation of the initiative: a) Procurement and selection process undertaken to establish Driver Training and
Education service providers. b) Program launched with selected “high risk” targeted agencies. c) Program then launched to remaining Whole of Government. d) A communication program of seminars, guest presentations at agency meetings, and
published information implemented concurrently. This is an ongoing program. The staff involved in implementation of the driver training and education program were: a) Director, Fleet SA b) Fleet Operations Manager, Fleet SA (Then responsible for accident Management and
Vehicle Safety issues) c) Customer Liaison Manager, Fleet SA d) DT&E service providers The following objectives were set: a) Reduce vehicle damage repair costs by 15% over a two-year period.
b) Reduce the number of accidents by 15% over a two-year period. Throughout the current contract service provision, Fleet SA has collected accident statistics and overall contract performance/attendance data (refer Section 5.7.5). The benefits are considered at a Whole of Government level. Overall the main benefits of the Program have been: • Reduction in vehicle accident repair costs per accident. • Identification of vehicle faults and operational issues. • Higher awareness of drivers and Agencies of OHS&W links with driver training. • Safer driving practices by agency drivers. • Potential for reduction in costs indirectly related to accidents. • Whole of Government OHS&W obligations are addressed by the program. The SA Government is spending approximately $110,000 per year on Driver Training and Education. There are additional costs of resources for Program and Contract establishment and ongoing management, and promotional / communication activities (figures not available). The initiative could be improved by: • All Services being provided / coordinated (preferably) by a single service provider (ie, all
passenger and 4-wheel drive training coordination and provision) • The service provider implementing strategies to encourage and manage suitable
progression of participants through the program structure in a competency based framework.
• Further promotion of the OHS&W benefits to Agencies and drivers. • More effective utilisation of the Chief Executive network (across all agencies) to promote
the Program and to encourage participation.
BEST PRACTICE IN FLEET AND CORPORATE ROAD SAFETY 45
• Utilising different or additional marketing activities, developed in conjunction with the Service Provider(s).
• Offering a Fleet SA subsidy for first level (Defensive Driver) training courses. • Linking driver training attendance and benefits with vehicle insurance premiums. • Release of the Safe Driving Policy incorporating Driver Training and Education. • More aggressive targeting of high risk drivers for driver training (suggest compulsory
attendance). The characteristics of Fleet SA that have affected the success of the intervention are • Difficulties in ensuring that information reaches its intended target. Fleet SA liaises with
10 major SA Government Departments, within which there are approximately 700 clients who consist of an estimated 30 000 drivers.
• The inability of Fleet SA to mandate the attendance and use of the DT&E Program. • The diversity of activities with regards fleet vehicles across government. 5.7.2 Revised Excessive Wear & Tear Policy initiatives The policies were revised to improve the overall condition (and, in turn, roadworthiness) of fleet vehicles. The policies aim to make agencies more accountable and take ownership for the day to day care and management of the vehicle. This is essentially achieved by more accurately defining the acceptable condition of a vehicle with appropriate penalties applied if these are not met at the return of a vehicle. The task was one of the tasks assigned to a Project Team to revise and implement. The Project Team and Customer Liaison Manager were involved in the implementation. The effect of this initiative has been difficult to monitor as there have been a number of other initiatives and activities that have impacted on safe use of vehicles (ie, driver training, revised inspection procedures). The identified benefits to Fleet SA were: • Improved on the road vehicle standards and overall roadworthiness • Clearer understanding and awareness of the obligations of Client Agencies with respect to
their vehicles. • Better defined work practices and procedures for inspection personnel. This was a component of an overall project activity and its cost was not specifically monitored. The initiative could be improved by improving information flow to drivers on policy change. The factors that affected the success of the intervention were: • The diversity of activities with regards to fleet vehicles across government. • Individuals not assuming responsibility for vehicles that may be used by a large number of
drivers
46 MONASH UNIVERSITY ACCIDENT RESEARCH CENTRE
5.7.3 Load barriers fitted to all station wagons The initiative was successful. It was generally accepted by Client Agencies that load barriers should be fitted to all wagons as a vehicle, load and passenger safety requirement. The initiative was implemented by: • Mandating the fitting of barriers • Load Barriers were fitted at the time of the new vehicle delivery The Director of Fleet SA and the Vehicle Distribution Manager were involved in implementation. The road safety benefits of the initiative have not been evaluated. The benefits of this initiative to Fleet SA were: • Whole of Government accepted • Potential risk of vehicle passenger safety issues mitigated 5.7.4 Option of higher level equipped vehicles It was generally accepted by Agencies that should they wish to have additional safety features fitted to a vehicle, they have the option to request a vehicle with a higher option fit out (i.e. air bags, ABS, traction control etc). The initiative was implemented by communication of information via newsletters, mail-outs etc. The Director Fleet SA, Vehicle Distribution Manager and Client Liaison Manager were involved in the implementation. Fleet SA does have a record of these vehicle requests, however no targets were set. The availability of such vehicles were seen as important for agencies to have the ability to choose for a higher optioned vehicle if necessary. The initiative addressed issues of vehicle safety with concerned Client Agencies and reduced the potential risk of vehicle passenger injury. 5.7.5 Overall changes in accident costs and frequencies Table 10 summarises the accident statistics over the last 3 financial years. The Table shows that since the inception of the program during 1996/97, the average cost per accident has decreased with the target of 15 % reduction achieved during 96/97 year and subsequently to 12% reduction in 97/98 and 22% reduction in 98/99 (when compared to 95/96 year statistics). Fleet SA states that these reductions may be attributed to a number of factors including: • Introduction of the Driver Training and Education Program; • Vehicle impacts in crashes are perceived to be occurring at reduced speeds therefore
reducing the extent of damage; • More effective control of accident repair operations; • Improved crashworthiness of vehicle designs leading to reduced repair costs and methods;
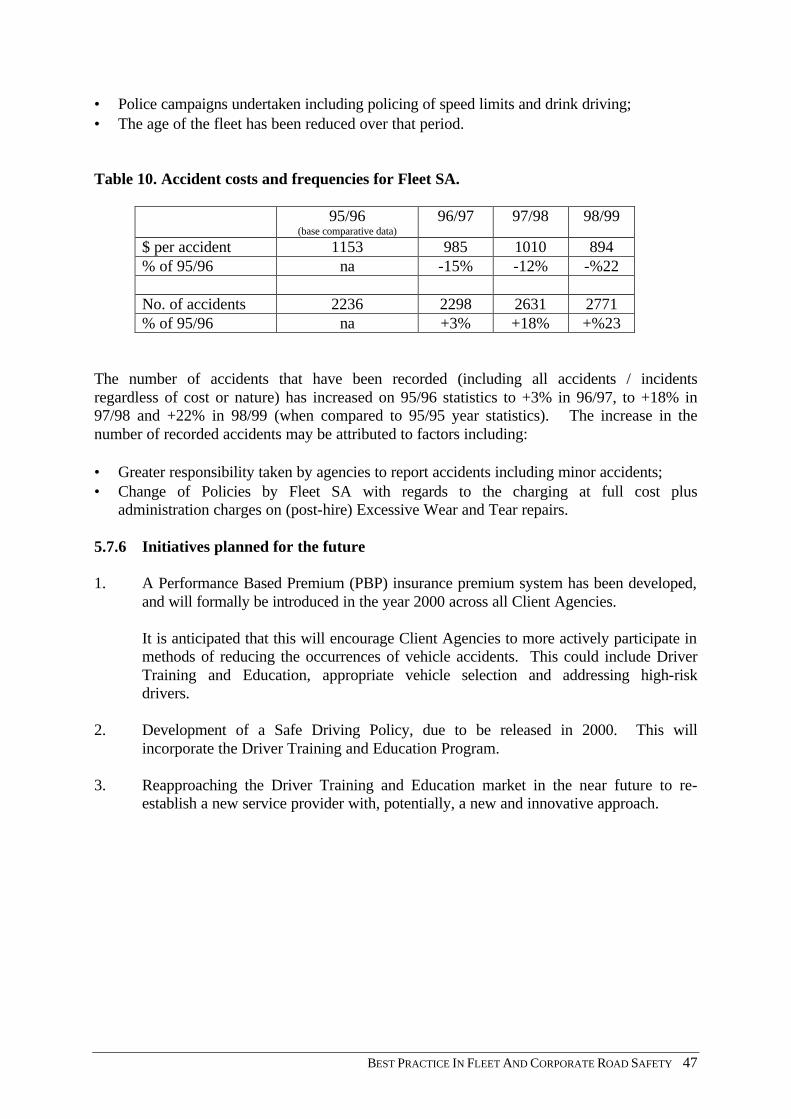
BEST PRACTICE IN FLEET AND CORPORATE ROAD SAFETY 47
• Police campaigns undertaken including policing of speed limits and drink driving; • The age of the fleet has been reduced over that period.
Table 10. Accident costs and frequencies for Fleet SA.
95/96 (base comparative data)
96/97 97/98 98/99
$ per accident 1153 985 1010 894 % of 95/96 na -15% -12% -%22 No. of accidents 2236 2298 2631 2771 % of 95/96 na +3% +18% +%23
The number of accidents that have been recorded (including all accidents / incidents regardless of cost or nature) has increased on 95/96 statistics to +3% in 96/97, to +18% in 97/98 and +22% in 98/99 (when compared to 95/95 year statistics). The increase in the number of recorded accidents may be attributed to factors including: • Greater responsibility taken by agencies to report accidents including minor accidents; • Change of Policies by Fleet SA with regards to the charging at full cost plus
administration charges on (post-hire) Excessive Wear and Tear repairs. 5.7.6 Initiatives planned for the future
1. A Performance Based Premium (PBP) insurance premium system has been developed,
and will formally be introduced in the year 2000 across all Client Agencies. It is anticipated that this will encourage Client Agencies to more actively participate in methods of reducing the occurrences of vehicle accidents. This could include Driver Training and Education, appropriate vehicle selection and addressing high-risk drivers.
2. Development of a Safe Driving Policy, due to be released in 2000. This will
incorporate the Driver Training and Education Program. 3. Reapproaching the Driver Training and Education market in the near future to re-
establish a new service provider with, potentially, a new and innovative approach.
48 MONASH UNIVERSITY ACCIDENT RESEARCH CENTRE
5.8 UNIVERSITY OF SOUTH AUSTRALIA An interview was held with Mr Neville Thiele, Fleet Manager for the University of South Australia. Several years ago the University of South Australia undertook a total review of its fleet arrangements. It examined the ages and types of vehicles and their condition. They found that some of the buses and four-wheel drive vehicles had not been kept in good condition and some safety equipment was missing. They decided to outsource and DASFLEET won the tender. Over three years the University saved $600,000 on fleet costs, mainly by reducing the numbers of vehicles. The University has about 100 vehicles, comprising sedans, station wagons, work vehicles (utilities etc.), buses and four-wheel drives. The vehicles currently leased are largely Holden Acclaims and Ford Futuras. The University specifies that all cars should have ABS, dual airbags and independent rear suspension. Station wagons are required to have cargo barriers fitted and these are locked down to prevent removal. Seat belts are required to be installed in buses. The four-wheel drives and buses have undergone thorough checks to ensure that all safety equipment is present and periodic checks are undertaken after long trips. Collectively, they believe that these safety measures have been successful. Where vehicles are acquired for salary packages via novated leases, the driver is not required to buy the preferred vehicles but is encouraged to do so. Sometimes the vehicles chosen are rated safer than the preferred option by the various motor vehicle testing authorities. Drivers are required to have an appropriate licence and supervisors must approve any use of a vehicle. Four-wheel drive and bus drivers receive training and there is a zero alcohol policy. Accident data are examined regularly. Airbags have shown their worth in three accidents. There seem to be lots of front and rear “bingles” in the city and it appears hard to find a solution. Some drivers have attended a defensive driving school recommended by DASFLEET. Some attended because of accident history, while others attended to increase skills or confidence. The University has discussed the issue of driver fatigue but has no policy. The general occupational health and safety conditions also apply to driving. The bus drivers understand about the need for regular breaks. There are two drivers for interstate trips and changes of drivers are recorded. However, there is little interstate travel in University buses. Vehicles are fitted with Logmaster that records speed, trip duration, acceleration and braking patterns. This data was monitored for some time. They find that they can not reach the fuel economy levels given by DASFLEET but they come close. In two years or 40,000 kilometres they rarely need to fit a second set of tyres, which is an indication that cars are being treated carefully.
BEST PRACTICE IN FLEET AND CORPORATE ROAD SAFETY 49
5.9 HOLDEN’S FLEET SALES The following information was supplied by Mr Ralph Stevenson, National Fleet Sales Manager for Holden’s. 1. What safety features are fleet buyers interested in? There are really no consistent or generic fleet responses. His personal impression of fleets generally is that going back a year or so, there was a strong buyer attitude that saw the fleet safety choice as between ABS or airbag(s). The general balance was that ABS was preferable because it avoided the crash in the first place with attendant savings in both potential injury and vehicle repair costs. Today, there is some confusion or uncertainty as to the actual cost - benefit trade off of the various options. Fleets no longer have to consider only ABS and driver airbag but now compare vehicles with standard features of passenger and side airbags, seat belt pretensioners and promotion of the invisible Safety Cell structures. Currently, those fleets with an active policy for OH&S issues tend to take a higher position. There are a number of fleets that have adopted a policy of specifying Commodore Acclaim models rather than Executive within the Holden range of vehicles. This is because Holden has always specified the Acclaim to have all or most of the safety features currently available from Holden. Most of the fleets with these Acclaim preference policies are Australian "Blue Chip" corporates or in the Government sector. In a couple of instances the policy results from a personal position by the fleet decision maker and a belief that higher residual values make the policy work financially. 2. Are fleet purchasers able to specify particular safety features or combinations other than those available to private buyers? No. Private buyers are able to purchase all the same models as fleets except for Taxi and Police variants (which are not safety feature specification differences). From time to time limited edition models are offered to private buyers (fleet discounts are not generally available for these models). However these models typically have luxury rather than safety features. 3. What particular packages do they request? Holden’s is unable to answer quantitatively at an option level for individual buyer types. However, overwhelmingly the volume seller to business fleets is a V6 automatic Commodore Executive sedan with air conditioning and no other options. There is a general perception that highly optioned Executive (base) model vehicles do not receive full value for the options in the used market, so fleets generally avoid adding options – either luxury or safety type. They equally do not (apart from those fleets mentioned above) select the Acclaim even though Acclaim does manage to recover more of the value for the features in the used car market than a highly optioned Executive because of the "badge" premium.
50 MONASH UNIVERSITY ACCIDENT RESEARCH CENTRE
4. What proportion of fleet vehicles purchased have driver side airbag only, driver plus passenger airbag, ABS etc? Holden’s is unable to identify the information about vehicle specification by buyer type. There is information about buyer type by model within VFACTS buyer information. However, this is not capable of singling out the differences between fleets and private buyers, rental cars etc. In general, ABS is the most common safety option requested for Commodore Executive sedans. Passenger airbags are requested much less often.
BEST PRACTICE IN FLEET AND CORPORATE ROAD SAFETY 51
6.0 OCCUPATIONAL HEALTH AND SAFETY LEGAL PERSPECTIVE This section of the report assesses the scope under Occupational Health and Safety legislation for introduction of road safety programs into corporations. It includes an analysis of the relevant legislation and a discussion of its implications. There are (at least) three types of legal and OHS scenarios that can occur in relation to fleets: • an employee suing the employer as a result of injuries or other losses sustained in a work-
related crash • the OHS authority prosecuting the employer for failure to provide a safe system of work
(whether or not a crash had occurred) • OHS issues forming the basis of an industrial dispute Any of these scenarios has the potential to consume significant resources for an organisation. In Victoria, the penalties for breach of occupational health and safety legislation range up to $250,000 for a company and up to $50,000 and/or five years jail for an individual. 6.1 GENERAL PRINCIPLES OF OCCUPATIONAL HEALTH AND SAFETY LEGISLATION In general, occupational health and safety legislation is performance-based, rather than prescribing particular procedures. Under all of the Occupational Health and Safety Acts in Australia, employers must ensure safe and healthy workplaces and conditions of work. The Victorian Occupational Health and Safety Act 1985 (Act No. 10190/1985), Part III – General provisions relating to occupational health and safety states in Section 21. Duties of employers: (1) An employer shall provide and maintain so far as is practicable for employees a
working environment that is safe and without risks to health. (2) Without in any way limiting the generality of subsection (1), an employer
contravenes that subsection if the employer fails-
(a) to provide and maintain plant and systems of work that are so far as is practicable safe and without risks to health;
(b) to make arrangements for ensuring so far as is practicable safety and absence
of risks to health in connexion with the use, handling, storage and transport of plant and substances;
(c) to maintain so far as is practicable any workplace under the control and
management of the employer in a condition that is safe and without risks to health;
(d) to provide adequate facilities for the welfare of employees at any workplace
under the control and management of the employer; or
52 MONASH UNIVERSITY ACCIDENT RESEARCH CENTRE
(e) to provide such information, instruction, training and supervision to
employees as are necessary to enable the employees to perform their work in a manner that is safe and without risks to health.
The Occupational Health and Safety Act 1985 Section 4 defines “practicable” as meaning practicable having regard to: (a) the severity of the hazard or risk in question; (b) the state of knowledge about that hazard or risk and any ways of removing or
mitigating that hazard or risk; (c) the availability and suitability of ways to remove or mitigate that hazard or risk; and (d) the cost of removing or mitigating that hazard or risk. OHS statutes impose a duty of care upon employers and people who are self-employed. The duty of care extends to people other than employees who may be affected by the work. Section 22. Duties of employers and self-employed persons states that
Every employer and every self-employed person shall ensure so far as is practicable that persons (other than the employees of the employer or self-employed person) are not exposed to risks to their health or safety arising from the conduct of the undertaking of the employer or self-employed person.
It is a strict ruling but is usually qualified by the reasonable practicality of the measures required to be taken by the employer. Section 25 of the Act sets out the duties of employees. Employees are required to ‘take the care of which the employee is capable for the employee’s own health and safety and for the health and safety of any other person’. The requirement is that employees should use the safety equipment that is provided and not wilfully put at risk the health and safety of others. In terms of vehicles, this Section could be interpreted as requiring that drivers wear seat belts and obey road rules. 6.2 APPLICATION OF THE PRINCIPLES OF OCCUPATIONAL HEALTH AND SAFETY LEGISLATION TO FLEET SAFETY 6.2.1 Vehicle as workplace or plant Australian Occupational Health and Safety statutes define the workplace as a place where an employee works. The regulatory authorities and courts have tended to interpret this definition as broadly as possible (Corporate Risk, 1999). Thus, for the purposes of OHS regulation and legislation, a vehicle is likely to be considered a workplace if it is driven in the course of employment. Therefore, all requirements of the OHS legislation in relation to workplaces are relevant to the vehicle. Examples of these requirements are to provide a safe workplace, to adequately train and instruct employees and to protect persons who are not employees. This is relevant no matter how little or how much an employee drives a vehicle for work purposes. Under the Victorian Occupational Health and Safety Act 1985 Section 4, “plant”
BEST PRACTICE IN FLEET AND CORPORATE ROAD SAFETY 53
includes any machinery equipment appliance implement and tool, any component thereof and anything fitted connected or appurtenant thereto.
According to Dr Richard Johnstone, Associate Professor in the School of Law at the University of Queensland (cited in Corporate Risk, 1999), Victorian regulation defines fleet vehicles as plant when not on public roads (Regulation 106(4)). Thus the plant regulations would apply when the vehicle is on the employer’s premises or when the vehicle is at another workplace. Johnstone concludes that “if the Regulations apply to the vehicle at the start of the journey in the company car park, and at the destination in other workplaces, then the same set of obligations will effectively apply even on public roads when the Regulations don’t formally apply” (cited in Corporate Risk, 1999, p.34). If the vehicle is considered to be plant, then Section 24 of the Occupational Health and Safety Act applies which places responsibilities on persons who design, manufacture, import or supply the vehicles. The Plant Regulations relating to moving plant (and most commonly applied to tractors, forklifts etc.) require that the plant prevent ejection, include protective devices and be operated in a way that minimises risks to pedestrians. The first two requirements are fulfilled by any vehicle that complies with Australian Design Rules. 6.2.2 Work and non-work related driving Under the OHS legislation, it is irrelevant whether a vehicle safety problem manifests itself inside or outside work time. For instance, requiring an employee to drive a car with poorly maintained brakes is an offence regardless of whether a crash occurs in work time, out of work time or not at all (from Corporate Risk, 1999). 6.2.3 Ownership of the vehicle If the driver is driving their own car, the employer often assumes they do not have any responsibility for that vehicle (Corporate Risk, 1999). Johnstone (in Corporate Risk, 1999) maintains that the OHS requirements also apply when the employee is driving a car under a novated lease, or if the employee owns the vehicle – the employer is under “a personal and non-delegable duty, and cannot contract out of it. If the employer requires the employee to drive the car as part of their work, the employer’s OH&S duties apply. This would be the case even when the employer has taken no responsibility for the maintenance or condition of the vehicle” (p.35). However, the employer obligations under these circumstances may be somewhat less rigorous than for a vehicle owned by the employer. 6.2.4 Duties to the public As noted in Section 6.1, employers are also obliged to protect non-employees who may be affected by the work being undertaken. In relation to cars as workplaces, the requirements for ensuring safety for employees, such as maintaining the brakes on the vehicle, are likely to be sufficient to satisfy this requirement (Corporate Risk, 1999). WorkCover representatives stated that duties to the public were on the border of jurisdiction of WorkCover and VicRoads. Roadworthiness of vehicles is seen as an issue to be dealt with by VicRoads and the Police in most instances, rather than WorkCover.
54 MONASH UNIVERSITY ACCIDENT RESEARCH CENTRE
6.3 MANAGING OHS IN FLEETS 6.3.1 Application of risk management principles Easton (1997) states that safety is a general OHS issue that should extend to the motor vehicle. Controlling workplace hazards is a management issue and should be treated as such. Good management of safety issues generally reflects good management of other aspects of an organisation. Easton (1997) claims that a systematic approach is necessary to facilitate change in which employers implement a hazard assessment and risk control strategy. In fleet safety, employers can use the general principles of risk management: • identify hazards • assess risk • control the risk. Easton (1997) pointed out that the hazards faced by workers in their cars include things other than the risk of injury in a crash. These may include fatigue, noise, vibration, poor air quality, exposure to chemical hazards, risk of injury associated with seating posture and manual handling and other risks. Protecting people also results in protecting property, which may be expensive equipment. 6.3.2 Transport Industry Guide to Meeting the OHS Duty of Care Compliance with a code of practice is considered to be strong evidence that an employer has fulfilled their safety obligations. The Transport Industry Guide to Meeting the OHS Duty of Care (Victorian WorkCover Authority, 1997) was developed by the Victorian Transport Industry Safety Group which includes representatives from the Transport Workers Union (Victorian Branch), VicRoads, Victorian Road Transport Association, Bus Association of Victoria, Victoria Police and the Victorian WorkCover Authority. It aims to provide information and guidance on occupational health and safety matters for employers, employees and others involved in the transport industry, and encourage their ongoing commitment to health and safety. The Guide is aimed at the whole of the transport industry, including trucks, buses, van and motorcycle couriers, taxis and aircraft operators. Its applicability to fleet operators who are not in the transport industry should be examined. The Guide deals with • management commitment • OHS Policy Statement • safety inspections/self auditing • accident reporting and investigation • Health and Safety Committees • training • occupational health • dangerous goods and hazardous substances
BEST PRACTICE IN FLEET AND CORPORATE ROAD SAFETY 55
• fire prevention and emergency evacuation procedures • contractor control • safe work practices • demonstrating compliance It covers OHS in all operations, so there is an emphasis on conditions in the establishment, more so than in the vehicle. There is no mention in the Guide of driver selection or vehicle selection and safety features (other than those that are not crash-related such as entry and exit from the vehicle and loading the vehicle). Operational issues related to road safety (and other forms of safety) such as fatigue management and driving hours are mentioned. 6.3.3 Vehicle selection In relation to vehicle selection, there appears to be a distinction between what ideal best practice in occupational injury prevention would recommend and the minimum standards that need to be met to avoid prosecution. Best practice in occupational injury prevention recommends that employers should take all practicable steps to minimise health and safety risks associated with vehicle use. A WorkCover representative stated that airbags might be considered practicable given that: • the cost is reasonable • they pass the state of knowledge test in that they are recognised as safety devices to
prevent death or serious injury. Other industry sources stated that features such as air conditioning and power steering would be reasonable if there is a requirement to travel long distances. However, prosecution for failure to provide a safe workplace would be unlikely to occur if the vehicle complies with the relevant Australian Design Rules and is roadworthy. 6.3.4 Vehicle maintenance It is reasonably clear, however, that the employer would be required to conduct regular safety checks of vehicles (Corporate Risk, 1999). The potential for serious injury as a result of a faulty vehicle would outweigh the cost of maintaining the vehicle. In terms of employer duty of care obligations for novated leases and employee-owned vehicles, “procedures such as requiring an employee to have regular maintenance schedules, performing spot-checks on vehicles and providing incentives for upgrading safety features will help to ensure that the employer has fulfilled their duties” (Corporate Risk, 1999, p.35). 6.3.5 Driver training and management Section 21 2 (e) requires the employer to “provide such information, instruction, training and supervision to employees as are necessary to enable the employees to perform their work in a manner that is safe and without risks to health”. This implies that driver training might be required.
56 MONASH UNIVERSITY ACCIDENT RESEARCH CENTRE
Johnstone (in Corporate Risk, 1999) states that the duty to provide training will vary with the particular circumstances of employment. For instance, if the driver is required to undertake normal driving, it may be sufficient for the employer to rely on the fact that the employee has a drivers licence. If, however, the driver is required to undertake driving involving specialised skills then it is incumbent upon the employer to ensure the employee has been provided with the appropriate training. When employees are required to undertake additional tasks while on the road, the employer is obligated to inform the drivers of company guidelines regarding performing these tasks safely and whether or not they can do them while they are driving. For instance, if an employee is required to use a mobile phone while on the road, the employer should tell them not to dial while driving because of the increased crash risk associated with this form of distraction. It may also be a requirement that the employer ensures that the employee is fit enough to undertake the driving task. 6.4 DISCUSSIONS WITH WORKCOVER VICTORIA Discussions were held with representatives of the WorkCover Authority to identify current and proposed initiatives in this area and to discuss issues of feasibility. Some of the comments made have been reported in previous sections. No current or proposed initiatives in the area of fleet safety were reported. Inquiries to the Operations Section of WorkCover Victoria revealed that there had been no investigations of employers in relation to the operation of car fleets. The comment was made that for road crashes, WorkCover only becomes involved if notified by the Police. This sometimes happens with truck crashes but has not happened with fleet car crashes. WorkCover also responds to recommendations made by the Coroner relating to work-related road fatalities but these have focussed on trucks. 6.5 OTHER ISSUES RELATED TO OHS AND FLEET SAFETY 6.5.1 Compatibility of fleet and occupational health and safety data It was noted in an earlier section that there is often little communication between fleet safety and occupational health and safety personnel with organisations. This can be manifest in lack of attempts to integrate the two sources of data and, indeed, incompatibility between the data sets for these two types of data. The practical implications of this lack of compatibility are manifest in the inability to link the characteristics of the crash with the outcome. For example, it may not be possible to determine the cost in terms of lost working time of crashes occurring outside working hours, or crashes involving rear impact. This makes it difficult to estimate the costs of particular problems and the likely benefits of countermeasures. The Telecom Motor Vehicle Accident Study (Drummond and Vulcan, 1991) found that data related to crashes, injuries and costs were held in a number of unrelated databases:
BEST PRACTICE IN FLEET AND CORPORATE ROAD SAFETY 57
• vehicle repair costs in the Telecom Fleet Management Information System could only be
derived according to the categorisation of the invoice • the Telecom motor vehicle accident report form was not computerised, but held as a hard
copy in regional locations • the fleet management and OH&S databases were held on different computer systems and
data reconciliation would be difficult given problems with the quality of fleet management information (ability to identify vehicle-related crash costs) and the lack of timeliness of the OH&S information
• data was often not held in sufficient detail to make it useful for anything other than
achieving the specific objective of the particular organisational area (e.g. compensation cost data is not held by cause of injury in the accounts area).
The data systems in Telecom are likely to have improved since the time of the report but these data structural problems are common to many organisations. Fleet safety research that MUARC has undertaken for the Australian Defence Forces also identified a lack of communication and compatibility between fleet management and occupational health and safety data, with similar problems of timeliness for OH&S data as reported by Drummond and Vulcan (1991). One of the recommendations of the report of the Local Industrial Board inquiring into the dispute between Telstra and the Communications Workers Union (Rechnitzer, 1994) relating to the use of Forward Control Vehicles pertained to improving data systems:
(vi) That the FLEETMIS accident data base and OH&S injury data base are linked so that regular evaluation of vehicle problem areas can be made, with the accident history of each vehicle type identifiable and any over-involvement properly scrutinised and addressed.
As part of any injury prevention/reduction program, a well-constructed accident data base is an essential requirement to identify areas of high risk or accident involvement. This requires both information about the incident outcome (injury type/severity etc) and factors describing the incident (accident details). Currently it is not possible to determine directly the accident involvement of Telecom vehicles with associated injury outcome, as vehicle accident data is only available in terms of repair costs, and is not linked to the OHS data base on injury claims. Thus accident involvement of particular vehicles can only be inferred indirectly. By linking the two systems, vehicle accident involvement can be fully analysed with problem vehicle/ operations etc identified. This will enable more detailed investigation of the problem areas, and hence determine underlying causal factors and enable appropriate countermeasures to be introduced for risk reduction. This will also provide better data to Fleet services for vehicle selection and operation. This linking of the two systems is also a recommendation of the "Telecom Motor Vehicle Accident Study" (by Drummond A. and Vulcan A.E, 1991). This data would also be made available on a regular basis (perhaps six monthly) for consideration as part of the
58 MONASH UNIVERSITY ACCIDENT RESEARCH CENTRE
Telecom-CWU consultative process regarding vehicles (refer recommendation no(ii).) (Rechnitzer, 1994, pp.42-43)
6.5.2 Telstra dispute regarding forward control vehicles The Telstra dispute regarding forward control vehicles provides an interesting case-study of vehicle safety being the basis of an occupational health and safety industrial dispute. The report of the Local Industrial Board to which the dispute was referred by Commissioner Cox of the Australian Industrial Relations Commission (Rechnitzer, 1994) provides a useful examination of a number of important issues, including what comprises a “safe vehicle”. The dispute arose out of industrial action by the Communications Workers Union Victorian Branch, and related to the CWU's disagreement with vehicle selection policy as set out in the new Consumer Business Unit's National Motor Vehicle Policy. The Union's particular objection was the Policy's specification of forward control vehicles as the primary vehicle type to be used by Technicians. The Union’s major concern was with safety aspects of this vehicle type. Criteria for a ‘safe vehicle’ Telstra representatives stated that the criterion ‘Community Norm’ has been considered as acceptable in regard to ‘safety’ and meeting the ‘practicality’ requirements in OH&S regulations. ‘Community Norm’ includes ideas such as: • being consistent with commercial practices within the industry • vehicle choice was limited to what the manufacturers sell and what is available commonly
in the market place – that is to the community at large • Telecom’s core business relates to telecommunication, not vehicle safety issues. Those
are the concern of other Government agencies – which would be expected to be looked after adequately by the relevant government departments
• if the vehicle is able to be registered in Australia, there is an implied assurance (by the registering authority – that is the Government) that it is satisfactory and meets any necessary safety standards.
The acceptability of the ‘Community Norm’ concept was challenged by others. Drummond’s submission to the Local Industrial Board stated that:
The position that driving is not a core business activity and does not therefore require attention and or investment in preventative measures which other activities receive, cannot be maintained in my view. The essence of the Telecom Motor Vehicle Accident Study was that road safety is a legitimate public health concern for organisations and that responsible investment in preventative measures is the preferred (and sensible) approach (Rechnitzer, 1994, p.32).
Rechnitzer, as Chairman of the Local Industrial Board, pointed out that
It is clear that Telecom in its various activities does not follow “the community norm” philosophy and carries out “pioneering work” in various areas of OH&S. Examples include asbestos removal, smoking policy, provision of sunscreen cream and safety standards for load barriers in vehicles.
BEST PRACTICE IN FLEET AND CORPORATE ROAD SAFETY 59
The recommendations of the Board pointed out the important role that vehicles play in the OHS environment. (i) That field service staff vehicles be recognised as a core tool central to the efficient
performance of their work function, and as such given due OH&S attention and scrutiny as other major items of equipment. For field service staff, vehicles are as much "tools" or "equipment" as any other equipment used by personnel from a OH&S viewpoint, and it is intended that vehicles be assessed on typical OH&S terms, as applied under the OH&S agreements. These include proper consideration of ergonomic factors pertinent to the user (driver)-such as seating, visibility, access to equipment (spare wheel, ladder racks; engine etc). This is also intended to help put into context management's responsibility to ensure that vehicles selected for use are suitable for their function, which includes considerations of operator safety.
6.6 CONCLUSIONS The examination of the OHS legislation has shown that vehicles can be considered to be workplaces (on public roads) and plant (when not on public roads). Thus there is a requirement to ensure that the vehicles and the ways in which they are used provide, so far as practicable, a working environment that is safe and without risks to health. The current OHS legislation in Victoria allows considerable opportunity for promotion of ideal best practice injury prevention measures, given the general requirements of the Occupational Health and Safety Act. However, the lack of regulations specifically targeting vehicle and driver safety in the occupational setting means that enforcement is only relevant to a small range of fleet safety problems. These instances might include: • lack of roadworthiness of the vehicle, • failure of the vehicle to comply with Australian Design Rules (because of a later
modification), • (possibly) injury sustained as a result of impact with a bull-bar which can be shown to
have been fitted for cosmetic, rather than functional purposes, and • if it can be shown that the system of work obliged the employee to drive in a dangerous
manner. This is likely to be very difficult to prove. In the first two examples, the regulations applying to all vehicles (fleet or private) would also apply and so the OHS legislation may provide no additional benefit. Promotion of improvements to fleet safety should be considered the appropriate approach in the short-term, accompanied by encouragement of longer-term legislative changes.

60 MONASH UNIVERSITY ACCIDENT RESEARCH CENTRE
BEST PRACTICE IN FLEET AND CORPORATE ROAD SAFETY 61
7.0 DISCUSSION AND CONCLUSIONS The Corporate and Fleet Safety Working Party commissioned this project to investigate the potential to introduce road safety based initiatives in the corporate environment. The scope of the project is limited to light vehicles. Cars and light commercial vehicles, including taxis and rental cars, are included. This report defines fleet vehicles widely as vehicles over which a business has some degree of influence in their selection and operation. It is assumed that the degree of influence is likely to decrease as the type of vehicle moves from the fleet towards the private end of the continuum. The distinction between fleet and corporate road safety programs becomes somewhat blurred when there is considerable private use of fleet vehicles. 7.1 FLEET SAFETY ISSUES The overview of fleet safety issues showed that fleet vehicles make up about 30% of registered vehicles in Australia and, because of their high mileage, may comprise up to half of the traffic stream. In addition, more than half of new vehicles are sold to fleets (Wheatley, 1997). This provides fleets with considerable leverage if they choose to require safety features. The relatively quick turnover of fleet vehicles ensures that these safety features will soon be passed on to private vehicle drivers. Road crashes are the most common form of work-related death. Deaths in road crashes while working and deaths in road crashes while commuting represented 23% and 26%, respectively, of the 2,389 work-related deaths in 1989 to 1992 (National Occupational Health and Safety Commission, 1998). From another perspective, it represents 6% and 7%, respectively, of the 9,219 road fatalities during that period (Federal Office of Road Safety, 1999). These figures do not count the other persons who were killed or injured as a result of these work-related road crashes. Speeding and fatigue appear to be two road safety issues which are important for work-related travel. More recently, a new conceptualisation of fleet safety has been proposed. Under this model, fleet safety is seen as important, not just for fleet operators, but as a strategic approach to improving the safety of the entire vehicle fleet. Corporate purchasers of vehicles and transport services can specify high safety standards and thus create an economic imperative for providers of vehicles and transport services to meet these standards. Road safety issues within the taxi industry have not been widely studied. Instead, the emphasis has been on the public safety aspects of taxi use, particularly the personal safety of taxi drivers. Third party insurance rates and crash rates for taxis are several times higher than for private cars in New South Wales. There is anecdotal evidence that vehicle roadworthiness, speeding, non-use of seat belts (by drivers and passengers) and fatigue may be road safety problems for taxis but there has been little scientific investigation of these issues.
62 MONASH UNIVERSITY ACCIDENT RESEARCH CENTRE
Rental cars also have higher third party insurance than private cars in New South Wales and Queensland, suggesting higher crash involvement. However, there is very little information available about their crashes. 7.2 MAIN POINTS FROM THE LITERATURE REVIEW The literature review identified a large number of references to fleet safety in industry magazines and relatively few references in the scientific literature. There were numerous claims of likely or possible crash savings resulting from fleet safety programs. However, the number of initiatives which had been evaluated were few. From the literature review it can be concluded that the fleet safety initiatives which have potential to be effective are: • selecting safer vehicles • some particular driver training and education programs (e.g. Hertz study by National
Safety Council in Kedjidjian, 1995; the Swedish Televerket Study) • incentives (not rewards) • company safety programs in companies with an overall safety emphasis. There was very little literature available about the effects of fleet safety programs on safety of non-work-related driving by employees. The restricted nature of data collection undertaken may mean that employers know little about this – and state accident databases are not suited to monitoring this. In general, the literature review demonstrated the need to tailor programs to the types of vehicles, types of use and role that driving plays in the employment of different employees of the organisation. The critical role of management interest and support was emphasised in a number of studies. There was a general consensus that fleet safety programs require management focus and drive to occur and be maintained. Cost is still a major driving factor in fleet safety – there is a need to show that the cost of improvements is less than the cost of losses. The threat of penalties is often used to control driver behaviour, rather than monitoring and guidance (e.g. threat of dismissal if found to have alcohol in bloodstream after a crash, rather than fitting alcohol interlocks or other testing devices). An exception to this has been policies to fit cruise control to limit unintentional speeding. There is little evidence of driver management in relation to fatigue. There often appears to be a gap between those responsible for fleet management and those responsible for occupational health and safety within an organisation. Fleet management seems to be part of the finance sector, rather than human relations (where occupational health and safety may find itself). The potential exists for fleet safety to be neglected if it is not clearly seen as the responsibility of fleet management or of occupational health and safety.
BEST PRACTICE IN FLEET AND CORPORATE ROAD SAFETY 63
7.3 MAIN POINTS FROM THE INTERVIEWS WITH GOVERNMENT AND CORPORATE REPRESENTATIVES Some companies are changing the content of driver training programs away from improving driving skills to improving driver attitudes and reducing risks. There was relatively little emphasis on driver management. Sometimes this may have occurred because the fleet management is a centralised function and there is little direct contact with the drivers (e.g. Fleet SA, Q-Fleet). The resale value of cars (not just purchase cost of the vehicle) is an important influence on fleet management, including fleet safety, decisions. The move to maximise resale values has led to programs to take better care of cars and also consideration of the resale implications of some safety features (this can possibly encourage airbag fitting). In fleet management, there is a general emphasis on counting accidents and repair costs, rather than injuries. This may be because injury accidents are much less common than property damage accidents. Many organisations do not seem to count the additional costs of crashes (e.g. lost time and productivity). There is an emphasis on counting “preventable” crashes and reducing their occurrence. Many fleet safety programs are undertaken in response to a period of poor road safety performance or in response to the interest of someone in management. There are very few evaluations undertaken, even by best practice companies. Benchmarking is one of the few examples of evaluation, but benchmarking only hints at why some organisations may have lower crash rates or costs than others. 7.4 EUROPEAN APPROACHES In the Swedish approach, fleet safety is part of quality management of the transport component of the enterprise (whether government or private). Quality assurance of transport aims to ensure that people and goods arrive at the right place, at the right time and in the right way (i.e. without danger of serious injury or damage to the goods or the environment in connection with the transport). Thus there is a linking of road safety and environmental outcomes. There is an emphasis on ensuring the quality of outsourced transport as well as the use of owned vehicles. The Swedish approach to vehicle safety in fleets focuses more on the rated crashworthiness of vehicles, rather than a specific list of safety features. In this way it differs from the general approach in Australia and the United States identified elsewhere in the report. The Swedish example suggests that a possible approach to occupant protection for Victorian road safety agencies is to focus on a market-driven approach and to target fleets – particularly the government fleet. The Government is a large consumer of transport services and Government purchasing can be used as a lever for improving road safety. The Government can require that any passenger and goods transport that it purchases be done in a way that is both safe and environmentally sound. According to the Swedish model “further demands [on transport service providers] can be made under the condition that they occur in open
64 MONASH UNIVERSITY ACCIDENT RESEARCH CENTRE
competition in a non-discriminatory manner” (Belin, Johansson, Lindberg and Tingvall, 1997, p.9). The Government road safety agencies could start this process by introducing a policy for their own transport requirements, including purchase of cars, rental cars, staff driving and taxi use to serve as a good example for the rest of government. In France, there has been a program to increase the involvement of private companies in road safety related to their use of vehicles. Agreements have been drawn up between government, insurance companies, the national occupational health fund and volunteer companies. Employees of the companies form groups interested in road safety and sign a charter. The programs focus on motivating companies to undertake road safety programs by increasing the knowledge of the cost of road crashes to the company and by decreasing workers compensation and vehicle insurance premiums if programs are implemented. Some of the programs have concentrated on drink driving because of its large role in both work- and non-work-related road crashes in France. The German Traffic Safety Council has promoted the establishment of voluntary safety circles in which employees from the company vehicle fleet meet together to discuss critical points and devise solutions under the leadership of an experienced moderator. It also conducts a one-day training course in “Safe, Economical and Environmentally Friendly Driving”. In the United Kingdom, various measures have been implemented to improve road safety within organisations. They include driver training programs, incentive schemes, penalties, accident reviews, driver monitoring systems and driver feedback procedures. It is unclear whether these measures have had an effect. The Royal Society for the Prevention of Accidents takes an Occupational Health and Safety perspective, promulgating the benefits of road safety training to the employer, the community and local government. 7.5 OCCUPATIONAL HEALTH AND SAFETY LEGAL PERSPECTIVE In OHS legislation, vehicles can be considered to be workplaces (on public roads) and plant (when not on public roads). Thus there is a requirement to ensure that the vehicles and the ways in which they are used provide, so far as practicable, a working environment that is safe and without risks to health. The current OHS legislation in Victoria allows considerable opportunity for promotion of ideal best practice injury prevention measures, given the general requirements of the Occupational Health and Safety Act. However, the lack of regulations specifically targeting vehicle and driver safety in the occupational setting means that enforcement is only relevant to a small range of fleet safety problems. Thus, promotion of improvements to fleet safety should be considered the appropriate approach in the short-term, accompanied by encouragement of longer-term legislative changes.
BEST PRACTICE IN FLEET AND CORPORATE ROAD SAFETY 65
7.6 ISSUES FOR SMALLER BUSINESSES There are a number of challenges in improving fleet safety for smaller businesses. Benchmarking individual businesses is not appropriate because numbers of vehicles are too low. There is a need for initiatives that are not expensive to promote (per business that is targeted) and initiatives that are not expensive to implement. One option would be to disseminate fleet safety guidelines to smaller businesses e.g. for vehicle selection and driver management. It may be useful to review the currently available guidelines and adapt them for smaller businesses, if necessary. It might be helpful to survey a number of smaller businesses to ascertain their needs and to gauge their responses to some suggestions e.g. a telephone helpline or a website. 7.7 CORPORATE ROAD SAFETY The term corporate road safety is used to describe the delivery of road safety initiatives by organisations which are targeted at non-work-related driving. The report found that few organisations specifically articulate a concern for the safety of non-work-related driving by employees. Orica is an exception, stating that it has a 24-hour safety policy. However, many of the fleet safety programs are inadvertently corporate road safety programs, given the significant amount of private use of many fleet vehicles.

66 MONASH UNIVERSITY ACCIDENT RESEARCH CENTRE
BEST PRACTICE IN FLEET AND CORPORATE ROAD SAFETY 67
REFERENCES Adams-Guppy, J. and Guppy, A. (1995). Speeding in relation to perceptions of risk, utility
and driving style by British company car drivers. Ergonomics, 38, 12, 2525-2535. Anderson, S. (1998). Out in LF field. Wireless Review, 15(11), 30-40. Anderson, W. and Plowman, B. (1999). An integrated approach to fleet safety in the
workplace. Paper presented to the 7th Annual Safety In Action Conference, Cairns. Anonymous. (1990). Motor fleet management at an enterprise. World Congress of the
International Road Safety Organisation, Tokyo, 112-120. Anonymous. (1992). Guide to vehicle selection. Fleet, 7(4), 35-42. Anonymous. (1993). What should driver education mean? Fleet, 8(4), 30-31. Anonymous. (1998). Six principles of effective fleet management. Australian Fleet News,
2(29), 5. Anonymous. (1999). On the defence, on the road and in the classroom. Australian Fleet
News, 3(49), 4-5. Barmack, J.E. and Payne, P.E. (1961). The Lackland accident countermeasures experiment.
Highway Research Board Proceedings, 40, 513-522. Beach, J. (1997). Accidents happen, but most can be prevented. American City and Country,
112, FM10-FM12. Belin, M.-A., Johansson, R., Lindberg, J. and Tingvall, C. (1997). The Vision Zero and its
consequences. In Proceedings of the 4th International Conference on Safety and the Environment in the 21st Century. November 23-27 1997, Tel Aviv, Israel. Published by Transportation Research Institute, Technion City, Haifa, Israel. (pp.1-14)
Bibbings, R. (1997). Occupational road risk: Toward a management approach. Journal of the
Institution of Occupational Safety and Health, 1(1), 61-75. Botzow, H. (1968). Auto fleet management. USA: John Wiley and Sons. Burt, G. (1998). Trends & issues in a new tax environment. How to manage the fleet mix &
transitional issues. Fleet management – Drive to excellence. 1998 Conference of Australian Fleet Managers Association. (pp.21-29)
Buzeman, D. (1997). Car-to-car and single car crash compatibility: Individual effects of mass,
structure, stiffness and geometry. Thesis for the degree of Licenciate in Engineering. Chalmers University of Technology.
Campbell, S.F. (1998a). First response. Fleet Owner, 93(5), 108.

68 MONASH UNIVERSITY ACCIDENT RESEARCH CENTRE
Collingwood, V. (1997). Promoting the safe driving policy in New South Wales fleets of 20 or more vehicles. In Staysafe 36: Drivers as workers, vehicles as workplaces: Issues in fleet management. (Report No. 9/51). Ninth report of the Joint Standing Committee on Road Safety of the 51st Parliament. Sydney: Parliament of New South Wales. (pp.65-73)
Corporate Risk. (1999). Wheels at work. Occupational safety and fleet management.
Corporate Risk, 6(10), 32-35. Dalziel, J.R. and Job, R.F. (1998). Risk-taking and fatigue in taxi drivers. In Proceedings of
the Third International Conference on Fatigue and Transportation. Coping with the 24 Hour Society. Fatigue Management Alternatives to Prescriptive Hours of Service. 9-13 February 1998, Fremantle, Western Australia.
Deierlein, B. (1999). Safety: Everyone’s main concern. Beverage World, 118(1670), 94. Dolce, J. (1984). Fleet management. USA: McGraw-Hill Inc. Dolce, J.E. (1998). Analytical fleet maintenance management (2nd Ed). USA: Society of
Automotive Engineers. Donoho, R. (1996). Gearing up for driver safety. Sales and marketing management, 148(12),
66-67. Downs, C.G., Keigan, M., Maycock, G. and Grayson, G.B. (1999). The safety of fleet car
drivers: A review (TRL Report 390) Crowthorne, Berkshire: Transport Research Laboratory.
Drummond, A. and Vulcan, P. (1991). The Telecom motor vehicle accident study. Melbourne:
Monash University Accident Research Centre. Easton, D. (1997). Drivers as workers, vehicles as workplaces. In Staysafe 36: Drivers as
workers, vehicles as workplaces: Issues in fleet management. (Report No. 9/51). Ninth report of the Joint Standing Committee on Road Safety of the 51st Parliament. Sydney: Parliament of New South Wales. (pp.157-161)
Federal Office of Road Safety. (1979). A guide to road safety programs for vehicle fleet
operators. Canberra: Australian Government Publishing Services. Federal Office of Road Safety. (1999). Road fatalities Australia: 1998 Statistical Summary.
Canberra: Australian Government Publishing Services. Federal Office of Road Safety/National Safety Council of Australia. (1996). Fleet safety
manual. Canberra: Federal Office of Road Safety. Fell, D. and Black, B. (1996). Driver fatigue in the city. In L. Hartley (Ed.), Proceedings of
the Second International Conference on Fatigue and Transportation: Engineering, enforcement and education solutions. Perth: Promaco Conventions. (pp.165-187).
BEST PRACTICE IN FLEET AND CORPORATE ROAD SAFETY 69
Ferguson, S.A., Wells, J.K., Williams, A.F., & Feldman, A.F. (1999). Belt use rates among taxicab drivers in a jurisdiction with licence points for nonuse. Journal of Safety Research, 30(2), 87-91.
Fisher, A. (1997). The licensing of taxis and minicabs. Consumer Policy Review, 7(5), 158-
161. Folksam Research 1999. (1999). How safe is your car? Folksam Insurance. Gray, I. (1990). An attempt to reduce accidents in a company car fleet by driver training and
encouragement of low risk driving habits. Journal of Traffic Medicine, 18, 139-141. Gregersen, N.P., Brehmer, B, & Moren, B. (1996). Road safety improvement in large
companies. An experimental comparison of different measures. Accident Analysis and Prevention, 28(3), 297-306.
Harano, R.M., & Hubert, D.E. (1974). An Evaluation of California’s ‘Good Driver’ Incentive
Program. California: California Department of Motor Vehicles. Harrison, W., Fitzgerald, E.S., Pronk, N.J. and Fildes, B. (1998). An investigation of
characteristics associated with driving speed (Report No. 140). Melbourne: Monash University Accident Research Centre.
Hell, W., Langwieder, K., Walz, F., Muser, M., Kramer, M. and Hartwig, E. (1999).
Consequences for seat design due to rear end accident analysis, sled tests and possible test criteria for reducing cervical spine injuries after rear-end collision. Proceedings of the IRCOBI Conference 1999. (pp 243-262)
Janssen, W. (1991). Corporate incentive programmes: An application of utility theories.
International Road Safety Symposium, Copenhagen, 1990. Kedjudjian, C.B. (1995). Fleet safety: How to save lives and money. Traffic Safety, 95, 20-23 Klara, R. (1998). Rules of the road. Restaurant Business, 97(16), 37-40. Krafft, M. (1998). Non-fatal injuries to car occupants. Injury assessment and analysis of
impacts causing short and long term consequenses with special reference to neck injuries. Thesis. Karolinska Institute.
Kujawa, M. (1999). Navigating the market for ITS. Telecommunications (Americas Edition),
33(2), 51-54. Law, G. (1997a). Hot cars, cool features. Management, 44(5), 68-69. Law, G. (1997b). More for lease. Management, 44(10), 81-84. Leclercq, C. and Virenque. (1997). Alcohol and working sphere to a widened preventive
action. In C. Mercier-Guyon (Ed.), Proceedings of the 14th International Conference on Alcohol, Drugs and Traffic Safety, Volume 3. Annecy, France: Centre d’Etudes et de Recherches en Médicine du Trafic. (pp.1001-1004)
70 MONASH UNIVERSITY ACCIDENT RESEARCH CENTRE
Lenckus, D. (1999). Risk manager steers a u-turn in auto safety. Business Insurance, April,
92. Luk, J. and Richardson, T. (1997). Company cars and management of travel demand (ARR
301). Vermont South: ARRB Transport Research Ltd. Lynn, P. and Lockwood, C.R. (1998). The accident liability of company car drivers (TRL
Report 317). Crowthorne, Berkshire: Transport Research Laboratory. Mackie, R.R. and O’Hanlon, J.M. (1977). A study of the combined effects of extended
driving and heat stress on driver arousal and performance. In R.R. Mackie (Ed.), Vigilance: Theory, operational performance and physiological correlates. New York: Plenum. (pp.537-558)
McCarthy, M. (1999). Are you talkin’ to me? Adweek, 40(11), 9. Meola, J.J. (1997). Better, safer driving. Occupational Health and Safety, 66(10), 142-144. Minahan, T. (1997). Be safe for cost’s sake. Purchasing, 122(7), 65-67. Ministry of Transport and Communications. (1997). En route to a society with safe road
traffic (Ds 1997:13). Swedish Ministry of Transport and Communications. Monash University Accident Research Centre. (1999). Monash University Accident Research
Centre Policy for Purchase and Use of Vehicles at MUARC. Melbourne: Monash University Accident Research Centre.
Murcott, J. (1992). Coaxing road users into road safety: Driver education and fleets. Fleet,
7(1), 20-23. Myhre, S. (1996). What’s hot for fleets? Management, 43(10), 66-70. National Occupational Health and Safety Commission. (1998). Work-related traumatic
fatalities in Australia, 1989 to 1992. Summary report. Sydney: National Occupational Health and Safety Commission.
National Safety Council. (1999). Driving in the new millenium. 1999-2000 Defensive Driving
Course. Course Catalog. Itasca, Illinois: National Safety Council. Newstead, S. and Cameron, M. (1999). Updated correlation of results from the Australian
New Car Assessment Program with real crash data from 1987 to 1996 (Report No.152). Melbourne: Monash University Accident Research Centre.
Nygren, Å. (1984). Injuries to car occupants some aspects of the interior safety of cars.
Thesis. Karolinska Institute. Poole, D. (1999). Daytime running lights: Small-scale fleet study (TS99/2). Perth: Royal
Automobile Club of Western Australia.
BEST PRACTICE IN FLEET AND CORPORATE ROAD SAFETY 71
Queensland Transport. (1998a). The Workplace Fleet Safety System. Workplace fleet safety: How to conduct self-audit. Brisbane: Queensland Transport.
Queensland Transport. (1998b). The Workplace Fleet Safety System. Workplace fleet safety:
self-audit workbook. Brisbane: Queensland Transport. Rechnitzer, G. (1994). Report to Commissioner P.A. Cox, Australian Industrial Relations
Commission. Local Industrial Board Matter C No.30369 of 1993. Dispute between Telstra Corporation Ltd and the Communications Workers Union re motor vehicles. Chairman’s report and recommendations. March 14th 1994. Final.
Roads and Traffic Authority of NSW. (1994). Safe driving policy: Safe vehicles operated
safely. Roads and Traffic Authority: Sydney. Roads and Traffic Authority of NSW. (1997). Defensive and advanced driver training. In
Staysafe 36: Drivers as workers, vehicles as workplaces: Issues in fleet management. (Report No. 9/51). Ninth report of the Joint Standing Committee on Road Safety of the 51st Parliament. Sydney: Parliament of New South Wales. (pp.129-135)
Roads and Traffic Authority of NSW. (1998). Reporting of vehicle defects – Information for
fleet owners. Vehicle Standards Information for Vehicle Owners and Operators in New South Wales, No. 37.
Road Safety Council. (1997). Guidelines for a safe driving policy for fleet operators. Perth:
Road Safety Council. Roy Morgan Research Centre Pty Ltd (The). (1992). Willingness to pay for vehicle safety
features: Phase 2 report. Federal Office of Road Safety, Report No. CR112. Sanderson, J.T. (1992). Intelligent vehicle and highway systems: A motoring club’s
perspective. National Intelligent Vehicle and Highway Systems Conference; Melbourne. Sagberg, F., Fosser, S. and Saetermo, I.F. (1997). An investigation of behavioural adaptation
to airbags and antilock brakes among taxi drivers. Accident Analysis and Prevention, 29(3), 293-302.
Schork, G. (1997). Cross-linked and integrated safety work with reference to the activities of
the German Traffic Safety Council (registered association). In Proceedings of the 4th International Conference on Safety and the Environment in the 21st Century. November 23-27 1997, Tel Aviv, Israel. Published by Transportation Research Institute, Technion City, Haifa, Israel. (pp.634-638)
Sochon, P. (1999). Improving driver and vehicle safety: FleetSafe policy and guidelines for
local government in the Southern Sydney Region. Sydney: Southern Sydney Regional Organisation of Councils.
72 MONASH UNIVERSITY ACCIDENT RESEARCH CENTRE
STAYSAFE Committee. (1997). Injury risk and injury control in the New South Wales taxi industry: Workplace safety, road safety and public safety issues. In Staysafe 36: Drivers as workers, vehicles as workplaces: Issues in fleet management. (Report No. 9/51). Ninth report of the Joint Standing Committee on Road Safety of the 51st Parliament. Sydney: Parliament of New South Wales. (pp.197-207)
The Government of Western Australia and Road Safety Council. The BHP experience. The
Way Ahead: Road Safety Directions for Government Agencies and the Private Sector (brochure).
Tomita, A., Ohzeki, T. and Maruyama, K. (1991). An analysis of the drivers behaviour
observed on a road. Tohoku Psychologica Folia, 50, 77-84. VicRoads. (1989). Safe driving policy; VicRoads corporate policy for the safe and responsible
use of fleet vehicles - draft. Vincent, J. (1997). Road safety programs for occupational drivers. In Staysafe 36: Drivers as
workers, vehicles as workplaces: Issues in fleet management. (Report No. 9/51). Ninth report of the Joint Standing Committee on Road Safety of the 51st Parliament. Sydney: Parliament of New South Wales. (pp.55-62)
Victorian WorkCover Authority. (1997). Transport Industry Guide to Meeting the OHS Duty
of Care. Melbourne: Victorian WorkCover Authority. Vulcan, P. and Corben, B. (1998). Prediction of Australian Road Fatalities for the year 2010.
Paper prepared for the Federal Office of Road Safety. Melbourne: Research and Safety Services.
Werner, T.W. (1987). Fleet safety fundamentals. Professional Safety, 32, 27-30. Wheatley, K. (1997). An overview of issues in work-related driving. In Staysafe 36: Drivers
as workers, vehicles as workplaces: Issues in fleet management. (Report No. 9/51). Ninth report of the Joint Standing Committee on Road Safety of the 51st Parliament. Sydney: Parliament of New South Wales. (pp.15-24)
Wilde, G.J.S. and Murdoch, P.A. (1982). Incentive systems for accident-free and violation-
free driving in the general population. Ergonomics, 25(10), 879-890. Zygmont, J. (1997). Easy riders. CFO, 13(11), 105-107.
BEST PRACTICE IN FLEET AND CORPORATE ROAD SAFETY 73
APPENDIX 1: LITERATURE REVIEW The literature review commenced with a search of publications databases to identify published research in the area of fleet and corporate safety initiatives. This identified a large number of books, journal articles and commissioned reports. Additional material was sourced from conference proceedings and contacts with personnel in other jurisdictions. A1.1 OBJECTIVES OF FLEET MANAGEMENT The traditional view of fleet management has little emphasis on safety. An early text (Botzow, 1968) states that the “fleet administrator manages this important marketing tool primarily as a cost control expert. Indeed, his objective is to provide the required transportation at the lowest overall cost” (p.4). The text deals with safety in terms of describing the vehicle safety standards required in the United States by the (then) National Traffic Safety Agency (and stating that “it is estimated that the standards and new antismog devices will add as much as $100 to the cost of the 1968 models”). In the chapter on “Insurance and safety”, Botzow cautions that “for a fleet with a typical safety record.... insurance savings of only 0.6 percent of fleet costs per car are possible through an improved safety program. Salesmen as a group may, indeed, be less safe than all drivers. Therefore fleet management should adopt an expensive safety program only if it has an unusually poor safety record” (p.66). Control of accidents is discussed as a means of control of insurance rates. He notes that “an effective safety program reduces both insurance costs and repair costs. Accidents mar the company’s image, produce lawsuits, and reduce the productivity of drivers” (Botzow, 1968, p.68). Dolce’s (1984) book, Fleet Management, has a chapter on “Driver and mechanic hiring” which mentions investigation of likely predictors of later accident involvement. The later version of this text (Dolce, 1998), however, has no chapters related to safety at all. However, the importance of fleet safety in fleet management has increased. Annual acquisition surveys sponsored by the National Association of Fleet Administrators (NAFA) have found that United States and Canadian fleet managers rate safety among the top factors when selecting vehicles. ‘In most cases, fleet buyers rank the safety record of a vehicle just behind its initial cost, suitability for a particular job, and depreciation/resale value’ (Minahan, 1997, p 65). A1.2 FLEET SAFETY GUIDELINES Road safety organisations in Australia and overseas have, at various times, provided guidelines to improve the safety of fleets. In addition, some large corporations have published their fleet safety guidelines. All states and territories in Australia offer some form of assistance to fleet managers to train fleet drivers, such as courses, brochures and consultants (FORS, 1979). In the US, it is possible to obtain assistance in funding safety programs at work through various organisations such as the Network of Employers for Traffic Safety (Minahan, 1997).
74 MONASH UNIVERSITY ACCIDENT RESEARCH CENTRE
A1.2.1 Federal Office of Road Safety booklet The Federal Office of Road Safety (FORS, 1979) published a booklet on this topic in 1979 for fleet managers. FORS believes that motivation on the part of the drivers can contribute greatly to reducing crashes. Thus, management must appear to place safety high on its list of priorities. The booklet provides a list of steps to be taken that may improve fleet safety. • Create a role for an individual or committee to be responsible for road safety within the
company. Give this person support from management. • Keep a record of all company drivers. • Record all accidents and analyse them for patterns. • Be aware of potential problems (for example, drivers with bad driving record, vehicle
malfunctions). • Tailor solutions to your company’s individual needs. Other suggestions include making a defensive driving course compulsory, disseminating costs of accidents through the company regularly and that accident investigation procedures include an interview with the driver, with negligent drivers having to prove why they should not be fired. The booklet recommends that when establishing a Fleet Safety Program within a company, it is important to consider the following points: • driver training, • specific accident prevention training (make sure you know what is causing the accidents
within your fleet and tailor the training to this), • driver selection – be clear about your driver needs when advertising positions, find out
about the applicant’s previous driving record, give staff a physical examination and an oral and practical driving test, give new employees a probationary period,
• ensure business schedules give drivers sufficient time to not need to speed, and allow for rest periods,
• don’t pay speeding fines for drivers so that your operation is speedier, • ensure vehicles are properly maintained, • assess the program regularly to ensure that it is effective and to fix things that are not. A1.2.2 FORS/NCA Fleet Safety Manual The Fleet Safety Manual produced by Elliott and Shanahan Research for the Federal Office of Road Safety and the National Safety Council of Australia (Federal Office of Road Safety and National Safety Council of Australia, 1996) states that the elements of an ideal fleet safety program include: • driver selection and hiring • driver induction • vehicle selection • driver training and education • incentives and disincentives
BEST PRACTICE IN FLEET AND CORPORATE ROAD SAFETY 75
• crash reporting • crash investigation • a fleet vehicle incident database A1.2.3 VicRoads Safe Driving Policy In 1989, VicRoads published its Safe Driving Policy - VicRoads Corporate Policy for the Safe and Responsible Use of Fleet Vehicles. The aims of this Safe Driving Policy were to ensure the safety of VicRoads fleet drivers and to set an example to other organisations with fleets. Driver and passenger behaviour and attitudes The Safe Driving Policy states that all staff and their families will be given road safety training via a one or two day training course focusing on behavioural and attitudinal aspects and road safety issues beyond basic driving skills. All staff should complete this course at least once every three years. The course will cover the following topics: passenger assertiveness and responsibility, driver responsibility, road laws, hazard recognition, individual sense of ownership and responsibility, vehicle care and maintenance, first aid, driving skills and travelling on snow or gravel. VicRoads will try to insert information about road safety into other courses (e.g., first aid courses). VicRoads service centres will undertake safety checks of staff vehicles. Drivers and passengers are encouraged to report observed hazards on the roads to VicRoads. Only low alcohol beers and low quantities of other alcoholic beverages are to be supplied at VicRoads functions. Breathalysers will be located at large VicRoads offices and through the community. These will be publicised. VicRoads employees are not to consume alcohol while on duty. If found with alcohol in their bloodstream, employees may be subject to a penalty, may be held responsible for damages incurred or dismissed. Rewards and penalties will be incurred for safe and unsafe driving respectively. Each VicRoads vehicle will have a handbook in it. Improvements to vehicles All vehicles will be marked as VicRoads. Those involved in night driving will be fitted with reflective stripes. All vehicles will display road safety messages in some form. All vehicles are to be maintained to a satisfactory level of safety and cleanliness. Vehicles should have the following safety features: conspicuous colouring, speed warning devices, cruise control, eye level brake lights, mirrors on both sides, safety barriers on station wagons, seat belts clamps or tensioners, airbags, fire extinguishers, first aid kits and reflective
76 MONASH UNIVERSITY ACCIDENT RESEARCH CENTRE
vests. Bull bars are not to be fitted on passenger vehicles. Other vehicles will be assessed on a case-by-case basis. Efficient fleet management Responsibility for various aspects of fleet management has been allocated to various departments or people within the VicRoads hierarchy. Business areas with good road safety records will pay less insurance than those with bad road safety records. Crash reporting is to be standardised, centralised and analysed. The results of analysis are to be used to improve practice. Performance indicators are to be developed. Motorcycle fleets are to be given some attention. Allocation of responsibility Responsibility for all initiatives will be allocated to specific people or departments. The Safe Driving Policy also includes a 37 point Action Plan with a listing of initiatives, who is responsible and dates by which initiatives should be completed. A1.2.4 New South Wales Roads and Traffic Authority Safe Driving Policy The NSW RTA has released a booklet which is a guide to fleet operators about how they can make their fleets safer. The booklet is titled ‘Safe driving policy – Safe vehicles operated safely’. It was modelled on the Victorian Roads and Traffic Authority (now VicRoads) policy. This document stresses the importance of drivers being properly equipped in terms of licensing and knowledge of safe driving practices, that vehicles have safety features such as airbags and ABS brakes and that they are properly maintained. The booklet covers many subheadings as follows. Training and education: It is important to train drivers. Those who travel long distances and those recently involved in a crash are especially good candidates, but is likely to benefit all drivers. It is useful to include road safety information as part of other courses that are being run within the organisation. First aid courses would be useful for drivers. Structured courses that teach awareness of hazards and attitudes toward safe driving, with interaction between members of the course have been found to be more useful than defensive driving courses which only teach vehicle handling skills. Drivers and passengers: No driving under the influence of alcohol, medications or other drugs. No speeding (counsel staff on the dangers of speeding and schedule appointments so there is no need). No driving when fatigued (plan realistic schedules, be rested before departure, stop for appropriate rest breaks and do not drive during normal sleeping hours). Always use seat belts. Operating for maximum vehicle safety: Maintain fleet cars in a roadworthy state, and have them serviced regularly. Planning features for safer vehicles: Light colours for maximum visibility, daytime driving lights, no additional window tinting, ABS brakes, good safety rating of vehicle, airbag, energy absorbing bumper bars, good seat belt geometry, cargo barriers, first aid kits and other features.
BEST PRACTICE IN FLEET AND CORPORATE ROAD SAFETY 77
Management and feedback: charge insurance costs to departments, involve management in accident analysis through reports etc. Also, monitor the accident rate to gauge the effectiveness of programs implemented. The RTA provides materials for companies wanting to pro-actively promote safe driving of their fleet cars. The kit contains a draft Safe Driving Policy that can be adapted for particular companies, a defensive driving video, trainers’ notes, overhead slide templates, session handouts and posters. In addition, the RTA has a Safe Driving Policy for its own fleet drivers. This includes education on drug use and driving, driver health, vehicle operations, vehicle features and vehicle and driver management. The RTA also teaches safe driving practices as part of various other courses that they run (Anonymous, What should driver education mean?, 1993). A1.2.5 Western Australian Guidelines The Road Safety Council of Western Australia has prepared ‘Guidelines for a safe driving policy for fleet operators’ (Road Safety Council, 1997). This document focuses on improving safety through safer drivers, safer driver behaviour and safer vehicles. Vital elements in safe fleet management are involvement from management, commitment from each driver to drive safely and to encourage others to drive safety, safe vehicle selection and good maintenance of vehicles, and ensuring drivers are prepared well. There are a number of subheadings similar to those in the NSW document. Training: The document recommends that each company should have a course that teaches low-risk responsible driving. Avoid defensive driving courses as these focus on emergency situations that most drivers will never encounter. Rather, training should focus on awareness of hazards and safe driving behaviour. A course should include theory as well as practical components, and there should be opportunity for discussion between students after the course as this has been shown to increase the benefits of the course. Those who travel long distances and those recently involved in a crash are especially good candidates for training, but is likely to benefit all drivers. It is useful to include road safety information as part of other courses that are being run within the organisation. First aid courses would be useful for drivers. Drivers and passengers: No driving under the influence of alcohol, medications or other drugs. No speeding (counsel staff on dangers of speeding and schedule appointments so there is no need. This is especially relevant when rural driving is involved). No driving when fatigued (plan realistic schedules, be rested before departure, stop for appropriate rest breaks and do not drive during normal sleeping hours). Always use seat belts. License cancellation should be reported to superiors. Vehicle selection: Features of the car should include light colours, daytime running lights, no additional window tinting, ABS brakes (and education about how to use them) and hands free mobile phone kits. Maintain the car in a safe way. Management and feedback: Charge insurance costs to departments, involve management in accident analysis through reports etc. Also, monitor the accident rate to gauge the effectiveness of programs implemented.
78 MONASH UNIVERSITY ACCIDENT RESEARCH CENTRE
Main Roads Western Australia also provides support material to help organisations to develop a Safe Driving Policy for their organisation. Main Roads Western Australia – Safe Driving Policy All vehicles are covered by this policy (including bicycles, cars and trucks) owned by Main Roads WA or used by Main Roads WA staff. Managers are responsible for ensuring all drivers are correctly licensed, adequately trained, knowledgeable about the effects of drugs on driving and healthy enough to drive. They are responsible for encouraging safe driving practices including respecting the rights of other road users. They are also responsible for vehicles having safety features and being safely maintained. Main Roads WA places a focus on having safe driving practices internally and to set a good example for the community. Main Roads WA completed a survey of staff attitudes and driving behaviour before the policy was implemented (in 1997) and will repeat this survey to measure the effect of the policy. It will also be measured by several performance indicators, being: • number of crashes involving Main Roads WA vehicles • incidence of crashes involving Main Roads WA vehicles (per million kms travelled) • cost of crash repair and vehicle replacement • cost of crashes per million kms travelled • average repair and replacement cost per crash • number and cost of vehicle related workers compensation claims per 1,000 staff members • average cost of vehicle related worker’s compensation claims The safe driving policy includes the following features: • ABS braking systems and drivers side air bags on all vehicles • Hands free mobile phone kits • Driver courses for remote areas • Knowledge about fatigue and driving • Periodic checks of licences • Analysis of road crashes and incidents • Guidelines for incident reporting in the glove boxes of all vehicles. A1.2.6 Queensland Transport Workplace Fleet Safety Self Audit Book and Workbook Queensland Transport has designed a self-audit guide and workbook so that companies can easily assess their safety standard and record in relation to their vehicle fleets (Queensland Transport, 1998a and 1998b).

BEST PRACTICE IN FLEET AND CORPORATE ROAD SAFETY 79
The guide takes the fleet manager through the following aspects of fleet safety: • Fleet safety policy • Recruitment and selection • Induction programs • Fleet selection and maintenance • Vehicle crash involvement • Incentives and disincentives and • Training and education It also looks at how to conduct an audit and Australian standards for fleet management. It includes a Best Practice Mapping Chart. The workbook takes the fleet manager through many questions in the categories listed above and asks them to fill out if that particular feature is present, and if not, when they plan to start and complete it. Managers can rate their current level of fleet safety by listing all the features they currently have in practice and comparing it to a list at the back of the book. They can then apply for official recognition from Queensland Transport for a bronze, silver or gold level of achievement. The Workplace Fleet Safety System was launched in March 1999 (Anderson and Plowman, 1999). Anderson (personal communications) reports that 264 organisations had registered for the system by mid-October 1999. No applications for official recognition have yet been received, but a number of organisations are expected to complete the system to bronze level by the end of 1999. A1.2.7 Network of Employers for Traffic Safety The Network of Employers for Traffic Safety (NETS) is a collection of public and private employers and government organisations in the USA promoting workplace highway safety programs that reduce motor vehicle injuries among employees (Kedjidjian, 1995). To improve fleet safety, NETS recommends the following steps: • Identify problem areas. • Compare your company’s injury, injury-crash and total crash rates with national norms
(which are 0.6, 0.6 and 3.1 per 1 million vehicle miles travelled respectively in the USA). • Assess your company’s safety record before you implement programs so that you can tell
if your programs are effective. • Top management must approve and support any plans for safety programs. This sends a
strong message to all employees. A1.3 DRIVER SELECTION AND INDUCTION Many drivers of fleet vehicles are not selected on the basis of their ability to drive safely, but on other characteristics necessary for their main job of which driving is a necessary component. Generally, driver selection has only been considered important for drivers of commercial vehicles. Here, driver selection may include investigation of accident and infringement history, whether the licence held is valid for the vehicle to be operated and whether the driver is medically fit to operate the vehicle (e.g. Dolce, 1984).
80 MONASH UNIVERSITY ACCIDENT RESEARCH CENTRE
Botzow (1968) has commented that the characteristics present in safe drivers may even conflict with other characteristics that the employment requires:
“Effective accident-prevention programs center on the driver. The best programs select employees on the basis of their driving ability, driving record, or psychological driving tests. Unfortunately for fleet insurance costs, some of the traits of poor drivers, such as aggressiveness, may fit the needs of a sales job. Then less than perfect driving habits are of secondary importance to the employer. Some employers send drivers with high accident records to driving schools, lift their personal use privileges, or send them a warning from the vice president. For many driving jobs the traits of a good driver correspond to those required for superior work performance” (Botzow, 1968, p.68).
A number of driver selection strategies have been proposed to improve fleet safety. An article by Minahan (1997) that appeared in the magazine ‘Purchasing’ suggested that a low-cost strategy to increase safety of fleets would include ensuring there are no dangerous drivers using company cars by doing background checks on the driving records of new or potential employees. Those with bad driving records can be barred from driving fleet vehicles, required to complete a safe driving course or not hired. Adrian Roberts (in Law, 1997b), Director of the MMI driver safety program in New Zealand, advises readers to ensure they see the licences of everyone with a company car. Sometimes people have the wrong licence. As well as implications for insurance in case of an accident, this may have safety problems. Werner (1987) has outlined the North Carolina Department of Transport’s ideal hiring procedure that has arisen out of a driver safety program designed by the DOT. 1. Position is advertised as a driving position and requirements for a Class A or B licence
posted 2. Applicants must fill out a driver’s questionnaire on their past driving history as well as a
form that allows a check on their driving history as recorded by the Division of Motor Vehicles.
3. The supervisor responsible for the hiring can review the paperwork and determine which drivers he or she wants to interview.
4. After the supervisor has picked a few of the best applicants, the coordinator will take the applicant on a road test to determine how much driving ability he or she has.
5. The supervisor will then be ready to make the decision with this information in mind. In driver induction, there appears to be a difficulty in ensuring that drivers actually read and take note of vehicle use policies provided to them at the time of employment. Lenckus (1999) reported that a study by American International Group Inc. (AIG) found that employees typically signed the AIG policy and procedures form without reading it. Therefore it was vital to continually reinforce driver safety and company policy and procedures to employees. Klara (1998) notes that delivery restaurants in the United States are now paying more attention to how they select and train their drivers. For example, two large pizza chains, Domino’s and Papa John’s have revamped their training packages in the last year. Steak-Out will not hire anyone under 21 years old. Donato’s pizza will only hire people with clean driver records. The operations Vice President, Tom Grote, estimates this would be only about
BEST PRACTICE IN FLEET AND CORPORATE ROAD SAFETY 81
40% of all applicants. Papa John’s pizza has a direct hook-up with state motor vehicle departments and Pizza Villa requires drivers to submit their driver record every year. A1.4 VEHICLE SELECTION A1.4.1 Likely benefits of selecting safer vehicles While there is considerable evidence to show that there are large differences in crash protetction among different car makes and models, the accident avoidance performance of different cars has not been studied very extensively. The likely benefits of choosing safer cars are therefore based on crashworthiness ratings, although there might be substantial benefits from some of the technology related to driving behaviour or vehicle defects. Intelligent Speed Adaptation Systems (ISA) and alcohol interlocks have been mentioned as items that have the potential to have significant safety benefits (Vulcan and Corben, 1998). Seat belt reminders, designed to compel occupants to use seat belts, would affect 20% of the occupant fatalities, possibly reducing them by 50% (Nygren, 1984). There are two main methods of determining the differences in crashworthiness of vehicles; crash tests and statistical analysis of real-world crashes. While crash tests can be performed with vehicles that have been just launched on the market, there is a substantial delay in feed back from the real-world data. Methods for combing these two sources of data are being developed but such models are still not generally used. Nevertheless, there is sufficient evidence to show that, in general, cars that score well in crash tests also perform well in real life crashes (Newstead and Cameron, 1999). The best way to demonstrate the potential safety benefit of choosing the best possible car is to study the experience of the available rating schemes. Over the whole spectrum of cars, there is a 1 to 5 ratio between the best- and the worst-performing cars, while if taking size (more strictly mass) into account, the ratios are in the order of 1 to 2.5 between best- and worst-performing cars. In Sweden, it has been shown, that the best available car model is in the order of 60% better than the average car population, and at least 30% better than the average new car of the same size (Krafft, 1998). The potential benefits of choosing the safest car are therefore substantial. The size of the car, or rather the mass, also plays a major role in crash protection. In general, the risk of a serious injury is reduced by 5-10% for every extra 100 kg of car mass, in two car collisions (Buzeman, 1997; Nygren, 1984). It must be noted, that an increased mass in a two car collision would impact on the probability for injury in the collision partner. The overall benefit of just more heavy cars is therefore more or less none, although it is important to realise, that small, light vehicles generally do not offer the same level of inherent protetcion as a larger vehicle. The most beneficial situation occurs when the masses in the vehicle fleet have a small variation. For some vehicles, it is possible to choose safety features as option. While a driver side airbag must be seen as a basis for having the possibility to be rated as a safer vehicle, other options can be rated on the issue of being effective. In general, crash protection features like side airbags and anti-whiplash protection are of high value and might add benefits in the order of 5 to 25% (Hell, Langwieder, Walz, Muser, Kramer and Hartwig, 1999). Other features like stability control or intelligent cruise control are not fully understood in terms of benefits.
82 MONASH UNIVERSITY ACCIDENT RESEARCH CENTRE
A1.4.2 Fleet demand for safer vehicles Traditionally, vehicle selection has been largely guided by operational needs and budget. However, in parallel with an increase in vehicle safety concerns by private motorists, vehicle safety has increased in importance as an issue in vehicle selection. A 1992 Guide to Vehicle Selection published in Fleet magazine summarised the issues that need to be considered when selecting vehicles for a fleet as: engine size, projected running costs, options available, safety considerations and appropriate budget (Anonymous, Guide to Vehicle Selection, 1992). It suggested that the choices that can be made to ensure fleet vehicles are as safe as possible include: • having newer rather than older cars in the fleet (as newer cars have built in safety features
such as crumple zones and better seat belts), • larger cars (passengers are less likely to suffer injury than passengers in smaller cars), • ensure the car has ABS brakes. In America, insurance companies have been the major force behind the safety issue. They have been lobbying for stricter fleet safety requirements (Anonymous, Guide to vehicle selection, 1992). One source commented that companies that do not provide safety features in vehicles (as well as other features) may lose their staff (Kedjidjian, 1995). One of the factors associated with the increased interest in vehicle safety by fleets has been the increasing accessibility of safety features (Myhre, 1996). This is a consideration for both safety-conscious and non-safety-conscious fleet purchasers. A problem faced by fleet managers in Australia in past years when selecting vehicles for fleets was a lack of safety items available at cost effective prices. In 1992 there was still no affordable fleet vehicle available that had a standard or optional air bag (Anonymous, Guide to vehicle selection, 1992). General improvements in vehicle safety (whether driven by regulation or the market) play a large role in improving the safety of corporate fleets as many non-safety-conscious fleet managers will buy whatever comes standard, or whatever they can afford (Minahan, 1997). A1.4.3 Airbags and antilock braking systems Air bags and anti-lock braking are increasingly becoming standard items on corporate cars (Minahan, 1997). The 1997 National Association of Fleet Administrators (NAFA) survey (in Minahan, 1997) found that more than half of fleet managers say they will only order vehicles with air bags, and 33% say they select air bags when offered an option. This is an increase from previous years. About 41% say they will only buy vehicles with anti-lock braking, which is also an increase, but not as high as for airbags. This may be because awareness of the effectiveness of ABS is not as high as for airbags. Many fleet operators also want to use ABS brakes in new vehicles in their fleets (Anonymous, Guide to vehicle selection, 1992). There is a general perception that ABS is a prevention measure, rather than airbag which is seen as too late. It is unclear how much relative cost of ABS and airbag (and reusability of ABS) is considered a factor. Perhaps there is an emphasis
BEST PRACTICE IN FLEET AND CORPORATE ROAD SAFETY 83
on crash prevention, rather than injury prevention. This is understandable given that the very large majority of fleet vehicle crashes involve vehicle damage (and the resultant repair costs) but no injury. Willingness to pay for safety features An Australian study conducted for FORS by the Roy Morgan Research Centre in 1992 examined the amount of money that new car buyers (or renters) were willing to pay for safety features. Four groups of subjects were assessed. They were: 1. private car buyers, 2. main drivers of vehicles registered in a business name, 3. renters of short term hire cars and 4. fleet managers. A fleet was defined as “one or more passenger vehicles registered in the name of a public or private organisation or enterprise” (p 6). Subjects were presented with two options for safety packages. These were: 1. A non-air-bag package that included improvements to seat belt and seat design, improved
leg protection, padded steering wheels and seat belt warning devices. 2. An air-bag package that included all of the above as well as a driver side air bag. Subjects were asked if they would pay certain set amounts to purchase or rent the two packages, in a ‘take it or leave it’ scenario. They were then asked if they would be willing to pay higher or lower amounts for each package, depending on their previous answer. The best estimated retail price that emerged from the results was $270 for the non-airbag package, and $700 for the airbag package. It was found that the main drivers of fleet cars were more willing to pay for safety features than private buyers. It was estimated that 90% of the main drivers of fleet cars would be willing to pay the best estimated retail price or more for the non-airbag package, and 81% would be willing to pay the best estimated retail price or more for the airbag package. All of the fleet managers who were responsible for the purchase of cars within their organisation (for both public and private organisations) were willing to pay the best estimated retail price or more for the non-airbag package. Over 80% were willing to pay the best estimated price or more for the airbag package. Renters of short term hire cars were asked about their willingness to pay an increased daily charge if the above-mentioned safety features were present. It was found that over 90% of renters were willing to pay for the industry estimated increases in rental fees. While the detailed findings of this study may now be outdated, the general finding that fleet buyers are more willing to pay for safety features than private buyers may still be valid. A1.4.4 Other features Meola (1997), a business solutions consultant for a US insurance company, comments that the ergonomics of the driver are an important consideration in driver safety. Driving can cause fatigue. Features of the car that increase safety include air bags, seat belts, disc brakes,
84 MONASH UNIVERSITY ACCIDENT RESEARCH CENTRE
adjustable safety features (such as steering wheel and seat belts) and ensuring visibility is good by the design of the vehicle. It is likely that air conditioning is specified for almost all fleet vehicles, to improve comfort rather than for safety reasons. On the basis of laboratory research, air conditioning could be expected to reduce the development of fatigue in warm conditions (Mackie and O’Hanlon, 1977). Air conditioning may be viewed as a safety feature because it can be used to de-mist the windows rapidly. Companies are seeing extras as something that they shouldn’t have to pay extra for (Law, 1997a). Daytime running lights have been recommended as a good safety feature in the United States (Minahan, 1997). Australian fleet buyers have stated that they will purchase this feature – once it is proved that it works. A small-scale fleet study in Western Australia has found that vehicles equipped with DRLs were more than eight times safer than non-DRL vehicles for conspicuity-related crashes and five times safer when rear-end collisions were considered (Poole, 1999). Estimates of the benefit:cost ratio ranged from 3.3:1 to 5.7:1. A1.4.5 Intelligent Transport Systems Intelligent Transport Systems (ITS) are emerging. Three examples are personal in-vehicle information systems, fleet management systems and radio data system-traffic message channel (Kujawa, 1999). Intelligent Vehicle and Highway Systems (IVHS) can improve fleet management (Sanderson, 1992) and on-board global positioning systems are being used to improve fleet safety (Minahan, 1997). Location finding technology is technology that enables you to locate a vehicle or person. It can be used to improve the safety of fleets by enabling roadside assistance to be prompt (Anderson, 1998). A1.4.6 Maintenance Preventive maintenance has been promoted in a number of articles (e.g. Zygmont, 1997). The extent to which it contributes to safety (rather than reduced unscheduled maintenance costs) is unclear, however. There is a perception that less regulated fleet environments may have a risk of insufficient preventive maintenance being carried out. Zygmont (1997) recommends that one way to maintain cars in good form is to provide coupons for drivers to redeem at regular intervals for preventative maintenance. The NSW Roads and Traffic Authority has produced a short information sheet for fleet owners and operators in New South Wales about reporting vehicle defects in fleet cars. A fleet vehicle is defined as any vehicle where a person is employed to drive that vehicle. Thus, a fleet could be only one car. Motor Traffic Regulation 92 requires vehicle fleet operators to provide forms for drivers to record any faults in vehicles. These forms must be kept for a minimum of six months.
BEST PRACTICE IN FLEET AND CORPORATE ROAD SAFETY 85
A1.5 DRIVER TRAINING AND EDUCATION The philosophy of many people in driver training and education is summarised in the following quotation:
The driver plays the principal role in accident avoidance. Good driving techniques can make the driving safer (Deierlein, 1999).
There are various US insurance companies that run training programs for their clients and other companies on a fee paying basis, as well as offering consultation in driver qualification and selection (Beach, 1997). Post-licence driver training courses can be divided into advanced and defensive driver training courses (Roads and Traffic Authority, 1997). Most advanced driving courses involve emergency recovery skills and are often conducted at off-road venues to allow driving at high speed and to allow drivers to experience and recover from loss of control in comparative safety. Defensive driving courses sometimes include loss recovery techniques but commonly include safe driving strategies, discussion of risk-taking and decision-making as well as attempting to change motivations and attitudes. The Roads and Traffic Authority article notes that some driving courses are labelled “defensive” while having large “advanced driving” components. Those who run post-licence driver training courses strongly maintain that they produce safer drivers. However, there is substantial literature to support the claim that these courses do nothing to decrease the crash rate of those who participate, that they may even lead to higher levels of crashes and speeding offences (especially in young male drivers), and that they lead to overconfidence and greater risk taking. To date these courses have not been scientifically studied. In addition, the courses concentrate on skid training, which is a minor cause of crashes, teach emergency skills that are quickly forgotten, and are deficient in emphasis on appropriate attitude and behaviour for safe driving. These courses may provide some benefits in the corporate setting, but motivation for driving behaviour during work is often tied to job-related benefits (Roads and Traffic Authority, 1997). The Roads and Traffic Authority consider that educational driving courses that encourage knowledge and understanding of the driving process may be more useful. These courses outline the risks on the road and teach the driver how to lower those risks. A1.5.1 Descriptions of various programs Varied programs have been developed in different companies. Lack of comprehensive and objective evaluation appears to be their common trait. One of the most rigorously evaluated studies of the safety effects of driver training within the corporate environment was undertaken by the Swedish Road and Traffic Research Institute (Gregersen, Brehmer and Moren, 1996). This study is described in Chapter 4. One large-scale training program was developed in 1975 by the North Carolina Department of Transport (N.C. DOT). They expanded their Occupational Safety and Emergency Planning Section, and developed a program to deal with the large number of accidents in motor vehicle fleets. Werner (1987) has outlined some of the successes and failures of the program.
86 MONASH UNIVERSITY ACCIDENT RESEARCH CENTRE
The program is a 32-hour course that is taught to Fleet Safety Coordinators and their assistants in all counties around North Carolina. The items taught to safety coordinators are: • Perception and reaction times • Defensive driving techniques • Seatbelt justification • Communications techniques • Attitudes and driving • Psychophysical testing (group of tests, e.g. visual acuity, reaction times). These tests are
completed to make drivers aware of problems for which they may need to compensate. • Audiovisual equipment use • Most common accidents in N.C. DOT • Truck inspections and techniques • Alcohol and drug problems • Physics of a truck in motion (skidding) • Conducting and grading skills tests • Conducting and grading road tests • Instructor techniques • Accident investigation and preventability • File system set-up and associated paperwork. These coordinators and assistants are then helped to implement the program. The program is run as follows. Firstly, there is a visual check of the student’s driver’s licence. Drivers are then taught defensive driving (through a slide-cassette program), improving driver habits, the fatal five + 1 (DOT accidents), attitudes and driving, skidding and physical forces, preventative maintenance and pre-trip inspection and seat belts use and policy. Finally, there are psychophysical tests, a skills test and a road test. As well as training drivers, the coordinators are expected to follow up after a period of time. As a result of running this program, a number of recommendations have been made about training programs in general. They are as follows: • training must be specific to the geographical area in which the fleets will be operated, • the degree of training must be tailored to the level of education of the drivers, • choose the best drivers for the money you have, • get to know the people who will be driving, the type of work they do, and the conditions
under which they do it before training new drivers, • solicit the support of top management; a policy statement is a useful way to do this, as
well as getting management involved at any time (e.g. invite them to meetings about fleet safety),
• be prepared to adapt or change the program depending on the drivers’ needs, and • conduct a regular review of your program to identify things that need to be changed. The ‘US Fleet Safety Project’ is a driver training program that includes one-day hands-on seminars. Hewlett Packard has enlisted in this program and also has a regular check of all drivers (Donoho, 1996). Saffron (Anonymous, What should driver education mean?, 1993) has stated that behavioural education is vitally important. He believes the biggest problem is motivating people to do
BEST PRACTICE IN FLEET AND CORPORATE ROAD SAFETY 87
what they know they should do. In order to address the issue of motivation, it is necessary to emphasise the reasons why certain behaviours are desirable to the drivers. A written company policy also helps. For maximum efficiency, the company policy should incorporate ground rules, guidelines, procedures and an integrated training program. Owen Lloyd of Associated Training Consultants (Anonymous, What should driver education mean?, 1993) believes that teaching drivers that the car is the most dangerous place they will be all day, and that it is their responsibility to drive safely will result in fewer accidents. He suggests the following areas be given attention in driver training: • efficient vehicle maintenance, • prompt attention to reported vehicle faults, • prompt responses to driver reports, • maintain accurate driver log books, • driver motivation and recognition, • remove any obligation from any driver to make up lost time when driving, • invite driver participation in vehicle suitability and selection, modifications and
allocations, • adequate vehicle cleansing, fuelling and day to day maintenance facilities, • alcohol awareness for the drivers. Jim Murcott is the Managing Director of a driver training centre. He believes that drivers without special training can not handle an emergency such as swerving off the bitumen onto the gravel and back again (Murcott, 1992). The licensing system does not teach defensive driving. The Jim Murcott/Peter Brock Driving Centre runs a course in driving safely for fleet drivers called ‘Total Driver Management’. The course begins with an analysis of the past and present situations of the company’s safety record, incorporating statistical data. They believe that is important to know about the experience of the drivers before starting a driver education course. It looks at company vehicle policy to ensure that all aspects of company vehicle usage are covered. An in-house safety program is then created that covers driving safety and vehicle care as well as regular initiatives and incentives. On-site discussions, off-road training courses and public roads awareness sessions provide defensive driving and hands-on emergency control skills. Another area that may be covered in the course is vehicle selection. Special driving tuition is organised for the special needs of particular companies, and remedial tuition is organised for repeated offenders. Finally, targets are monitored to see if the program is meeting its requirements. The RACV Driving School runs a driving course called ‘Driver Aware’ (Anonymous, 1999). Around 80% of students are fleet drivers. Part of the course is to teach driving skills and part is to instil a healthy sense of fear about what can happen on the road. The course focuses on avoiding risks before they become incidents. As part of the course, students are required to skid to a sudden stop from 60 km/h. This experience demonstrates what it is like to lose control of a vehicle and that it is difficult to handle an emergency. When the Victorian Department of Human Services buy a new car, they are given a voucher to send one person to a driver training program for free. They save these centrally until they have 20 and then send a group of employees to a training program. Participants undergo training at either DECA, Drive Skill International or Jim Murcott Driving School.
88 MONASH UNIVERSITY ACCIDENT RESEARCH CENTRE
DriveAware is a one day course run through Drive Skill International. It is essentially a car control course. It involves some theory in the morning followed by a skill based session. There is then more theory and another skill based session. Finally, drivers are debriefed before they leave. Topics covered in the theory sessions include information on tyres and tyre pressure, braking and driver attitude with a focus on non-aggressive driving. Although the Fleet Manager at the Department of Human Services has a database with information since 1997 to measure the effectiveness of sending drivers to these courses, no statistics are available yet. One US company, Liberty Mutual, offers a program that includes field seminars and a more intensive week-long program at the company’s Research Centre of Safety and Health (Beach, 1997). This includes both classroom and on the road training. Classroom work involves identifying specific safety problems a particular fleet may have and developing a safety program. The on-road training includes some emergency manoeuvres and teaching drivers the ‘commentary’ technique, which involves the driver telling the trainer what he or she is seeing as they drive down the road. The trainer takes note of how the driver expresses his or her awareness of the work environment and is then able to catalogue those areas in which the driver needs improvement. The program also covers the basics of ‘decision driving’, which is training drivers to translate into decisive output the constant input of traffic information they see, hear and feel while on the road. The US delivery restaurant companies have developed a range of approaches to driver training (Klara, 1998). Papa John’s has adapted its training video to suit young people, who comprise the majority of their drivers. Domino’s has transferred their training package to an interactive CD-ROM package. This finishes with a test. At Steak-Out, drivers are required to ride with an experienced driver for two days before they can deliver alone, and other companies have similar policies. Botzow (1968) recommends monthly or bimonthly safety bulletins as an alternative to driver training programs. “These are relatively easy and inexpensive to distribute to each driver. They provide him with useful information and remind him of management’s interest in safety” (Botzow, 1968, p.69). The subjects recommended by Botzow for safety bulletins are: • check car before starting • defensive driving • speed and road conditions • correct use of brakes • safe driving techniques • winter driving A large survey of company car drivers in Great Britain (Lynne and Lockwood, 1998) found that 11% of the drivers had taken a course of car driver training since first passing their driving test. Drivers who had received such training had an accident rate that was 8% lower than those who had not, though the difference was not statistically significant. Lynne and Lockwood (1998) note, however, that it is possible that the selection of drivers for training may have been non-random. Drivers may have been selected for training because
BEST PRACTICE IN FLEET AND CORPORATE ROAD SAFETY 89
they had a poor accident record or, conversely, drivers who were more safety conscious may have volunteered for training. Therefore, the interpretation of the results is unclear. A1.6 DRIVER MANAGEMENT Day to day management of driving practices is expected to effect safety outcomes. This can involve ensuring that drivers are fit to drive, realistic scheduling of trips and fatigue management policies. Many authors have noted that the time-urgency factor may be an area that companies can have an influence on, by scheduling more realistically, to ensure drivers are driving more safely (e.g., Adams-Guppy and Guppy, 1995). One famous legal case in 1993 involved a woman suing Domino’s restaurant chain after being hit by one of its delivery drivers (Klara, 1998). The driver was speeding in order to make the delivery in under the 30 minute guarantee. This has resulted in guarantees like this one being withdrawn. Some US restaurant chains have managers who follow drivers without the drivers’ knowledge to check up on them or undercover customers who report back on the driving performance of their delivery boy or girl (Klara, 1998). A number of companies have their phone number on the car so that the public can ring if they see an unsafe driving behaviour in one of the delivery cars. Many of the fleet safety guidelines reviewed in Section A1.2 have driver management components. The FORS (1979) booklet states • ensure business schedules give drivers sufficient time not to speed and allow for rest
periods • don’t pay speeding fines for drivers so that your operation is speedier The RTA Safe Driving Policy and the Western Australian ‘Guidelines for a safe driving policy for fleet operators’ include • no driving under the influence of alcohol, medications or other drugs • no speeding • no driving when fatigued • always use seat belts Some companies use toll-free telephone numbers printed on the cars to monitor their drivers. DriverCheck in Atlanta is a company that operates a system such as this one in the follwing way (Kedjidjian, 1995). Following a telephone report to DriverCheck, the company to whom the vehicle belongs receives an incident report. The driver is called in to speak to a manager. The manager will praise the driver if it was a positive report. If it is a negative report, the driver is given the opportunity to give their perspective, and then appropriate action is taken. Appropriate action includes re-emphasising company focus on driver safety, presenting a verbal or written warning, encouraging attendance at a defensive driving course or suspending or terminating the driver.
90 MONASH UNIVERSITY ACCIDENT RESEARCH CENTRE
David Smith of DriverCheck says on average, companies reduce their incident rate 25-30% after one year on the program. It then drops slightly again, and plateaus at the third year. It has then become part of the corporate culture. A1.7 INCENTIVES AND DISINCENTIVES A1.7.1 General principles The following factors have been identified as theoretically relevant for the functioning of incentive programs (Hagenzieker, 1988; Wilde, 1988, cited in Janssen, 1991): • the extent of the accident free performance (time or kms), • whether the contingency is of an all-or-nothing type or whether the incentive is
proportional to the actual reduction in accident rates achieved, • whether there is a group or an individual contingency, • whether the incentive is extended straight away or in an indirect form, notably as a ticket
in a lottery that may win an even larger incentive. In proportional schemes, the reward is proportional to the achieved reduction in accident risk when looking at group performance. It is a just reward as it is proportional to performance and the potential cost to the incentive provider can be set to a maximum. It can be in the form of apportioning exact savings in accident costs, or a maximum amount can be set for the group that is earned if no accident costs at all are produced in the contingency period. Proportional rewarding will always yield better results than the all-or-nothing scheme. This is because in an all-or-nothing scheme the incentive provider will be paying for the high percentage of drivers who would not have had an accident anyway, while in a proportional scheme the driver only gets what he or she has earned themselves. Group incentives (as opposed to individual incentives) aim to create group pressure towards the achievement of the required performance. This means all individuals must change their behaviour more than in an individual scheme. Instead of giving all accident-free drivers a small proportion of the total incentive reward, it may be valuable to give a small number of drivers a large amount of money. The ‘winners’ would be selected by lottery out of the pool of eligible drivers. In addition, managerial factors will intersect with the above factors to contribute to an incentive program’s success. Wilde and Murdoch (1982) proposed that an accident prevention strategy derived from Risk Homeostasis Theory would: • decrease the perceived benefits of risky behaviour (e.g., pay taxi drivers per time unit, not
distance), • decrease the perceived costs of cautious behaviour (e.g., make safety features in vehicles
cheaper), • increase the perceived benefits of cautious behaviour (e.g., institute incentives and
rewards for accident-free and violation-free driving), and • increase the perceived costs of risky behaviour (e.g., reduce financial rewards to
employees who do not wear seatbelts).
BEST PRACTICE IN FLEET AND CORPORATE ROAD SAFETY 91
A1.7.2 Reported effects of incentives and disincentives Different insurance premiums based on driving record is a financial incentive system for the general public to drive carefully. The change in premiums must be consistent with driving records in order to work (i.e., don’t have a lifetime rating one system in place). There appear to be no scientific studies of the effect of insurance premiums on safety. Barmack and Payne (1961) described a program to develop and evaluate measures to prevent personal injury accidents among drivers at an American air base driving privately-owned motor vehicles. The initial analysis showed that about two-thirds of the accident-involved drivers had been drinking prior to the crash and problem drinking and disciplinary problems were more common among the accident-involved drivers than other servicemen. In the program, the drivers were told that their ranks were in jeopardy and that they might be given a dishonourable discharge or referred to a psychiatrist if they were found at fault in an accident involving their private vehicle. After one year it was found that the number of lost-time accidents decreased by 50%, the total frequency of personal injuries decreased by 54% and the number of personal injuries to the driver decreased by 60%. This was in comparison to the accident rate before the measures were instituted and the accident rates of other bases. Kuan et al. (1969, in Wilde and Murdoch, 1982) looked at the effect on the general population of a positive reinforcement intervention. Three groups of 15,000 drivers with clean driving records (for the previous three years) in California were involved. The first group was sent a letter congratulating them on their good record and urging them to renew their licence in time. The second group received the same letter but was also told that their written test would be waived when they renewed their licence. The third group (control) was not contacted at all and their licence renewal followed standard procedure. In the following year, the first group had significantly more crashes than the control group, with the biggest difference in young males. This may have been because the drivers were reacting to what they saw as a bureaucratic ploy. The second group had fewer accidents than the control group, but this was not significant. Harano and Hubert (1974) examined the effects of giving a one year extension on licences to drivers as an incentive. There were two scenarios. Firstly, two groups of drivers were given this reward unexpectedly after a year of accident and violation-free driving and were promised the same again if the following year was also accident and violation-free. Group One received a congratulatory letter and consisted of almost 10,000 drivers. Group Two received a congratulatory letter and a key chain to remind them of their good record and consisted of almost 5,000 drivers. There was also a control group of almost 10,000 drivers who were not contacted at all. It was found that both experimental groups had about 10% more crashes than controls. The second scenario involved drivers who had had a violation in the previous year. One group (almost 10,000 drivers) was told that they would be given a one year extension on their licence if their record was clean over the following year. A control group (almost 10,000 drivers) was not contacted at all. This intervention was found to be successful, with those whose licences were up for renewal in the next year having the least crashes. Other drivers had as many accidents as controls.
92 MONASH UNIVERSITY ACCIDENT RESEARCH CENTRE
Marsh conducted a study in California in 1978 (cited in Wilde and Murdoch, 1982). One group of drivers with demerit points were supplied with learning material about safe driving practices and were required to complete homework. Another group of drivers with demerit points were given the same materials and exercises and were told that they would be rewarded with a one-point reduction in their demerit points if the next six months was offence free. Homework plus the incentive system was more effective than homework alone. This appears to be due more to non-responders in each group than the intervention itself. The good driving record of the drivers in the homework plus incentive group deteriorated once the incentive disappeared. Waller et al. (1977, cited in Wilde and Murdoch, 1982) looked at the effect of skipping the knowledge and road tests from the licence renewal procedure for applicants with a clean driving record (i.e., no convictions or accidents for the previous four years). This study was conducted in North Carolina. There were three groups of drivers: clean record, dirty record (extensive bad record; had to take road and knowledge test) and soiled drivers (some activity on their bad records, but not enough to have to take a road test). Drivers were informed of the test waiver program at a point in time and were informed that the results would be based on the driving they had done in the last few months. Thus, they were given or not given a reward at a seemingly random point in time. Their driving records were followed up for a few months after that. The test waiver program had no effect on the driving of most of the drivers in the study. However, one interesting finding was that those with dirty driving records drove even worse after the introduction of the test waiver program compared to drivers with dirty records who renewed their test before the introduction of this program and had not been administered a road test. This study concluded that incentive programs were superior to reward programs in improving road safety. Also, it appears that incentive programs are most effective when the time period in which the desired outcome is expected is short, and that their power to prevent accidents is increased once they have been earned. They may also be more effective in younger drivers. There is evidence to indicate that drivers with good records who are given a reward either show no difference or an increase their accident rate. An incentive program may result in continued safer driving as drivers may improve their driving habits and attitudes. Wilde and Murdoch (1982) found no research that examined whether there was a difference in the size of an effect on driving behaviour depending on the size of an incentive. They noted that there is substantial experimental and public support for incentive schemes in order to improve road safety. A large British survey (Lynne and Lockwood, 1998) found that only 4% of company car drivers claimed that their company offered them some kind of reward for not having accidents. The vast majority were being offered rewards with a financial value of £60 per year or less. Those being offered rewards had about 21% fewer accidents than those who were not – a reduction which was not significant at the 5% level, though it was significant at the 10% level.
BEST PRACTICE IN FLEET AND CORPORATE ROAD SAFETY 93
Papa John’s delivery restaurant chain in the US has 6,000 drivers (Klara, 1998). If Papa John’s drivers accumulate certain amounts of safe driving hours (i.e. on duty time with no violations) they are given incentive awards ranging from a free oil change to a free trip to Disney World (15,000 safe driving hours). They also have a ‘Roadeo’ in which drivers compete for prizes by parallel parking and driving backwards to win cash and merchandise. Domino’s has an annual competition where the best 20 drivers from around the country are flown to the competition where they perform reverse serpentines and backward tapered alley for prizes. American International Group (AIG) charges the cost of repairing damaged cars to the department responsible for the car as a means of incentive to departments to improve the road safety record within themselves (Lenckus, 1999). The safety program at Whittle Communications in Tennessee includes pre-employment screening, warning systems, financial incentives and training (Kedjidjian, 1995). If drivers have a moving violation, or have an at-fault crash, they are given a stage-one warning, and are not eligible for the highest level of bonus dollars. Drivers with two moving violations or at-fault crashes in a year, or three in two years, receive a stage-two or official warning. These drivers have to enrol in a driver improvement program within 30 days on their own time, or lose their jobs. If one of these drivers has another crash in a three year period, they are fired. Also, raffle prizes are offered for all drivers with a clean record, and monetary bonuses are awarded. The coordinator of this program, Linda Martin, believes it has resulted in fewer crashes. The US company Aetna Inc. checks the driving record of all applicants for jobs that involve driving (Zygmont, 1997). In addition, this company charges drivers $200 if they are involved in a preventable accident. A1.8 CRASH REPORTING Campbell (1998) has written an article on how to manage initial reporting of a crash. The points outlined are as follows: • Establish a set of procedures to be followed in case of a crash, including training drivers
in what is expected in terms of reporting a crash • Both major and minor crashes should be reported • Crash reports should contain the following information:
Driver name Exact crash location Time of crash Extent of injuries Hazardous materials present Special equipment needed (eg. tow trucks)
• Send a representative from the company, if appropriate, and make that person responsible in terms of liasing with emergency workers (but do not interfere with emergency workers doing their job)
• Try to collect information that is relevant to your company if appropriate at the time

94 MONASH UNIVERSITY ACCIDENT RESEARCH CENTRE
A1.9 EXAMPLES OF FLEET SAFETY PROGRAMS There are a large number of reports of fleet safety programs that companies have considered beneficial. This section summarises some of those programs that have undertaken some form of measurement. A1.9.1 Hertz Rental Cars The National Safety Council ran a defensive driving course, that was used by the US company Hertz Corp. in its rental car division, in 1992 (Kedjidjian, 1995). It was the pilot of a four hour defensive driving course. The course was conducted in the mid-Atlantic region over a period of six months. Hertz trained half its fleet drivers and their supervisors. This group included transporters, managers and mechanics. There was an almost 35% reduction in the frequency of crashes for trained compared to untrained drivers. Promotional material for the National Safety Council Defensive Driver Courses cites accident reductions of between 50% and 65% by particular companies (National Safety Council, 1999). The promotional material cites a study conducted by the University of Illinois-Chicago Urban Transportation Center that evaluated the traffic safety attitudes of drivers ticketed for minor traffic violations in Cook County, Illinois. The study found that Defensive Driver Course students showed a marked improvement in driver attitudes about traffic safety and this improvement was evident across sex, age and ethnicity. A1.9.2 MMI Driver Safety Program The director of the MMI driver safety program in New Zealand, Adrian Roberts has outlined this program and some of its advantages in terms of fleet safety (Law, 1997b): • Ensure you see the licences of everyone with a company car. Sometimes people have the
wrong licence. This may have safety implications as well as insurance problems in case of an accident.
• The program is made up of many components for the many parts of a business (for example, for managers) as well as being tailored to the needs of particular companies.
• A risk management program is set up with the aim of creating a safety culture within the company. Disciplinary action when procedures are not followed (including dismissal) are part of this. Changing the attitudes of the drivers is seen a major way of increasing safety.
• The program defines work practices, attitudes and philosophies. Lay down the company procedures to the drivers.
Roberts says that programs such as these that have been running in countries other than New Zealand have resulted in over 30% cost reduction for companies, and a reduction in risk per kilometre of up to 42%. A1.9.3 AMP The US electrical company, AMP has 1,300 corporate drivers. This company designed a safety program that was expected to reduce crashes substantially (Minahan, 1997). The program is as follows. Drivers with bad driving records are not hired. All drivers are required to complete two video driving courses. Through their careers, their driving records are followed. There is a Driver Profile system in place, which assigns points for unsafe driving. Drivers with one to four points (ONE) are issued a friendly reminder that AMP’s goal is for
BEST PRACTICE IN FLEET AND CORPORATE ROAD SAFETY 95
all drivers to have no points. Drivers with five to ten points (TWO) are supplied with a written warning and are required to take a driver training course, payed for by AMP. Drivers with 11 or more points (THREE) are at risk of losing their vehicle and are required to enrol in an advanced driving course at their own cost. Drivers that reach THREE more than once are at risk of losing their job. AMP gives credit for safe driving by reducing a drivers points. Credit is also given for completing additional safe driving courses. These courses also count toward career training that AMP requires of all staff each year. Another strategy used by AMP is to put drivers through an advanced driving program. Programs can range from distributing brochures to audio and video tapes on safe driving technique to hands-on lessons. Finally, driving records are a criteria in employee performance reviews, and are sometimes taken into account when bonuses are distributed. A1.9.4 American International Group Inc. American International Group Inc. (AIG) has created a successful auto fleet risk control program (Lenckus, 1999). AIG has a fleet of about 1,300 vehicles. Many departments within AIG together formed a committee to design the program. They were the fleet administration, loss prevention engineering, corporate risk, human resources and legal departments of the company. The committee took five steps to improve safety: 1. A check was done on drivers’ licences. Those with a number of moving violations had
access to fleet cars removed. 2. A standardised internal driver training program was implemented. 3. A section in the general manual about personal use of fleet cars was revised to state more
clearly AIG’s position. 4. Standardised accident reporting procedures were put into place. 5. Those who had an accident in a company car while not adhering to company procedures
were charged $300 in damage costs. A1.9.5 Tokyo Electric Power Tokyo Electric Power is a large electric company in Japan with an excellent safety record (Motor fleet management at an enterprise, 1990). The company fleet consists of approximately 8,000 four wheeled vehicles and 400 two wheeled vehicles. The average distance covered over one year is 57 million kilometres. General safety is part of the company culture. Management takes it as their responsibility, and takes it seriously. The company philosophy focuses on prevention being better than cure and safety measures are adapted to the local environment. At each branch office, there is an officer in charge of safety, a safe driving manager, an assistant safe driving manager and a vehicles maintenance manager who are appointed in accordance with the Road Traffic Acts of Japan. There is also a vehicle operations manager who is responsible for day to day driving. The company examined the trends of road accidents that had occurred within the previous three years, and then developed countermeasures to combat the problems. They found that:
96 MONASH UNIVERSITY ACCIDENT RESEARCH CENTRE
• 47% of crashes had a driver aged 25 years or less, • the main causes of crashes were mainly a failure to look both ways and a failure to slow
down • 76% of crashes occurred at or around intersections. There is now an emphasis on training young employees, and an emphasis on the areas of safety listed above. Within Tokyo Electric Power there is a company authorised driver licensing system that has been in place since 1965. This sets the criteria that drivers must reach in terms of driving skill and manners. There is a standard procedure that is adapted for the different offices. This comprises training and a test. Those who fail are given additional training. Once passed, a certificate is given. Those who are authorised to drive company vehicles are given a psychological aptitude examination, a functional examination for driving vehicles and a visual examination. Safety guidance is given on the basis of the results of these tests. This is providing individual guidance to all employees based on their individual personality, which will improve their safety. These are given regularly every few years. Each driver possess a personalised handbook that contains their driving record (qualifications, any training, how many hours they have been driving etc) and they have to fill it out every day. They must record their health, how much sleep they have had, and how much driving they did the previous day. This has to be approved by a supervisor, who may give advice depending on what they find. Each vehicle is fitted with a tachometer and speed alarm to monitor the drivers. Offices and drivers with no accidents are commended for their record regularly. Sometimes prizes are given for outstanding performance. Traffic safety campaigns are conducted by the company at the same time as national traffic safety programs are conducted, as well as at other times. Activities are tailored to each office, and are designed in conjunction with the local community. Safety campaigns have included training to foresee traffic dangers, case studies of previous crashes, emphasis on seatbelt wearing and anticipating the behaviours of pedestrians. All crashes are reported and studied by management in order to prevent similar accidents from occurring. There is a database of all crashes. Training is tailored to the accidents that occur. For example, drivers are trained to look out for bicycles when making a left turn at urban intersections and drivers are taught how to drive in icy conditions. Near misses are used as formal learning experiences. They are reported monthly and discussed biannually. Information about crashes in which a vehicle is damaged is sent to each office regularly so that they can learn from it. There have been no deaths from accidents reported since 1983. According to the records, about 100 people a year were reported as either being injured or dying in traffic accidents in the 1960s, about 50 in the early 1970s, and about 10 a year in the last few years.
BEST PRACTICE IN FLEET AND CORPORATE ROAD SAFETY 97
A1.9.6 Janssen Pharmaceuticals Janssen Pharmaceuticals, a company that employs many young and inexperienced drivers, undertook a road safety program in 1984 (Gray, 1990). It comprised a variety of strategies: • driver training • incentives • safety equipment checks • educational material. Driver training. Employees experienced a progression of training. As part of the initial training course there was a seminar on defensive driving and a practical driving session with an expert driver from the British School of Motoring Health and Safety. At 2 year intervals, driving practicals were repeated. For those drivers who appeared to be problem drivers or for accident repeaters there was an additional driving practical four to six months after the initial training course. In addition, managers could request extra training sessions for specific employees. Managers had responsibility for training their teams and manager workshops contained road safety training which covered all aspects of the company’s safe driving campaign. Incentives. One year of accident-free driving awarded a driver a tie or silk scarf, three years awarded a rally jacket and five years awarded an engraved rose bowl. In addition, after five years of accident-free driving, drivers could upgrade their company car. Safety equipment and checks. Where offered as an optional extra, cars were fitted with ABS brakes and zero ice detectors were fitted routinely. In 1984 the company was considering incorporating a number of four-wheel drives into the fleet as well as offering Associated Tyre Services’ ‘FLATMATE’ service. This would deal with coping with fires and would encourage drivers to check their tyre pressure regularly. Publications from the motor industry and those about safety issues were regularly checked for information about incentives that could be incorporated. Random spot checks were carried out by consulting engineers at times when it was known that a few cars would be in the same area. Consulting engineers also checked cars after crash repairs to ensure that the vehicle had been repaired to safety standards. Educational programs. Accident statistics were distributed to managers. Circulars about appropriate topics were distributed to all company car drivers. A small item on car or driver safety appeared weekly in the company newsletter and a larger article appeared in the quarterly publication. In addition, information on programs created by Police were distributed. The aim of distributing information was to keep incentive and awareness high. The accident rate for company car drivers decreased from 64% in 1983 to 35% in 1989.
98 MONASH UNIVERSITY ACCIDENT RESEARCH CENTRE
A1.9.7 BHP Iron Ore BHP Iron Ore set out to improve their road safety record after the company experienced a number of serious road crashes, including a fatality (The Government of Western Australia and the Road Safety Council, undated). The BHP Iron Ore Safety Challenge aimed to • reduce the number of vehicle crashes, • improve the level of medical treatment available if a crash did occur, • increase the skill level and practical experience of employees and contractors. Over a two year period, BHP addressed the following issues: • speeding, • inexperience, • fatigue, • poorly equipped vehicles, • alcohol and drugs. A Driver Training Program was introduced. This involved targeting the type of driving skill every driver required and employees were banned from driving company vehicles until they reached the required level of competency. The fleet itself was overhauled, new safety equipment was installed and weekly vehicle inspections were carried out. Extensive education campaigns, a scheme to detect alcohol and drugs in the workplace, new signs and warning lights at major intersections and a campaign of reducing exposure to at-risk driving were introduced. The road safety record at BHP improved as a result of these initiatives. The BHP program was a winner in the 1997 Western Australian Best Practice Road Safety Awards. A1.9.8 Finemores Transport Kim Flanagan, the national health, safety and environment manager for Finemores, has identified six principles of effective fleet management that he believes can help to control accident costs (Anonymous, 1998). The principles are: • committed management and administration, • assignment of accountability and responsibility, • objective accident reporting and investigation, • meaningful driver selection and training, • cost-effective vehicle maintenance, and • ongoing safety and loss control awareness promotion. In a speech at the Effective Fleet Management conference, he emphasised that good safety equates with good business. He believes that educating staff, especially management, is an important consideration in maintaining a safe fleet. Positive safety attitudes held by
BEST PRACTICE IN FLEET AND CORPORATE ROAD SAFETY 99
management will create an ingrained culture of safety and will set the standard. In addition, it is a legal obligation for employers to ensure the health and safety of employees. A1.9.9 Local government FleetSafe Project The FleetSafe Project has developed a policy and procedures to improve fleet safety in 12 Councils in southern Sydney. These Councils have a combined fleet of about 2,720 light and heavy vehicles. The FleetSafe Project was coordinated by the Southern Sydney Regional Organisation of Councils (SSROC). Funding for the project was provided by the Roads and Traffic Authority of NSW. The motivation for the initiative was that the 12 Councils had an annual accident rate of about 50%, which is approximately double the average for fleets. This corresponded to a $1.2 million annual repair bill and annual insurance premiums of approximately $900,000. The Fleetsafe policies and procedures were developed by a team from all of the Councils which covered a range of disciplines involved in Council fleet management including risk management, occupational health and road safety. The development involved two groups: a Steering Group at the Director level and a Working Group at the operational level. A government and industry forum was conducted to assist with project benchmarking and networking. Development also involved focus groups of drivers (including a wide range of work categories). The Fleetsafe Project was the joint winner of the 1999 Local Government Excellence in Road Safety Awards. The Project was described by the judges as a sustainable model with statewide applications in both government and industry. The FleetSafe program is divided into three sections: • Model FleetSafe Policy - This is a general model that Councils can incorporate with minor
individual changes. • Recommended Guidelines - A detailed set of best practice procedures. • Implementing and Maintaining the FleetSafe Program - A guide to successful
implementation. The Model FleetSafe Policy The Policy defines vehicles as workplaces for the purposes of Occupational Health and Safety policy as many staff are required to drive them in the course of their work. This document urges Councils to take responsibility for vehicle safety within their organisations, rather than leaving it up to external organisations such as government agencies. The policy comprises the following components: - Accountability. An increased emphasis on accountability is to be put onto drivers,
supervisors and managers. This involves implementing measures, such as ‘A senior manager will be made responsible for obtaining continuous improvement in fleet safety by leading and coordinating the work of all relevant departments and work areas.’ There is a list of such measures to be implemented.
100 MONASH UNIVERSITY ACCIDENT RESEARCH CENTRE
- Occupational health and safety. Councils must take responsibility for their employees. The policy involves making sure OH&S Acts are implemented properly, including responsibility for contractors.
- Safer drivers. This involves ensuring drivers are qualified, improving driver attitudes and
behaviours, imposing sanctions on misdemeanours and ensuring a safe environment for driving. Management needs to support these initiatives.
- Safer vehicles. The safest vehicles should be purchased within budget limitations. Drivers
should have some input into vehicle selection. Managers should ensure that vehicles are maintained to optimum safety standards, and should encourage a culture of care.
- Evaluation. Evaluation should be continuous. It should ensure that initiatives are having
their desired effects and that appropriate action is taken to rectify unsatisfactory trends. A number of measures can be taken to ensure this occurs, such as collecting data and establishing an accident review committee.
Recommended Guidelines These guidelines represent best practice according to the knowledge of the SSROC members and expert staff. They represent the practical implementation of the policy and can be modified somewhat by individual Councils. Guidelines exist under the following categories: Management and staff responsibility Accountability Occupational health and safety Responsibility for the ‘driving’ component of employees work Vehicle costs and care Driver attitudes and behaviour Designated driver Employment of contractors FleetSafe working group Occupational Health and Safety Managers’ responsibilities Employees’ responsibilities Employers’, employees’ and others’ (including visitors’ and others’)
responsibilities Evaluation and Review Data collecting and reporting Performance indicators Benchmarking Accident and infringement recording and investigation Safer drivers Responsibilities Recruitment Regular or occasional drivers Interview and selection criteria
BEST PRACTICE IN FLEET AND CORPORATE ROAD SAFETY 101
Competency assessment Authority to drive Re-validation of drivers authorisation Probationary employment Compliance Driver safety education and training Training
Accredited trainers Continuation training Additional training Refresher training Range of strategies to educate employees Driver safety improvement team (DSIT)
Motivation General motivation Incentives Disincentives Engineering Vehicle selection and purchasing Safety is critical Selection committee Safety features Vehicle operation Vehicles as workplaces Responsibility for vehicles Vehicle usage register Pool vehicles Vehicle maintenance Vehicle presentation Breakdown procedures Vehicle accidents Medical kits Implementing and maintaining the FleetSafe Program It is hoped that by the end of 2001, all Councils that follow the FleetSafe Program will have improved fleet safety records. The SSROC is setting up a FleetSafe Steering Group to assist Councils to implement FleetSafe effectively. The SSROC also has a number of other strategies to assist Councils, such as procuring government funding to produce educational material and approaching insurance companies to assist with safe driving initiatives. The document also sets out Council responsibilities for ensuring successful implementation of FleetSafe. These are: High priority: Council resolution Business plan Budget
102 MONASH UNIVERSITY ACCIDENT RESEARCH CENTRE
Senior manager for FleetSafe New FleetSafe Working Group Accident data submitted Major FleetSafe publicity campaign Accident Data Report evaluated Financial reporting models Intranet and e-mail possibilities Budget returns for savings Medium and low priority: Accident Management Companies Improve facilities for vehicle driver maintenance Engine monitoring devices Relevance of ‘private’ driving performance
BEST PRACTICE IN FLEET AND CORPORATE ROAD SAFETY 103
APPENDIX 2: POLICY FOR PURCHASE AND USE OF VEHICLES AT MUARC AND BACKGROUND DOCUMENT
Policy for purchase and use of vehicles at MUARC MUARC is a world-leading centre in injury prevention in most areas which potentially produce harm to the human. Traffic safety research, as well as research in occupational health and safety, are areas where MUARC has a long tradition of innovative and significant contributions. There are numerous examples where findings and recommendations from MUARC have been translated into action in society. Where possible, it seems natural that such findings and recommendations should be used internally at MUARC. The future as well as the past success of MUARC is dependent on its staff. It is fundamental that MUARC care for the safety and well-being of its staff. In the past, there have been several examples of events where MUARC staff have been injured, or nearly injured. Since mid-1998, four events in road traffic have been serious enough to either cause injuries, or possibly could have led to injuries. It is also of importance that MUARC is seen as a good citizen, behaving in a way that is acceptable in terms of using resources and not causing potential harm to society and its citizens. This relates both to potential accidental harm as well as the impact on the environment. Traffic and transport are major contributors to injuries and fatalities in society, as well as being contributors to the environmental problems of modern society. Both the design and the use of the road transport system are fundamental in developing a safe and environmentally sustainable system. MUARC, given its role in the society, should contribute to this development in its own use of the road transport system, as well as in its care for all the employees at the centre. MUARC should also do its best to fulfil the OHS acts and regulations. MUARC should also set an example to the rest of society, where appropriate, and encourage all partners to follow this example, thus stimulating technological development and the market for safety. A policy for vehicle purchase and how these vehicles should be used in order to maximise safety and minimise environmental impact, at lowest possible cost and without causing negative impact on the effective operations of the Centre, is therefore natural. The policy should build on current knowledge and should be reviewed at least once per year, given the rapid development of knowledge and technology.
104 MONASH UNIVERSITY ACCIDENT RESEARCH CENTRE
The status of the MUARC car fleet should be included in the Annual Report, together with the total and average fuel consumption as performance indicators for a non-aggressive and environmentally friendly driving style. Basic requirements for MUARC car (purchased or rented): Safety Mandatory requirements, passive safety • Highest possible score in consumer tests like NCAP (or similar) and, if available, high
rank in statistical safety rating. If there is a disagreement between results from crash test based rating and real life statistical rating, good real life statistical accident rating is preferred.
• Dual front airbags • Side airbags, at least in the front seat, including head protection (separate or integrated) • Three point seat belts at all positions, at least in the front seat with pretensioners. • Head restraint for all positions, possible to adjust (or fixed) to an appropriate position. (At
least for four positions). • Curb weight 1300-1700 kg, not sports utility vehicle, van or off-road vehicle • If the car is a station wagon, or hatchback, there should be a cargo barrier installed. Highly desired, passive safety (to be mandatory requirements later) • Anti whiplash system, at least in the front seat, proposal in IRCOBI-99 could be used
(Hell, et.al.) • Load limiters for seat belts • Seat belt reminder system • Well proven good pedestrian protection, according to NCAP or proposed European
regulation. Mandatory, active safety • ABS • Speed alert system Highly desired, active safety (to be mandatory requirements later) • Intelligent speed alert system • Alcohol interlock • Automatic head-lamps Environment • Most fuel-efficient engine option (normally smallest engine) for the vehicle chosen. • Fuel consumption maximum below the Australian average target for new cars, currently
approx. 10 l/100 km (AS 2877/1986/55/45). When a national target is set, MUARC vehicles should be below the target.
• Fuel consumption monitoring device (trip computer) Economy • Base price (list price except on road cost) max $40,000 AUD • Good trade-in value • Low maintenance costs
Use of vehicle It is important that MUARC staff members using Centre vehicles, rental cars, or their own car, do not exceed speed limits and comply with road traffic laws in general. It is even more important that we drive at speeds that are safe for the conditions, recognising that such speed
BEST PRACTICE IN FLEET AND CORPORATE ROAD SAFETY 105
will often be below the posted speed limit. Our driving and, in particular, our choice of speed, must acknowledge the inherent vulnerability in a collision of people walking and cycling. A low fuel consumption is generally a sign of a non-aggressive driving style. Whilst this is currently the only way to monitor our own behaviour, fuel consumption will be used as an indicator for careful and environmentally friendly driving. Average fuel consumption should be fed back for every Centre car on a monthly basis. MUARC will gradually purchase vehicles with features that promote safer driving, such as Intelligent Speed Adaptation, Alcohol Interlock, seat belt reminder systems and automatic daytime running lights. While there is a legal limit of maximum 0.05% BAC for fully licensed drivers, even lower levels have been found to influence driving. It is therefore important that MUARC staff have a restrictive alcohol policy before driving. There should be no driving under the influence of medications or other drugs likely to affect alertness or driving. Driving when fatigued can be as dangerous as driving drunk. Drivers and their supervisors should plan realistic schedules, be rested before departure, stop for appropriate rest breaks (every two hours, even if not feeling tired) and avoid driving during normal sleeping hours. A general rule is that driving occurring more than 16 hours since the previous night of sleep is equivalent to driving with a BAC of over .05. Therefore this practice should not occur. Driving back from the airport after a day trip interstate may not be wise for this reason. Consider alternatives, such as a taxi. Use of mobile phones when driving has been found to be associated with increased crash risk. Hands-free phones are better, but not ideal. Minimise the use of mobile phones while driving. Centre vehicles should be driven with daytime running lights (or dipped head lamps). Cars belonging to staff members may be used. If this is on a regular basis, such cars should have a driver side airbag, and must be at least a mid-sized car. An employee at MUARC has always the right to rent a car for safety reasons, rather than using their own, less safe car. Rental cars should, in principle, be of at least the same standard as Centre cars. MUARC should gradually ensure that rental car companies are prepared to supply such vehicles to MUARC staff, by distributing the requirements. Similarly, the Centre will attempt to determine which taxi company offers the safest service and, where possible, give preference to that company.

106 MONASH UNIVERSITY ACCIDENT RESEARCH CENTRE
BEST PRACTICE IN FLEET AND CORPORATE ROAD SAFETY 107
BACKGROUND INFORMATION FOR THE MUARC FLEET SAFETY POLICY
Compiled by Naomi Kowadlo,
with contributions from MUARC staff.
November 1999
The Monash University Accident Research Centre (MUARC) is adopting various measures for a fleet safety policy. These measures have previously been found to be effective in improving road safety. Alcohol Consuming alcohol, or alcohol in conjunction with other drugs, is known to increase the risk of accident. Haworth and Vulcan (1997) conducted a study of Victorian drivers within a 200km radius of Melbourne who died in single vehicle collisions and compared them with a control sample. Where the BACs of crashed drivers was known, 40% showed a BAC over 0.05% compared with 0.5% of control drivers. In addition, 16% of crashed drivers were found to have consumed both cannabis and alcohol whereas none of the control drivers were found to have consumed both. Studies have found that consuming moderate amounts of alcohol can also impact on skills necessary for driving. Dawson and Reid (1997) administered 10-15 grams of vodka at 30 minute intervals until participants reached a BAC of 0.10%. Participants were required to complete a hand-eye coordination tracking task also at 30 minute intervals. Results demonstrated that for each 0.01% increase in BAC, performance on this task decreased on average by 1.16%. Lenné, Triggs and Redman (1998) examined the effects of moderate consumption of alcohol on driving performance in a simulator. Driving performance was measured by lateral deviation of the simulator car. Lateral deviation was found to be significantly higher (p<0.05) for those with peak BACs of between 0.036% and 0.048% compared to the same participants at times when they had not consumed any alcohol. Fatigue Driving when fatigued significantly increases accident risk (eg. Lenné et al., 1998). This increase in risk may be through fatigue reducing driving skill, or it may be due to drivers falling asleep at the wheel and subsequently loosing control of the vehicle. A number of studies investigating fatigue in road safety have found that it plays a significant role in accident occurrence.
108 MONASH UNIVERSITY ACCIDENT RESEARCH CENTRE
Dawson and Reid (1997) conducted a laboratory study to measure cognitive psychomotor performance using a hand-eye coordination task. It was found that moderate levels of fatigue produced higher levels of impairment than the proscribed level of alcohol intoxication. In a separate laboratory study in which subjects were required to drive a driving simulator, 24 to 36 hours of sleep loss was found to produce greater impairments to driving skill than alcohol at around 0.04% BAC, depending on the time of day (Lenné et al., 1998). A study of crashes in which it was believed the driver fell asleep at the wheel was conducted by Horne and Reyner (1995). It was found that 16% of crashes to which police were summoned on major roads in Southwest England and 20% of those on midland motorways, were sleep related. There were peaks in accident incidence at 0200, 0600 and 1600. Speeding In Victoria, speeding is a factor in almost 20% of all fatal crashes and in almost one third of single-vehicle crashes (VicRoads, Victoria Police, Transport Accident Commission, 1995). Current research suggests that as speed increases (and the road environment remains the same): • the possibility for road users to communicate and perceive the intentions of other road
users in time to react appropriately decreases, as does the ability to detect hazards, • stopping distances increase and other manoeuvres to avoid accidents become more
difficult, and • the severity of outcome of an impact increases. The overall effect of reducing or increasing mean travel speed (in particular) has been studied in many parts of the world. There are also numerous studies of the relationship between velocity at impact and risk of injury in car crashes, based on physical laws as well as empirical studies. Such studies show increased number and severity of injuries with increased impact speed. Furthermore, there are several studies showing the correlation between speed at impact and injury severity for pedestrians. The road trauma outcome of a change in mean travel speed can be described with power functions, with the power increasing with crash severity. The power function for fatalities appears to be around four. This means that a 10% reduction of mean speed results in a reduction of the number of fatalities of approximately 36%. Figure 1 shows the predicted outcome of a change in mean speed on the number of injury accidents, severe injuries and fatal injuries. The results are based on Swedish studies (Carlsson). Results from the US (Finch, 1994) have shown that an increase in mean speed of 3-6 km/h results in an increase of the number of fatalities of 19-34%.
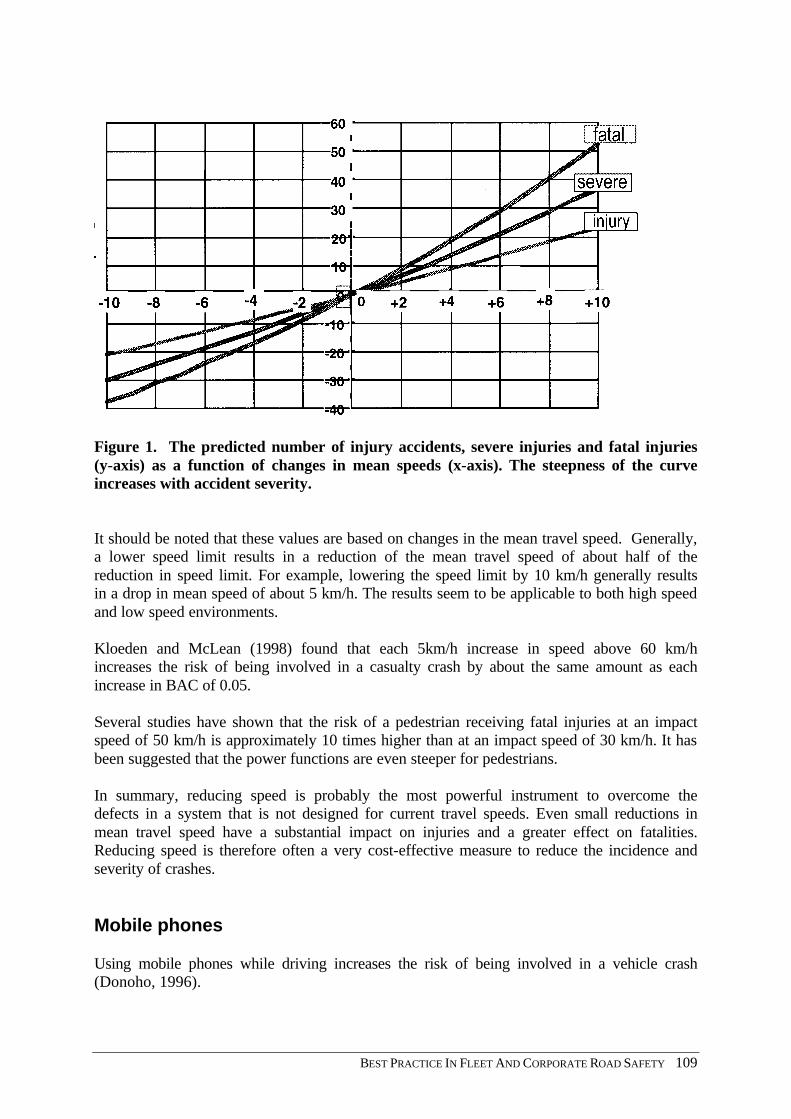
BEST PRACTICE IN FLEET AND CORPORATE ROAD SAFETY 109
Figure 1. The predicted number of injury accidents, severe injuries and fatal injuries (y-axis) as a function of changes in mean speeds (x-axis). The steepness of the curve increases with accident severity. It should be noted that these values are based on changes in the mean travel speed. Generally, a lower speed limit results in a reduction of the mean travel speed of about half of the reduction in speed limit. For example, lowering the speed limit by 10 km/h generally results in a drop in mean speed of about 5 km/h. The results seem to be applicable to both high speed and low speed environments. Kloeden and McLean (1998) found that each 5km/h increase in speed above 60 km/h increases the risk of being involved in a casualty crash by about the same amount as each increase in BAC of 0.05. Several studies have shown that the risk of a pedestrian receiving fatal injuries at an impact speed of 50 km/h is approximately 10 times higher than at an impact speed of 30 km/h. It has been suggested that the power functions are even steeper for pedestrians. In summary, reducing speed is probably the most powerful instrument to overcome the defects in a system that is not designed for current travel speeds. Even small reductions in mean travel speed have a substantial impact on injuries and a greater effect on fatalities. Reducing speed is therefore often a very cost-effective measure to reduce the incidence and severity of crashes. Mobile phones Using mobile phones while driving increases the risk of being involved in a vehicle crash (Donoho, 1996).
110 MONASH UNIVERSITY ACCIDENT RESEARCH CENTRE
A study using an epidemiological case-control design found that talking on mobile phones in the car for more than 50 minutes a month was associated with a 5.59-fold increased risk of being involved in a crash (Violanti and Marshall, 1996). A separate study performed by the University of Toronto (cited in Anonymous, 1997a) indicates that talking on a mobile phone while driving quadruples the risk of having a crash. This is the same risk as driving with a BAC at the legal limit. The study also indicates that hands-free devices offer no advantage over traditional hand-held devices. Vehicle design A report on the crashworthiness of a number of makes and models of Australian cars reveals that, after taking a number of assumptions into account, different cars do vary in their crashworthiness (Newstead, Cameron and Le, 1999). One feature that impacts on the crashworthiness of a vehicle is its weight. This has a number of implications for the occupant safety of that vehicle as well as for the occupant safety of other vehicles on the road (Fildes, Lee and Lane, 1993). Weight is primarily important in relation to collisions involving more than one vehicle. In single vehicle collisions, weight is inherently, but not causally, related to the safety of the vehicle. Thus, if a single vehicle collides against a fixed object, the weight of that vehicle has no bearing on occupant protection. Larger vehicles, which are often heavier, would normally offer greater occupant protection. In collisions involving more than one vehicle, the difference in mass between the vehicles plays an important role. In a collision involving a heavy car and a light car, the heavy car will undergo a lesser change of velocity, decreasing the risk of injury, while the lighter car will experience a greater change in velocity, increasing the risk of injury to occupants in that car. In a frontal collision, a 100 kg difference will increase injury risk by 5-10 % in the lighter vehicle, and reduce injury risk by the same amount in the heavier vehicle (Buzemann, 1997). In side impacts the result is more complex, but in rear impacts the same tendency exists (Krafft, 1998). The safest scenario is one in which all vehicles on the road have close to equal weight. It has been suggested that variation of weights should be kept to plus or minus 200 kg from the average weight of the vehicle population (Buzeman, 1997). Thus, it is important to choose vehicles that have a weight close to the average weight of the vehicle population in order to offer protection to both occupants of individual vehicles as well as to occupants of other cars on the road. While there is much evidence demonstrating the large differences in crash protection depending on the design of the car (eg. Krafft, Kullgren, Lie and Tingvall, 1998), accident avoidance has not been studied very extensively. The likely benefits of choosing safer cars are therefore based on crashworthiness ratings, although there may be substantial benefits from some of the technology related to driving behaviour or vehicle defects. For instance, Intelligent Speed Adaptation Systems (ISA) and alcohol interlocks have been mentioned as items that have the potential for substantial safety benefits. However, these have not been described in as much detail as better occupant protection.
BEST PRACTICE IN FLEET AND CORPORATE ROAD SAFETY 111
Newer cars offer greater levels of occupant protection than do older cars, including protection from skull and brain injuries (Krafft et al., 1998; Larsson, Lie, Tingvall, Krafft and Kullgren, 1996). Over the whole spectrum of cars, there is a 1:5 ratio between the best and worst cars in terms of occupant protection. If taking size (or rather weight) into account, the ratios are in the order of 1:2.5 between best and worst cars. In Sweden, it has been shown that the best available car model is 60% better than the average car in the general car population and at least 30% better than the average new car of the same size. The potential safety gains in choosing the best car are therefore substantial. There are two main methods to determine the differences in crashworthiness of vehicles: crash tests or statistical analysis of crashes. While crash tests can be performed on vehicles that have just been launched on the market, there is a substantial delay in feedback from the field data. There have been efforts to link pre-ratings of cars using crash tests and technical inspections of cars, to field experiences, but such models are still not generally used. The best way to demonstrate the potential of choosing the best possible car is to study the experience rating schemes available. Folksam in Sweden, MUARC in Australia and DETV in the UK all publish results for individual makes and models. There is enough evidence to show that cars that score well in crash tests also perform well in real life accidents (Newstead and Cameron, 1999). Daytime Running Lights (DRLs) Daytime Running Lights (DRLs) are weak headlights that are illuminated during the day in order to make vehicles more conspicuous and thus reduce their crash risk. In some countries it is possible to fit vehicles with a device that will automatically activate DRLs when the ignition is switched on, but will be overridden by the full strength headlights. A large study into the effectiveness of DRLs on road safety is being conducted by SWOV in the Netherlands (Koornstra, 1998). Initial evidence from this study indicates that the ability of drivers to see other cars on the road during normal daylight conditions is not as effective as expected. Previous in-depth accident studies have found that 50% of daytime accidents are the result of one driver failing to see another vehicle. For accidents at intersections, this figure increases to 80%. DRLs have been found to influence the timely peripheral perception of vehicles making conflicting movements. Also, cars with DRLs are better identified as cars and their distances are estimated more safely. These results are especially relevant to conditions of ambient lighting.
Kornsta’s (1998) study has found that DRLs have a statistically significant effect on reducing accidents and injuries. This effect changes over different latitudes, as the natural light in different countries has different qualities. There is lower ambient illumination at higher latitudes. In addition, it has been found that in collisions where one or more cars are fitted with DRLs, the cars were travelling at lower speeds. According to Koornstra (1998), an estimation of the effect of full DRL usage in the EU is that it would prevent; - 24.6% of fatalities in multiple daytime accidents, - 20.0% of casualties in multiple daytime accidents, and
112 MONASH UNIVERSITY ACCIDENT RESEARCH CENTRE
- 12.4% of multiple daytime accidents. This would give a total annual saving of 4.78 billion ECU. The cost of implementation, including fuel costs, car costs, bulb costs and environmental costs would still yield a beneficial cost ratio of 1.80. It is recommended that DRL should be implemented as an automatic in-vehicle system rather than an intervention that would require behavioural change by motorists (Koornstra, 1998). In a review of a number of studies from Scandinavia, Canada and the USA on the effectiveness of DRLs, the Insurance Institute for Highway Safety (1999) has cited that DRLs reduce daytime crashes from 6% to 37% for left hand turns (the equivalent of right hand turns in Australia).
Based on latitude, Koornstra (1998) has predicted that DRLs in Victoria would reduce casualties by around 16%.
Seatbelts Seatbelts have been extremely effective in reducing injuries to car occupants in the event of a collision. Numerous studies have demonstrated the effectiveness of seatbelts in saving lives and preventing serious injury in the event of a crash. There is evidence that they may even reduce occupant fatalities by up to 50% (Evans, 1989; Nygren, 1984). There is the possibility that intense contact with seatbelt hardware during a crash may injure occupants. However, new seatbelt designs may reduce the likelihood of sustaining seatbelt injuries (Fildes, Lane, Lenard and Vulcan, 1991, 1994). These features include: - a closer coupling of the occupant to the seat through pre-tensioning devices and webbing
clamps, - seat backs manufactured in a more sculptured design, - total seat belt extension should be reduced, - belt geometry needs improving to reduce submarining and other injuries, - attaching belt anchorage points to the seat, - D-ring adjustment, - load limiter. These changes may result in fewer chest and neck injuries through violent contact with the seatbelt itself. In addition, these changes may result in reduced head and face injuries due to reduced number and intensity of impacts of the head with interior components of the car. More than 20% of car occupants killed in Victoria were not wearing seatbelts. Therefore reminder systems may be useful. ABS Anti-lock brakes (ABS), are designed to improve the manoeuvrability of a vehicle when braking. They are believed to be beneficial in preventing accidents through improved braking and thus avoiding an accident.
BEST PRACTICE IN FLEET AND CORPORATE ROAD SAFETY 113
Kullgren, Lie and Tingvall (1994) conducted a real-life study examining accidents that to some extent involved the braking system. Cars with and without ABS, but otherwise identical, that had been involved in accidents, were compared on a number of crash characteristics. It was found that overall, cars with ABS were significantly less likely to be involved in a rear impact collision. On dry roads, there was no difference between cars with and without ABS in terms of accident incidence. However, on icy surfaces, cars with ABS were less likely to hit another car, but were more likely to be hit than a car without ABS. No statistically significant difference was found for injury risk between the two populations. In addition, no statistically significant difference was found for the severity of crashes caused by cars with and without ABS. Thus, overall, the effect of ABS on improving road safety was found to be significant only on icy roads and primarily in relation to rear impact collisions. Other studies have shown similar results, also relating to wet surfaces. Evans and Gerrish (1995) also found that overall, ABS reduces the risk of having a two-vehicle crash. When driving on dry roads there is little difference in crash risk between a car with ABS and one without. When driving on wet roads, however, a car with ABS is less likely to crash into a vehicle in front of it, but more likely to be hit by a car travelling behind, than a car without ABS. Evans and Gerrish (1995) suggest that drivers with ABS take larger risks when driving. These risks include shorter headways and higher speeds. Airbags In a large study by Fildes et al. (1991) recommendations were put forward for countermeasures to protect front seat occupants involved in frontal collisions, the most common type of collision. Airbags were recommended as a useful countermeasure to reduce injury in case of a frontal collision as a supplement to 3-point seat belt protection. Airbags would help to reduce contact with the steering wheel and dashboard, cushion these impacts and help to reduce seat belt loadings. Zador and Ciccone (1991, cited in Evans and Frick, 1992) found that airbags reduce fatalities by 21% for unbelted drivers and by 9% for belted drivers. In addition, airbags were found to be more effective in larger cars than in smaller cars. Airbags reduce driver fatalities by 9% if the wheelbase length of the car is less than 100 inches, by 13% if the wheelbase length is between 100 and 109 inches and by 36% if it is more than 110 inches. For side impact collisions, which are often extremely severe, side airbags have the potential to make significant improvements to occupant protection for both front and back seat occupants. They have particular usefulness if they can provide both chest and head protection (Fildes et al., 1994). Side door airbags have been fitted to BMW production cars over the past few years (McLean, Fildes, Kloeden, Digges, Anderson, Moore and Simpson, 1997). Recently some models of the locally produced VT Commodore have been fitted with side airbags that inflate from the side of the seat. This placement of the airbag means they are automatically adjusted for the position of the occupant. In addition, they expand upwards which gives some head protection to the occupant (Newstead, 1999).
114 MONASH UNIVERSITY ACCIDENT RESEARCH CENTRE
The benefit of full size airbags over facebags, even when seatbelt wearing rates are high, has been demonstrated (Fildes, Cameron, Vulcan, Digges and Taylor, 1992). In addition, in conjunction with seatbelt webbing clamps, airbags have been shown to reduce injury generally as well as seatbelt injury, in a crash (Fildes, Deery and Vulcan, 1997). They may be reducing seatbelt injury by spreading the deceleration load on the torso and improving occupant kinetics at the time of the crash. Those in cars fitted with airbags, however, experienced a higher rate of slight shoulder injuries. Airbags have sometimes been found to result in adverse effects due to severe impact with the airbag by an occupant. These results are primarily gleaned from crashes where occupants were not wearing seatbelts, but airbags have been known to cause injury to belted occupants also (NHTSA, 1999). When comparing American studies with Australian studies, it is useful to note that American airbags differ from Australian airbags in a number of fundamental ways. In the USA, airbags are designed as primary restraint systems to protect unbelted car occupants, whereas in Australia, airbags are designed to protect belted occupants. There are therefore differences in deployment thresholds as well as the power and velocity of deployment. US car occupants suffer more injuries to the face, thorax and upper extremities as a result of airbag contact than Australian occupants (McKay, Fitzharris and Fildes, 1999). Vehicle Design and Pedestrian Protection At present in Australia, and indeed worldwide, vehicle manufacturers do not have to conform to design legislation for pedestrian protection but it is anticipated that this will change over the next 3 or 4 years. In Europe, consumer tests (known as the New Car Assessment Programme, or NCAP tests) are carried out on new vehicles. These tests assess their performance in terms of both occupant protection in front and side impacts as well as pedestrian protection. Whilst vehicles do not need to pass these tests, there is some marketing advantage if they perform well. Therefore the vehicle manufacturers strive to design for good performance at least in terms of occupant protection. However, they are marginally less concerned about vehicle performance in relation to the pedestrian as the marketing advantages are not so great. As a consequence, all vehicles perform disappointingly on the pedestrian test. Whilst Australia has its own NCAP tests, pedestrian protection is not currently incorporated in the program but this will change over the next year when Australia conforms with the European NCAP. The European NCAP pedestrian tests are thought to be forerunners of legislation, which will enforce manufacturers to design better pedestrian protection. It is predicted that this can be achieved for pedestrian impacts up to 50km/h. As pedestrian kinematics can be fairly well predicted (e.g. McClean, 1998), it is possible to predict pedestrian contact points on the vehicle and optimise these areas for injury reduction. This could involve bumpers which are less aggressive (e.g. softer) to pedestrian lower legs and bonnets which provide a yielding surface when contacted by the pedestrian’s head.
BEST PRACTICE IN FLEET AND CORPORATE ROAD SAFETY 115
Real-world data (Isenberg, Chidester and Mavros, 1998; Otte, 1999) have shown that modern vehicle designs are less aggressive to pedestrians when compared to older vehicles, but there is still a long way to go before we see the advent of a true “pedestrian-friendly” vehicle. Neck injuries Soft tissue neck injuries, often called whip-lash, are one of the main causes of long term consequences following road trauma. The majority of the soft tissue injuries to the neck occur in rear end impacts, but almost 30% (Krafft, 1998) occur in frontal or side impacts. While the kinematics of the cervical spine in an impact is fairly well known, the mechanism of the injury is still partly unknown, or rather, there are several possible mechanisms, each of them related to different protection strategies. Conventional head restraints have been shown to be of little value in protecting occupants from soft tissue injuries, although they seem to offer some protection. In rear end impacts, they offer up to a 10-15% improvement (Nygren, 1984). A well-positioned head restraint is therefore of some value, although current research suggests that it is the whole seat back, and not the head restraint alone, that must be modified in order to protect vehicle occupants from serious soft tissue neck injuries. New technology has recently been introduced to the market (Volvo and Saab), but it is based on a number of assumptions that have not been fully validated. For the moment, Neck Injury Criterion (NIC) (Boström, Krafft, Aldmann, Eichberger, Frederiksson, Haland, Lövsund, Steffan, Svensson and Tingvall, 1997) has been used as the main injury criteria, and the new technology has been shown to reduce this substantially. Hell, Langwieder, Walz, Muser, Kramer and Hartwig (1999) have suggested a number of evaluation criteria, with NIC being just one, that could serve as an intermediate guide for development and consumer choice. In these guidelines, the rebounding velocity is also included, which partly covers a mechanism of injury that has been discussed recently (Grzebieta, Przychodski, 1999; Krafft, 1998). In frontal impacts, an effective seat belt pretensioner might be beneficial to prevent these injuries (Kullgren, 1998; Kullgren, Thompson and Krafft, 1999). Environment Motor vehicle use is a major contributor to Melbourne’s main air problems; photochemical smog, fine particles and nitrogen dioxide. In addition, road vehicles produce 10.5% of the total greenhouse gas emissions in Australia (Government of Victoria, 1996). While fuel consumption is directly linked to the environmental impact of vehicles as well as to the economy of running vehicles, the link between fuel consumption and safety is not fully understood. However, there seem to be some indirect links that can be used to encourage low fuel consumption within organisations. Fuel consumption can be divided into to two components; - steady state speed consumption and - consumption in change of velocity (transients).
116 MONASH UNIVERSITY ACCIDENT RESEARCH CENTRE
While fuel consumption increases over 60 or 70 km/h, transients at any speed will increase the use of fuel. It is therefore beneficial to use the car in a manner that results in as few transients as possible. A non-aggressive driving style with few stop/starts will decrease fuel consumption. At the same time, this style of driving has the potential to improve safety through increasing headway, planning the driving more efficiently and overtaking less often. However, there is lack of research about the overall link between safety and a non-aggressive driving style. There are large differences in the standardised fuel consumption between different car models and engine options. Australia has made a commitment to reduce fuel consumption and has set national targets to this end. The aim is to reduce fuel consumption to 10 litres/100 km in the standardised cycle by 2000. This is a mixture of 55% urban cycle and 45% freeway cycle (AS2877/1986/55/45). By 2005, the national target should be even lower, at 7.2 litres/100 km for new vehicles (Government of Victoria, 1996). In order to contribute to the national target, it may be meaningful to purchase vehicles that consume fuel at a rate that is at or below targets. Maintaining and tuning a vehicle can reduce its emissions by up to 25%, and newer cars give off less emissions (RACV). Drivers can contribute to reducing the adverse effects of vehicles by planning trips to reduce unnecessary distance, using alternative forms of transport and car pooling. Avoiding the purchase of 4WDs is beneficial as they have enormous capacity to harm the environment (Anonymous, 1997b). Enforcing vehicle emission standards, maintaining vehicles well and monitoring performance can also contribute to reducing the environmental impact of vehicles (Government of Victoria, 1996). References Anonymous. (1997a). Cell phones may increase wreck rate. Purchasing, 122(10), 64. Anonymous. (1997b). Will motor vehicles be the cigarettes of next century? Motoring
Directions, 4(3), 11-12. Boström, O., Krafft, M., Aldmann, B., Eichberger, A., Frederiksson, R., Haland, Y., Lövsund,
P., Steffan, H., Svensson, M., & Tingvall, C. (1997). Prediction of neck injuries in rear impacts based on accident data and simulations. Proceedings of the 1997 International IRCOBI Conference on the Biomechanics of Impacts, p. 251-264.
Buzeman D. (1997). Car-to-car and single car crash compatibility: Individual effects of mass,
structure, stiffness and geometry. Thesis for the degree of Licenciate in Engineering. Chalmers University of Technology.
Carlsson. Full reference forthcoming. Dawson, D., & Reid, K. (1997). Fatigue, alcohol and performance impairment. Nature, 388,
235.

BEST PRACTICE IN FLEET AND CORPORATE ROAD SAFETY 117
Donoho, R. (1996). Gearing up for driver safety. Sales and marketing management, 148(12), 66-67.
Downs, C.G., Keigan, M., Maycock, G. and Grayson, G.B. (1999). The safety of fleet car
drivers: A review (TRL Report 390) Crowthorne, Berkshire: Transport Research Laboratory.
Evans, L. (1989). Airbag effectiveness in preventing fatalities predicted according to type of
crash, driver age and blood alcohol concentration. 33rd Proceedings of the Association for the Advancement of Automotive Medicine, Baltimore, p. 307-322.
Evans, L, & Frick, M.C. (1992). Car mass and fatality risk: Has the relationship changed? 36th
Proceedings of the Association for the Advancement of Automotive Medicine, Portland, p. 83-92.
Evans, L., & Gerrish, P.H. (1995). Anti-lock brakes and risk of front and rear impact in two-
vehicle crashes. 39th Proceedings of the Association for the Advancement of Automotive Medicine, Chicago, p. 311-325.
Fildes, B.N., Cameron, M.H., Vulcan, A.P., Digges, K.H., & Taylor, D. (1992). Airbag and
facebag benefits and costs. Proceedings of the 1992 International IRCOBI Conference on the Biomechanics of Impacts, Verona. p. 323-335.
Fildes, B.N., Lee, S.J., and Lane, J.C. (1993). Vehicle mass, size and safety (CR 133).
Canberra: Federal Office of Road Safety. Fildes, B., Deery, H., & Vulcan, P. (1997). A preliminary analysis of the effectiveness of
airbag technology in reducing seatbelt injuries. Proceedings of the 1997 International IRCOBI Conference on the Biomechanics of Impact, Hanover, p. 387-397.
Fildes, B.N., Lane, J.C., Lenard, J., & Vulcan, A.P. (1991). Passenger cars and occupant
injury (CR 95). Canberra: Federal Office of Road Safety. Fildes, B.N., Lane, J.C., Lenard, J., & Vulcan, A.P. (1994). Passenger cars and occupant
injury: Side impact crashes (CR 134). Canberra: Federal Office of Road Safety. Finch (1994). Full reference forthcoming. Folksam. (1999). Safe and Dangerous Cars. Sweden: Folksam Insurance Group. Government of Victoria. (1996). Transporting Melbourne: A Summary for Public
Consultation. Melbourne: CPR Communications and Public Relations. Grzebieta, R., Przychodski, D., Tingvall, C. and Krafft, M. (1999). Investigation into the
physics governing seat back behaviour in whiplash injuries. Monash University. Haworth, N., & Vulcan, P. (1997). The roles of alcohol and other drugs in single vehicle
crashes. In C. Mercier-Guyon (Ed.), Proceedings of the 14th International Conferene on Alcohol, Drugs and Traffic Safety (Vol. 1). p. 111-118.
118 MONASH UNIVERSITY ACCIDENT RESEARCH CENTRE
Hell, W., Langwieder, K., Walz, F., Muser, M., Kramer, M., Hartwig, E. (1999). Consequenses for seat design due to rear end accident analysis, sled tests and possible test criteria for reducing cervical spine injuries after rear-end collision. Proceedings of the 1999 IRCOBI Conference on the Biomechanics of Impact, Barcelona, p, 243-259.
Horne, J.A., & Reyner, L.A. (1995). Sleep related vehicle accidents. British Medical Journal,
310, 567-567. Insurance Institute for Highway Safety. (1999). Daytime Running Lights.
www.highwaysafety.org/safety_facts/qanda/drl.htm Isenberg, R.A., Chidester, A., & Marvos, S. (1998). Update on pedestrian crash data study.
Proceedings of the 16th International Technical Conference on the Enhanced Safety of Vehicles. Windsor, Canada. Paper No. 98-S6-O-05.
Koornstra, M. (1998). The safety effects of Daytime Running Lights. SWOV Research
Activities, 9, 1-3. Kloeden, C., & McLean, J. (1998). Speed and the risk of involvement in a casualty crash.
Proceedings of the Road Safety Research Policing, Education Conference, Wellington, Vol. 1, p. 188-190.
Krafft, M. (1998). Non-fatal injuries to car occupants. Injury assessment and analysis of
impacts casuing short and long term consequences with special reference to neck injuries. Thesis. Karolinska Institute.
Krafft, M., Kullgren, A., Lie, A., & Tingvall, C. (1998). The risk of skull/brain injuries in
modern cars. Proceedings of the 16th International Technical Conference on the Enhanced Safety of Vehicles. Windsor, Canada. Paper No. 98-S6-O-14.
Kullgren, A. (1998). Validity and reliability of vehicle collision data. Crash pulse recorders
for impact severity and injury risk assessments in real-life frontal impacts. Karolinska Institute.
Kullgren, A., Lie, A., & Tingvall, C. (1994). The effectiveness of ABS in real life accidents.
Proceedings of the 14th International Technical Conference on the Enhanced Safety of Vehicles. Paper No. 94-S9-O-11.
Kullgren, A., Thomson, R., Krafft, M. (1999). The effect of crash pulse shape on AIS 1 neck
injuries in frontal impacts. Proceedings of the 1999 IRCOBI Conference on the Biomechanics of Impact, Hanover, p. 231-242.
Larsson, P., Lie, A., Tingvall, C., Krafft, M., & Kullgren, A. (1996). The crash safety of new
car models: A comparative accident study of new versus old car models. Proceedings of the 15th International Technical Conference on the Enhanced Safety of Vehicles. Melbourne. Paper No. 96-S9-O-13.
Lenné, M., Triggs, T., & Redman, J. (1998). Sleep loss or alcohol: Which has the greater
impact upon driving ability? Proceedings of the Road Safety Research Policing, Education Conference, Wellington, Vol. 2 ,p 23-26.
BEST PRACTICE IN FLEET AND CORPORATE ROAD SAFETY 119
McLean, J. (1998). Pedestrian injuries. Paper presented at the Biomechanics course, Monash
University, Melbourne. Feb, 1998. McLean, A.J., Fildes, B.N., Kloeden, C.N., Digges, K.H., Anderson, R.W.G., Moore, V.M.,
& Simpson, D.A. (1997). Prevention of head injuries to car occupants: An investigation of interior padding options (CR160). Canberra: Federal Office of Road Safety.
McKay, M.P., Fitzharris, M., & Fildes, B. (1999). Driver injury patterns in the United States
and Australia: Does beltwearing or airbag deployment make a difference? 43rd Annual Proceedings of the Association for the Advancement of Automotive Medicine. Barcelona. p. 409-424.
Newstead, S. (1999). Personal communication. Newstead, S., & Cameron, M. (1999). Updated correlation of results from the Australian New
Car Assessment Program with real crash data from 1986 to 1996 (Report No. 152). Melbourne: Monash University Accident Research Centre.
Newstead, S., Cameron, M., & Le, C.M. (1999). Vehicle crashworthiness ratings and
crashworthiness by year of vehicle manufacture: Victoria and NSW crashes during 1987-97, Queensland crashes during 1991-96 (Report No. 150). Melbourne: Monash University Accident Research Centre.
NHTSA. (1999). Safety Fact Sheet. www.nhtsa.dot.gov/airbags/factsheets/numbers.html Nygren, Å. (1984). Injuries to car occupants some aspects of the interior safety of cars.
Thesis. Karolinska Institute. Otte, D. (1999). Severity and mechanism of head impacts in car to pedestrian accidents.
Proceedings of the 1999 International IRCOBI Conference on the Biomechanics of Impact. Barcelona, p. 329-341.
RACV. (year unknown). Driving the Issues. VicRoads, Victoria Police and Transport Accident Commission. (1995). Safety First:
Victoria’s Road Safety Strategy, 1995-2000. Violanti, J.M., & Marshall, J.R. (1996). Cellular phones and traffic accidents: An
epidemiological approach. Accident Analysis and Prevention, 28(2), 265-270.