review article - hindawi · review article ... there are many literature references comparing the...
TRANSCRIPT
Hindawi Publishing CorporationAdvances in Materials Science and EngineeringVolume 2009, Article ID 843281, 7 pagesdoi:10.1155/2009/843281
Review Article
The Possibility of Correlation of Hardening Power for Oils andPolymers of Quenching Mediums
Małgorzata Przyłecka and Wojciech Gestwa
Poznan University of Technology, Poznan, Poland
Correspondence should be addressed to Małgorzata Przyłecka, [email protected]
Received 27 March 2009; Accepted 3 September 2009
Recommended by Douglas Chrisey
There are many literature references comparing the use of aqueous polymer quenching solutions with petroleum oil quenchantsfor a wide range of steels of varying hardenability and the relating parameters of describing properties of the quenching mediums.There are relatively little similar relating correlations between parameters of describing properties of the different quenchingmediums. The quenchants used included: conventional quenching oil, martempering oil, and 5% and 25% aqueous polymerquenchant solutions (APQSs) of a polymer quenchant. These quenching media were selected to represent a broad range ofquench severities as quantified by cooling curve analysis (ASTM D 6482) using a standard Inconel 600 probe and the TensiAgitation Device. The test of correlation conducted between the Hardening Power parameters according to examples of oilsand polymers. The enable work results in applying the Hardening Power independently from equation calculated for differentquenching mediums and their work parameters.
Copyright © 2009 M. Przyłecka and W. Gestwa. This is an open access article distributed under the Creative Commons AttributionLicense, which permits unrestricted use, distribution, and reproduction in any medium, provided the original work is properlycited.
1. Introduction
Optimal quenchant selection is dependent on cooling inten-sity which is dependent on many factors including steel massand hardenability, quenchant selection, bath temperature,agitation and in case of aqueous polymer solutions, polymerconcentration [1, 2]. Typically, increasing quench bathagitation increases cooling rates and increasing quench bathtemperature decreases cooling rates. For polymer quen-chants, increasing polymer concentration decreases coolingrates. Currently, the most common method of assessing thecooling properties of a quenching medium is to use cooling(time-temperature) curves [2, 3]. Grum and coworkers havealso correlated ultrasound phenomena [Grum, Ravnik 2006]and cooling curve (time-temperature) behavior obtained bydifferent quenching media [4] and quenching conditionswith steel transformation and residual stress for through-hardened steel alloys such as AISI 4140 [5], [Grum, et al.2002]. However, in Segeberga works [7–9, 11] we can findthe method of calculating Hardening Power parameter, theparameter describes cooling as centres abilities taking intoaccount their conditions of work.
In this paper, the effect quenching medium selectionand quench severity for different quenching mediums andalternative used the equation of Segeberg for oil and waterpolymer solution.
In work it was showed, that it is the possibility ofdelimitation between examples the correlation the describingthe equation HP for oils and the water polymer solutions.
Odwołac sie w wstepie do literatury Segeberga.
2. Experimental
The chemical compositions of steels used for this work areshown in Table 1.
Test specimens were machined from each steel materialand these included ∅12 × 6. After machining, the testspecimens were polished and then normalized at 890◦Cfor 0.5 hour. The normalization process was conductedusing protective atmosphere, with a dissociated ammonia.After cooling and drying, the protection atmosphere witha dissociated ammonia of type H2–N2 had the temperatureof dew point about −60◦C. In this atmosphere the quantityof no dissociated ammonia does not cross 0.005%. The
2 Advances in Materials Science and Engineering
Table 1: Chemical composition of 1045 steel.
Steel alloy The Elemental composition (% by weight)
classificationnorm
C Mn Si Cr Ni Cu P max S max Inne
1045 PN-92/H-84009 0.42 – 0.50 0.50 – 0.58 0.17 – 0.37 Max 0.30 Max 0.30 Max 0.30 Max 0.040 Max 0.040 Mo Max 0.10
Not to becenter drilled
30 mm 30 mm 6 mm
1.5 mm tight push
fit “nominal”
0.75 r
T/C
9.5 mm
13 mm (12.5 mm afterfinish grinding)
30◦
(a)
Probe bodyFinishgrind
Support tubeMaterial-Inconel
alloy 600
160 mm min.
200 mm min.
12.5± 0.01 mm
End support tubeMaterial-stainless steel
Mineral insulatedthermocouple
Type “K” (NiCr/NiAl)
TerminationStandard thermocoupletype “K” (NiCr/NiAl)
(b)
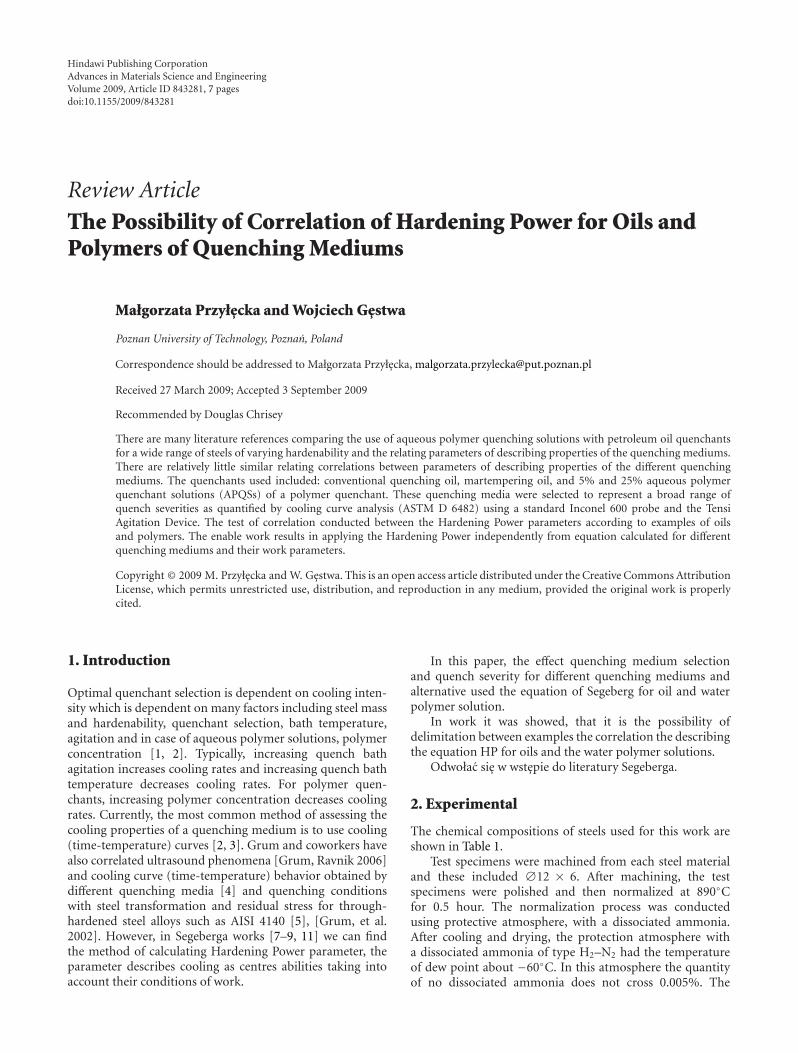
Figure 1: Schematic illustration of the so-called Wolfson probe used in ASTM D6482: (a) probe details, (b) general assembly.
grain size after normalization was ASTM 7 and was deter-mined according to ASTM E112 “Standard Test Methodsfor Determining Average Grain Size.” The test specimenswere austenitized at 860◦C for 0.5 hour in a dissociatedammonia protective atmosphere and quenched in one of thequenchants shown in Table 2. The quenchants used for thisstudy included: OH 70 which is a conventional petroleumoil-based quenchant manufactured by Petrol Oil in Płock,Poland; Mar-Temp −340 (v.890) which is an acceleratedhot-oil manufactured by Houghton-Poland Sp. z o.o.; BreoxQuenchant A which is an aqueous polymer quenchantconcentrate manufactured by Cognis Corporation and wasdiluted to the desired concentration using distilled waterprior to use.
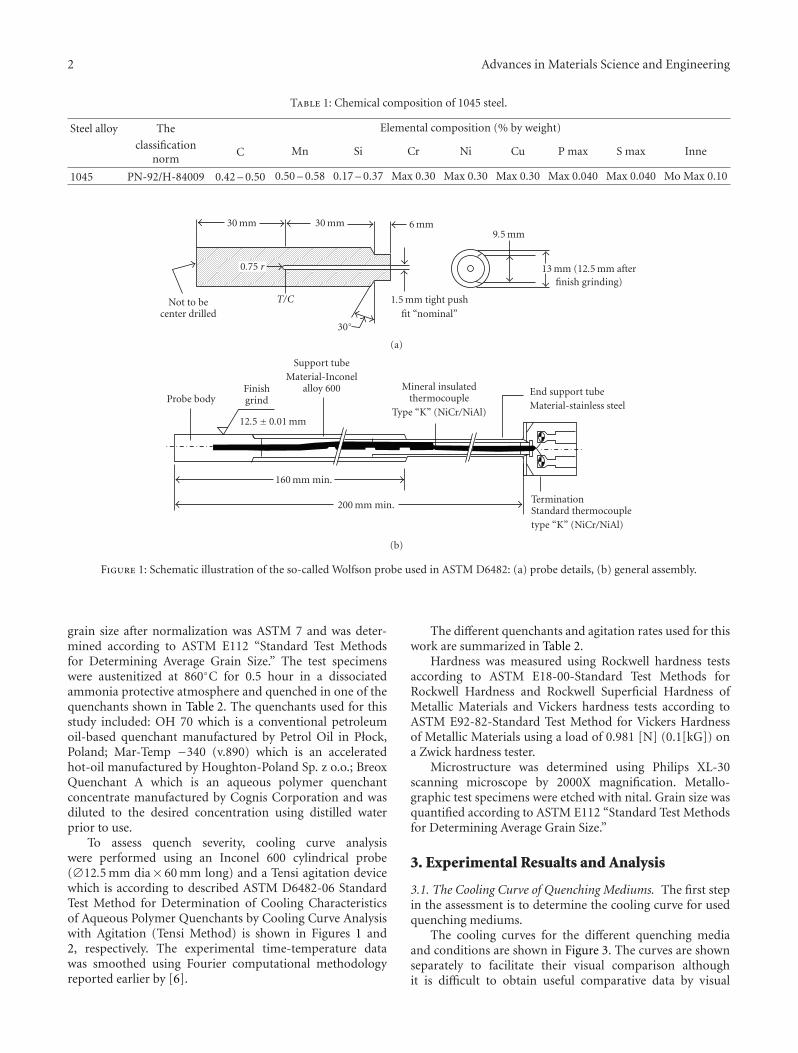
To assess quench severity, cooling curve analysiswere performed using an Inconel 600 cylindrical probe(∅12.5 mm dia× 60 mm long) and a Tensi agitation devicewhich is according to described ASTM D6482-06 StandardTest Method for Determination of Cooling Characteristicsof Aqueous Polymer Quenchants by Cooling Curve Analysiswith Agitation (Tensi Method) is shown in Figures 1 and2, respectively. The experimental time-temperature datawas smoothed using Fourier computational methodologyreported earlier by [6].
The different quenchants and agitation rates used for thiswork are summarized in Table 2.
Hardness was measured using Rockwell hardness testsaccording to ASTM E18-00-Standard Test Methods forRockwell Hardness and Rockwell Superficial Hardness ofMetallic Materials and Vickers hardness tests according toASTM E92-82-Standard Test Method for Vickers Hardnessof Metallic Materials using a load of 0.981 [N] (0.1[kG]) ona Zwick hardness tester.
Microstructure was determined using Philips XL-30scanning microscope by 2000X magnification. Metallo-graphic test specimens were etched with nital. Grain size wasquantified according to ASTM E112 “Standard Test Methodsfor Determining Average Grain Size.”
3. Experimental Resualts and Analysis
3.1. The Cooling Curve of Quenching Mediums. The first stepin the assessment is to determine the cooling curve for usedquenching mediums.
The cooling curves for the different quenching mediaand conditions are shown in Figure 3. The curves are shownseparately to facilitate their visual comparison althoughit is difficult to obtain useful comparative data by visual
Advances in Materials Science and Engineering 3
Table 2: Quenching media used in hardening of steel.
Quenchant Quench bath temperature [ ◦C]; (Tb) Agitation rate [m/s] (Vb)
5% water polymer solution (Breox quenchant A) 30 0.24
5% water polymer solution (Breox quenchant A) 30 0.52
25% water polymer solution (Breox quenchant A) 30 0.24
25% water polymer solution (Breox quenchant A) 30 0.52
OH70 oil 60 0.51
Mar-temp 890 oil 100 0.52
WithWithout
convection
Elastic seal
Directionof flow
Section A-B
60
60
1256560
205
155
A
1535
40
B
85
Figure 2: Schematic illustration of the tensi impeller-drivenagitation device used in ASTM D6482.
inspection. Therefore, a numerical analysis of the coolingtime-temperature and cooling rate curves is performed andthe data obtained is summarized in Table 3.
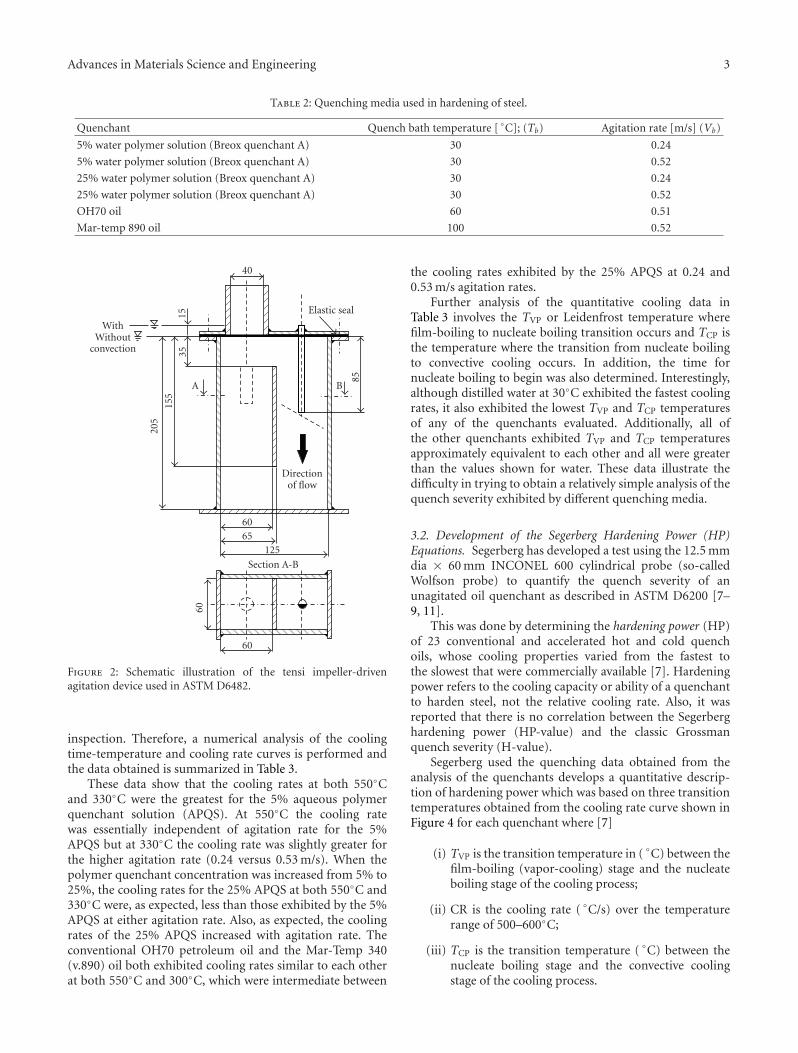
These data show that the cooling rates at both 550◦Cand 330◦C were the greatest for the 5% aqueous polymerquenchant solution (APQS). At 550◦C the cooling ratewas essentially independent of agitation rate for the 5%APQS but at 330◦C the cooling rate was slightly greater forthe higher agitation rate (0.24 versus 0.53 m/s). When thepolymer quenchant concentration was increased from 5% to25%, the cooling rates for the 25% APQS at both 550◦C and330◦C were, as expected, less than those exhibited by the 5%APQS at either agitation rate. Also, as expected, the coolingrates of the 25% APQS increased with agitation rate. Theconventional OH70 petroleum oil and the Mar-Temp 340(v.890) oil both exhibited cooling rates similar to each otherat both 550◦C and 300◦C, which were intermediate between
the cooling rates exhibited by the 25% APQS at 0.24 and0.53 m/s agitation rates.
Further analysis of the quantitative cooling data inTable 3 involves the TVP or Leidenfrost temperature wherefilm-boiling to nucleate boiling transition occurs and TCP isthe temperature where the transition from nucleate boilingto convective cooling occurs. In addition, the time fornucleate boiling to begin was also determined. Interestingly,although distilled water at 30◦C exhibited the fastest coolingrates, it also exhibited the lowest TVP and TCP temperaturesof any of the quenchants evaluated. Additionally, all ofthe other quenchants exhibited TVP and TCP temperaturesapproximately equivalent to each other and all were greaterthan the values shown for water. These data illustrate thedifficulty in trying to obtain a relatively simple analysis of thequench severity exhibited by different quenching media.
3.2. Development of the Segerberg Hardening Power (HP)Equations. Segerberg has developed a test using the 12.5 mmdia × 60 mm INCONEL 600 cylindrical probe (so-calledWolfson probe) to quantify the quench severity of anunagitated oil quenchant as described in ASTM D6200 [7–9, 11].
This was done by determining the hardening power (HP)of 23 conventional and accelerated hot and cold quenchoils, whose cooling properties varied from the fastest tothe slowest that were commercially available [7]. Hardeningpower refers to the cooling capacity or ability of a quenchantto harden steel, not the relative cooling rate. Also, it wasreported that there is no correlation between the Segerberghardening power (HP-value) and the classic Grossmanquench severity (H-value).
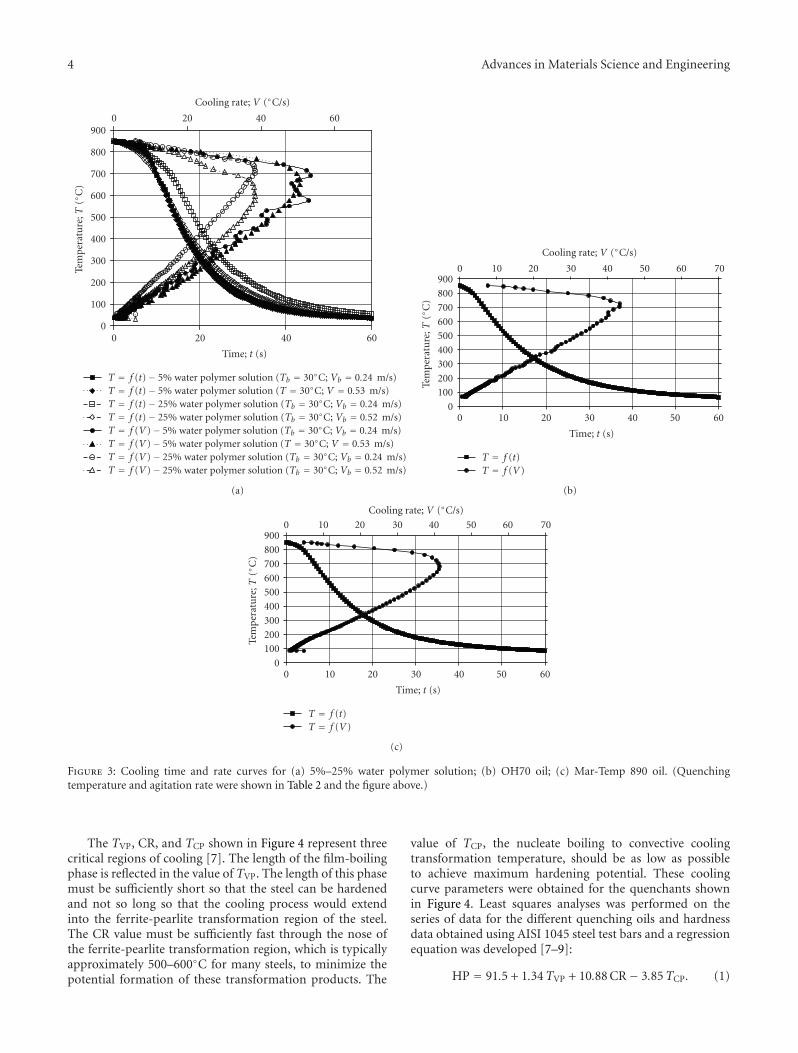
Segerberg used the quenching data obtained from theanalysis of the quenchants develops a quantitative descrip-tion of hardening power which was based on three transitiontemperatures obtained from the cooling rate curve shown inFigure 4 for each quenchant where [7]
(i) TVP is the transition temperature in ( ◦C) between thefilm-boiling (vapor-cooling) stage and the nucleateboiling stage of the cooling process;
(ii) CR is the cooling rate ( ◦C/s) over the temperaturerange of 500–600◦C;
(iii) TCP is the transition temperature ( ◦C) between thenucleate boiling stage and the convective coolingstage of the cooling process.
4 Advances in Materials Science and Engineering
0
100
200
300
400
500
600
700
800
900
Tem
per
atu
re;T
(◦C
)
0 20 40 60
Time; t (s)
0 20 40 60
Cooling rate; V (◦C/s)
T = f (t)− 5% water polymer solution (Tb = 30◦C; Vb = 0.24 m/s)T = f (t)− 5% water polymer solution (T = 30◦C; V = 0.53 m/s)T = f (t)− 25% water polymer solution (Tb = 30◦C; Vb = 0.24 m/s)T = f (t)− 25% water polymer solution (Tb = 30◦C; Vb = 0.52 m/s)T = f (V)− 5% water polymer solution (Tb = 30◦C; Vb = 0.24 m/s)T = f (V)− 5% water polymer solution (T = 30◦C; V = 0.53 m/s)T = f (V)− 25% water polymer solution (Tb = 30◦C; Vb = 0.24 m/s)T = f (V)− 25% water polymer solution (Tb = 30◦C; Vb = 0.52 m/s)
(a)
0
100200
300
400
500600
700
800
900
Tem
per
atu
re;T
(◦C
)0 10 20 30 40 50 60
Time; t (s)
0 10 20 30 40 50 60 70
Cooling rate; V (◦C/s)
T = f (t)T = f (V)
(b)
0
100200
300
400
500600
700
800
900
Tem
per
atu
re;T
(◦C
)
0 10 20 30 40 50 60
Time; t (s)
0 10 20 30 40 50 60 70
Cooling rate; V (◦C/s)
T = f (t)T = f (V)
(c)
Figure 3: Cooling time and rate curves for (a) 5%–25% water polymer solution; (b) OH70 oil; (c) Mar-Temp 890 oil. (Quenchingtemperature and agitation rate were shown in Table 2 and the figure above.)
The TVP, CR, and TCP shown in Figure 4 represent threecritical regions of cooling [7]. The length of the film-boilingphase is reflected in the value of TVP. The length of this phasemust be sufficiently short so that the steel can be hardenedand not so long so that the cooling process would extendinto the ferrite-pearlite transformation region of the steel.The CR value must be sufficiently fast through the nose ofthe ferrite-pearlite transformation region, which is typicallyapproximately 500–600◦C for many steels, to minimize thepotential formation of these transformation products. The
value of TCP, the nucleate boiling to convective coolingtransformation temperature, should be as low as possibleto achieve maximum hardening potential. These coolingcurve parameters were obtained for the quenchants shownin Figure 4. Least squares analyses was performed on theseries of data for the different quenching oils and hardnessdata obtained using AISI 1045 steel test bars and a regressionequation was developed [7–9]:
HP = 91.5 + 1.34TVP + 10.88 CR− 3.85TCP. (1)
Advances in Materials Science and Engineering 5
Table 3: Summary of quenchants and quenching conditions.
Parameters 5% aqueous 25% aqueous Conventional quenchoil OH70
High temper oilMar-Temp 890polymer solution polymer solution
1 2 3 4 5 6Quench bathtemperature [ ◦C]
30 30 30 30 60 100
Agitation rate [m/s] 0.24 0.52 0.24 0.52 0.51 0.52
V550 [ ◦C/s] 47.6 46.3 31.4 37.6 35.2 36.9
V330 [ ◦C/s] 26.8 30.1 18.6 24.5 19.8 20.7
Tvp1 [ ◦C] 831 823 774 800 834 828
Tcp2 [ ◦C] 89 78 179 109 132 159
Time for nucleateboiling to begin [s]
33 31 19.2 32.2 34.7 31
HP13 1380 1404 768 1153 1082 990
HP24 330 371 172 266 199 217
Core hardness (HRC)5 35 37 21 21 21 25
Core hardness (HV0.1) 367 370 310 299 317 365
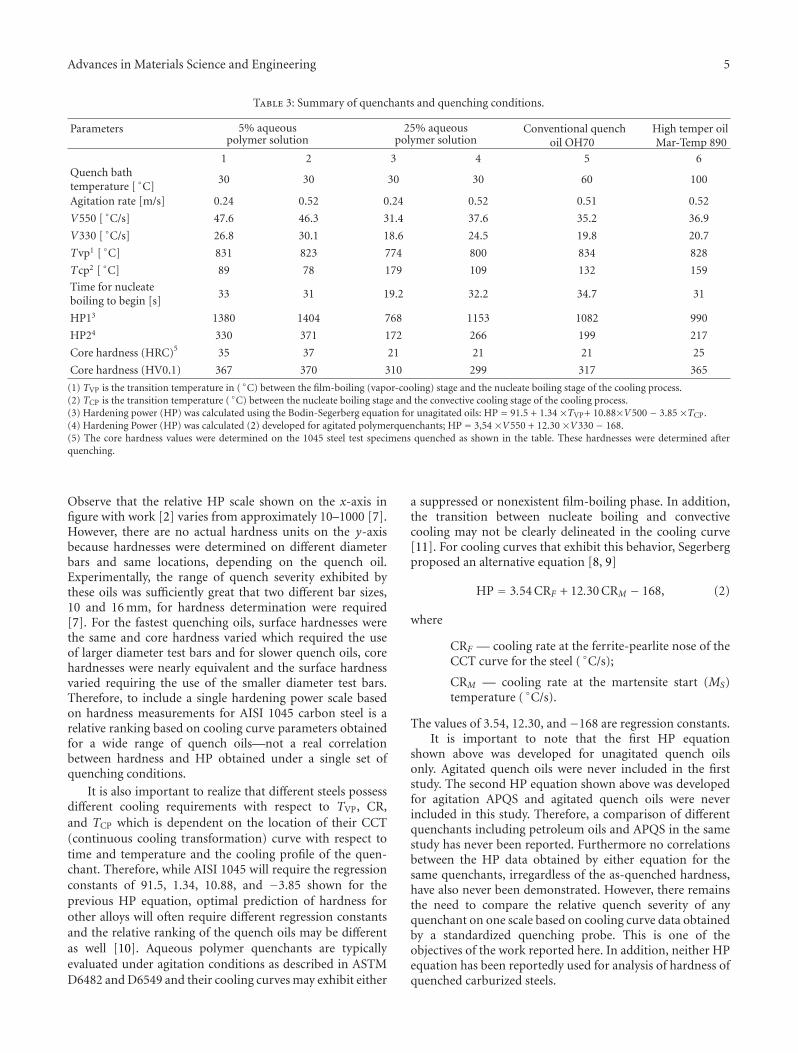
(1) TVP is the transition temperature in ( ◦C) between the film-boiling (vapor-cooling) stage and the nucleate boiling stage of the cooling process.(2) TCP is the transition temperature ( ◦C) between the nucleate boiling stage and the convective cooling stage of the cooling process.(3) Hardening power (HP) was calculated using the Bodin-Segerberg equation for unagitated oils: HP = 91.5 + 1.34 ×TVP+ 10.88×V500 − 3.85 ×TCP.(4) Hardening Power (HP) was calculated (2) developed for agitated polymerquenchants; HP = 3,54 ×V550 + 12.30 ×V330 − 168.(5) The core hardness values were determined on the 1045 steel test specimens quenched as shown in the table. These hardnesses were determined afterquenching.
Observe that the relative HP scale shown on the x-axis infigure with work [2] varies from approximately 10–1000 [7].However, there are no actual hardness units on the y-axisbecause hardnesses were determined on different diameterbars and same locations, depending on the quench oil.Experimentally, the range of quench severity exhibited bythese oils was sufficiently great that two different bar sizes,10 and 16 mm, for hardness determination were required[7]. For the fastest quenching oils, surface hardnesses werethe same and core hardness varied which required the useof larger diameter test bars and for slower quench oils, corehardnesses were nearly equivalent and the surface hardnessvaried requiring the use of the smaller diameter test bars.Therefore, to include a single hardening power scale basedon hardness measurements for AISI 1045 carbon steel is arelative ranking based on cooling curve parameters obtainedfor a wide range of quench oils—not a real correlationbetween hardness and HP obtained under a single set ofquenching conditions.
It is also important to realize that different steels possessdifferent cooling requirements with respect to TVP, CR,and TCP which is dependent on the location of their CCT(continuous cooling transformation) curve with respect totime and temperature and the cooling profile of the quen-chant. Therefore, while AISI 1045 will require the regressionconstants of 91.5, 1.34, 10.88, and −3.85 shown for theprevious HP equation, optimal prediction of hardness forother alloys will often require different regression constantsand the relative ranking of the quench oils may be differentas well [10]. Aqueous polymer quenchants are typicallyevaluated under agitation conditions as described in ASTMD6482 and D6549 and their cooling curves may exhibit either
a suppressed or nonexistent film-boiling phase. In addition,the transition between nucleate boiling and convectivecooling may not be clearly delineated in the cooling curve[11]. For cooling curves that exhibit this behavior, Segerbergproposed an alternative equation [8, 9]
HP = 3.54 CRF + 12.30 CRM − 168, (2)
where
CRF — cooling rate at the ferrite-pearlite nose of theCCT curve for the steel ( ◦C/s);
CRM — cooling rate at the martensite start (MS)temperature ( ◦C/s).
The values of 3.54, 12.30, and −168 are regression constants.It is important to note that the first HP equation
shown above was developed for unagitated quench oilsonly. Agitated quench oils were never included in the firststudy. The second HP equation shown above was developedfor agitation APQS and agitated quench oils were neverincluded in this study. Therefore, a comparison of differentquenchants including petroleum oils and APQS in the samestudy has never been reported. Furthermore no correlationsbetween the HP data obtained by either equation for thesame quenchants, irregardless of the as-quenched hardness,have also never been demonstrated. However, there remainsthe need to compare the relative quench severity of anyquenchant on one scale based on cooling curve data obtainedby a standardized quenching probe. This is one of theobjectives of the work reported here. In addition, neither HPequation has been reportedly used for analysis of hardness ofquenched carburized steels.
6 Advances in Materials Science and Engineering
0100200300400500600700800900
Tem
per
atu
re(◦
C)
0 5 10 15 20 25
Time (s)
0 25 50 75 100 125
Cooling rate (◦C/s)
TVP
TCP
CR
Figure 4: Cooling time—temperature and the cooling rate curveindicate transition temperatures for calculation of hardening power.
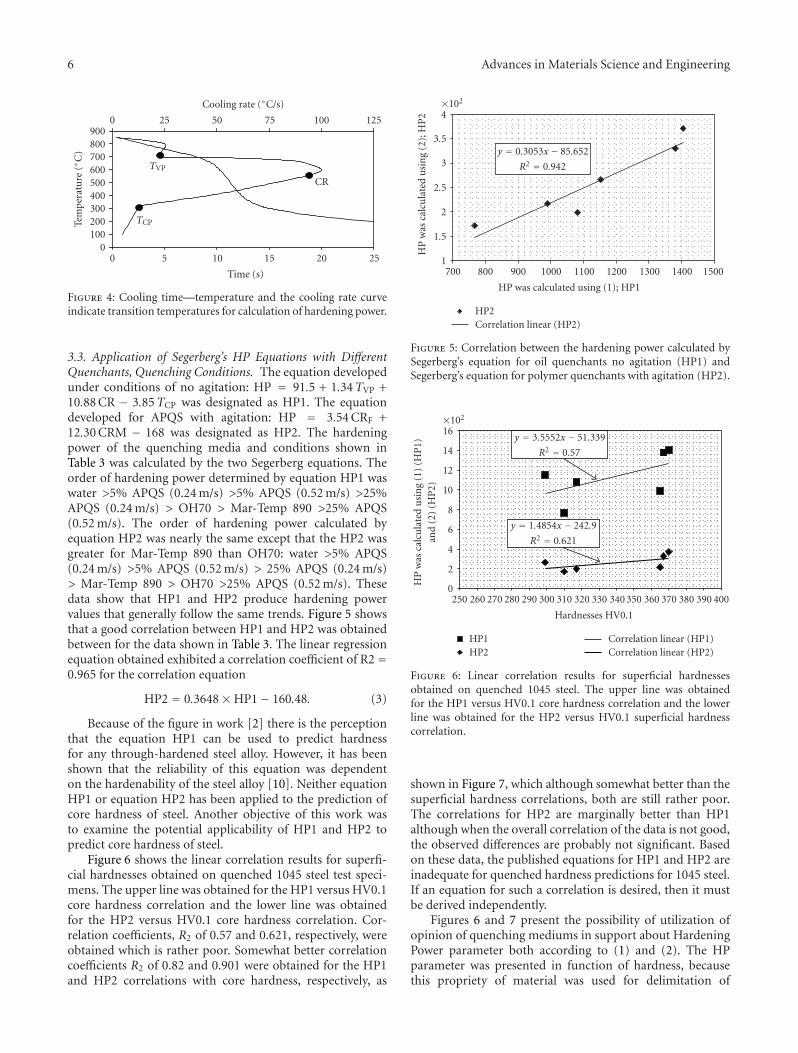
3.3. Application of Segerberg’s HP Equations with DifferentQuenchants, Quenching Conditions. The equation developedunder conditions of no agitation: HP = 91.5 + 1.34TVP +10.88 CR − 3.85TCP was designated as HP1. The equationdeveloped for APQS with agitation: HP = 3.54 CRF +12.30 CRM − 168 was designated as HP2. The hardeningpower of the quenching media and conditions shown inTable 3 was calculated by the two Segerberg equations. Theorder of hardening power determined by equation HP1 waswater >5% APQS (0.24 m/s) >5% APQS (0.52 m/s) >25%APQS (0.24 m/s) > OH70 > Mar-Temp 890 >25% APQS(0.52 m/s). The order of hardening power calculated byequation HP2 was nearly the same except that the HP2 wasgreater for Mar-Temp 890 than OH70: water >5% APQS(0.24 m/s) >5% APQS (0.52 m/s) > 25% APQS (0.24 m/s)> Mar-Temp 890 > OH70 >25% APQS (0.52 m/s). Thesedata show that HP1 and HP2 produce hardening powervalues that generally follow the same trends. Figure 5 showsthat a good correlation between HP1 and HP2 was obtainedbetween for the data shown in Table 3. The linear regressionequation obtained exhibited a correlation coefficient of R2 =0.965 for the correlation equation
HP2 = 0.3648×HP1− 160.48. (3)
Because of the figure in work [2] there is the perceptionthat the equation HP1 can be used to predict hardnessfor any through-hardened steel alloy. However, it has beenshown that the reliability of this equation was dependenton the hardenability of the steel alloy [10]. Neither equationHP1 or equation HP2 has been applied to the prediction ofcore hardness of steel. Another objective of this work wasto examine the potential applicability of HP1 and HP2 topredict core hardness of steel.
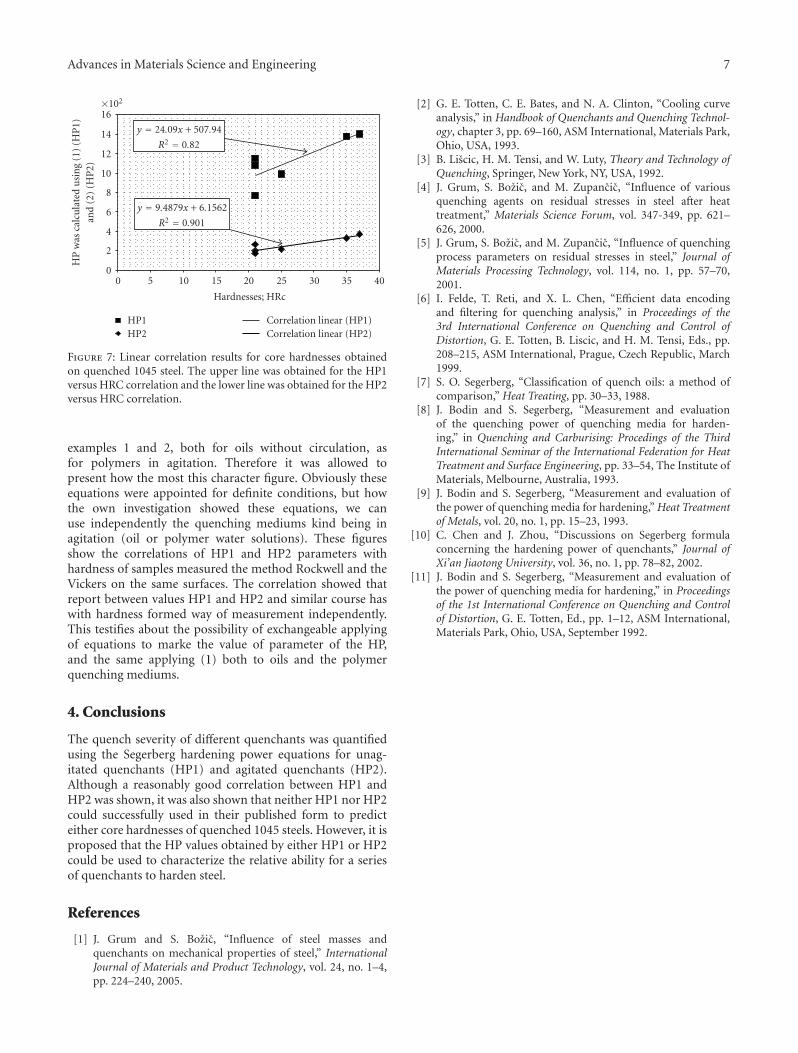
Figure 6 shows the linear correlation results for superfi-cial hardnesses obtained on quenched 1045 steel test speci-mens. The upper line was obtained for the HP1 versus HV0.1core hardness correlation and the lower line was obtainedfor the HP2 versus HV0.1 core hardness correlation. Cor-relation coefficients, R2 of 0.57 and 0.621, respectively, wereobtained which is rather poor. Somewhat better correlationcoefficients R2 of 0.82 and 0.901 were obtained for the HP1and HP2 correlations with core hardness, respectively, as
1
1.5
2
2.5
3
3.5
4×10²
HP
was
calc
ula
ted
usi
ng
(2);
HP
2
700 800 900 1000 1100 1200 1300 1400 1500
HP was calculated using (1); HP1
HP2Correlation linear (HP2)
y = 0.3053x − 85.652
R2 = 0.942
Figure 5: Correlation between the hardening power calculated bySegerberg’s equation for oil quenchants no agitation (HP1) andSegerberg’s equation for polymer quenchants with agitation (HP2).
0
2
4
6
8
10
12
14
16×102
HP
was
calc
ula
ted
usi
ng
(1)
(HP
1)an
d(2
)(H
P2)
250 260 270 280 290 300 310 320 330 340 350 360 370 380 390 400
Hardnesses HV0.1
HP1HP2
Correlation linear (HP1)Correlation linear (HP2)
y = 3.5552x − 51.339
R2 = 0.57
y = 1.4854x − 242.9
R2 = 0.621
Figure 6: Linear correlation results for superficial hardnessesobtained on quenched 1045 steel. The upper line was obtainedfor the HP1 versus HV0.1 core hardness correlation and the lowerline was obtained for the HP2 versus HV0.1 superficial hardnesscorrelation.
shown in Figure 7, which although somewhat better than thesuperficial hardness correlations, both are still rather poor.The correlations for HP2 are marginally better than HP1although when the overall correlation of the data is not good,the observed differences are probably not significant. Basedon these data, the published equations for HP1 and HP2 areinadequate for quenched hardness predictions for 1045 steel.If an equation for such a correlation is desired, then it mustbe derived independently.
Figures 6 and 7 present the possibility of utilization ofopinion of quenching mediums in support about HardeningPower parameter both according to (1) and (2). The HPparameter was presented in function of hardness, becausethis propriety of material was used for delimitation of
Advances in Materials Science and Engineering 7
0
2
4
6
8
10
12
14
16×102
HP
was
calc
ula
ted
usi
ng
(1)
(HP
1)an
d(2
)(H
P2)
0 5 10 15 20 25 30 35 40
Hardnesses; HRc
HP1HP2
Correlation linear (HP1)Correlation linear (HP2)
y = 24.09x + 507.94
R2 = 0.82
y = 9.4879x + 6.1562
R2 = 0.901
Figure 7: Linear correlation results for core hardnesses obtainedon quenched 1045 steel. The upper line was obtained for the HP1versus HRC correlation and the lower line was obtained for the HP2versus HRC correlation.
examples 1 and 2, both for oils without circulation, asfor polymers in agitation. Therefore it was allowed topresent how the most this character figure. Obviously theseequations were appointed for definite conditions, but howthe own investigation showed these equations, we canuse independently the quenching mediums kind being inagitation (oil or polymer water solutions). These figuresshow the correlations of HP1 and HP2 parameters withhardness of samples measured the method Rockwell and theVickers on the same surfaces. The correlation showed thatreport between values HP1 and HP2 and similar course haswith hardness formed way of measurement independently.This testifies about the possibility of exchangeable applyingof equations to marke the value of parameter of the HP,and the same applying (1) both to oils and the polymerquenching mediums.
4. Conclusions
The quench severity of different quenchants was quantifiedusing the Segerberg hardening power equations for unag-itated quenchants (HP1) and agitated quenchants (HP2).Although a reasonably good correlation between HP1 andHP2 was shown, it was also shown that neither HP1 nor HP2could successfully used in their published form to predicteither core hardnesses of quenched 1045 steels. However, it isproposed that the HP values obtained by either HP1 or HP2could be used to characterize the relative ability for a seriesof quenchants to harden steel.
References
[1] J. Grum and S. Bozic, “Influence of steel masses andquenchants on mechanical properties of steel,” InternationalJournal of Materials and Product Technology, vol. 24, no. 1–4,pp. 224–240, 2005.
[2] G. E. Totten, C. E. Bates, and N. A. Clinton, “Cooling curveanalysis,” in Handbook of Quenchants and Quenching Technol-ogy, chapter 3, pp. 69–160, ASM International, Materials Park,Ohio, USA, 1993.
[3] B. Liscic, H. M. Tensi, and W. Luty, Theory and Technology ofQuenching, Springer, New York, NY, USA, 1992.
[4] J. Grum, S. Bozic, and M. Zupancic, “Influence of variousquenching agents on residual stresses in steel after heattreatment,” Materials Science Forum, vol. 347-349, pp. 621–626, 2000.
[5] J. Grum, S. Bozic, and M. Zupancic, “Influence of quenchingprocess parameters on residual stresses in steel,” Journal ofMaterials Processing Technology, vol. 114, no. 1, pp. 57–70,2001.
[6] I. Felde, T. Reti, and X. L. Chen, “Efficient data encodingand filtering for quenching analysis,” in Proceedings of the3rd International Conference on Quenching and Control ofDistortion, G. E. Totten, B. Liscic, and H. M. Tensi, Eds., pp.208–215, ASM International, Prague, Czech Republic, March1999.
[7] S. O. Segerberg, “Classification of quench oils: a method ofcomparison,” Heat Treating, pp. 30–33, 1988.
[8] J. Bodin and S. Segerberg, “Measurement and evaluationof the quenching power of quenching media for harden-ing,” in Quenching and Carburising: Procedings of the ThirdInternational Seminar of the International Federation for HeatTreatment and Surface Engineering, pp. 33–54, The Institute ofMaterials, Melbourne, Australia, 1993.
[9] J. Bodin and S. Segerberg, “Measurement and evaluation ofthe power of quenching media for hardening,” Heat Treatmentof Metals, vol. 20, no. 1, pp. 15–23, 1993.
[10] C. Chen and J. Zhou, “Discussions on Segerberg formulaconcerning the hardening power of quenchants,” Journal ofXi’an Jiaotong University, vol. 36, no. 1, pp. 78–82, 2002.
[11] J. Bodin and S. Segerberg, “Measurement and evaluation ofthe power of quenching media for hardening,” in Proceedingsof the 1st International Conference on Quenching and Controlof Distortion, G. E. Totten, Ed., pp. 1–12, ASM International,Materials Park, Ohio, USA, September 1992.

Submit your manuscripts athttp://www.hindawi.com
ScientificaHindawi Publishing Corporationhttp://www.hindawi.com Volume 2014
CorrosionInternational Journal of
Hindawi Publishing Corporationhttp://www.hindawi.com Volume 2014
Polymer ScienceInternational Journal of
Hindawi Publishing Corporationhttp://www.hindawi.com Volume 2014
Hindawi Publishing Corporationhttp://www.hindawi.com Volume 2014
CeramicsJournal of
Hindawi Publishing Corporationhttp://www.hindawi.com Volume 2014
CompositesJournal of
NanoparticlesJournal of
Hindawi Publishing Corporationhttp://www.hindawi.com Volume 2014
Hindawi Publishing Corporationhttp://www.hindawi.com Volume 2014
International Journal of
Biomaterials
Hindawi Publishing Corporationhttp://www.hindawi.com Volume 2014
NanoscienceJournal of
TextilesHindawi Publishing Corporation http://www.hindawi.com Volume 2014
Journal of
NanotechnologyHindawi Publishing Corporationhttp://www.hindawi.com Volume 2014
Journal of
CrystallographyJournal of
Hindawi Publishing Corporationhttp://www.hindawi.com Volume 2014
The Scientific World JournalHindawi Publishing Corporation http://www.hindawi.com Volume 2014
Hindawi Publishing Corporationhttp://www.hindawi.com Volume 2014
CoatingsJournal of
Advances in
Materials Science and EngineeringHindawi Publishing Corporationhttp://www.hindawi.com Volume 2014
Smart Materials Research
Hindawi Publishing Corporationhttp://www.hindawi.com Volume 2014
Hindawi Publishing Corporationhttp://www.hindawi.com Volume 2014
MetallurgyJournal of
Hindawi Publishing Corporationhttp://www.hindawi.com Volume 2014
BioMed Research International
MaterialsJournal of
Hindawi Publishing Corporationhttp://www.hindawi.com Volume 2014
Nano
materials
Hindawi Publishing Corporationhttp://www.hindawi.com Volume 2014
Journal ofNanomaterials