retirement and investing b = c + i - e. overview basic retirement math benefits = contributions +...
TRANSCRIPT

RETIREMENT AND INVESTING
B = C + I - E

OVERVIEW BASIC RETIREMENT MATH
Benefits = Contributions + Investment – Expenses Should Liabilities be discounted at the risk-free rate?
BASIC INVESTMENT PRINCIPLES Standard Approach – “Modern” Portfolio Theory
Core Index in 5-6 Basic Public Assets for Long Term Survive Short Term Wildness (Manage Liquidity and Leverage) Watch Expenses Avoid the Big Mistake
Did Modern Portfolio Theory Fail? Should everyone be doing hedge funds?
CURRENT INVESTMENT OUTLOOK Stocks OK, Bonds “Dead Money” Should we be scared of the “new normal”?
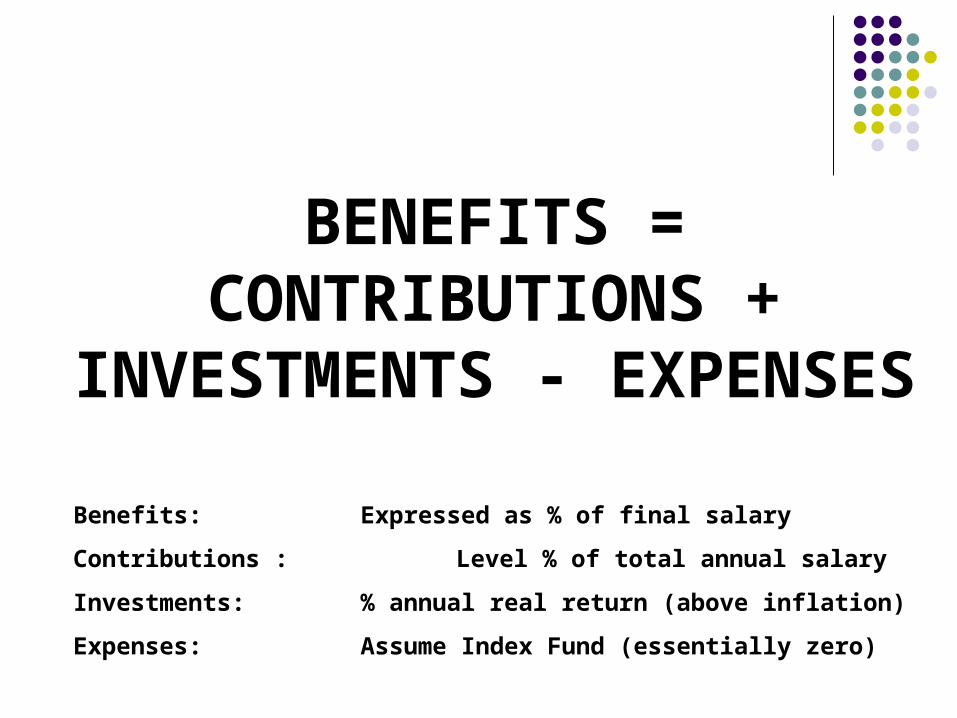
BENEFITS = CONTRIBUTIONS +
INVESTMENTS - EXPENSES
Benefits: Expressed as % of final salary
Contributions : Level % of total annual salary
Investments: % annual real return (above inflation)
Expenses: Assume Index Fund (essentially zero)
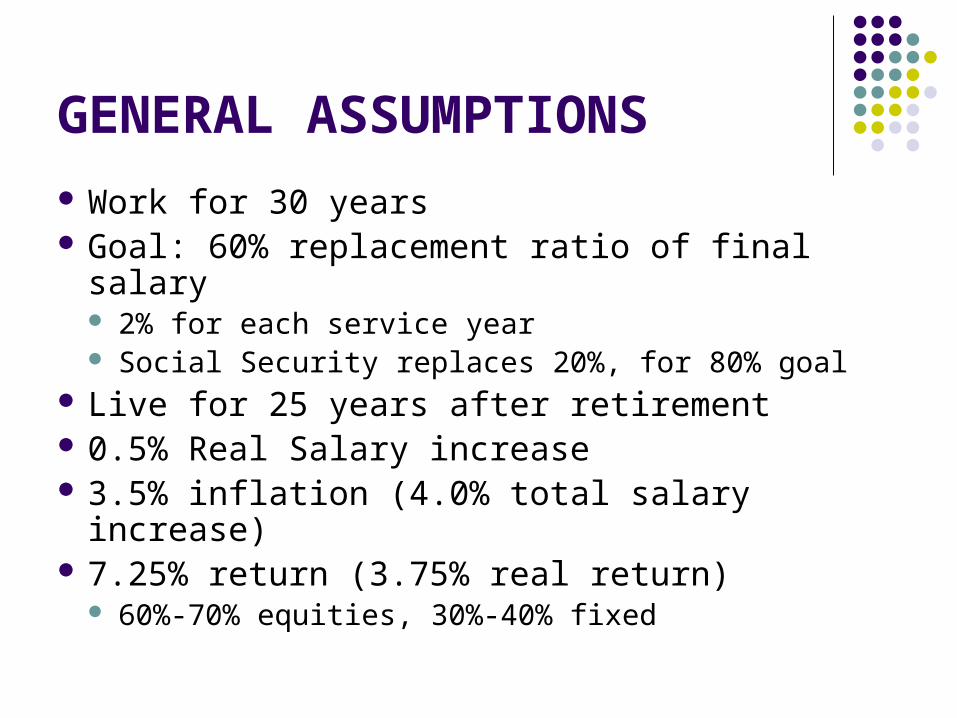
GENERAL ASSUMPTIONS
Work for 30 years Goal: 60% replacement ratio of final salary
2% for each service year Social Security replaces 20%, for 80% goal
Live for 25 years after retirement 0.5% Real Salary increase 3.5% inflation (4.0% total salary increase) 7.25% return (3.75% real return)
60%-70% equities, 30%-40% fixed

AMOUNTS NEEDED FOR EACH $100 OF ENDING SALARY100% Replacement, No inflation, No real salary increase, No COLA
30/30 $3,000
30/25 $2,500
$0
$500
$1,000
$1,500
$2,000
$2,500
$3,000
$3,500
-29
-27
-25
-23
-21
-19
-17
-15
-13
-11 -9 -7 -5 -3 -1 1 3 5 7 9 11 13 15 17 19 21 23 25 27 29
Years from retirement
Cu
mu
lati
ve $
nee
ded
in e
nd
ing
yea
r $
30/30 30/25 Level % of Total Salary
50%
45.5%
B = C BENEFITS = CONTRIBUTIONS
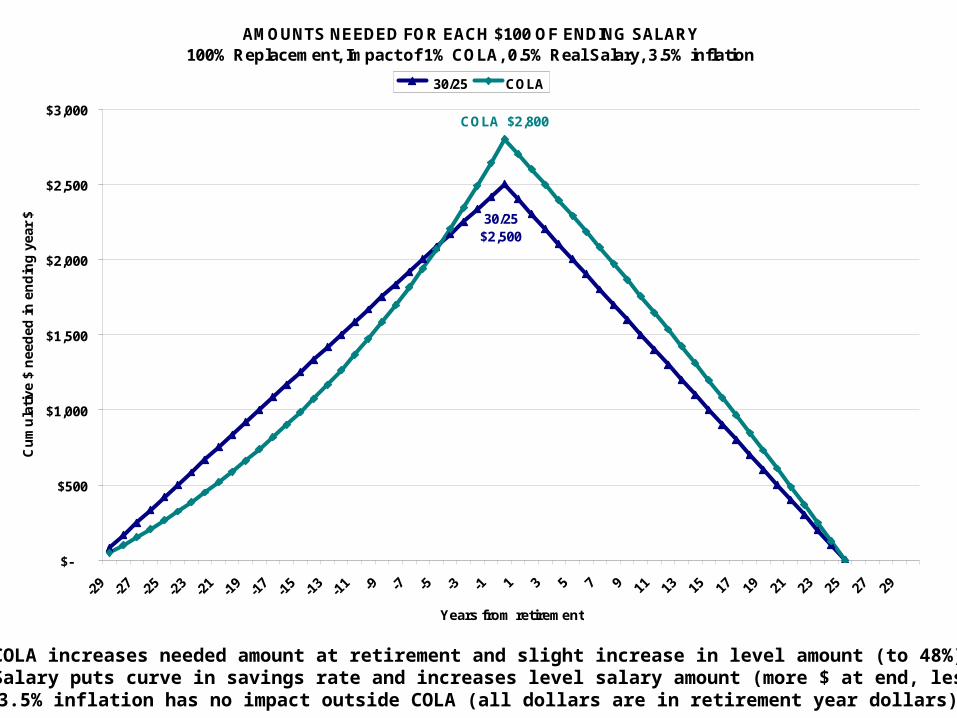
1% COLA increases needed amount at retirement and slight increase in level amount (to 48%). 0.5% Real Salary puts curve in savings rate and increases level salary amount (more $ at end, less $ early)
3.5% inflation has no impact outside COLA (all dollars are in retirement year dollars)
AMOUNTS NEEDED FOR EACH $100 OF ENDING SALARY100% Replacement, Impact of 1% COLA, 0.5% Real Salary, 3.5% inflation
30/25 $2,500
COLA $2,800
$-
$500
$1,000
$1,500
$2,000
$2,500
$3,000
-29
-27
-25
-23
-21
-19
-17
-15
-13
-11 -9 -7 -5 -3 -1 1 3 5 7 9 11 13 15 17 19 21 23 25 27 29
Years from retirement
Cu
mu
lati
ve $
nee
ded
in e
nd
ing
ye
ar $
30/25 COLA Level % of Total Salary
61%
45.5%

B = C ASSUME NO INVESTMENTS BENEFITS = CONTRIBUTIONSDropping 100% replacement to 60% brings savings rate back to 50%
AMOUNTS NEEDED FOR EACH $100 OF ENDING SALARY3.5% inflation, 0.5% real salary increase, 1% COLA
60% replacement $1,800
100% replacement $2,800
$-
$500
$1,000
$1,500
$2,000
$2,500
$3,000
-29
-27
-25
-23
-21
-19
-17
-15
-13
-11 -9 -7 -5 -3 -1 1 3 5 7 9 11 13 15 17 19 21 23 25
Years from retirement
Cu
mu
lati
ve $
nee
ded
in e
nd
ing
yea
r $
Level % of Total Salary
50%
61%

B = C + I ASSUME 7.25% NOMINAL RETURN 3.75% REAL RETURN
AMOUNTS NEEDED FOR EACH $100 OF ENDING SALARY3.5% inflation, 0.5% real salary increase, 1% COLA
3.75% real $838
60% replacement $1,800
$-
$200
$400
$600
$800
$1,000
$1,200
$1,400
$1,600
$1,800
$2,000
-29
-27
-25
-23
-21
-19
-17
-15
-13
-11 -9 -7 -5 -3 -1 1 3 5 7 9 11 13 15 17 19 21 23 25
Years from retirement
Cu
mu
lati
ve $
nee
ded
in e
nd
ing
yea
r $
Level % of Total Salary
14%
50%

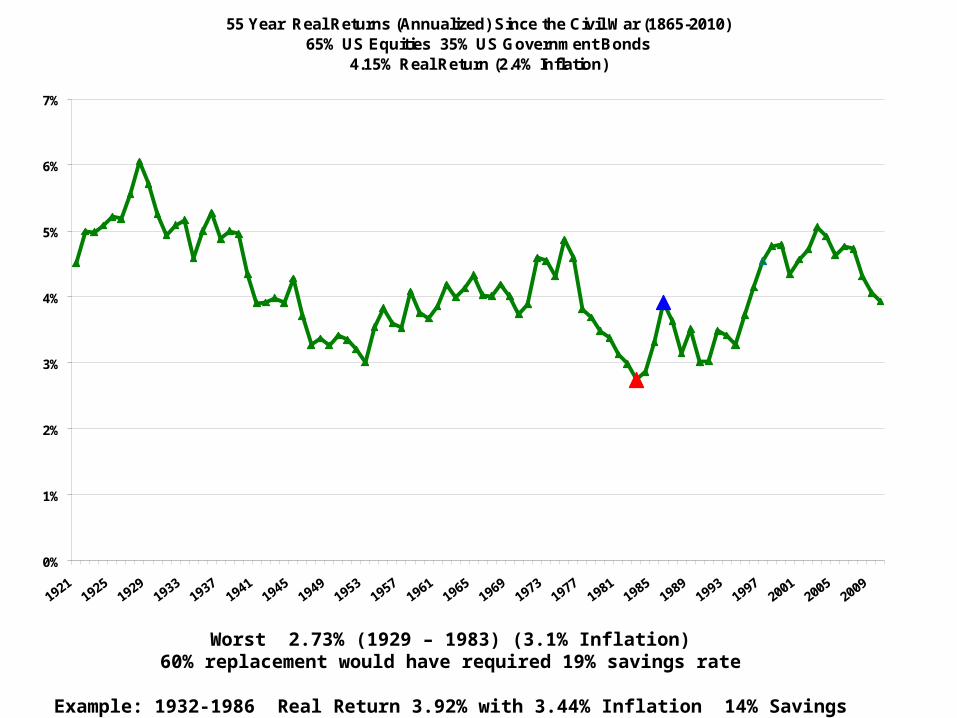
Worst 2.73% (1929 – 1983) (3.1% Inflation)60% replacement would have required 19% savings rate
Example: 1932-1986 Real Return 3.92% with 3.44% Inflation 14% Savings
55 Year Real Returns (Annualized) Since the Civil War (1865-2010)65% US Equities 35% US Government Bonds
4.15% Real Return (2.4% Inflation)
0%
1%
2%
3%
4%
5%
6%
7%
19211925
19291933
19371941
19451949
19531957
19611965
19691973
19771981
19851989
19931997
20012005
2009
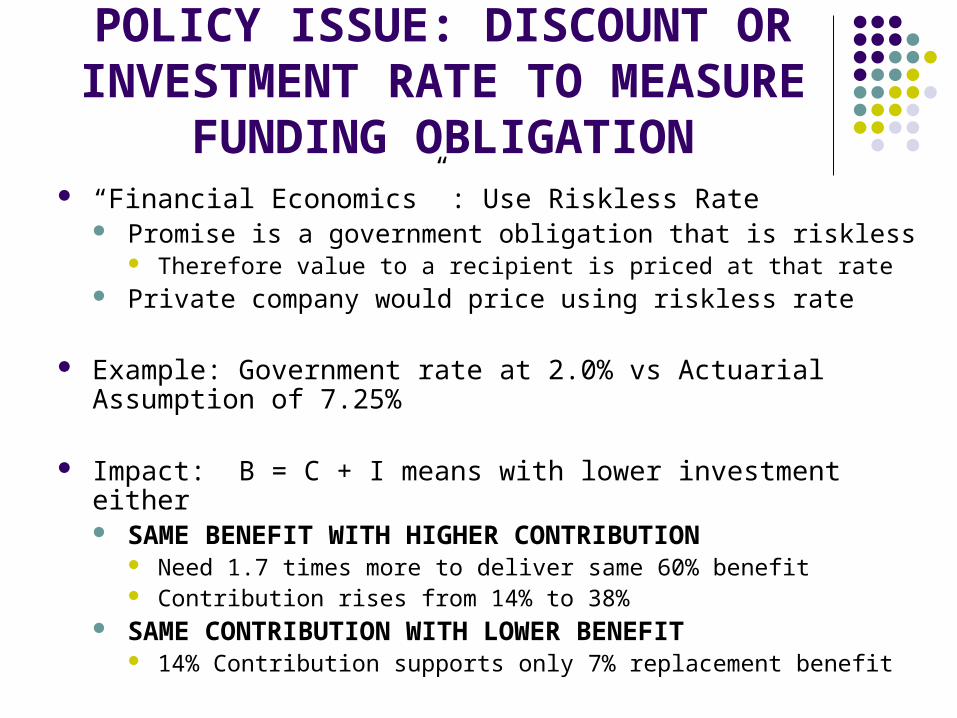
POLICY ISSUE: DISCOUNT OR INVESTMENT RATE TO MEASURE
FUNDING OBLIGATION “Financial Economics” : Use Riskless Rate
Promise is a government obligation that is riskless Therefore value to a recipient is priced at that rate
Private company would price using riskless rate
Example: Government rate at 2.0% vs Actuarial Assumption of 7.25%
Impact: B = C + I means with lower investment either SAME BENEFIT WITH HIGHER CONTRIBUTION
Need 1.7 times more to deliver same 60% benefit Contribution rises from 14% to 38%
SAME CONTRIBUTION WITH LOWER BENEFIT 14% Contribution supports only 7% replacement benefit

IMPACT OF INVESTING AT 2% TREASURY (OR DISCOUNT AT TREASURY)Increase needs by 1.7 times
Option 1: increase contributions by almost 3X
AMOUNTS NEEDED FOR EACH $100 OF ENDING SALARY3.5% inflation, 0.5% real salary increase, 1% COLA
3.75% real $838
2% Treasury $1,413
$-
$200
$400
$600
$800
$1,000
$1,200
$1,400
$1,600
-29
-27
-25
-23
-21
-19
-17
-15
-13
-11 -9 -7 -5 -3 -1 1 3 5 7 9 11 13 15 17 19 21 23 25
Years from retirement
Cu
mu
lati
ve $
nee
ded
in e
nd
ing
ye
ar $
Level % of Total Salary
14%
38%

OPTION 2: REDUCE BENEFITS FROM 60% REPLACEMENT TO 7%
FINANCIAL ECONOMICS: 14 % CONTRIBUTION 2% TREASURY RETURNS60% REPLACEMENT DROPS TO 7% REPLACEMENT
3.75% real 60% replacement $838
2% Treasury 7% Replacement
$365
$0
$200
$400
$600
$800
$1,000
$1,200
$1,400
-29
-27
-25
-23
-21
-19
-17
-15
-13
-11 -9 -7 -5 -3 -1 1 3 5 7 9 11 13 15 17 19 21 23 25
Years from retirement
Cu
mu
lati
ve $
nee
ded
in e
nd
ing
yea
r $
Level % of Total Salary
14%
14%

WOULD GREECE HAVE A LOWER FUNDING NEED?
Financial economics equates “value” or “price” with “funding obligation”
Riskier obligor would have perceived lower funding obligation for same benefit A bonding rate of 34% would value liabilities at near 0, while
government pensions would be large
Shifting obligations from government to individuals would say tiny retirement need – but obviously not true
Should that drive behavior in investing for retirement?

Worst 2.73% (1929 – 1983) (3.1% Inflation)60% replacement would have required 19% savings rate
Example: 1932-1986 Real Return 3.92% with 3.44% Inflation 14% Savings
55 Year Real Returns (Annualized) Since the Civil War (1865-2010)65% US Equities 35% US Government Bonds
4.15% Real Return (2.4% Inflation)
0%
1%
2%
3%
4%
5%
6%
7%
19211925
19291933
19371941
19451949
19531957
19611965
19691973
19771981
19851989
19931997
20012005
2009

INDIVIDUAL ISSUES PRACTICAL: BEHAVIOR
Saving Enough DC Plans put half needed contribution levels
7.5% vs 14% Making Enough
DC Participant returns 2%-4% lower Higher costs and fees Poor portfolio construction and management
THEORETICAL: RISK Mortality Risk Increased Market Risk (particularly in retirement)
DB Plans pool and reduce Mortality and Market risk
Individual needs to save around 5% more to insure against risks

3.5% inflation, 0.5% real salary increase, 1% COLA
AVERAGE 401k EXPERIENCE: 7.5% CONTRIBUTION 2% LOWER RETURNS60% REPLACEMENT DROPS TO 11% REPLACEMENT
3.75% real 25% replacement $411
3.75% real 60% replacement $838
1.75% Real 11% Replacement
$299
$-
$200
$400
$600
$800
$1,000
$1,200
$1,400
-29
-27
-25
-23
-21
-19
-17
-15
-13
-11 -9 -7 -5 -3 -1 1 3 5 7 9 11 13 15 17 19 21 23 25
Years from retirement
Cu
mu
lati
ve $
nee
ded
in e
nd
ing
yea
r $
Level % of Total Salary
14%
7.5%
7.5%
Worst 2.73% (1929 – 1983) (3.1% Inflation)60% replacement would have required 19% savings rate
Example: 1932-1986 Real Return 3.92% with 3.44% Inflation 14% Savings
55 Year Real Returns (Annualized) Since the Civil War (1865-2010)65% US Equities 35% US Government Bonds
4.15% Real Return (2.4% Inflation)
0%
1%
2%
3%
4%
5%
6%
7%
19211925
19291933
19371941
19451949
19531957
19611965
19691973
19771981
19851989
19931997
20012005
2009
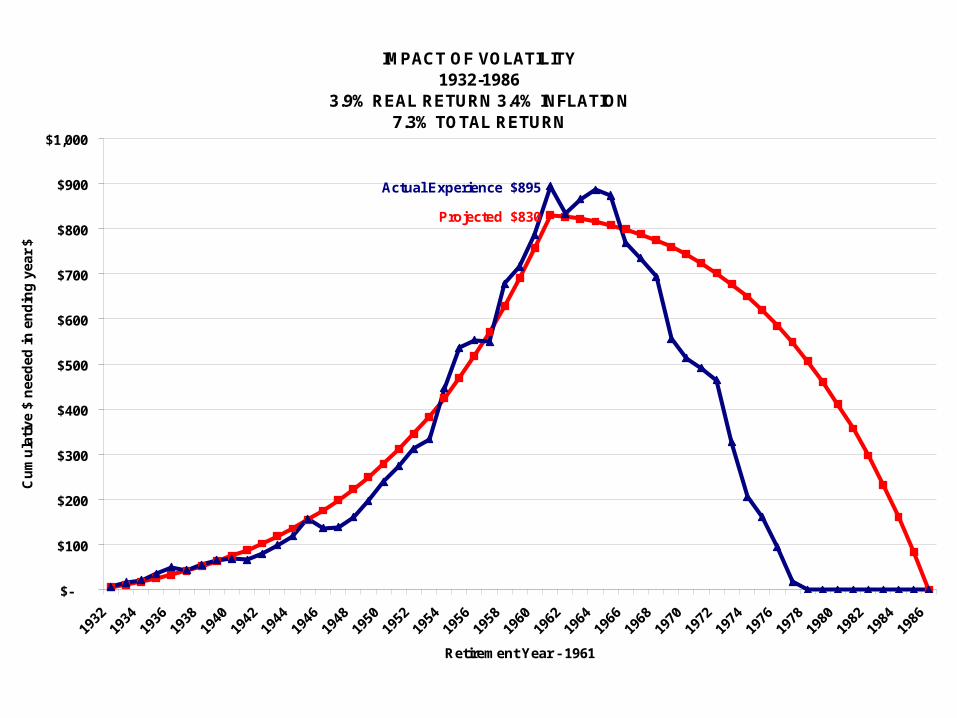
IMPACT OF VOLATILITY1932-1986
3.9% REAL RETURN 3.4% INFLATION 7.3% TOTAL RETURN
Projected $830
Actual Experience $895
$-
$100
$200
$300
$400
$500
$600
$700
$800
$900
$1,000
1932
1934
1936
1938
1940
1942
1944
1946
1948
1950
1952
1954
1956
1958
1960
1962
1964
1966
1968
1970
1972
1974
1976
1978
1980
1982
1984
1986
Retirement Year - 1961
Cu
mu
lati
ve $
nee
ded
in e
nd
ing
yea
r $
Level % of Total Salary
14%14%
Expected Return for 1932-1978 : 7.3% Actual Return: 5.8% (2.5% real)
INDIVIDUAL (AND CLOSED PLAN) FUNDS RAN OUT BEFORE GREAT YEARS
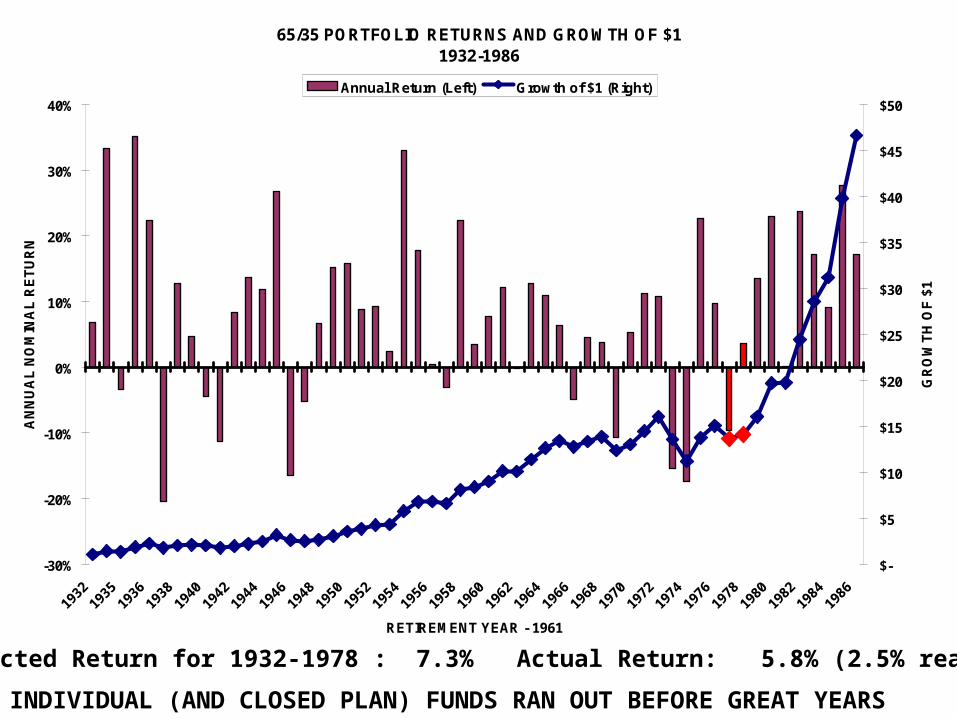
65/35 PORTFOLIO RETURNS AND GROWTH OF $11932-1986
-30%
-20%
-10%
0%
10%
20%
30%
40%
1932
1935
1936
1938
1940
1942
1944
1946
1948
1950
1952
1954
1956
1958
1960
1962
1964
1966
1968
1970
1972
1974
1976
1978
1980
1982
1984
1986
RETIREMENT YEAR - 1961
AN
NU
AL
NO
MIN
AL
RE
TU
RN
$-
$5
$10
$15
$20
$25
$30
$35
$40
$45
$50
GR
OW
TH
OF
$1
Annual Return (Left) Growth of $1 (Right)

0.5% Real Salary Increase 1% COLA
IMPACT OF VOLATILITY1932-1986
NEEDED SAVINGS RATE - 19%NEEDED END ACCOUNT PER $100 FINAL SALARY: $1,281
Projected $830 Actual Experience $895
Needed $1,281
$-
$200
$400
$600
$800
$1,000
$1,200
$1,400
$1,600
1932
1934
1936
1938
1940
1942
1944
1946
1948
1950
1952
1954
1956
1958
1960
1962
1964
1966
1968
1970
1972
1974
1976
1978
1980
1982
1984
1986
Retirement Year - 1961
Cu
mu
lati
ve $
nee
ded
in e
nd
ing
yea
r $
Level % of Total Salary
14%
14%
19%
IS MODERN PORTFOLIO THEORY DEAD?
Daily S&P Price Movem ents 1950-2010
-1 0%
- 8%
- 6%
- 4%
- 2%
0%
2%
4%
6%
8%
1 0%
Jan-
00
May
-00
Sep-
00
Jan-
01
May
-01
Sep
-01
Jan-
02
May
-02
Sep-
02
Jan-
03
May
-03
Sep-
03
Jan-
04
May
-04
Sep
-04
Jan-
05
May
-05
Sep-
05
Jan-
06
May
-06
Sep-
06
Jan-
07
May
-07
Sep-
07
Jan-
08
May
-08
Sep-
08
Jan-
09
May
-09
Sep-
09
Jan-
10
May
-10

BASIC MPT PRINCIPLES Start with Long-Term (5-10 year +) time frame
Modern Portfolio Theory 5-6 Asset Types
US Equities, International Equities, REITS, Emerging Market Equities, US Investment Grade Bonds, TIPS
Core Index
Adjust for Short Term Wildness Survive: Attend to Liquidity Control Leverage Keep Broad Diversification
AVOID THE BIG MISTAKE In order to get market returns, need to be in the markets
Avoid tactical asset allocation NEVER make a major move in the middle of a crisis
Add investments where think have advantage or insight, if any Be careful with active management and fees Beware turnover and related costs KNOW WHAT YOU OWN
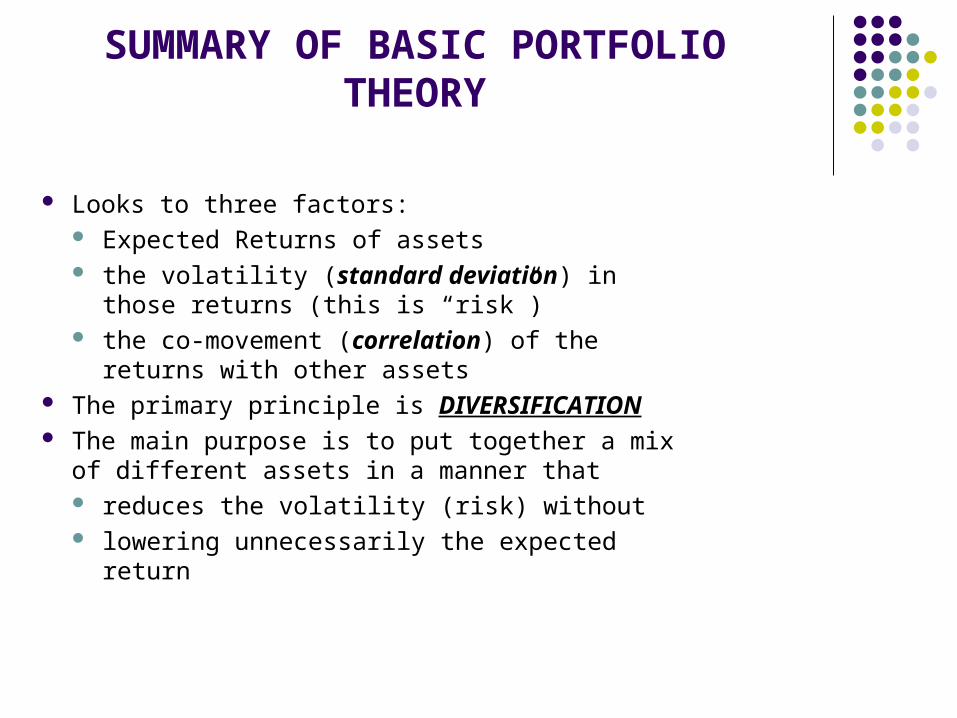
SUMMARY OF BASIC PORTFOLIO THEORY
Looks to three factors: Expected Returns of assets the volatility (standard deviation) in those
returns (this is “risk”) the co-movement (correlation) of the returns
with other assets The primary principle is DIVERSIFICATION The main purpose is to put together a mix of
different assets in a manner that reduces the volatility (risk) without lowering unnecessarily the expected return

ASSUMPTIONS OF MPT:“NORMAL” MARKETS IN LONG TERM
Return is generally linearly related to risk (volatility) Higher returns associated with higher volatility or risk
Returns normally (coin-tossing) random Bell shaped curve – “Gaussian” Allows Standard deviation to be a generally accurate
representation of risk (volatility)
DIVERSIFICATION REDUCES RISK Correlations or co-movements aren’t in lockstep
Holds for long-term (5-10 year rolling time frames)

HISTORIC RETURNS AND RISKS 1926 - 20101 Standard Deviation
49.3%
32.3%
11.2%6.8%
16.7%11.9%
5.5% 3.7%
-15.9%
-8.5%
-0.2% 0.6%
-20%
-10%
0%
10%
20%
30%
40%
50%
60%
Small Stocks32.6%
S&P 50020.4%
Cash3.1%
Bonds5.7%

RETURN GENERALLY FOLLOWS RISK
Large Stocks
Small Stocks
Long GovInt Gov
T-Bills
Long Corp
0%
2%
4%
6%
8%
10%
12%
14%
16%
18%
0% 5% 10% 15% 20% 25% 30% 35%
RISK (Annual Volatility)
RE
TU
RN
(A
rith
me
tic
)
Ibbotsen SBBI 2010 Classic YearbookAnnual Returns

27
Source: Yale University Professor Robert Shiller’s website, as of 12/31/08Past performance is not a guarantee of future results.Rolling periods represent a series of overlapping, smaller time periods within a single, longer-term time period. A hypothetical example is the 20-year time period from 12/31/82 through 12/31/02. This long-term period consists of 16 smaller five-year “rolling” segments. The first segment is the five-year period from 12/31/82 to 12/31/87. The next rolling segment is the five-year period from 12/31/83 to 12/31/88, and so on.
Expected vs Actual Frequency of Annual Returns5 Year Rolling Returns 1871-2008 (log)
0%
5%
10%
15%
20%
25%
30%
-20% -15% -10% -5% 0% 5% 10% 15% 20% 25% 30% 35% 40%
Annual Return (log)
Fre
qu
ency
0%
5%
10%
15%
20%
25%
30%
Expected Actual

SUN RAIN TOTAL
Suntan Lotion, Inc.
60% -40% -4%

SUN RAIN TOTAL
Suntan Lotion, Inc.
60% -40% -4%
Umbrella, Inc.
-50% 70% -15%
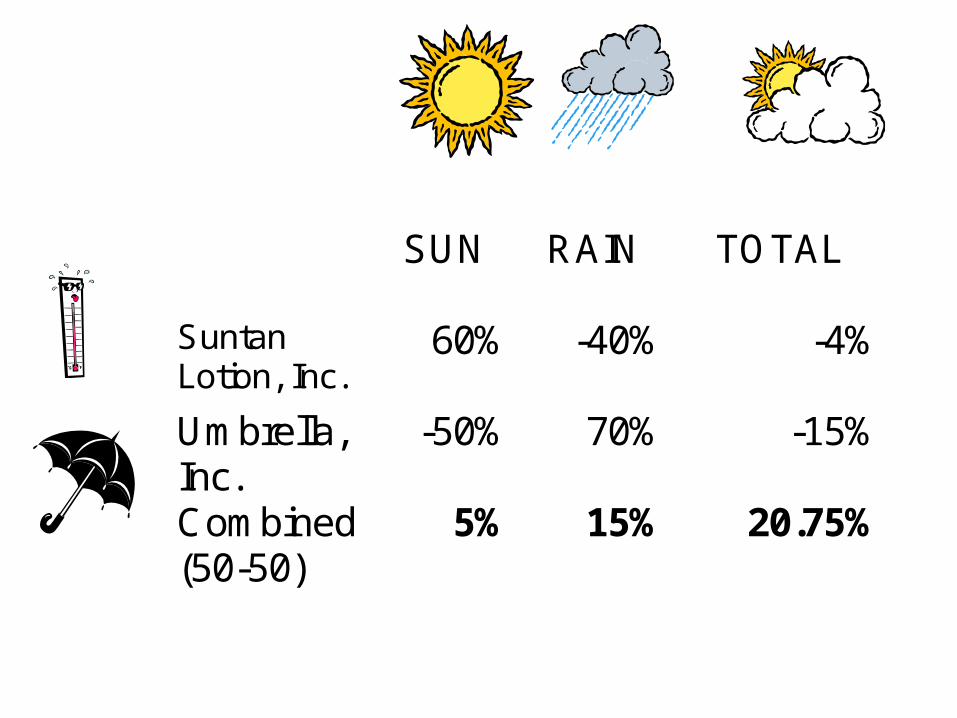
SUN RAIN TOTAL
Suntan Lotion, Inc.
60% -40% -4%
Umbrella, Inc.
-50% 70% -15%
Combined (50-50)
5% 15% 20.75%
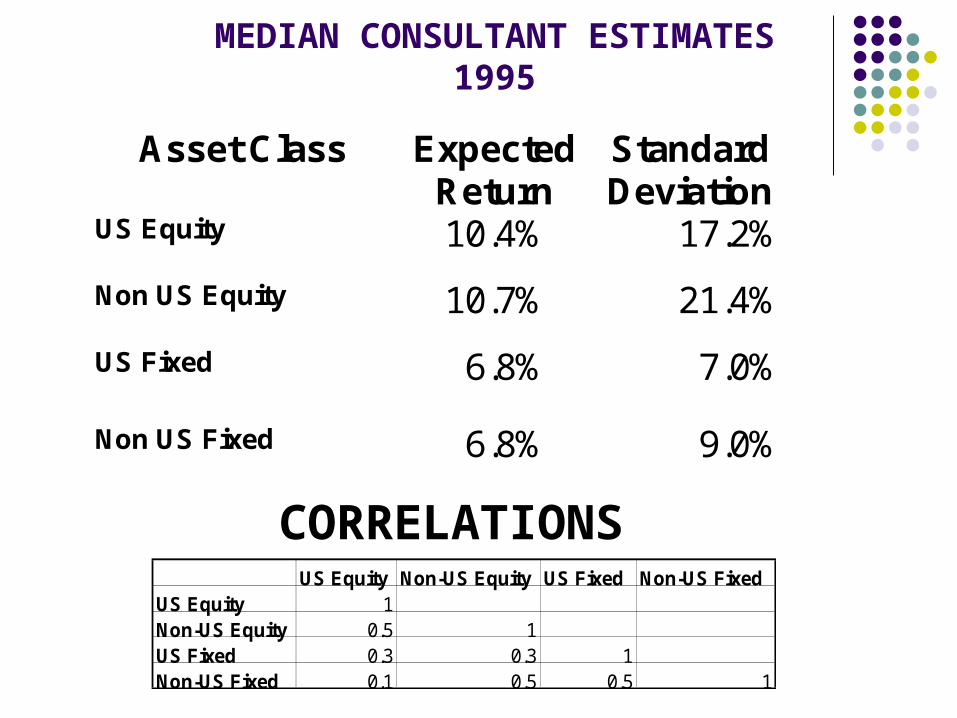
MEDIAN CONSULTANT ESTIMATES1995
Asset Class Expected Return
Standard Deviation
US Equity 10.4% 17.2%
Non US Equity 10.7% 21.4%
US Fixed 6.8% 7.0%
Non US Fixed 6.8% 9.0%
US Equity Non-US Equity US Fixed Non-US FixedUS Equity 1Non-US Equity 0.5 1US Fixed 0.3 0.3 1Non-US Fixed 0.1 0.5 0.5 1
CORRELATIONS
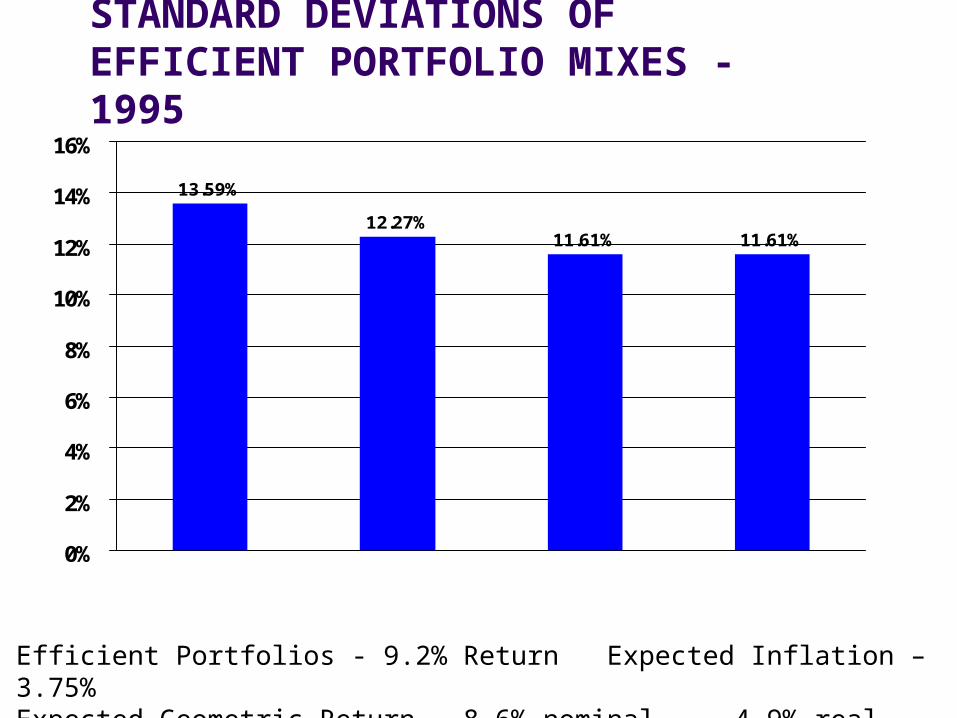
STANDARD DEVIATIONS OFEFFICIENT PORTFOLIO MIXES - 1995
13.59%
12.27%11.61% 11.61%
0%
2%
4%
6%
8%
10%
12%
14%
16%
78% US Stocks
22% Cash
46% US Stocks25% US Bonds
19% EAFE10% Non$Bonds
44% US Stocks35% US Bonds
21% EAFE
66% US Stocks34% US Bonds
Efficient Portfolios - 9.2% Return Expected Inflation – 3.75%Expected Geometric Return – 8.6% nominal 4.9% real

Growth of $1 January 1995 – June 201144% R3000, 21% EAFE, 35% Aggregate8.4% return 10.3% Standard Deviation
Oct-07 $3.34
Apr-11 $3.52
$3.45
$1.00
$1.50
$2.00
$2.50
$3.00
$3.50
$4.00
Jan-9
5
Jan-9
6
Jan-9
7
Jan-9
8
Jan-9
9
Jan-0
0
Jan-0
1
Jan-0
2
Jan-0
3
Jan-0
4
Jan-0
5
Jan-0
6
Jan-0
7
Jan-0
8
Jan-0
9
Jan-1
0
Jan-1
1
FY 2009 - 16.6%FY 2010 12.0%FY 2011 21.7%
2.5% Inflation 7.8% Geometric 5.3% Real
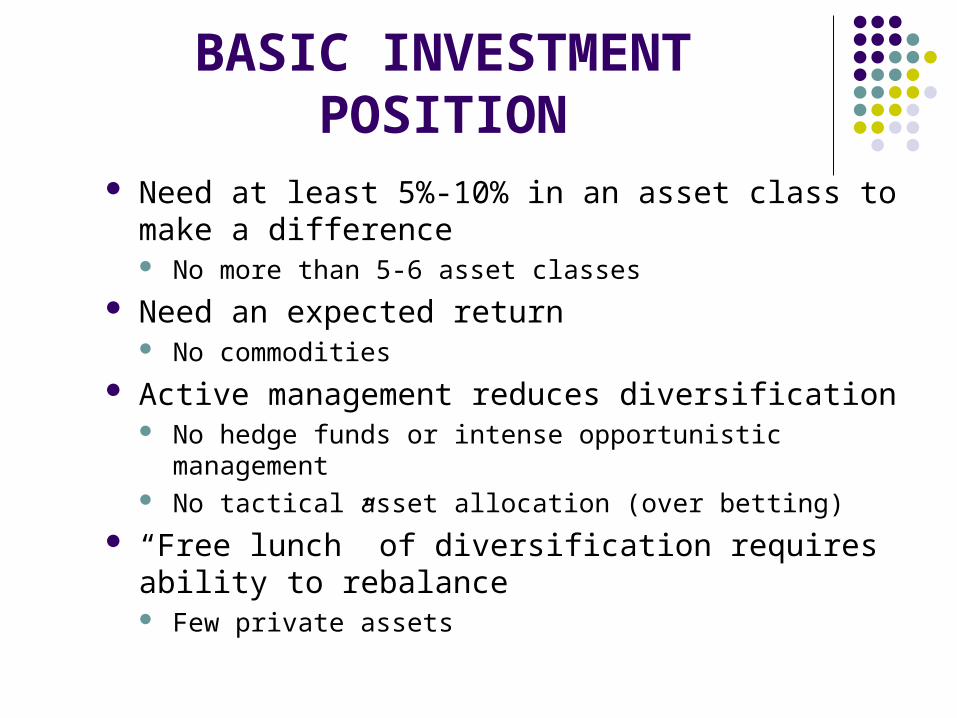
BASIC INVESTMENT POSITION
Need at least 5%-10% in an asset class to make a difference No more than 5-6 asset classes
Need an expected return No commodities
Active management reduces diversification No hedge funds or intense opportunistic management No tactical asset allocation (over betting)
“Free lunch” of diversification requires ability to rebalance Few private assets
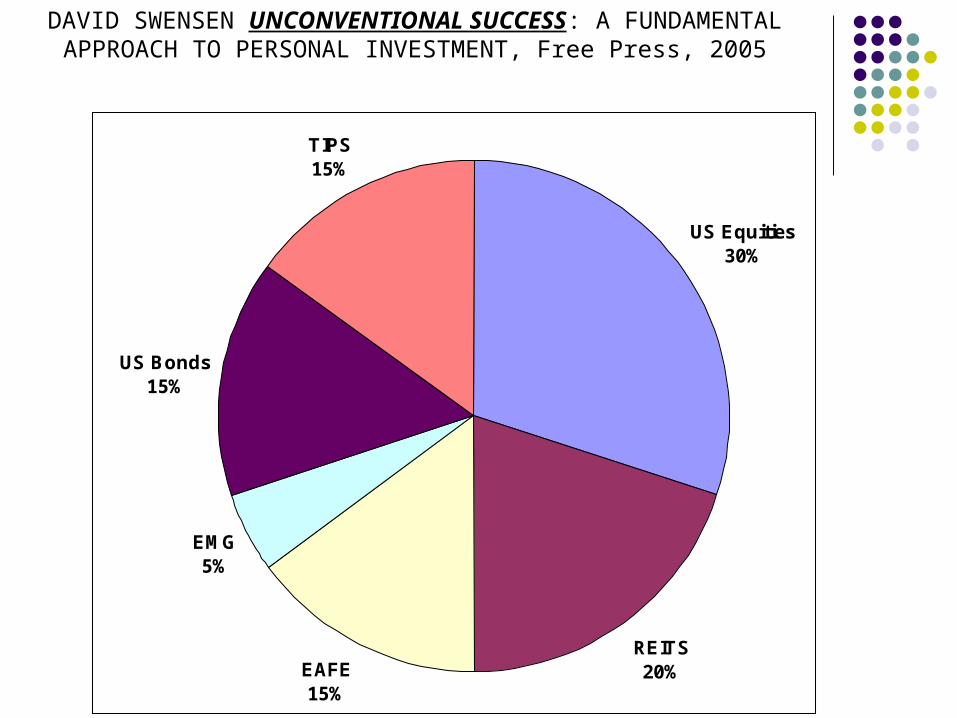
US Equities30%
REITS20%EAFE
15%
EMG5%
US Bonds15%
TIPS15%
DAVID SWENSEN UNCONVENTIONAL SUCCESS: A FUNDAMENTAL APPROACH TO PERSONAL INVESTMENT, Free Press,
2005

44/21/35 Swensen ExpectedGeometric 7.8% 8.9% 8.6%Real 5.3% 6.4% 4.9%
Growth of $1 from January 1995 to June 20118.4% Return 10.32% SD (44/21/35) 9.7% Return 11.39% SD (Swensen) 9.2% Return 11.61% SD (Expected)
44-21-35 $3.45
Swensen $4.12
$1.00
$1.50
$2.00
$2.50
$3.00
$3.50
$4.00
$4.50
Jan-9
5
Jan-9
6
Jan-9
7
Jan-9
8
Jan-9
9
Jan-0
0
Jan-0
1
Jan-0
2
Jan-0
3
Jan-0
4
Jan-0
5
Jan-0
6
Jan-0
7
Jan-0
8
Jan-0
9
Jan-1
0
Jan-1
1
44/21/35 Swensen YaleFY 2009 - 16.6% -22.1% -24.6%FY 2010 12.0% 13.0% 8.9%FY 2011 21.7% 24.2% 21.9%3 Year 13.7% 16.6% 0.1%
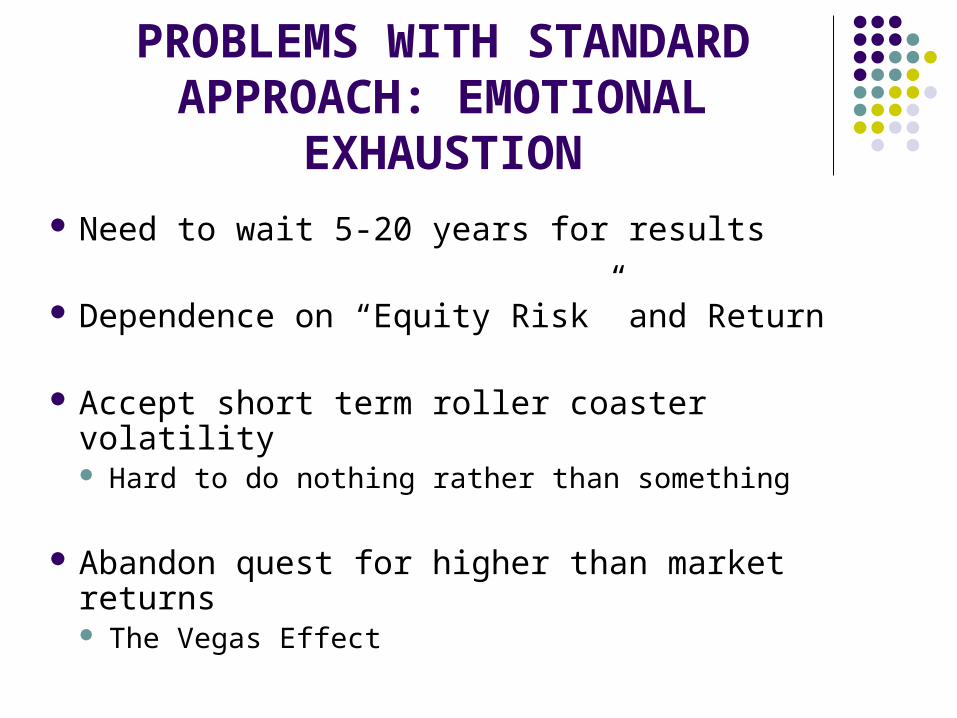
PROBLEMS WITH STANDARD APPROACH: EMOTIONAL
EXHAUSTION
Need to wait 5-20 years for results
Dependence on “Equity Risk” and Return
Accept short term roller coaster volatility Hard to do nothing rather than something
Abandon quest for higher than market returns The Vegas Effect

WHO NEEDS MORE? When Market returns are not enough
Liability needs are more than 3%-5% real Endowments with higher education inflation Pension funds in too big a whole
When 1-5 year “normal” volatility still too high Corporations with quarterly earnings reports Pension funds “near the edge”
If have short term attention span – “CNBC disease” Rotating Boards, CIO’s, Politics, etc.
If have special insight or advantage over others

SHORT TERM “Danger Will Robinson”
The Abnormal is “Normal”
Expect not only the unexpected, but also the impossible

Daily S&P Price Movements 1950-2010
-10%
-8%
-6%
-4%
-2%
0%
2%
4%
6%
8%
10%
Ja
n-0
0
Ma
y-0
0
Se
p-0
0
Ja
n-0
1
Ma
y-0
1
Se
p-0
1
Ja
n-0
2
Ma
y-0
2
Se
p-0
2
Ja
n-0
3
Ma
y-0
3
Se
p-0
3
Ja
n-0
4
Ma
y-0
4
Se
p-0
4
Ja
n-0
5
Ma
y-0
5
Se
p-0
5
Ja
n-0
6
Ma
y-0
6
Se
p-0
6
Ja
n-0
7
Ma
y-0
7
Se
p-0
7
Ja
n-0
8
Ma
y-0
8
Se
p-0
8
Ja
n-0
9
Ma
y-0
9
Se
p-0
9
Ja
n-1
0
Ma
y-1
0

Daily S&P Price Movements 2002-2010
-10%
-8%
-6%
-4%
-2%
0%
2%
4%
6%
8%
10%
Jan
-02
Ap
r-02
Jul-
02
Oct
-02
Jan
-03
Ap
r-03
Jul-
03
Oct
-03
Jan
-04
Ap
r-04
Jul-
04
Oct
-04
Jan
-05
Ap
r-05
Jul-
05
Oct
-05
Jan
-06
Ap
r-06
Jul-
06
Oct
-06
Jan
-07
Ap
r-07
Jul-
07
Oct
-07
Jan
-08
Ap
r-08
Jul-
08
Oct
-08
Jan
-09
Ap
r-09
Jul-
09
Oct
-09
Jan
-10
Ap
r-10
Jul-
10
Dai
ly P
rice
Mo
vem
ent
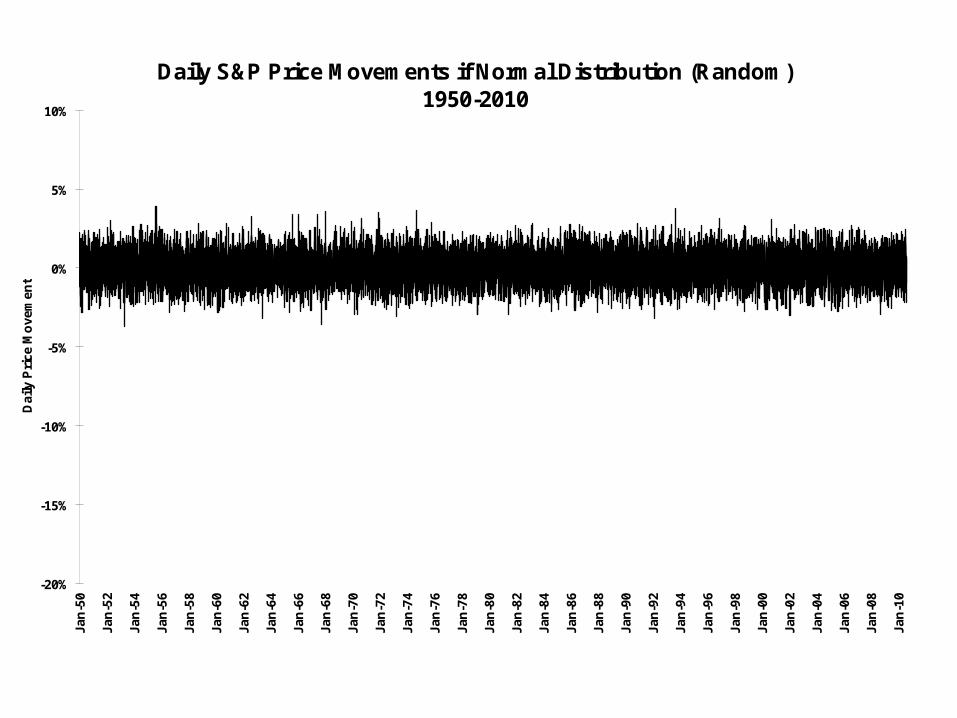
Daily S&P Price Movements if Normal Distribution (Random)1950-2010
-20%
-15%
-10%
-5%
0%
5%
10%
Jan
-50
Jan
-52
Jan
-54
Jan
-56
Jan
-58
Jan
-60
Jan
-62
Jan
-64
Jan
-66
Jan
-68
Jan
-70
Jan
-72
Jan
-74
Jan
-76
Jan
-78
Jan
-80
Jan
-82
Jan
-84
Jan
-86
Jan
-88
Jan
-90
Jan
-92
Jan
-94
Jan
-96
Jan
-98
Jan
-00
Jan
-02
Jan
-04
Jan
-06
Jan
-08
Jan
-10
Dai
ly P
rice
Mo
vem
ent
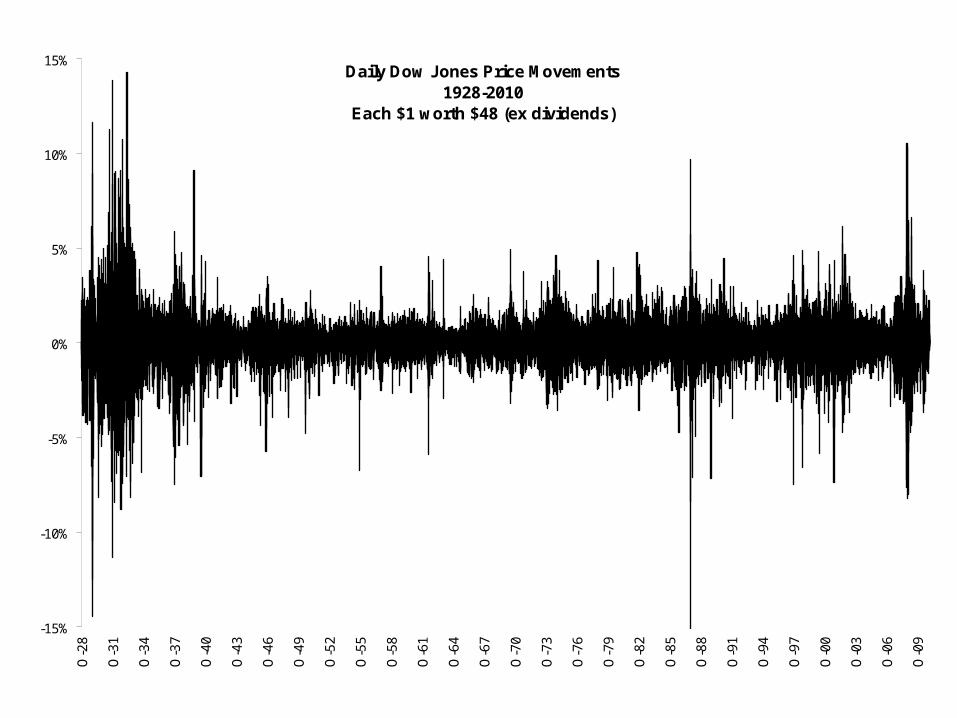
Daily Dow Jones Price Movements1928-2010
Each $1 worth $48 (ex dividends)
-15%
-10%
-5%
0%
5%
10%
15%
O-2
8
O-3
1
O-3
4
O-3
7
O-4
0
O-4
3
O-4
6
O-4
9
O-5
2
O-5
5
O-5
8
O-6
1
O-6
4
O-6
7
O-7
0
O-7
3
O-7
6
O-7
9
O-8
2
O-8
5
O-8
8
O-9
1
O-9
4
O-9
7
O-0
0
O-0
3
O-0
6
O-0
9
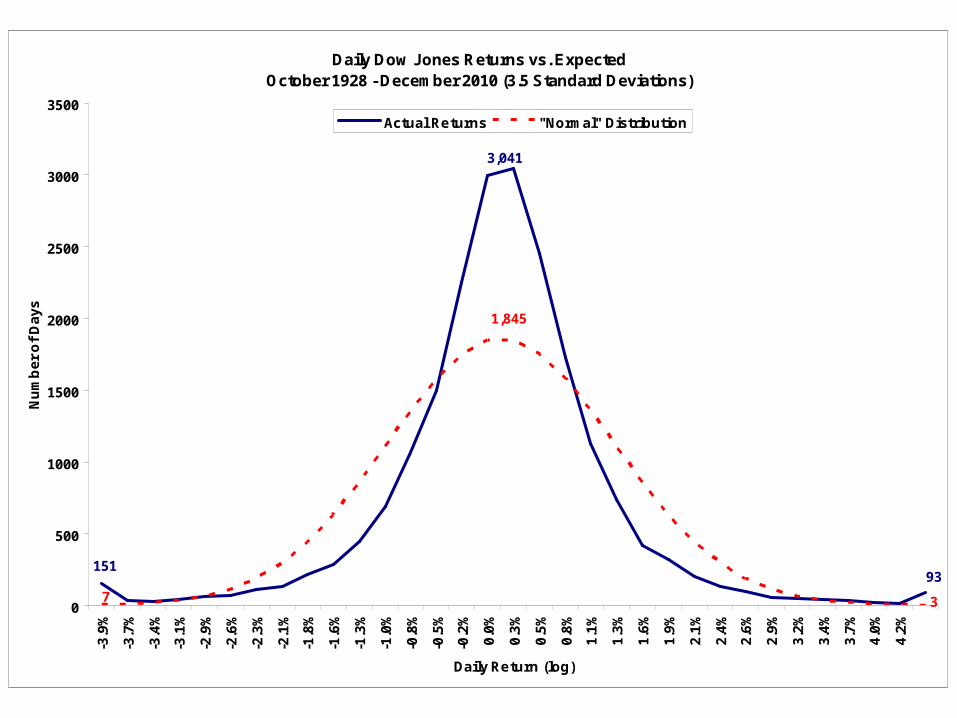
Daily Dow Jones Returns vs. ExpectedOctober 1928 - December 2010 (3.5 Standard Deviations)
93151
3,041
7 3
1,845
0
500
1000
1500
2000
2500
3000
3500-3
.9%
-3.7
%
-3.4
%
-3.1
%
-2.9
%
-2.6
%
-2.3
%
-2.1
%
-1.8
%
-1.6
%
-1.3
%
-1.0
%
-0.8
%
-0.5
%
-0.2
%
0.0
%
0.3
%
0.5
%
0.8
%
1.1
%
1.3
%
1.6
%
1.9
%
2.1
%
2.4
%
2.6
%
2.9
%
3.2
%
3.4
%
3.7
%
4.0
%
4.2
%
Daily Return (log)
Nu
mb
er
of
Da
ys
Actual Returns "Normal" Distribution
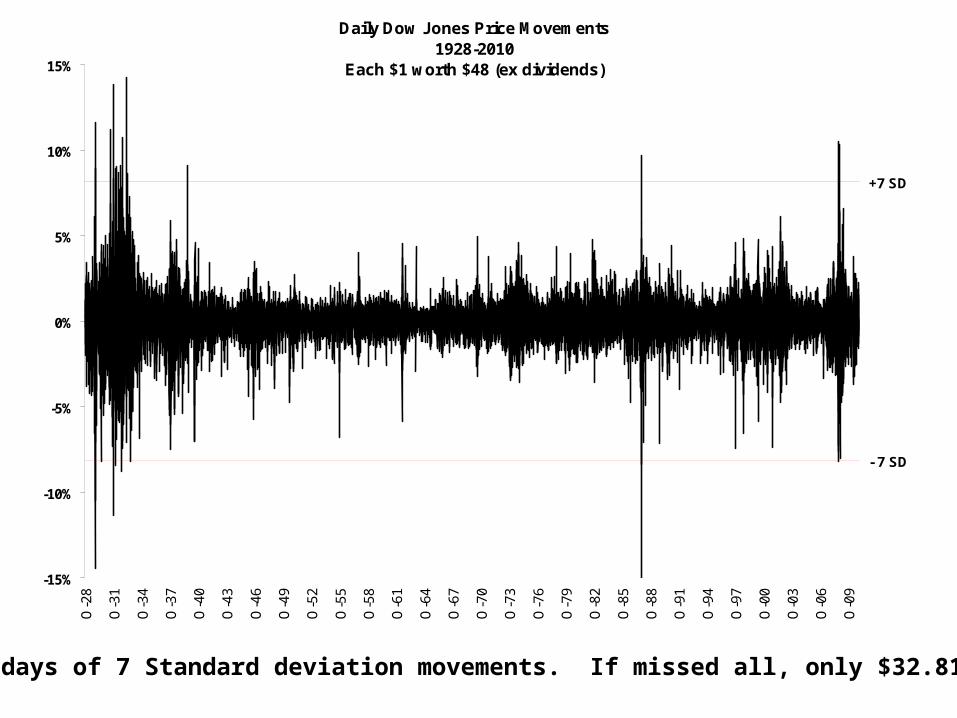
Daily Dow Jones Price Movements1928-2010
Each $1 worth $48 (ex dividends)
+7 SD
- 7 SD
-15%
-10%
-5%
0%
5%
10%
15%
O-2
8
O-3
1
O-3
4
O-3
7
O-4
0
O-4
3
O-4
6
O-4
9
O-5
2
O-5
5
O-5
8
O-6
1
O-6
4
O-6
7
O-7
0
O-7
3
O-7
6
O-7
9
O-8
2
O-8
5
O-8
8
O-9
1
O-9
4
O-9
7
O-0
0
O-0
3
O-0
6
O-0
9
27 days of 7 Standard deviation movements. If missed all, only $32.81
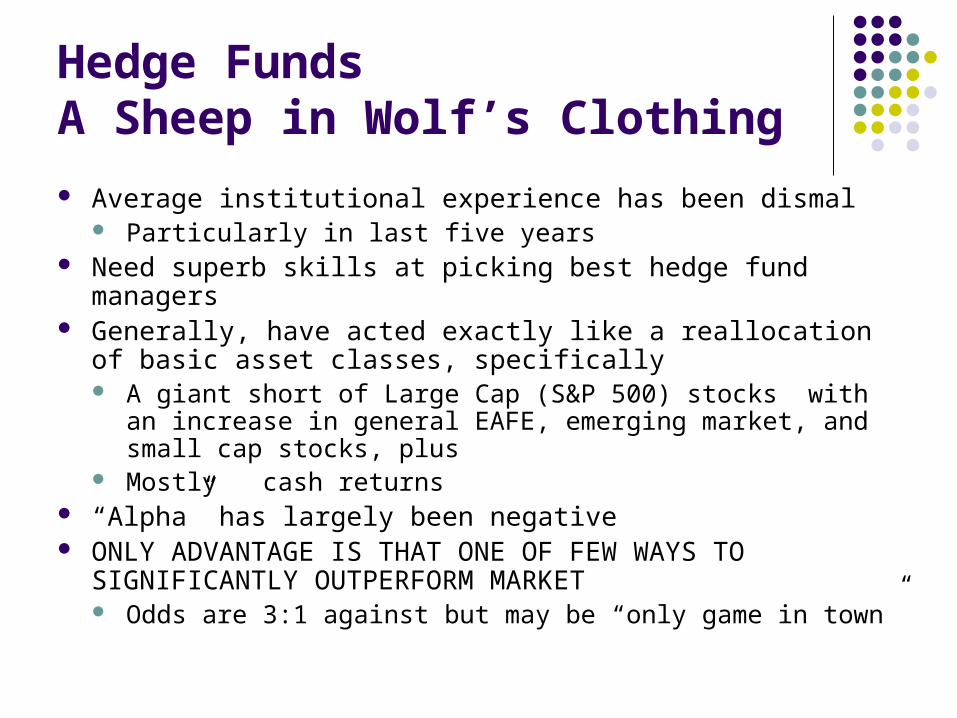
Hedge FundsA Sheep in Wolf’s Clothing
Average institutional experience has been dismal Particularly in last five years
Need superb skills at picking best hedge fund managers Generally, have acted exactly like a reallocation of basic asset
classes, specifically A giant short of Large Cap (S&P 500) stocks with an increase in
general EAFE, emerging market, and small cap stocks, plus Mostly cash returns
“Alpha” has largely been negative ONLY ADVANTAGE IS THAT ONE OF FEW WAYS TO
SIGNIFICANTLY OUTPERFORM MARKET Odds are 3:1 against but may be “only game in town”
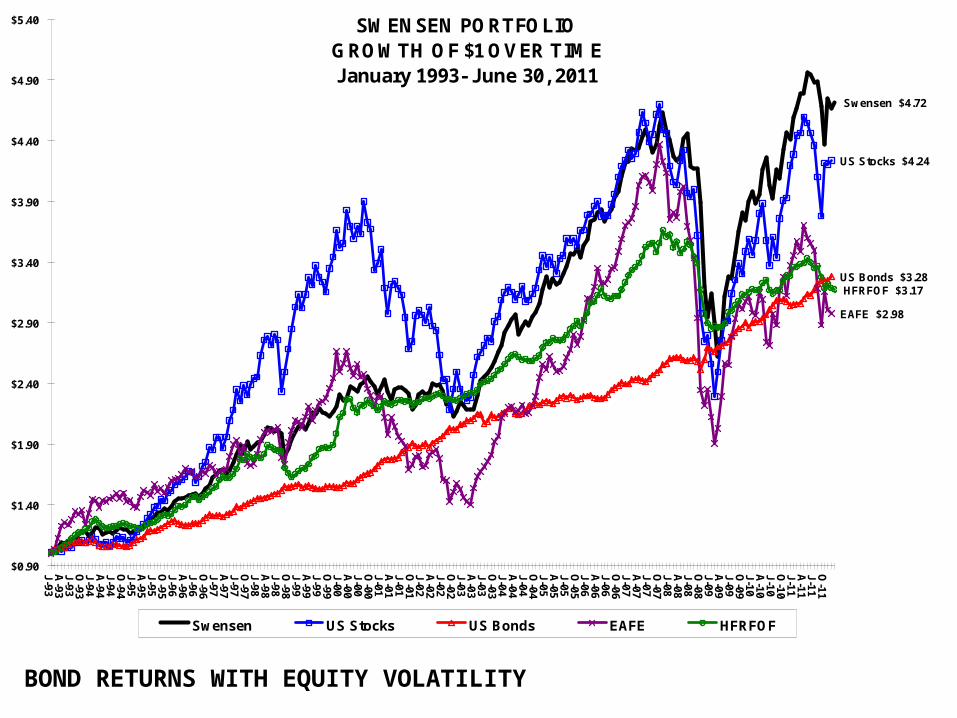
BOND RETURNS WITH EQUITY VOLATILITY
SWENSEN PORTFOLIOGROWTH OF $1 OVER TIMEJanuary 1993- June 30, 2011
Swensen $4.72
US Stocks $4.24
US Bonds $3.28
EAFE $2.98
HFRFOF $3.17
$0.90
$1.40
$1.90
$2.40
$2.90
$3.40
$3.90
$4.40
$4.90
$5.40
J-93A
-93J-93O
-93J-94A
-94J-94O
-94J-95A
-95J-95O
-95J-96A
-96J-96O
-96J-97A
-97J-97O
-97J-98A
-98J-98O
-98J-99A
-99J-99O
-99J-00A
-00J-00O
-00J-01A
-01J-01O
-01J-02A
-02J-02O
-02J-03A
-03J-03O
-03J-04A
-04J-04O
-04J-05A
-05J-05O
-05J-06A
-06J-06O
-06J-07A
-07J-07O
-07J-08A
-08J-08O
-08J-09A
-09J-09O
-09J-10A
-10J-10O
-10J-11A
-11J-11O
-11
Swensen US Stocks US Bonds EAFE HFRFOF

Excess Returns to 55% Russell 3000 / 15% EAFE / 30% AggregateHFR Fund of Funds vs S&P 500
1993-2011
HFR Excess -79%
S&P Excess 23%
-100%
-50%
0%
50%
100%
150%
Jan-9
3
Jan-9
4
Jan-9
5
Jan-9
6
Jan-9
7
Jan-9
8
Jan-9
9
Jan-0
0
Jan-0
1
Jan-0
2
Jan-0
3
Jan-0
4
Jan-0
5
Jan-0
6
Jan-0
7
Jan-0
8
Jan-0
9
Jan-1
0
Jan-1
1
HFR Excess S&P Excess

GROWTH OF $1 OVER PAST FIVE YEARS
HFRXGL, $0.87
PERSI $1.19
HFRXM $0.92
HFRXAR $0.85
HFRXEH $0.77
$0.50
$0.60
$0.70
$0.80
$0.90
$1.00
$1.10
$1.20
$1.30
Mar
-07
Jun-0
7
Sep-0
7
Dec-0
7
Mar
-08
Jun-0
8
Sep-0
8
Dec-0
8
Mar
-09
Jun-0
9
Sep-0
9
Dec-0
9
Mar
-10
Jun-1
0
Sep-1
0
Dec-1
0
Mar
-11
Jun-1
1
Sep-1
1
Dec-1
1
HFRXGL PERSI HFRXM HFRXAR HFRXEH

GROWTH OF $1 OVER PAST FIVE YEARS
HFRXGL, $0.87
PERSI, $1.19
R3000, $1.09
EAFE, $0.88
AGG $1.36
$0.50
$0.60
$0.70
$0.80
$0.90
$1.00
$1.10
$1.20
$1.30
$1.40
$1.50
Mar
-07
Jun-0
7
Sep-0
7
Dec-0
7
Mar
-08
Jun-0
8
Sep-0
8
Dec-0
8
Mar
-09
Jun-0
9
Sep-0
9
Dec-0
9
Mar
-10
Jun-1
0
Sep-1
0
Dec-1
0
Mar
-11
Jun-1
1
Sep-1
1
Dec-1
1
HFRXGL PERSI R3000 EAFE AGG

WORLD REBALANCING Great Deleveraging continues
World is Restructuring US Debt reduction and consolidation Europe fiscal integration China and developing world rebalancing
economies between exports and consumption
Process will take years, not months

BASIC CAPITAL MARKET CONCEPTS EXPECTATIONS
Not Current Conditions Current Expectations Moderate
PROFITS Not general economy Good balance sheets, lean operating conditions,
growth overseas (x Europe), little pressure on labor costs
RELATIVE VALUE Not absolute value in itself What are people willing to pay for expected earnings Current alternative – bonds -- unattractive

Current and Expected Yield Curves in 5 Yrs
-1.5%
-1.0%
-0.5%
0.0%
0.5%
1.0%
1.5%
2.0%
2.5%
3.0%
3.5%
Current TIPS -0.8% -0.8% -0.9% -1.0% -1.0% -0.9% -0.8% -0.6% -0.4% -0.2% -0.1% 0.6% 0.8%
Current Treasury 0.0% 0.1% 0.1% 0.3% 0.4% 0.6% 0.9% 1.4% 1.6% 1.8% 2.0% 2.7% 2.9%
TIPS in 5 -0.2% -0.2% -0.1% 0.0% 0.3% 0.5% 0.6% 0.7% 0.7% 0.7% 0.8% 1.1% 1.1%
Treasury in 5 2.5% 2.6% 2.7% 2.8% 2.9% 2.9% 3.0% 3.1% 3.1% 3.1% 3.1% 3.1% 3.0%
3M 6M 1Y 2Y 3Y 4Y 5Y 7Y 8Y 9Y 10Y 20Y 30Y
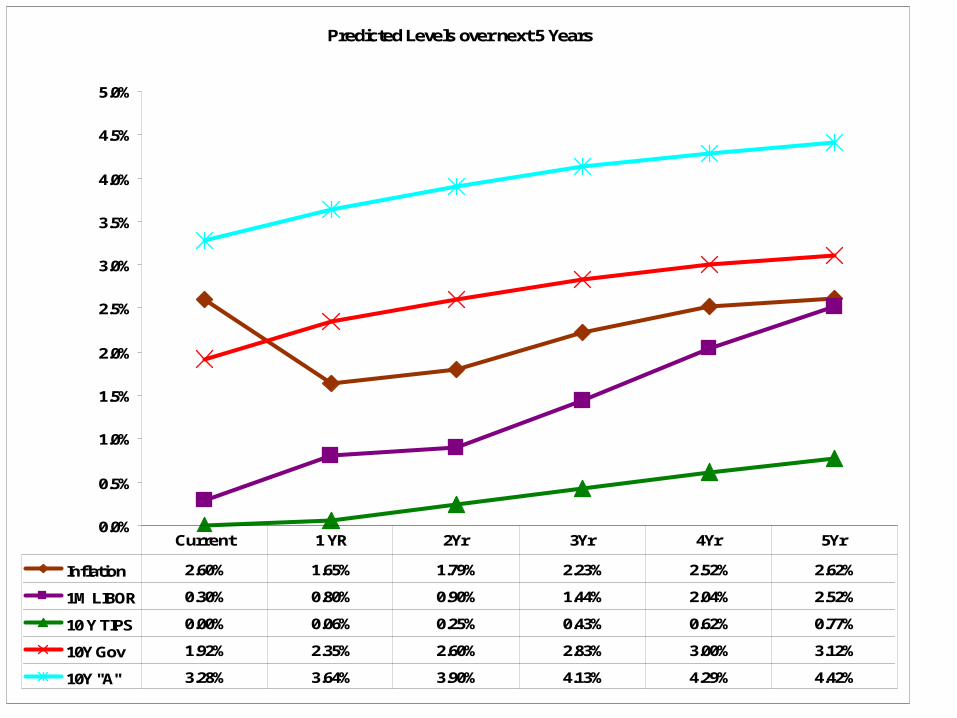
Predicted Levels over next 5 Years
0.0%
0.5%
1.0%
1.5%
2.0%
2.5%
3.0%
3.5%
4.0%
4.5%
5.0%
Inflation 2.60% 1.65% 1.79% 2.23% 2.52% 2.62%
1M LIBOR 0.30% 0.80% 0.90% 1.44% 2.04% 2.52%
10 Y TIPS 0.00% 0.06% 0.25% 0.43% 0.62% 0.77%
10Y Gov 1.92% 2.35% 2.60% 2.83% 3.00% 3.12%
10Y "A" 3.28% 3.64% 3.90% 4.13% 4.29% 4.42%
Current 1 YR 2Yr 3Yr 4Yr 5Yr
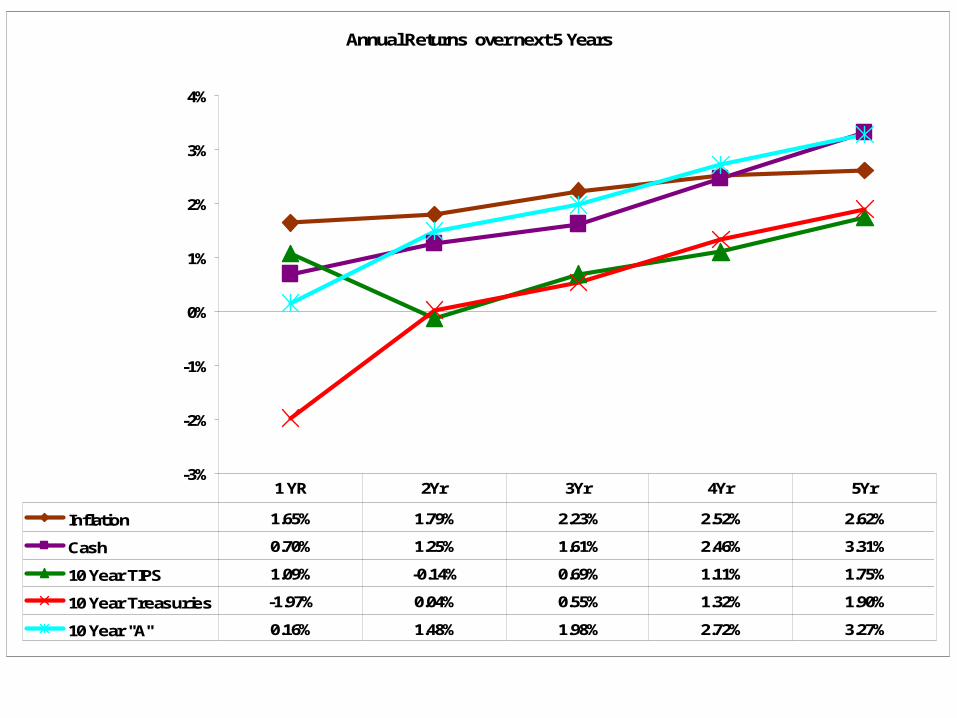
Annual Returns over next 5 Years
-3%
-2%
-1%
0%
1%
2%
3%
4%
Inflation 1.65% 1.79% 2.23% 2.52% 2.62%
Cash 0.70% 1.25% 1.61% 2.46% 3.31%
10 Year TIPS 1.09% -0.14% 0.69% 1.11% 1.75%
10 Year Treasuries -1.97% 0.04% 0.55% 1.32% 1.90%
10 Year "A" 0.16% 1.48% 1.98% 2.72% 3.27%
1 YR 2Yr 3Yr 4Yr 5Yr

Expected 10 Year Stock Return and Sources(Assumes Current P/E and Corp Profit Share of GDP remains the same)
2.1%2.6%
2.1% 2.4%
9.3%
10.8%
13.3%
0%
2%
4%
6%
8%
10%
12%
14%
Real GDP Inflation Dividend Buy Back Total WAC Equty 4Y Growth&Div
Current P/E Ratio (13.1) will probably riseCorporate Profit Share of GDP (12.9%) will probably drop

5 Year Expected Returns to Assets (Annualized)
2.4%
1.0%0.4%
-0.6%-0.9%
10.8%
-2%
0%
2%
4%
6%
8%
10%
12%
Inflation Cash 10 Year TIPS 10 YearTreasuries
10 Year "A" Equity
Expected Geometric Returns Expected 70/30 Return: 7.6% Nominal 5.2% Real

US GDP
(Billions)
Profits
(Billions)
S&P 500 EPS
S&P 500 Price
P/E Ratio
2001
(1/1)
$10,130 $ 790 $54.44 1320 24.3
2011
(9/30)
$15,181 $1,977 $94.81 1131 11.9
% CHANGE 2001-2011
50%
150%
74%
-14%
-51%
-100%
-50%
0%
50%
100%
150%
200%
US GDP CorporateProfits
S&P 500EPS
S&P 500Price
S&P 500P/E