retek assort 10 - oracle help center retek assort – assortment and space optimization chapter 4...
TRANSCRIPT
Retek® Assort 10.1
Assortment and Space Optimization
User Guide
Retek Assort – Assortment and Space Optimization
Retek® Confidential
The software described in this documentation is furnished under a license agreement, is the confidential information of Retek Inc., and may be used only in accordance with the terms of the agreement.
No part of this documentation may be reproduced or transmitted in any form or by any means without the express written permission of Retek Inc., Retek on the Mall, 950 Nicollet Mall, Minneapolis, MN 55403, and the copyright notice may not be removed without the consent of Retek Inc.
Information in this documentation is subject to change without notice.
Retek provides product documentation in a read-only-format to ensure content integrity. Retek Customer Support cannot support documentation that has been changed without Retek authorization.
Retek® Assort™is a trademark of Retek Inc.
Retek and the Retek logo are registered trademarks of Retek Inc.
This unpublished work is protected by confidentiality agreement, and by trade secret, copyright, and other laws. In the event of publication, the following notice shall apply:
©2003 Retek Inc. All rights reserved.
All other product names mentioned are trademarks or registered trademarks of their respective owners and should be treated as such.
Printed in the United States of America.
Corporate Headquarters: Retek Inc.
Retek on the Mall
950 Nicollet Mall
Minneapolis, MN 55403
888.61.RETEK (toll free US)
+1 612 587 5000 European Headquarters: Retek
110 Wigmore Street
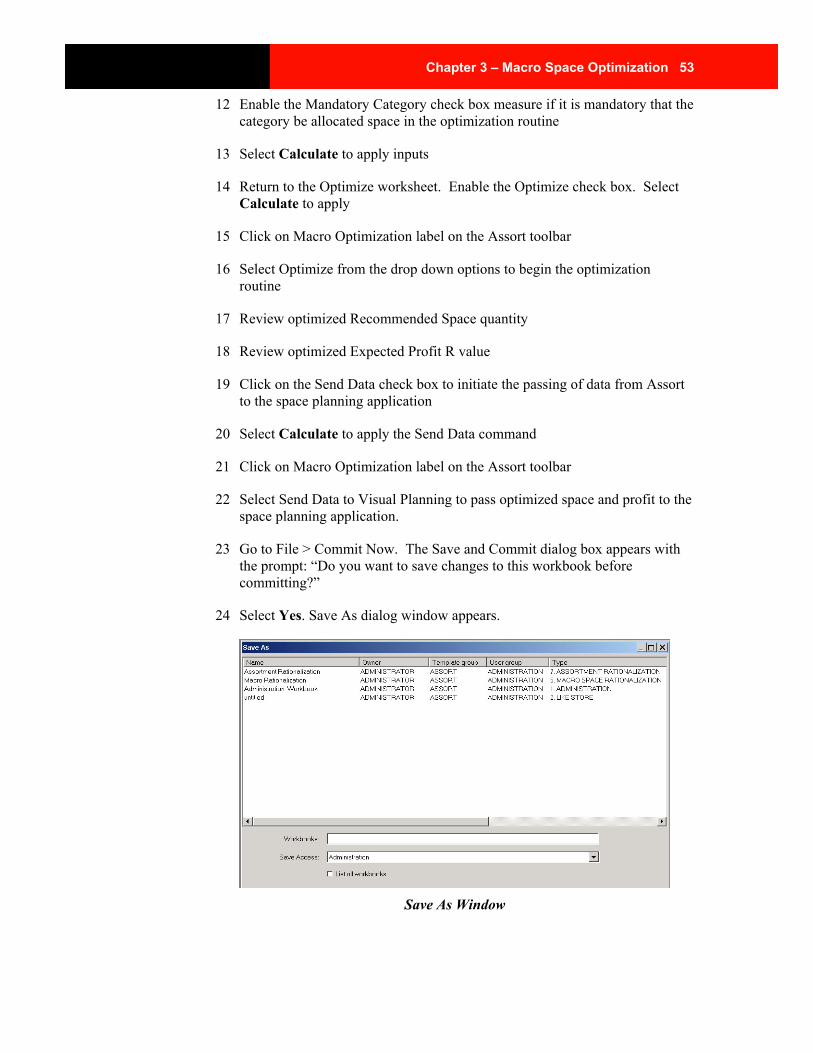
London
W1U 3RW
United Kingdom
Switchboard:
+44 (0)20 7563 4600
Sales Enquiries:
+44 (0)20 7563 46 46
Fax: +44 (0)20 7563 46 10
Customer Support
Customer Support hours:
Customer Support is available 7x24x365 via e-mail, phone, and Web access.
Depending on the Support option chosen by a particular client (Standard, Plus, or Premium), the times that certain services are delivered may be restricted. Severity 1 (Critical) issues are addressed on a 7x24 basis and receive continuous attention until resolved, for all clients on active maintenance.
Contact Method Contact Information
Internet (ROCS) www.retek.com/support Retek’s secure client Web site to update and view issues
E-mail [email protected]
Phone US & Canada: 1-800-61-RETEK (1-800-617-3835) World: +1 612-587-5800 EMEA: 011 44 1223 703 444 Asia Pacific: 61 425 792 927
Mail Retek Customer Support Retek on the Mall 950 Nicollet Mall Minneapolis, MN 55403
When contacting Customer Support, please provide:
• Product version and program/module name.
• Functional and technical description of the problem (include business impact).
• Detailed step by step instructions to recreate.
• Exact error message received.
• Screen shots of each step you take.

Contents i
Contents Chapter 1 – Introduction......................................................... 1
Assort business process....................................................................................... 2 Macro Rationalization ................................................................................................ 2 Macro Space Optimization ......................................................................................... 4 Assortment Rationalization ........................................................................................ 5 Assortment Optimization............................................................................................ 7
About Measures................................................................................................. 11 Roles ......................................................................................................................... 11 Versions.................................................................................................................... 11 Metrics...................................................................................................................... 12 Units of Measure ...................................................................................................... 12
Getting started ................................................................................................... 14 Navigating the main menu........................................................................................ 14
Chapter 2 – Macro Rationalization....................................... 19
Create Macro Rationalization Workbook ......................................................... 19 Toolbar buttons......................................................................................................... 23 Menu options ............................................................................................................ 24
Macro Rationalization workflow tabs ............................................................... 25 Consumer Analysis................................................................................................... 26 Competitive Intelligence........................................................................................... 28 Category Analysis .................................................................................................... 30 Net Margin Analysis................................................................................................. 32 Vendor Analysis ....................................................................................................... 34 Vendor Net Margin Analysis.................................................................................... 36 Category Scorecard .................................................................................................. 38
What’s next ....................................................................................................... 39
Chapter 3 – Macro Space Optimization............................... 41
Create Macro Space Optimization Workbook .................................................. 41 Toolbar buttons......................................................................................................... 44 Menu options ............................................................................................................ 45
Macro Space Optimization workflow tabs........................................................ 46 Determine Optimal Space / Profit ............................................................................ 46 Review Store Results................................................................................................ 51
What’s next ....................................................................................................... 55
ii Retek Assort – Assortment and Space Optimization
Chapter 4 – Assortment Rationalization ............................. 57
Create Assortment Rationalization Workbook ................................................. 57 Toolbar buttons......................................................................................................... 60 Menu options ............................................................................................................ 61
Assortment Rationalization workflow tabs ....................................................... 62 Identify Placeholders ................................................................................................ 63 Brand Analysis ......................................................................................................... 64 Feature Analysis ....................................................................................................... 68 Performance Analysis............................................................................................... 72 Net Margin Analysis................................................................................................. 74 Item Scorecard.......................................................................................................... 76
What’s next ....................................................................................................... 79
Chapter 5 – Assortment Optimization ................................. 81
Create Assortment Optimization Workbook..................................................... 81 Toolbar buttons......................................................................................................... 84 Menu options ............................................................................................................ 86
Assortment Optimization workflow tabs .......................................................... 87 Identify Placeholders ................................................................................................ 88 Determine Optimal Space / Profit ............................................................................ 89 Review Store Results................................................................................................ 98
What’s next ..................................................................................................... 102
Chapter 6 – Administration ................................................ 103
Create Administration Workbook ................................................................... 103 Toolbar buttons....................................................................................................... 105 Menu options .......................................................................................................... 106
Administration workflow tabs......................................................................... 107 Phase Definition ..................................................................................................... 108 Macro Rationalization ............................................................................................ 109 Macro and Assortment Optimization ..................................................................... 111 Assortment Rationalization .................................................................................... 116
What’s next ..................................................................................................... 118
Contents iii
Chapter 7 – Like Store ........................................................ 119
Create Like Store Workbook........................................................................... 119 Toolbar buttons....................................................................................................... 121 Menu options .......................................................................................................... 122
Like Store workflow tabs ................................................................................ 123 Define Like Stores .................................................................................................. 123
Chapter 8 – Like Item .......................................................... 125
Create Like Item Workbook............................................................................ 125 Toolbar buttons....................................................................................................... 127 Menu options .......................................................................................................... 128
Like Item workflow tab................................................................................... 129 Define Like Items ................................................................................................... 129
Index..................................................................................... 131

Chapter 1 – Introduction 1
Chapter 1 – Introduction Effective merchandising is the cornerstone of a successful retail business, since it determines the variety and presentation of merchandise, thus defining the customer’s in-store experience. It is one of the most important aspects of a retailer’s brand image. In recent years, retailers have been experiencing increased difficulty in achieving desired levels of same store sales growth, gross margin, and inventory productivity. This is due, in part, to smaller buying staffs, shorter product life cycles, increasingly savvy and demanding customers, and cutthroat competition.
In light of these issues, retailers are looking to service their customers, drive profitable growth and further differentiate themselves from the competition by better tailoring their product offerings to the needs of their local customers. In the past, micro-merchandising or local market assortments were extremely complex, labor intensive, and yielded marginal results. The Assort solution is both manageable and will have a positive impact on business.
Assort Assortment and space optimization is functionality developed to address the crucial process of determining four primary merchandising dimensions:
• Categories of merchandise carried within a store
• Space allocated to each category of merchandise
• Assortment of items carried in each category
• Space allocated to each item in each category
2 Retek Assort – Assortment and Space Optimization
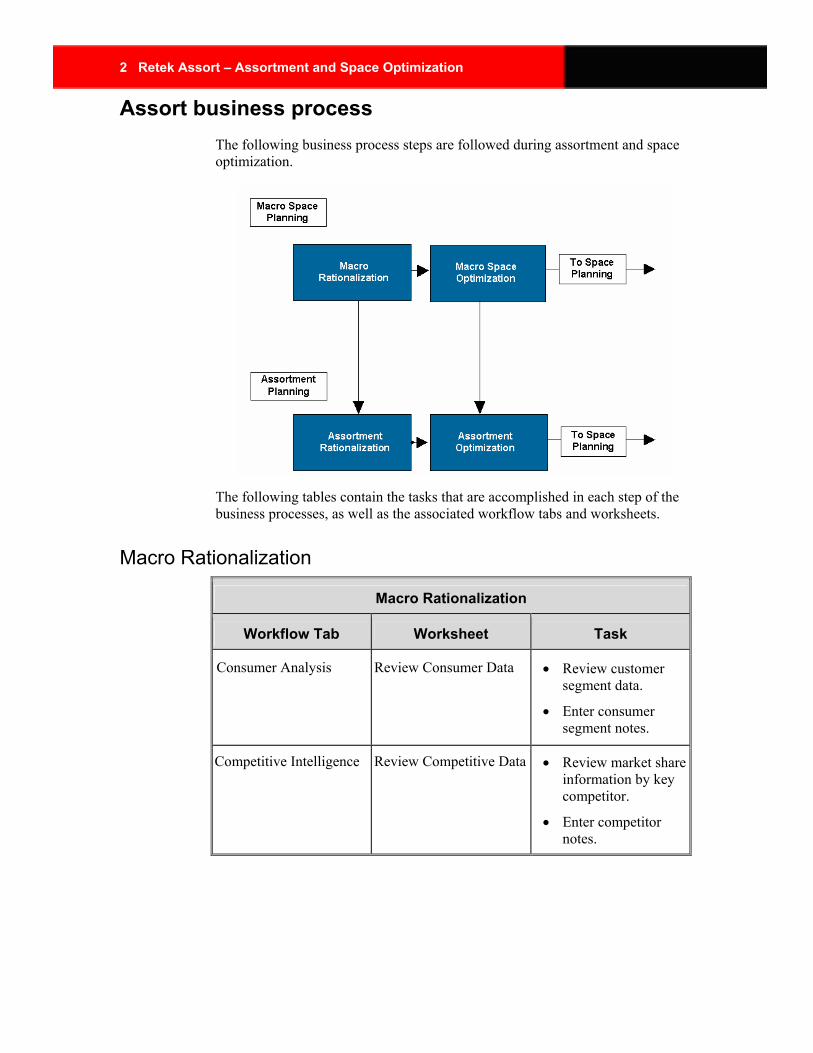
Assort business process The following business process steps are followed during assortment and space optimization.
The following tables contain the tasks that are accomplished in each step of the business processes, as well as the associated workflow tabs and worksheets.
Macro Rationalization
Macro Rationalization
Workflow Tab Worksheet Task
Consumer Analysis Review Consumer Data • Review customer segment data.
• Enter consumer segment notes.
Competitive Intelligence Review Competitive Data • Review market share information by key competitor.
• Enter competitor notes.
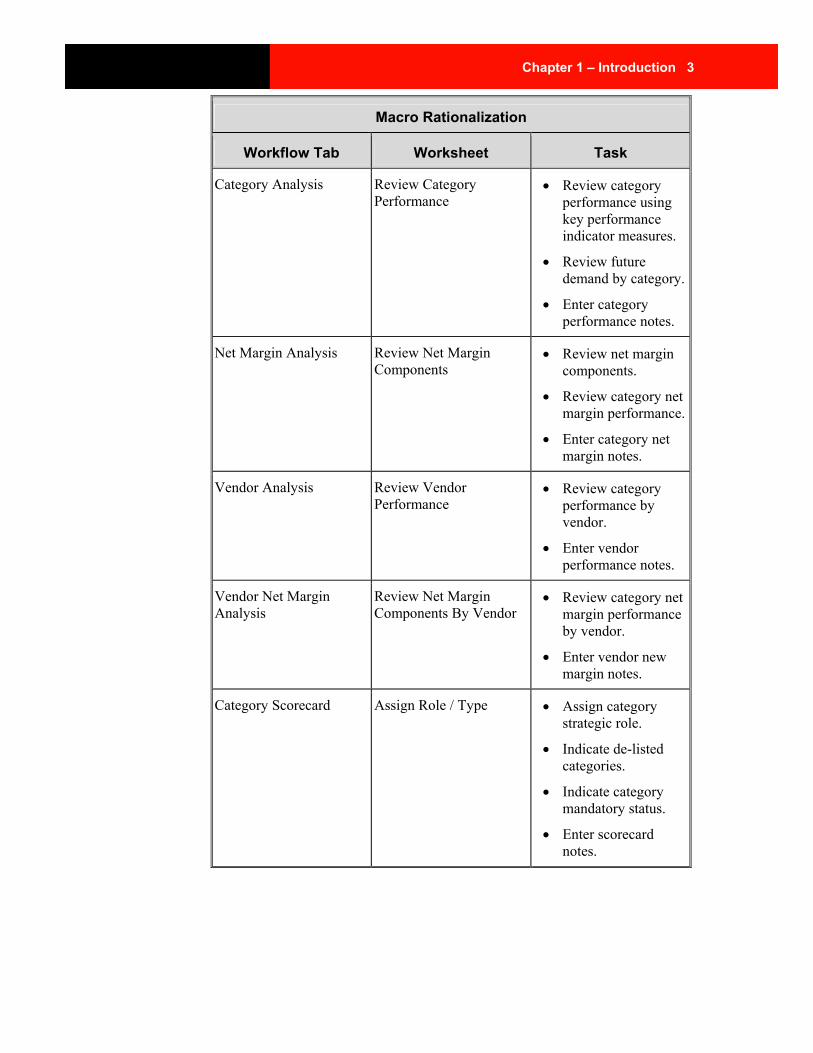
Chapter 1 – Introduction 3
Macro Rationalization
Workflow Tab Worksheet Task
Category Analysis Review Category Performance
• Review category performance using key performance indicator measures.
• Review future demand by category.
• Enter category performance notes.
Net Margin Analysis Review Net Margin Components
• Review net margin components.
• Review category net margin performance.
• Enter category net margin notes.
Vendor Analysis Review Vendor Performance
• Review category performance by vendor.
• Enter vendor performance notes.
Vendor Net Margin Analysis
Review Net Margin Components By Vendor
• Review category net margin performance by vendor.
• Enter vendor new margin notes.
Category Scorecard Assign Role / Type • Assign category strategic role.
• Indicate de-listed categories.
• Indicate category mandatory status.
• Enter scorecard notes.
4 Retek Assort – Assortment and Space Optimization
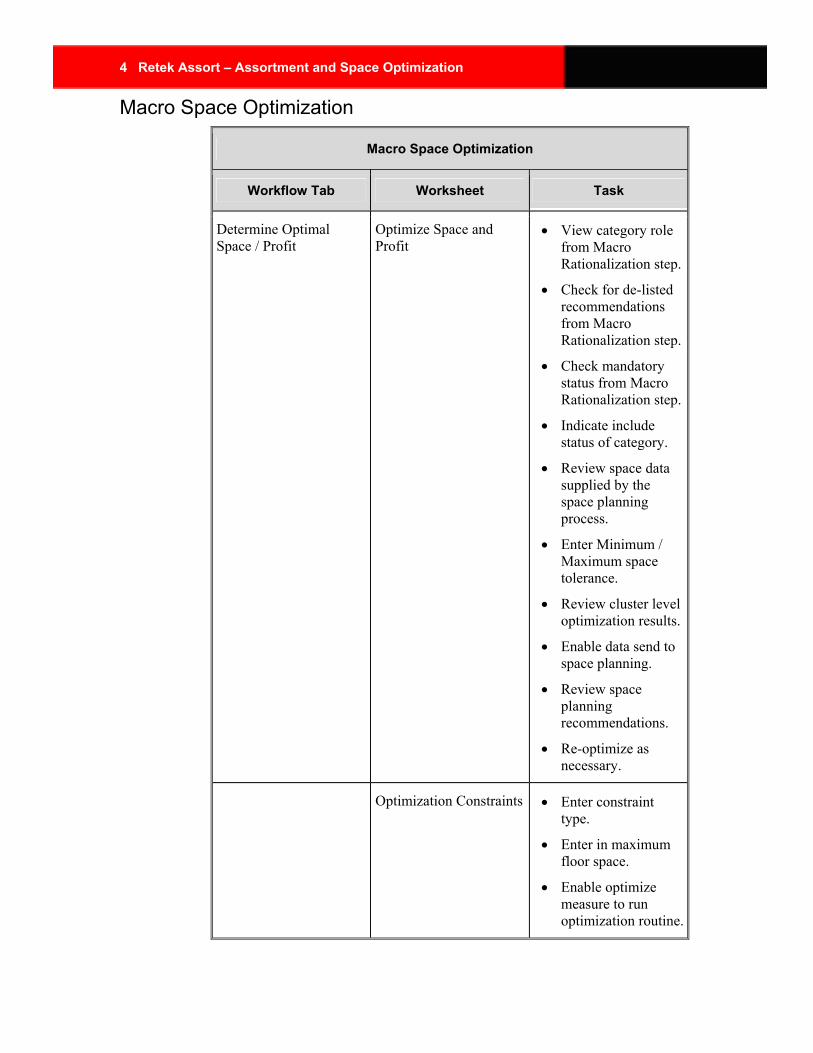
Macro Space Optimization
Macro Space Optimization
Workflow Tab Worksheet Task
Determine Optimal Space / Profit
Optimize Space and Profit
• View category role from Macro Rationalization step.
• Check for de-listed recommendations from Macro Rationalization step.
• Check mandatory status from Macro Rationalization step.
• Indicate include status of category.
• Review space data supplied by the space planning process.
• Enter Minimum / Maximum space tolerance.
• Review cluster level optimization results.
• Enable data send to space planning.
• Review space planning recommendations.
• Re-optimize as necessary.
Optimization Constraints • Enter constraint type.
• Enter in maximum floor space.
• Enable optimize measure to run optimization routine.
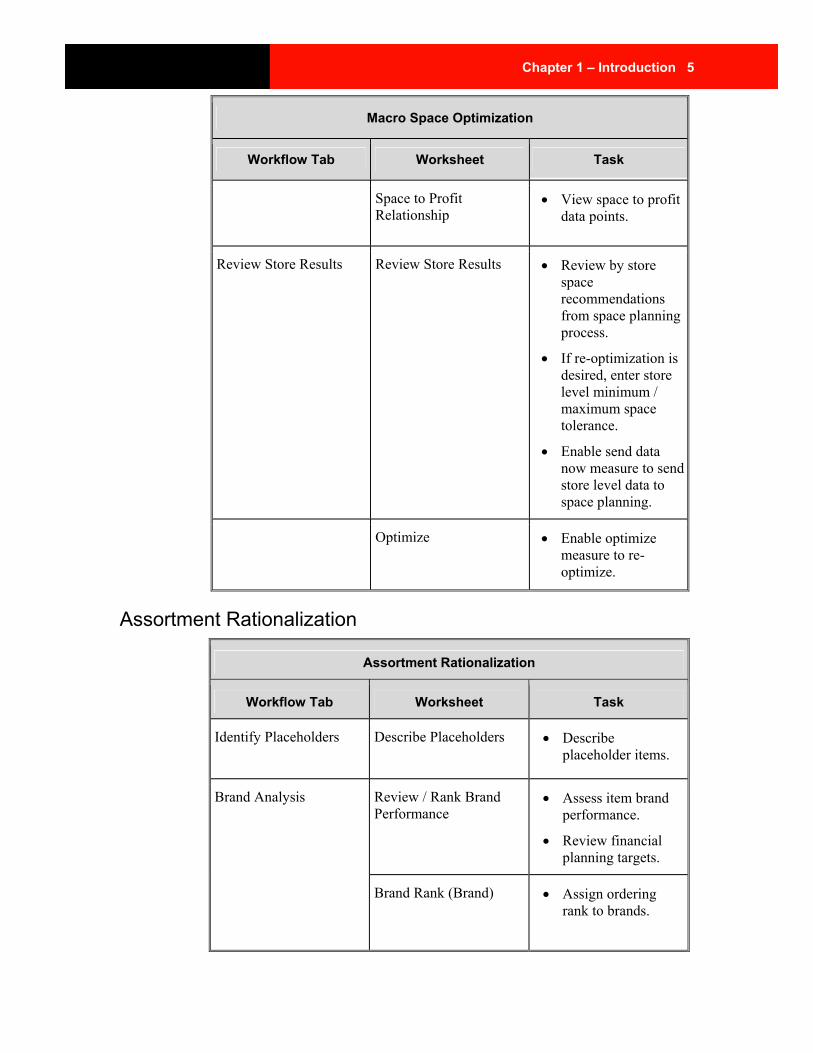
Chapter 1 – Introduction 5
Macro Space Optimization
Workflow Tab Worksheet Task
Space to Profit Relationship
• View space to profit data points.
Review Store Results Review Store Results • Review by store space recommendations from space planning process.
• If re-optimization is desired, enter store level minimum / maximum space tolerance.
• Enable send data now measure to send store level data to space planning.
Optimize • Enable optimize measure to re-optimize.
Assortment Rationalization
Assortment Rationalization
Workflow Tab Worksheet Task
Identify Placeholders Describe Placeholders • Describe placeholder items.
Review / Rank Brand Performance
• Assess item brand performance.
• Review financial planning targets.
Brand Analysis
Brand Rank (Brand) • Assign ordering rank to brands.
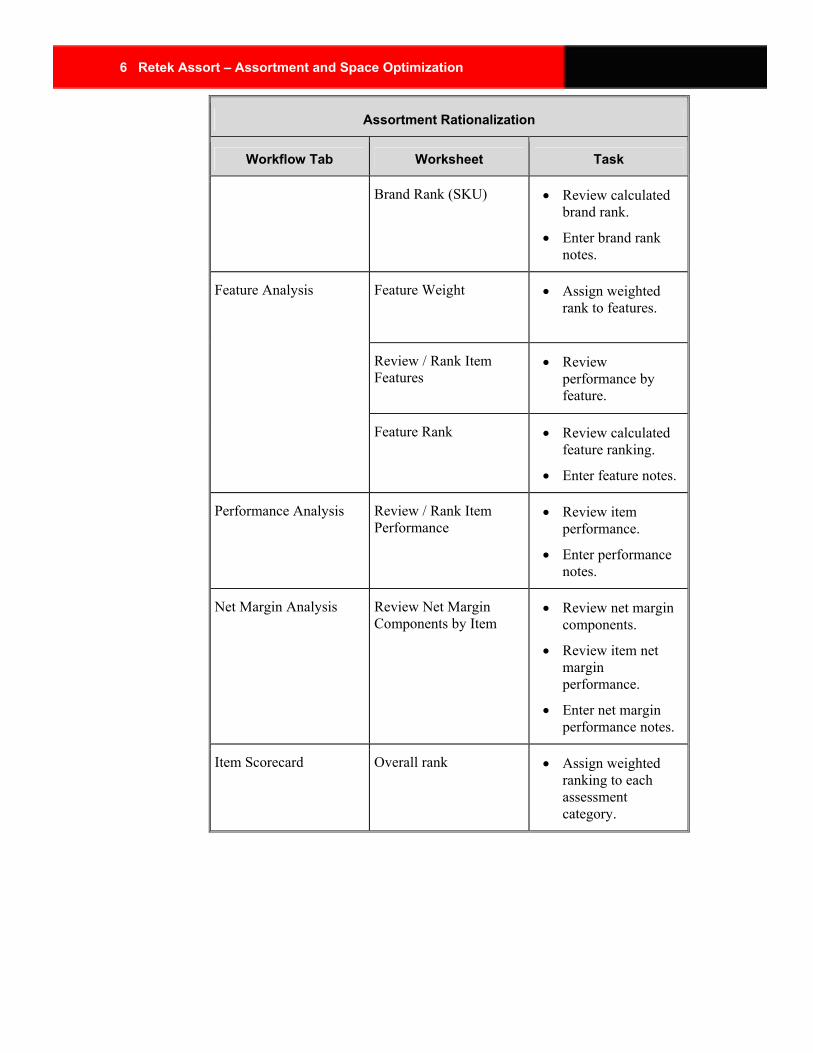
6 Retek Assort – Assortment and Space Optimization
Assortment Rationalization
Workflow Tab Worksheet Task
Brand Rank (SKU) • Review calculated brand rank.
• Enter brand rank notes.
Feature Weight • Assign weighted rank to features.
Review / Rank Item Features
• Review performance by feature.
Feature Analysis
Feature Rank • Review calculated feature ranking.
• Enter feature notes.
Performance Analysis Review / Rank Item Performance
• Review item performance.
• Enter performance notes.
Net Margin Analysis Review Net Margin Components by Item
• Review net margin components.
• Review item net margin performance.
• Enter net margin performance notes.
Item Scorecard Overall rank • Assign weighted ranking to each assessment category.
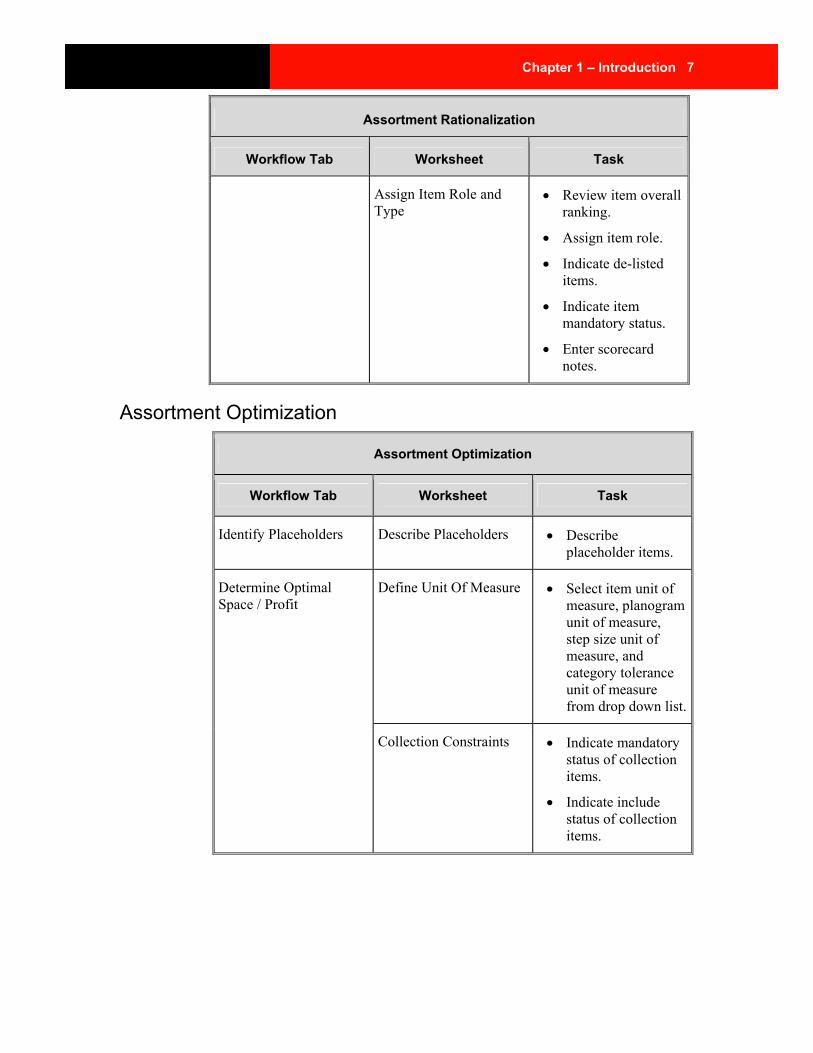
Chapter 1 – Introduction 7
Assortment Rationalization
Workflow Tab Worksheet Task
Assign Item Role and Type
• Review item overall ranking.
• Assign item role.
• Indicate de-listed items.
• Indicate item mandatory status.
• Enter scorecard notes.
Assortment Optimization
Assortment Optimization
Workflow Tab Worksheet Task
Identify Placeholders Describe Placeholders • Describe placeholder items.
Define Unit Of Measure • Select item unit of measure, planogram unit of measure, step size unit of measure, and category tolerance unit of measure from drop down list.
Determine Optimal Space / Profit
Collection Constraints • Indicate mandatory status of collection items.
• Indicate include status of collection items.
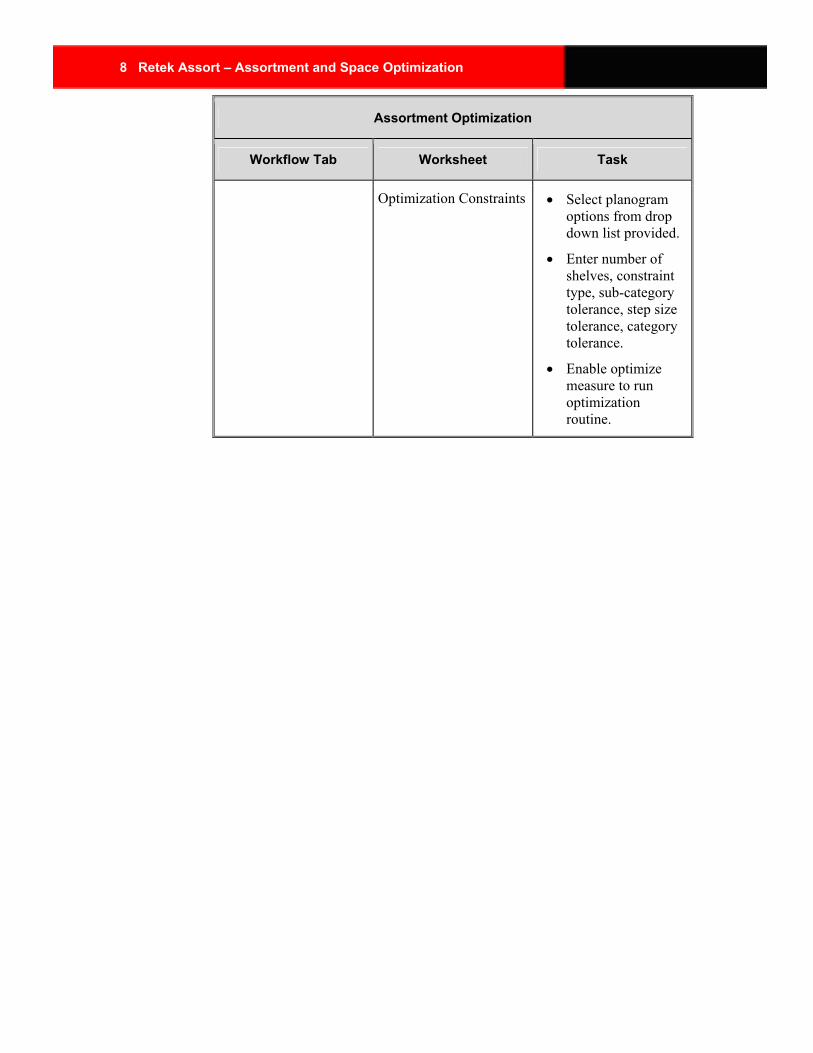
8 Retek Assort – Assortment and Space Optimization
Assortment Optimization
Workflow Tab Worksheet Task
Optimization Constraints • Select planogram options from drop down list provided.
• Enter number of shelves, constraint type, sub-category tolerance, step size tolerance, category tolerance.
• Enable optimize measure to run optimization routine.
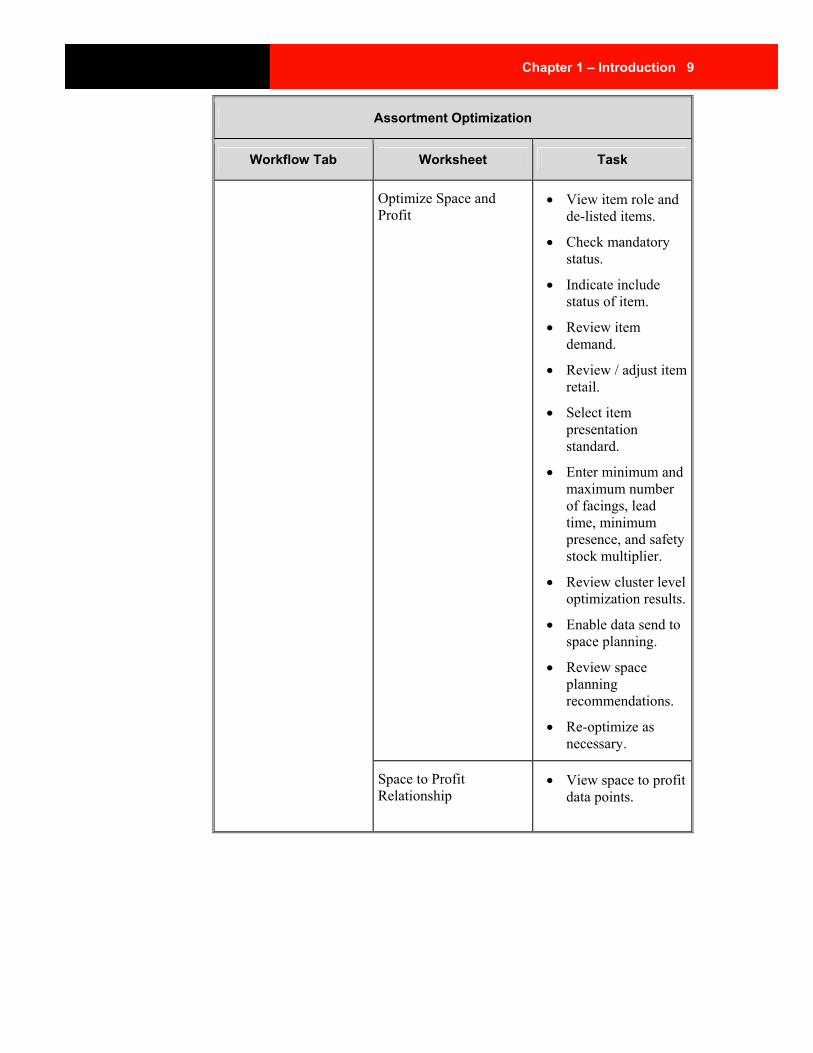
Chapter 1 – Introduction 9
Assortment Optimization
Workflow Tab Worksheet Task
Optimize Space and Profit
• View item role and de-listed items.
• Check mandatory status.
• Indicate include status of item.
• Review item demand.
• Review / adjust item retail.
• Select item presentation standard.
• Enter minimum and maximum number of facings, lead time, minimum presence, and safety stock multiplier.
• Review cluster level optimization results.
• Enable data send to space planning.
• Review space planning recommendations.
• Re-optimize as necessary.
Space to Profit Relationship
• View space to profit data points.
10 Retek Assort – Assortment and Space Optimization
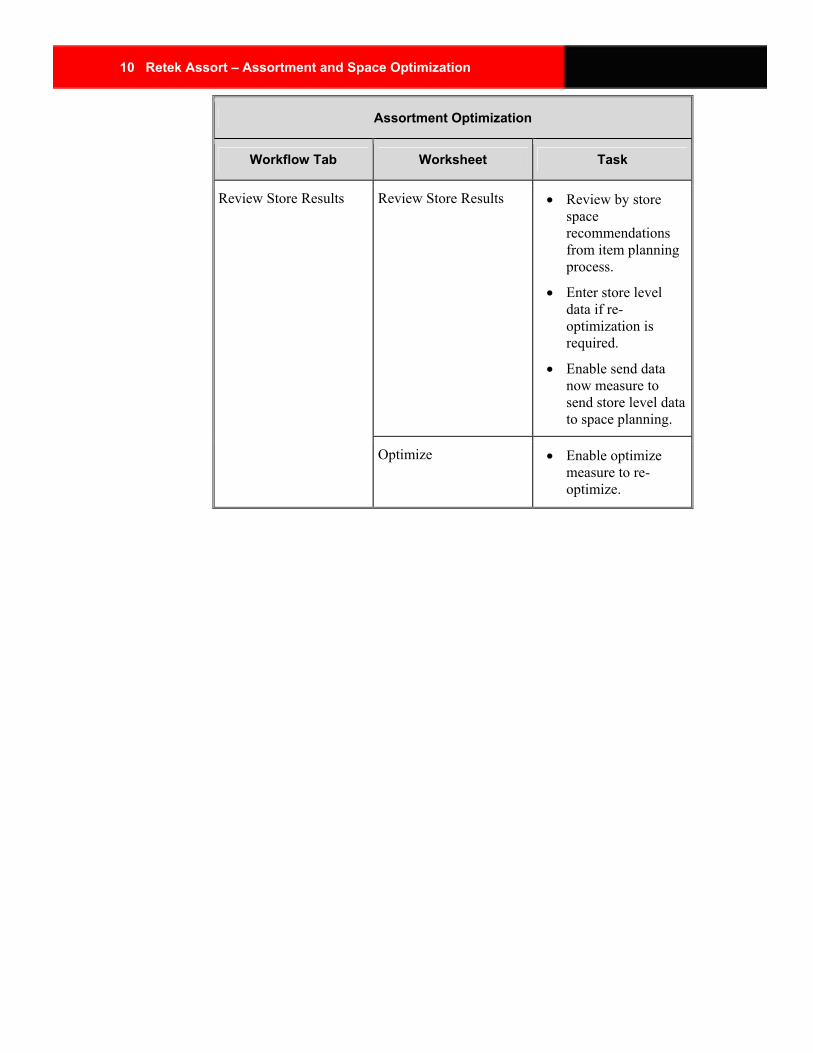
Assortment Optimization
Workflow Tab Worksheet Task
Review Store Results • Review by store space recommendations from item planning process.
• Enter store level data if re-optimization is required.
• Enable send data now measure to send store level data to space planning.
Review Store Results
Optimize • Enable optimize measure to re-optimize.
Chapter 1 – Introduction 11
About Measures There are four components used in constructing measures. When concatenated together all four classifications become known as a single measure. It is optional whether all of the components are visible in the measure label. The four components, in order of measure label sequence, for a measure are found below:
• Role
• Version
• Metric
• Units of Measure
Roles Roles are typically defined by your role as a user of the Assort solution. These roles typically align with the organizational structure
• Executive (AEx)
• Manager (AMg)
• Planner (APl)
• KeyPlan Planner (KPl)
• TopPlan Planner (TPl)
Versions Versions are used to provide separate views to measures that mean the same but may have separate sources or timeframes. An example of a version is last year (Ly). Sales for this year (Wp) and last year (Ly) are intended to be compared as the same measure but need to be distinguished from one another. In order to do so, Sales for this year are labeled as Wp Sales, while last year is labeled Ly Sales.
12 Retek Assort – Assortment and Space Optimization
The versions found in Assort are:
• Wp (Working plan, also known as this year)
• Ly (Last year)
• Fcst (Forecast)
• Opt (Optimal)
• Adm (Administrative)
Metrics Metrics are used to describe what is being viewed or calculated. There are several metrics used in Assort. They are identified throughout this assortment and space optimization user guide. Some of the key metrics found in Assort are:
• Sales
• Average inventory
• Gross margin
• Net margin
• GMROI
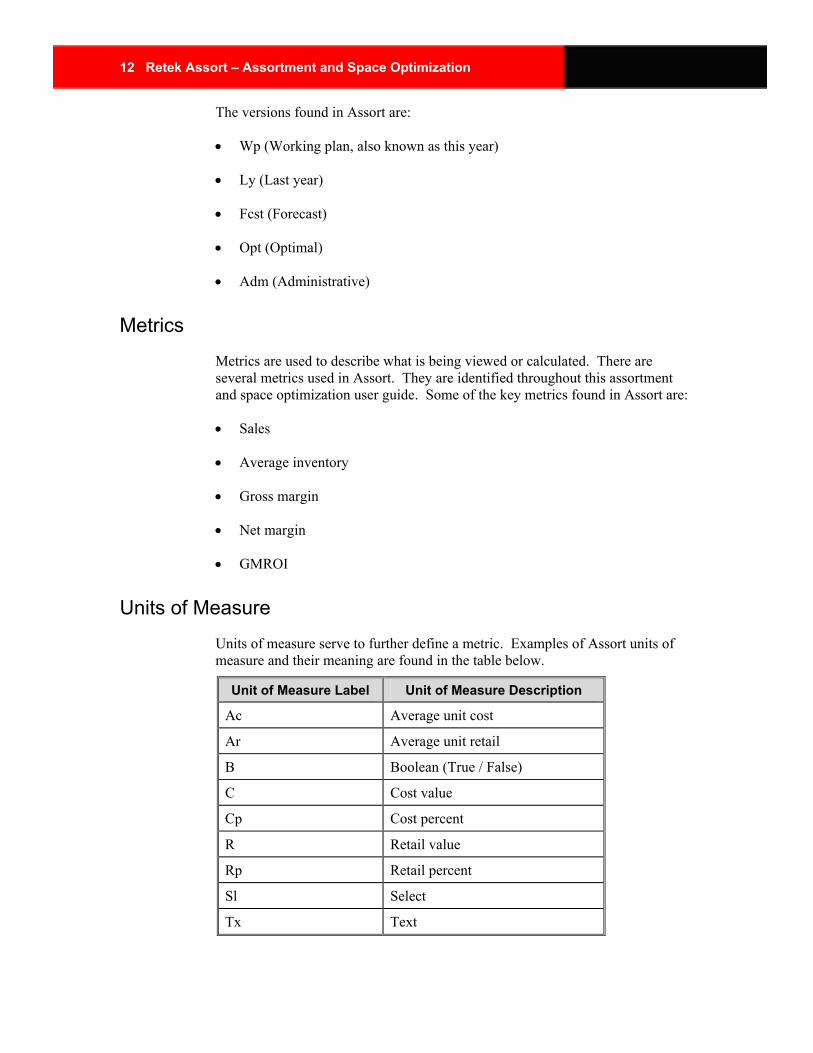
Units of Measure Units of measure serve to further define a metric. Examples of Assort units of measure and their meaning are found in the table below.
Unit of Measure Label Unit of Measure Description
Ac Average unit cost
Ar Average unit retail
B Boolean (True / False)
C Cost value
Cp Cost percent
R Retail value
Rp Retail percent
Sl Select
Tx Text
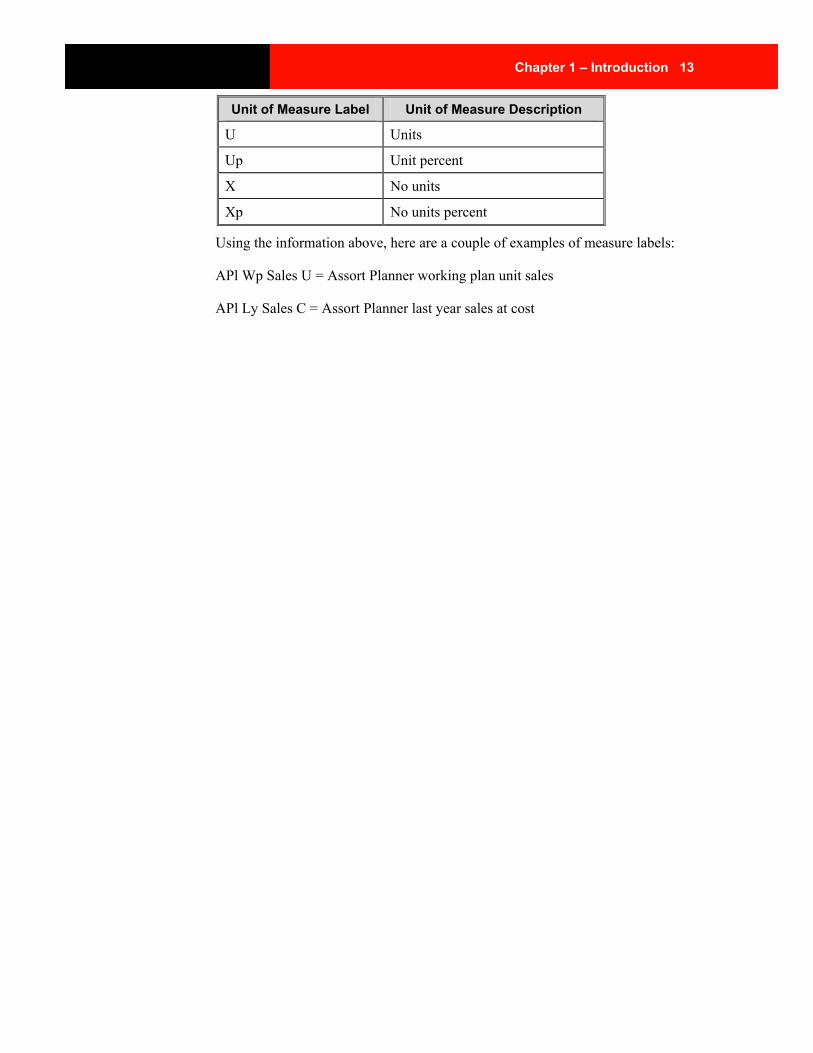
Chapter 1 – Introduction 13
Unit of Measure Label Unit of Measure Description
U Units
Up Unit percent
X No units
Xp No units percent
Using the information above, here are a couple of examples of measure labels:
APl Wp Sales U = Assort Planner working plan unit sales
APl Ly Sales C = Assort Planner last year sales at cost
14 Retek Assort – Assortment and Space Optimization
Getting started
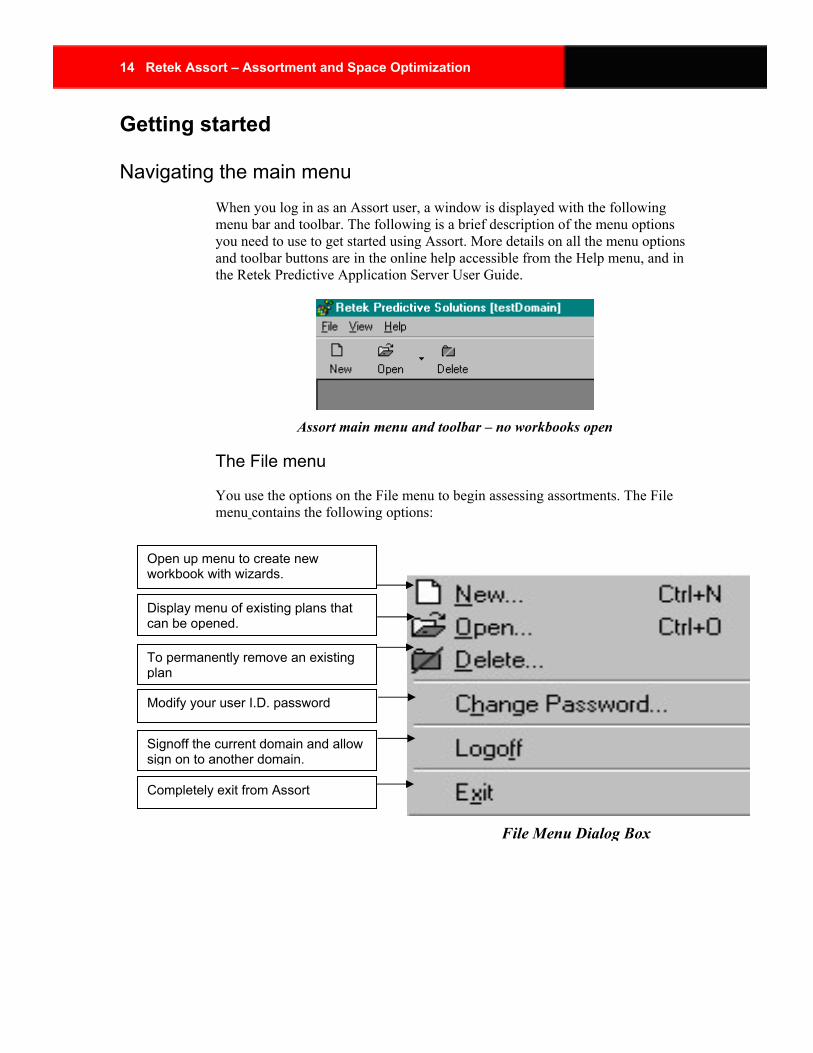
Navigating the main menu When you log in as an Assort user, a window is displayed with the following menu bar and toolbar. The following is a brief description of the menu options you need to use to get started using Assort. More details on all the menu options and toolbar buttons are in the online help accessible from the Help menu, and in the Retek Predictive Application Server User Guide.
Assort main menu and toolbar – no workbooks open
The File menu
You use the options on the File menu to begin assessing assortments. The File menu contains the following options:
Open up menu to create new workbook with wizards.
Display menu of existing plans that can be opened.
To permanently remove an existing plan
Modify your user I.D. password
Signoff the current domain and allow sign on to another domain.
Completely exit from Assort
File Menu Dialog Box
Chapter 1 – Introduction 15
The New, Open, and Delete options
Choosing New from the File menu, or clicking New displays a dialog box showing three options. These options launch wizards for creating workbooks used in assortment and space optimization.
Choosing Open from the File menu, or clicking Open displays a window that lists all the workbooks previously saved. You may select any saved workbook for reading or editing.
Choosing Delete from the File menu, or clicking Delete displays a window that lists all the workbooks previously created. Selecting a workbook and ‘OK’ will delete the workbook.
Note: See Assort toolbar buttons and workflow tabs in each subsequent chapter for more details on all menu options.
Save, close, and open a plan
You can save a newly created workbook at any point in the process and open it later to complete the assessment process or edit previous steps. This action allows the flexibility to review workbooks continuously, as new information is available.
Save the plan information
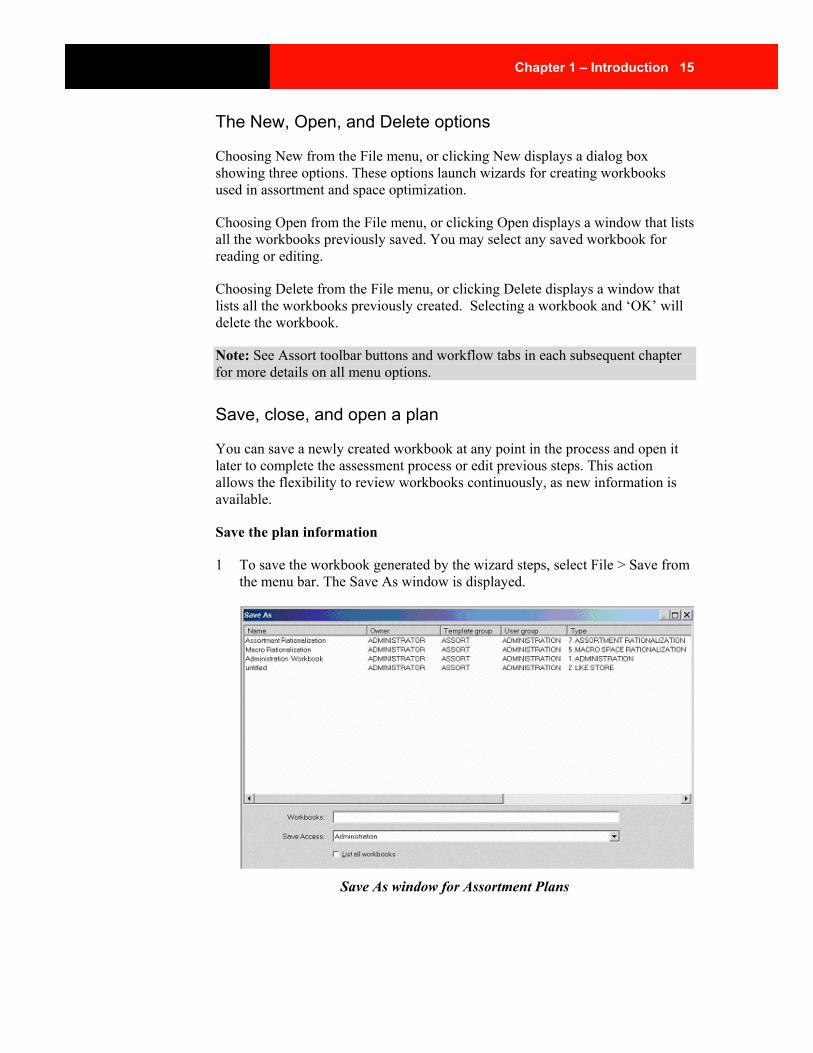
1 To save the workbook generated by the wizard steps, select File > Save from the menu bar. The Save As window is displayed.
Save As window for Assortment Plans
16 Retek Assort – Assortment and Space Optimization
The column fields in the list box describe existing plans:
Name: Name of plan
Owner: Plan originator or Group originator
Template Group: Assort
User Group: Work group of the plan originator
Type: Type of plan
Created: Date of origination
Modified: Date of last save
Access: States individual (originator) or group access
The Save As window displays previously created workbooks. The first field shows ‘untitled’ until the plan is saved. When you enter a name for this plan, it will be displayed in the list of workbooks that can be viewed or edited. This plan name is displayed on the Assort title line when the assortment plan is open for further build or editing procedures.
2 Enter an identifying name in the top Workbooks field.
3 In the Save Access As section, select Administration, User or Group. Selecting Administration to allow only those with administrative access to view / edit the workbook. Selecting Group allows other users within your group to view/edit your plan. Selecting User allows only the plan originator to view or edit this plan. Once selected, it cannot be changed.
4 If you want all workbooks from your group to be displayed for viewing or editing, select the List All Workbooks check box. If this check box is cleared, you will only see the workbooks created by you as Owner.
5 Click OK. The parameters of this plan have been saved and the plan structure is available for continued planning or for access at another time. The Step 1 window is still displayed.
Chapter 1 – Introduction 17
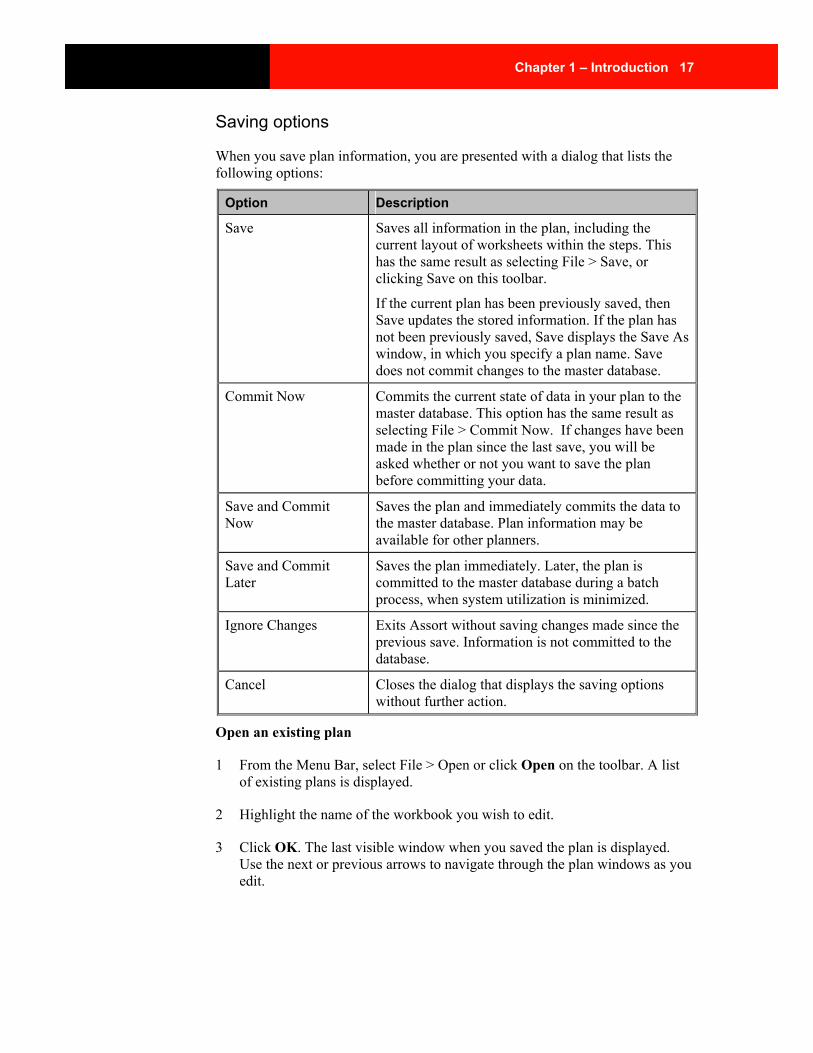
Saving options
When you save plan information, you are presented with a dialog that lists the following options:
Option Description
Save Saves all information in the plan, including the current layout of worksheets within the steps. This has the same result as selecting File > Save, or clicking Save on this toolbar.
If the current plan has been previously saved, then Save updates the stored information. If the plan has not been previously saved, Save displays the Save As window, in which you specify a plan name. Save does not commit changes to the master database.
Commit Now Commits the current state of data in your plan to the master database. This option has the same result as selecting File > Commit Now. If changes have been made in the plan since the last save, you will be asked whether or not you want to save the plan before committing your data.
Save and Commit Now
Saves the plan and immediately commits the data to the master database. Plan information may be available for other planners.
Save and Commit Later
Saves the plan immediately. Later, the plan is committed to the master database during a batch process, when system utilization is minimized.
Ignore Changes Exits Assort without saving changes made since the previous save. Information is not committed to the database.
Cancel Closes the dialog that displays the saving options without further action.
Open an existing plan
1 From the Menu Bar, select File > Open or click Open on the toolbar. A list of existing plans is displayed.
2 Highlight the name of the workbook you wish to edit.
3 Click OK. The last visible window when you saved the plan is displayed. Use the next or previous arrows to navigate through the plan windows as you edit.
18 Retek Assort – Assortment and Space Optimization
Delete a plan
1 On the toolbar, click Delete, or choose File > Delete from the main menu. The Delete window is displayed, showing a list of plans.
2 Click on the title of the plan you wish to delete. The plan title is highlighted.
3 Click OK. A dialog window is displayed which asks you to confirm your decision.
4 Click OK to delete the plan, or click Cancel to abort the process.
Chapter 2 – Macro Rationalization 19
Chapter 2 – Macro Rationalization The assessment of sub-category and above performance takes place inside the Macro Rationalization process step. To begin, workbooks must be built using wizard steps to establish the content of the workbook. Product, competitor, location, timeframe, and consumer segment boundaries are defined in the workbook build using wizards
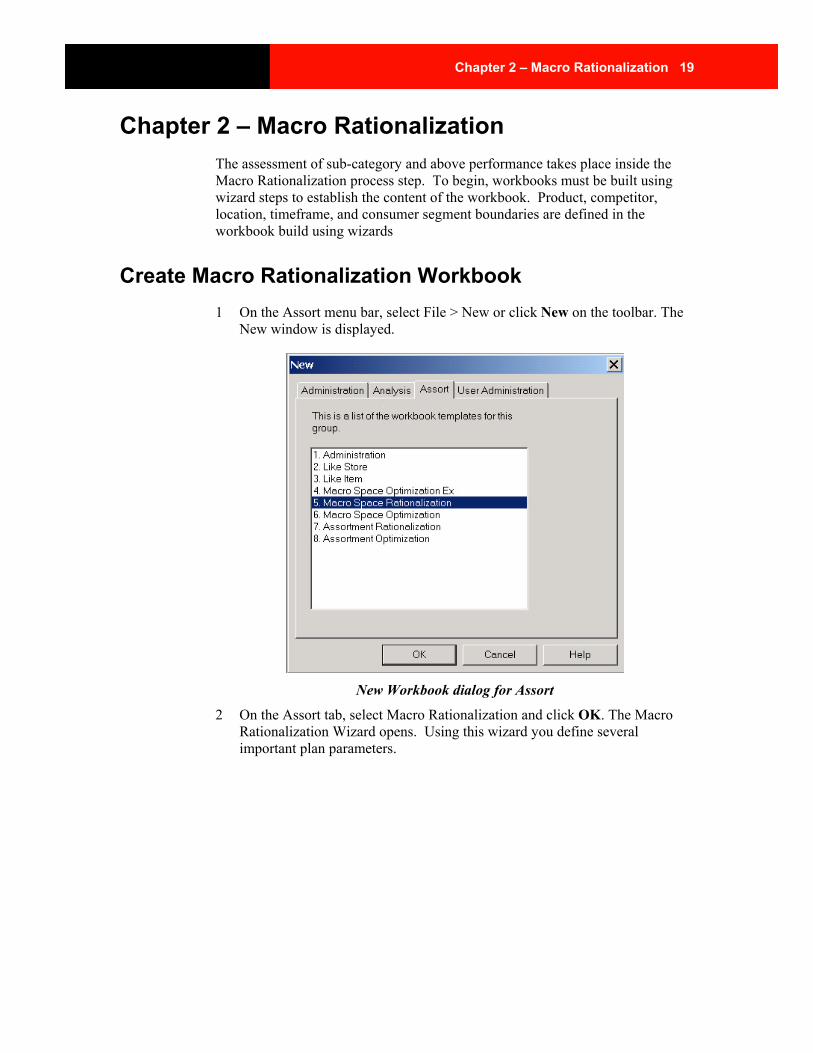
Create Macro Rationalization Workbook 1 On the Assort menu bar, select File > New or click New on the toolbar. The
New window is displayed.
New Workbook dialog for Assort
2 On the Assort tab, select Macro Rationalization and click OK. The Macro Rationalization Wizard opens. Using this wizard you define several important plan parameters.
20 Retek Assort – Assortment and Space Optimization
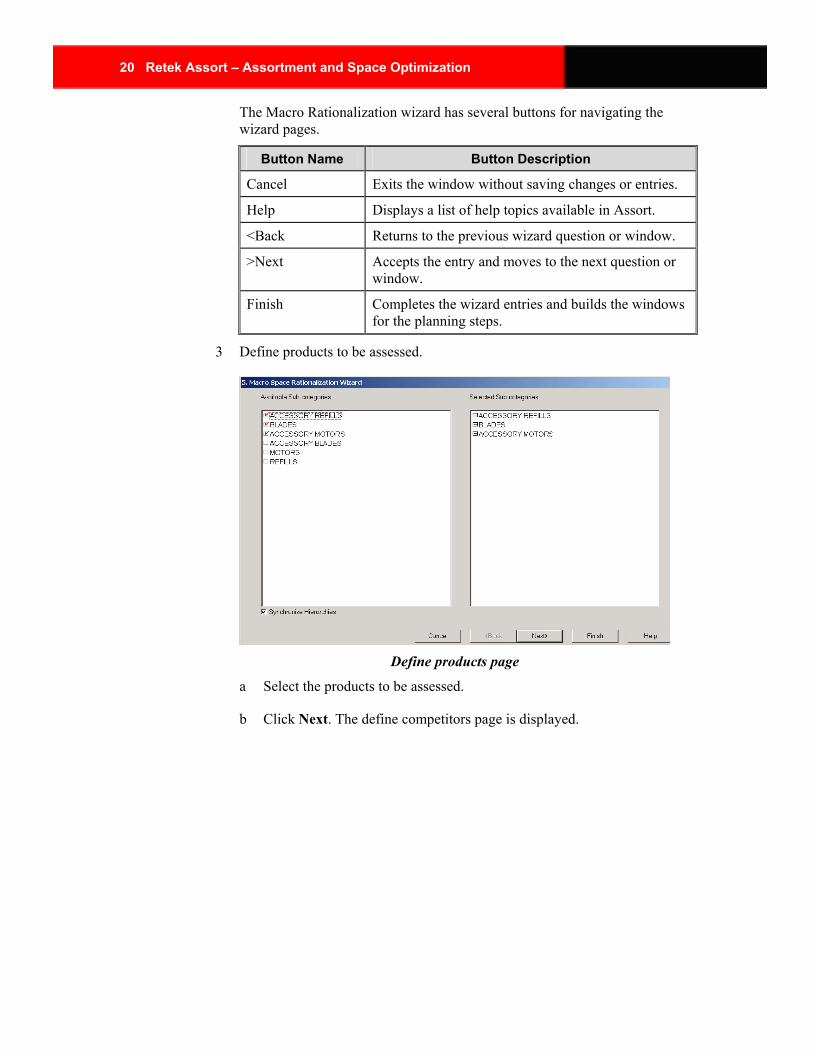
The Macro Rationalization wizard has several buttons for navigating the wizard pages.
Button Name Button Description
Cancel Exits the window without saving changes or entries.
Help Displays a list of help topics available in Assort.
<Back Returns to the previous wizard question or window.
>Next Accepts the entry and moves to the next question or window.
Finish Completes the wizard entries and builds the windows for the planning steps.
3 Define products to be assessed.
Define products page
a Select the products to be assessed.
b Click Next. The define competitors page is displayed.
Chapter 2 – Macro Rationalization 21
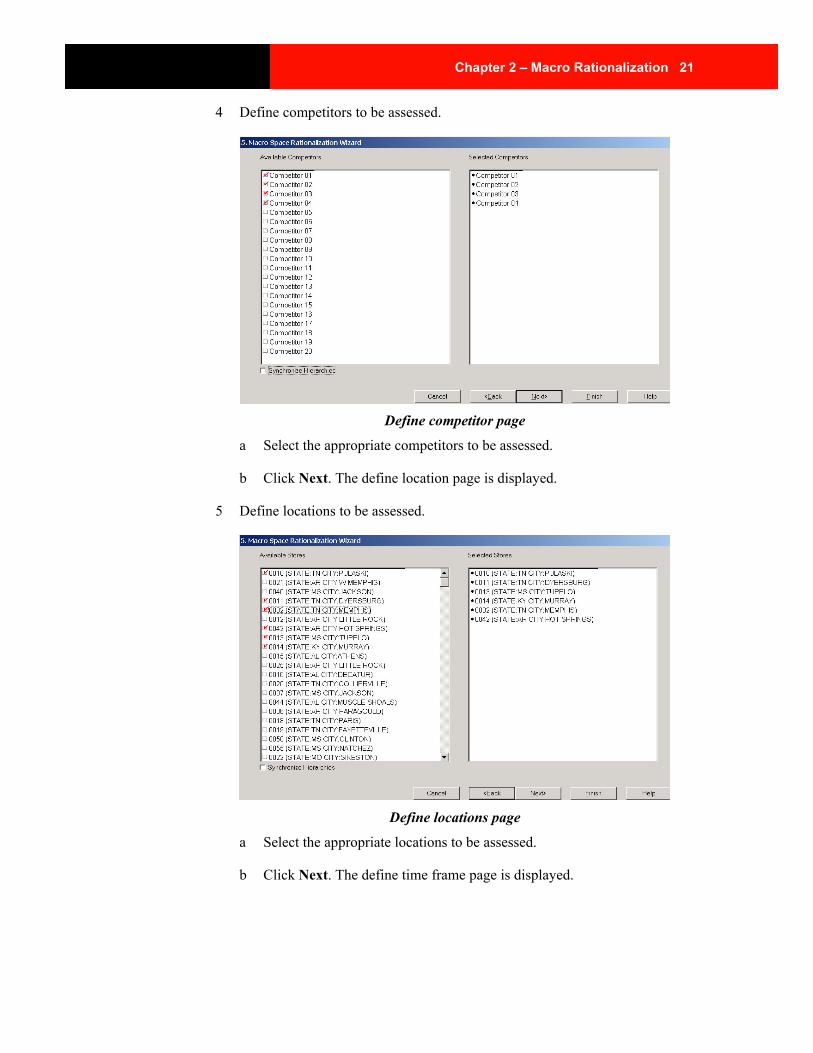
4 Define competitors to be assessed.
Define competitor page
a Select the appropriate competitors to be assessed.
b Click Next. The define location page is displayed.
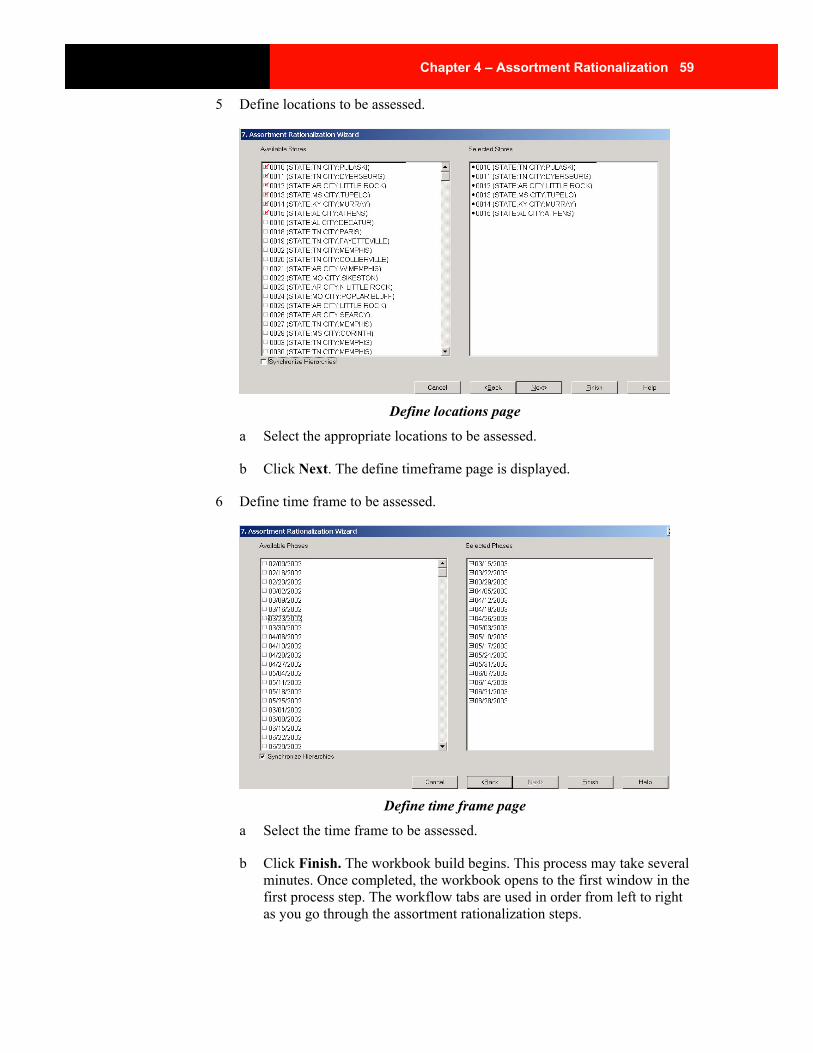
5 Define locations to be assessed.
Define locations page
a Select the appropriate locations to be assessed.
b Click Next. The define time frame page is displayed.
22 Retek Assort – Assortment and Space Optimization
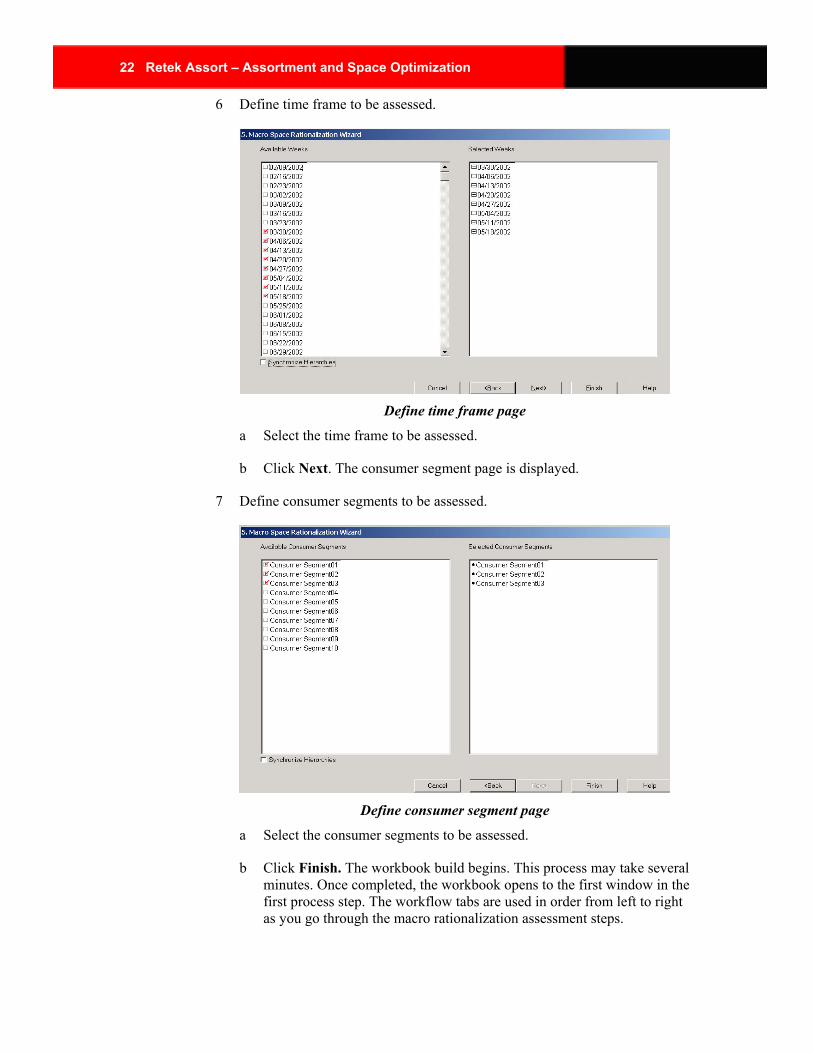
6 Define time frame to be assessed.
Define time frame page
a Select the time frame to be assessed.
b Click Next. The consumer segment page is displayed.
7 Define consumer segments to be assessed.
Define consumer segment page
a Select the consumer segments to be assessed.
b Click Finish. The workbook build begins. This process may take several minutes. Once completed, the workbook opens to the first window in the first process step. The workflow tabs are used in order from left to right as you go through the macro rationalization assessment steps.
Chapter 2 – Macro Rationalization 23
Note: Your answers to the questions on these pages are saved from the first time you use the Macro Rationalization workbook build wizard. On subsequent uses of the wizard, you can skip the individual pages by selecting Next if the selected values are sufficient.
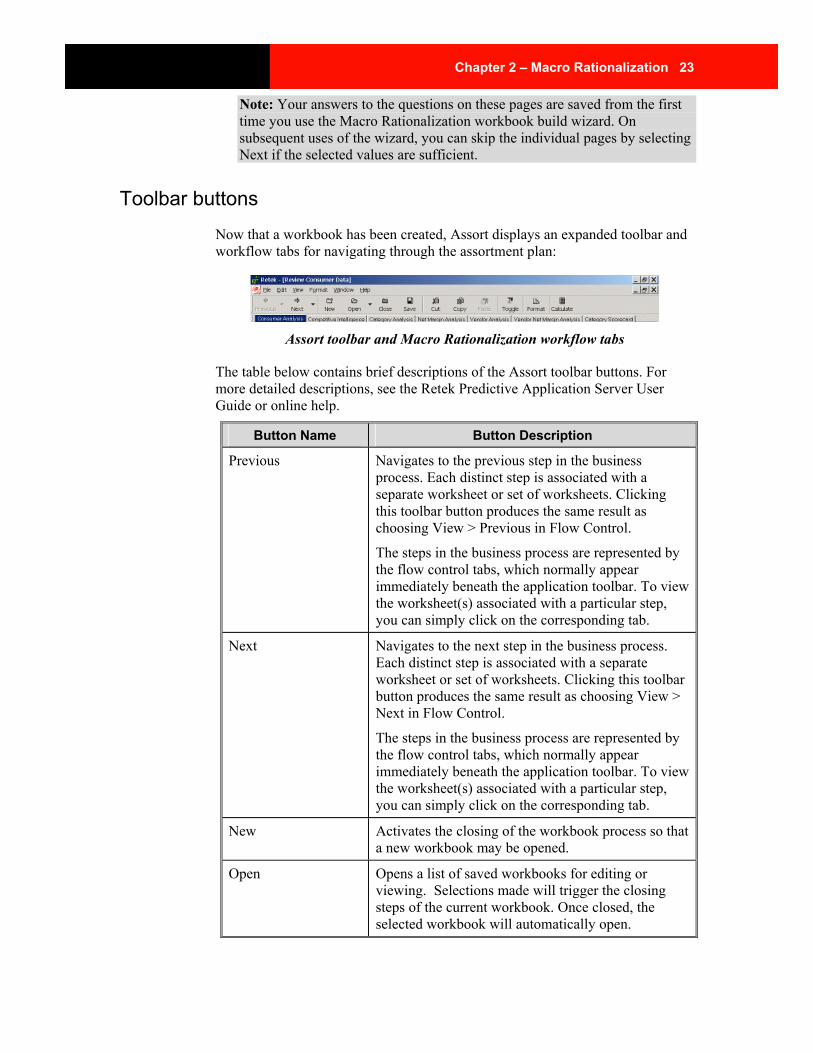
Toolbar buttons Now that a workbook has been created, Assort displays an expanded toolbar and workflow tabs for navigating through the assortment plan:
Assort toolbar and Macro Rationalization workflow tabs
The table below contains brief descriptions of the Assort toolbar buttons. For more detailed descriptions, see the Retek Predictive Application Server User Guide or online help.
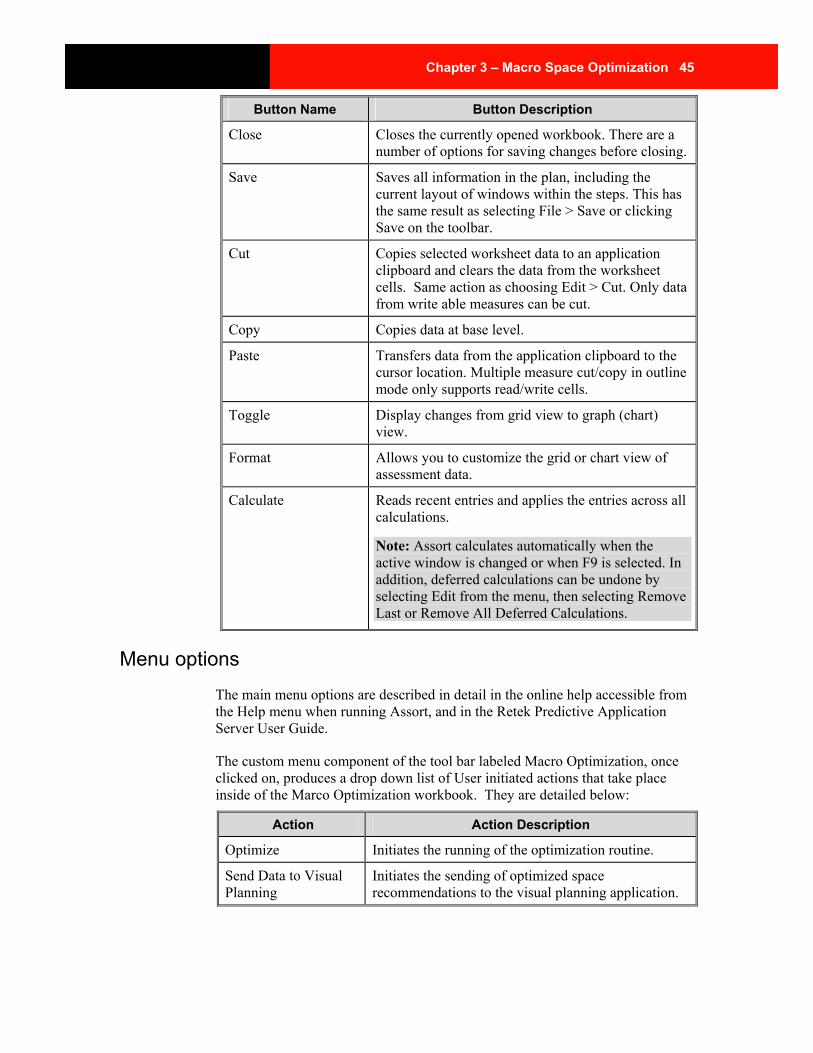
Button Name Button Description
Previous Navigates to the previous step in the business process. Each distinct step is associated with a separate worksheet or set of worksheets. Clicking this toolbar button produces the same result as choosing View > Previous in Flow Control.
The steps in the business process are represented by the flow control tabs, which normally appear immediately beneath the application toolbar. To view the worksheet(s) associated with a particular step, you can simply click on the corresponding tab.
Next Navigates to the next step in the business process. Each distinct step is associated with a separate worksheet or set of worksheets. Clicking this toolbar button produces the same result as choosing View > Next in Flow Control.
The steps in the business process are represented by the flow control tabs, which normally appear immediately beneath the application toolbar. To view the worksheet(s) associated with a particular step, you can simply click on the corresponding tab.
New Activates the closing of the workbook process so that a new workbook may be opened.
Open Opens a list of saved workbooks for editing or viewing. Selections made will trigger the closing steps of the current workbook. Once closed, the selected workbook will automatically open.
24 Retek Assort – Assortment and Space Optimization
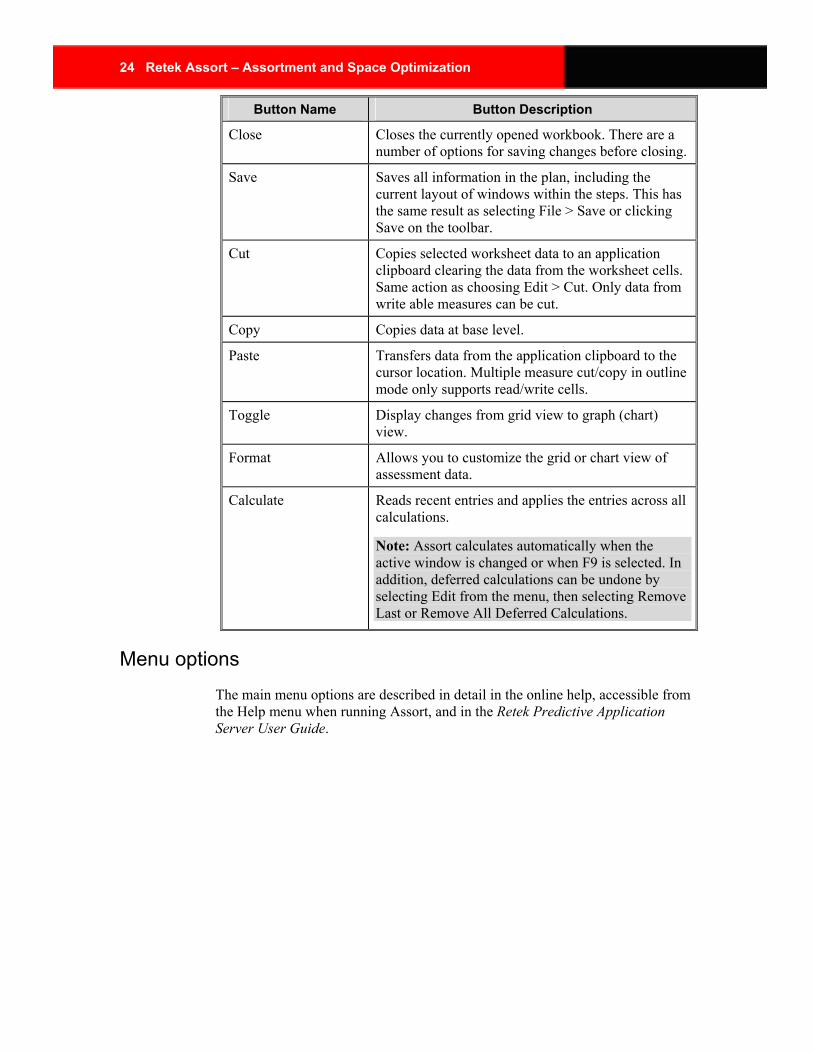
Button Name Button Description
Close Closes the currently opened workbook. There are a number of options for saving changes before closing.
Save Saves all information in the plan, including the current layout of windows within the steps. This has the same result as selecting File > Save or clicking Save on the toolbar.
Cut Copies selected worksheet data to an application clipboard clearing the data from the worksheet cells. Same action as choosing Edit > Cut. Only data from write able measures can be cut.
Copy Copies data at base level.
Paste Transfers data from the application clipboard to the cursor location. Multiple measure cut/copy in outline mode only supports read/write cells.
Toggle Display changes from grid view to graph (chart) view.
Format Allows you to customize the grid or chart view of assessment data.
Calculate Reads recent entries and applies the entries across all calculations.
Note: Assort calculates automatically when the active window is changed or when F9 is selected. In addition, deferred calculations can be undone by selecting Edit from the menu, then selecting Remove Last or Remove All Deferred Calculations.
Menu options The main menu options are described in detail in the online help, accessible from the Help menu when running Assort, and in the Retek Predictive Application Server User Guide.
Chapter 2 – Macro Rationalization 25
Macro Rationalization workflow tabs The macro rationalization workflow tabs are below the Assort toolbar and are used to move between sets of windows displaying aspects of assessing product mix. You can either click on the workflow tabs, or use Next and Previous toolbar to move between them. The workflow tabs for macro rationalization are as follows:
Process Step Tab Descriptions
Consumer Analysis The Consumer Analysis tab provides a view to data on the purchasing habits of consumer segments. The consumer segments available for assessment are those defined in the workbook build wizard steps. A text field is provided for entering diary notes regarding your assessment.
Competitive Intelligence
The Competitive Intelligence tab provides a view to market share data. The competitors available for comparison are those defined in the workbook build wizard steps. A text field is provided for you to enter diary notes regarding your market share assessment.
Category Analysis The Category Analysis tab provides a worksheet summarizing the performance of categories through key performance measures. The products and the time frame assessed are defined in the workbook build wizard steps. A text field is provided for entering diary notes on your category assessment.
Net Margin Analysis The Net Margin Analysis tab provides a view to the measures used in deriving the net margin of a category. A text field is provided for entering diary notes on your category net margin assessment.
Vendor Analysis The Vendor Analysis tab provides a worksheet summarizing the performance through key performance measures of vendors within categories. A text field is provided for entering diary notes.
Vendor Net Margin Analysis
The Vendor Net Margin Analysis tab provides a view to the measures used in deriving, through vendor contribution, the net margin of a category. A text field is provided for entering diary notes regarding your vendor net margin contribution assessment.
Category Scorecard The Category Scorecard tab provides the location for assigning roles to categories, keeping or de-listing categories, and noting whether the categories are mandatory or not in the space optimization process to follow. A text field is provided for entering diary notes.
26 Retek Assort – Assortment and Space Optimization
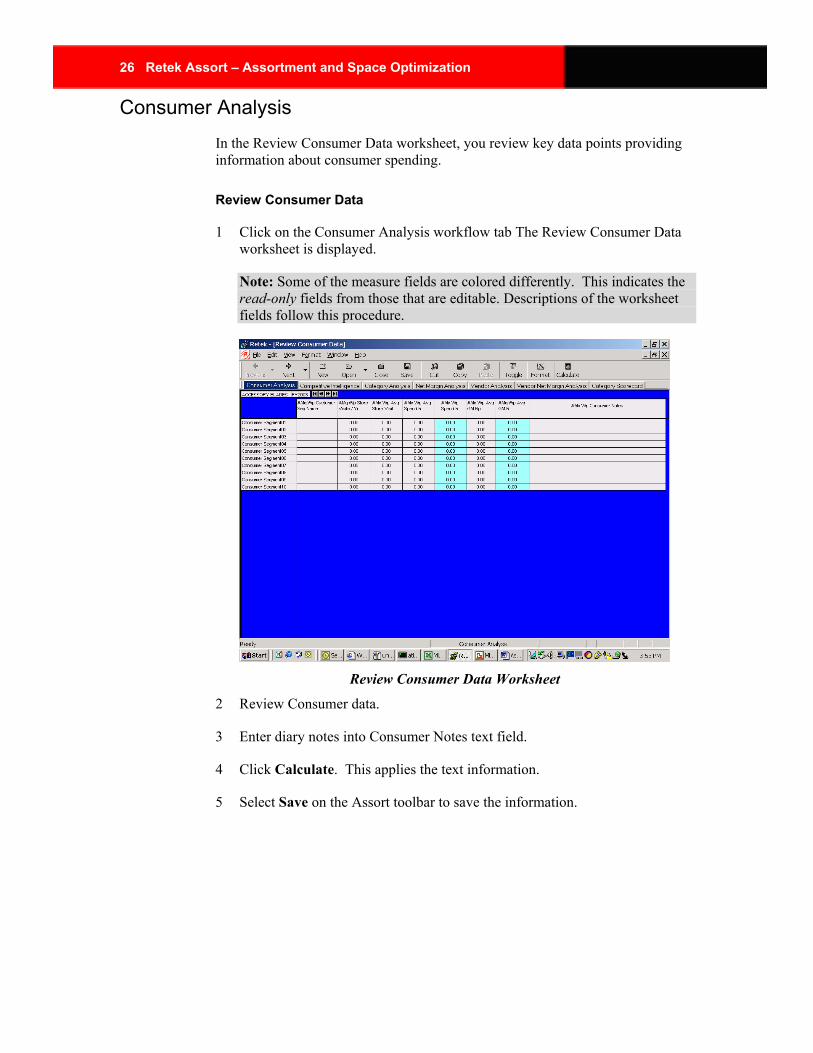
Consumer Analysis In the Review Consumer Data worksheet, you review key data points providing information about consumer spending.
Review Consumer Data
1 Click on the Consumer Analysis workflow tab The Review Consumer Data worksheet is displayed.
Note: Some of the measure fields are colored differently. This indicates the read-only fields from those that are editable. Descriptions of the worksheet fields follow this procedure.
Review Consumer Data Worksheet
2 Review Consumer data.
3 Enter diary notes into Consumer Notes text field.
4 Click Calculate. This applies the text information.
5 Select Save on the Assort toolbar to save the information.
Chapter 2 – Macro Rationalization 27
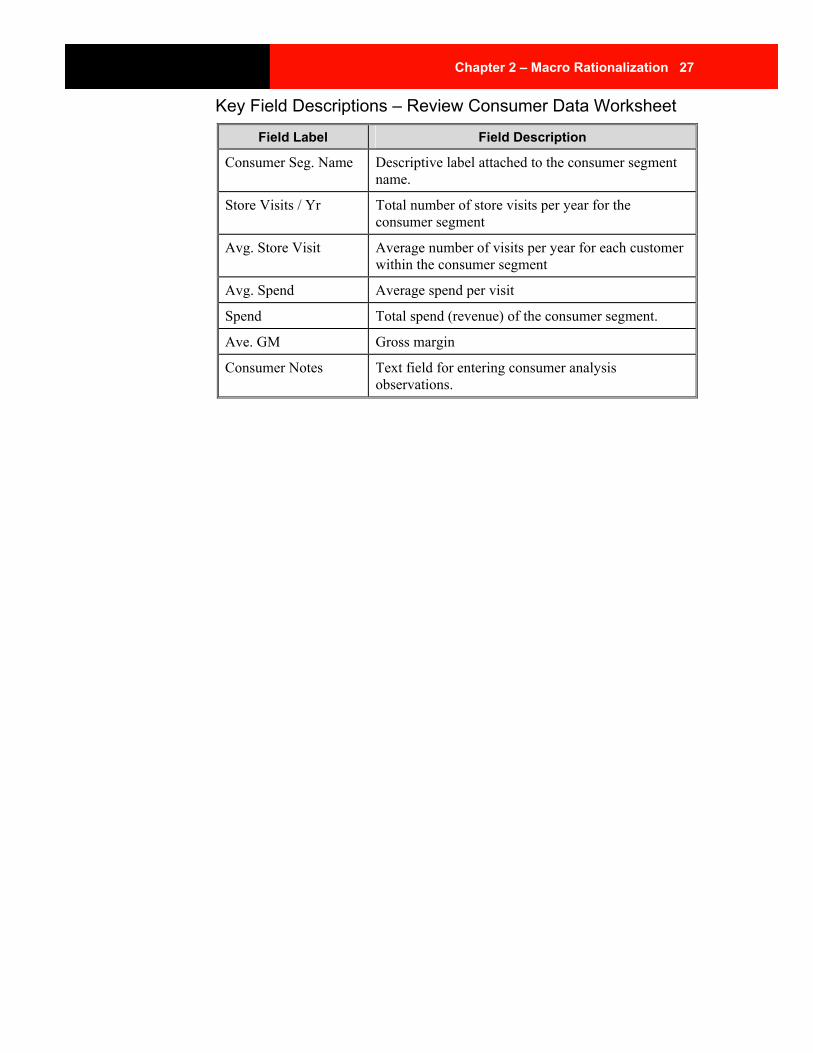
Key Field Descriptions – Review Consumer Data Worksheet
Field Label Field Description
Consumer Seg. Name Descriptive label attached to the consumer segment name.
Store Visits / Yr Total number of store visits per year for the consumer segment
Avg. Store Visit Average number of visits per year for each customer within the consumer segment
Avg. Spend Average spend per visit
Spend Total spend (revenue) of the consumer segment.
Ave. GM Gross margin
Consumer Notes Text field for entering consumer analysis observations.
28 Retek Assort – Assortment and Space Optimization
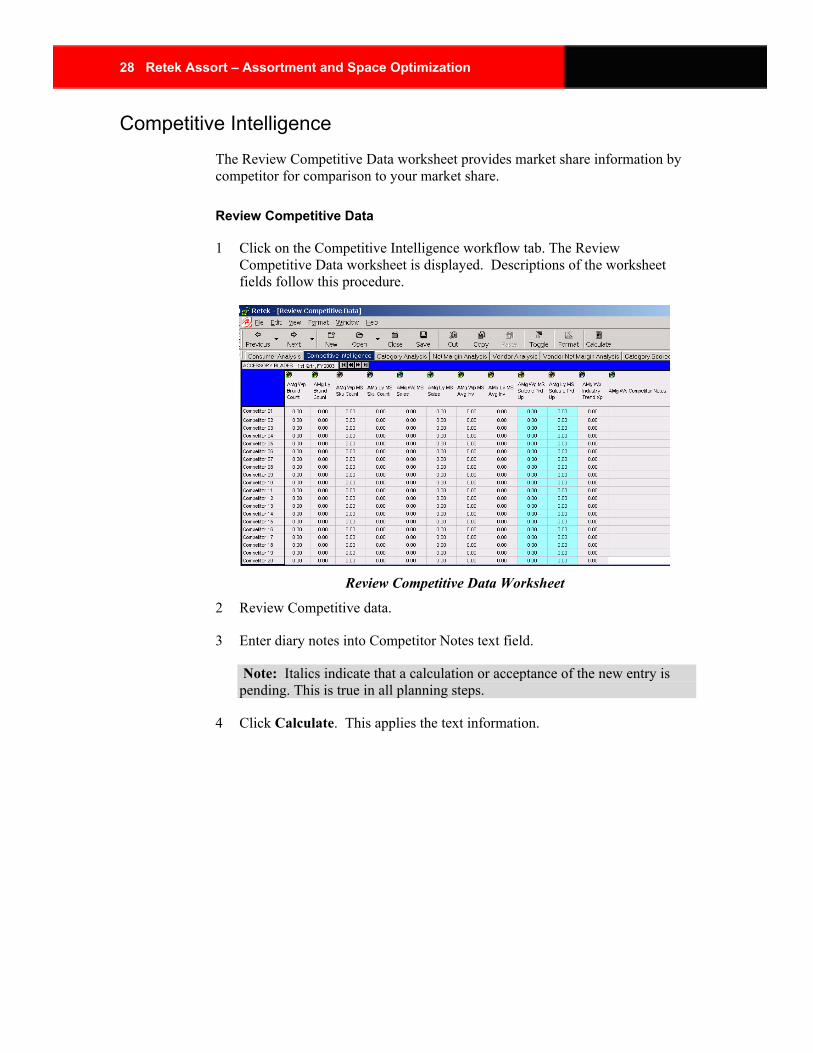
Competitive Intelligence The Review Competitive Data worksheet provides market share information by competitor for comparison to your market share.
Review Competitive Data
1 Click on the Competitive Intelligence workflow tab. The Review Competitive Data worksheet is displayed. Descriptions of the worksheet fields follow this procedure.
Review Competitive Data Worksheet
2 Review Competitive data.
3 Enter diary notes into Competitor Notes text field.
Note: Italics indicate that a calculation or acceptance of the new entry is pending. This is true in all planning steps.
4 Click Calculate. This applies the text information.
Chapter 2 – Macro Rationalization 29
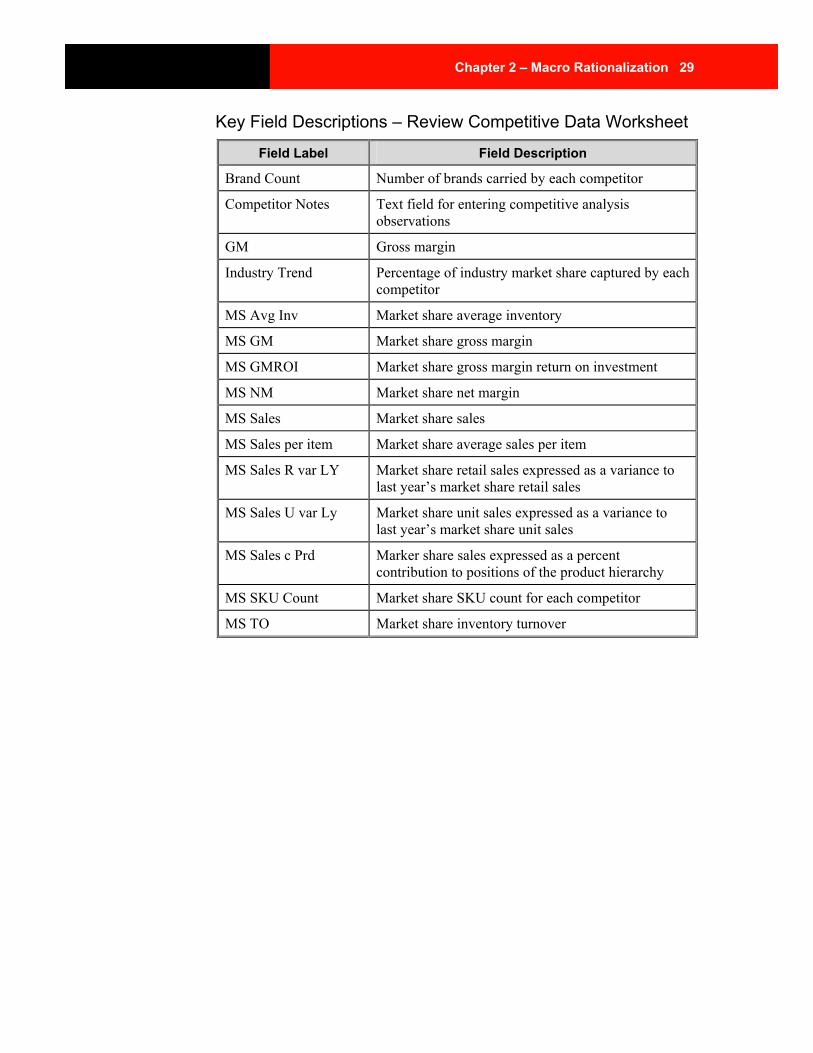
Key Field Descriptions – Review Competitive Data Worksheet
Field Label Field Description
Brand Count Number of brands carried by each competitor
Competitor Notes Text field for entering competitive analysis observations
GM Gross margin
Industry Trend Percentage of industry market share captured by each competitor
MS Avg Inv Market share average inventory
MS GM Market share gross margin
MS GMROI Market share gross margin return on investment
MS NM Market share net margin
MS Sales Market share sales
MS Sales per item Market share average sales per item
MS Sales R var LY Market share retail sales expressed as a variance to last year’s market share retail sales
MS Sales U var Ly Market share unit sales expressed as a variance to last year’s market share unit sales
MS Sales c Prd Marker share sales expressed as a percent contribution to positions of the product hierarchy
MS SKU Count Market share SKU count for each competitor
MS TO Market share inventory turnover
30 Retek Assort – Assortment and Space Optimization
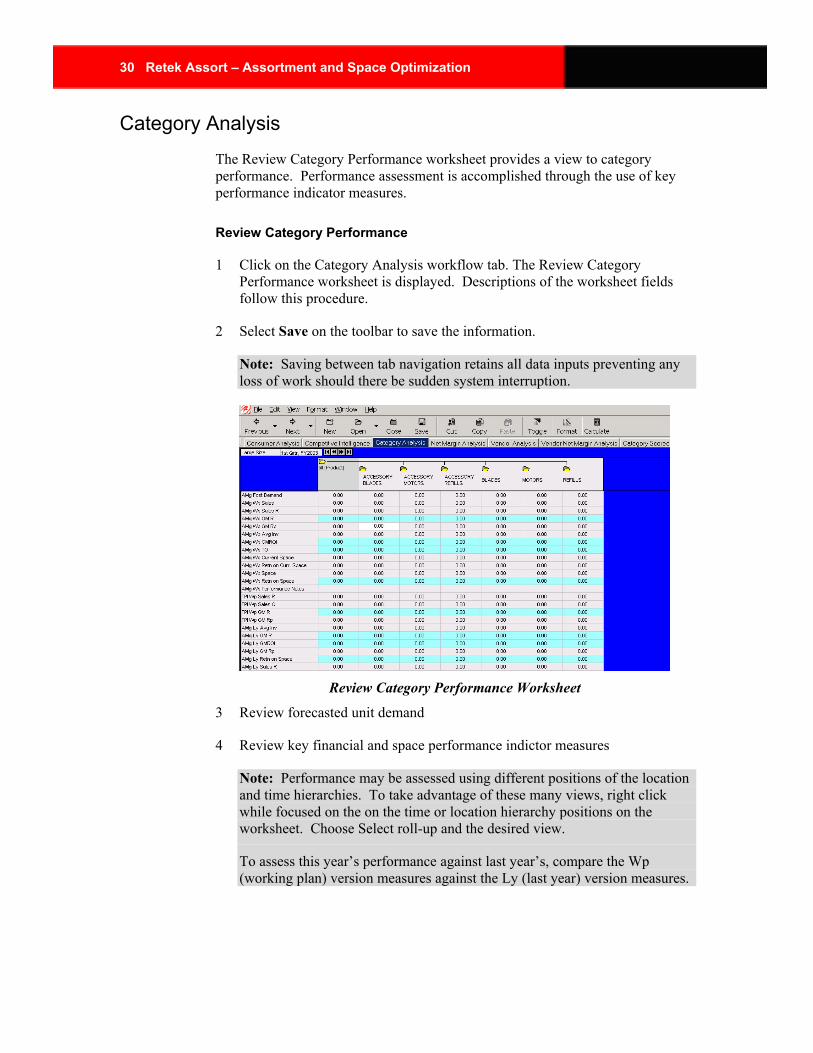
Category Analysis The Review Category Performance worksheet provides a view to category performance. Performance assessment is accomplished through the use of key performance indicator measures.
Review Category Performance
1 Click on the Category Analysis workflow tab. The Review Category Performance worksheet is displayed. Descriptions of the worksheet fields follow this procedure.
2 Select Save on the toolbar to save the information.
Note: Saving between tab navigation retains all data inputs preventing any loss of work should there be sudden system interruption.
Review Category Performance Worksheet
3 Review forecasted unit demand
4 Review key financial and space performance indictor measures
Note: Performance may be assessed using different positions of the location and time hierarchies. To take advantage of these many views, right click while focused on the on the time or location hierarchy positions on the worksheet. Choose Select roll-up and the desired view.
To assess this year’s performance against last year’s, compare the Wp (working plan) version measures against the Ly (last year) version measures.
Chapter 2 – Macro Rationalization 31
5 Enter diary notes into the performance notes text field.
Note: To conduct what – if scenarios, enter values into the Sales R and Space measures to view adjusted Return on Space.
6 Click on Calculate. This initiates any calculations and applies the text information.
7 Select Save on the toolbar to retain all information.
Key Field Descriptions – Review Category Performance Worksheet
Field Label Field Description
Avg Inv Average Inventory
Current Space Current space for each category at the assessment
Current Space c Prd Each product categories percentage contribution to the total space
Demand Forecasted unit demand
GM Gross margin
GMROI Gross margin return on investment
NM Net margin
Performance Notes Text field for entering category performance observations.
Retn. on Curr. Space Return on current space
Retn. on Space Return on planned (working plan) space
Sales Sales
Sales c. Prd Each product categories percentage contribution to sales
Space Planned (working plan) space
Space c. Prd Each product categories percentage contribution to planned space
TO Inventory turn over
32 Retek Assort – Assortment and Space Optimization
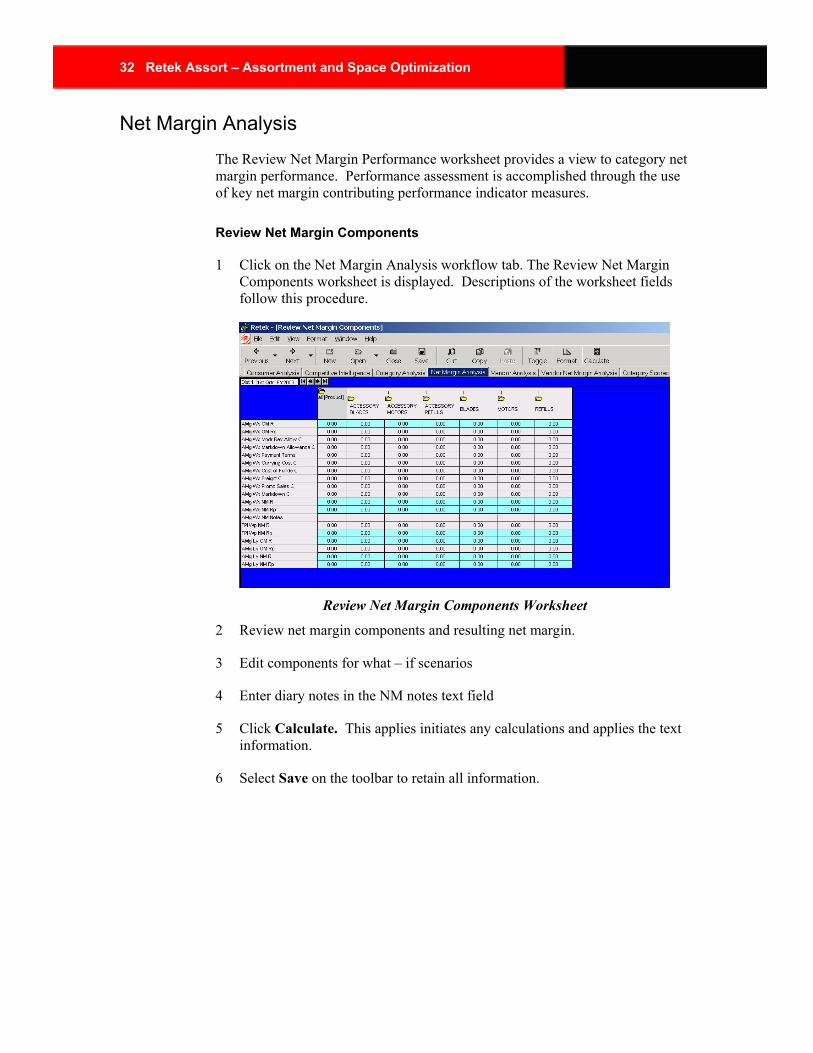
Net Margin Analysis The Review Net Margin Performance worksheet provides a view to category net margin performance. Performance assessment is accomplished through the use of key net margin contributing performance indicator measures.
Review Net Margin Components
1 Click on the Net Margin Analysis workflow tab. The Review Net Margin Components worksheet is displayed. Descriptions of the worksheet fields follow this procedure.
Review Net Margin Components Worksheet
2 Review net margin components and resulting net margin.
3 Edit components for what – if scenarios
4 Enter diary notes in the NM notes text field
5 Click Calculate. This applies initiates any calculations and applies the text information.
6 Select Save on the toolbar to retain all information.
Chapter 2 – Macro Rationalization 33
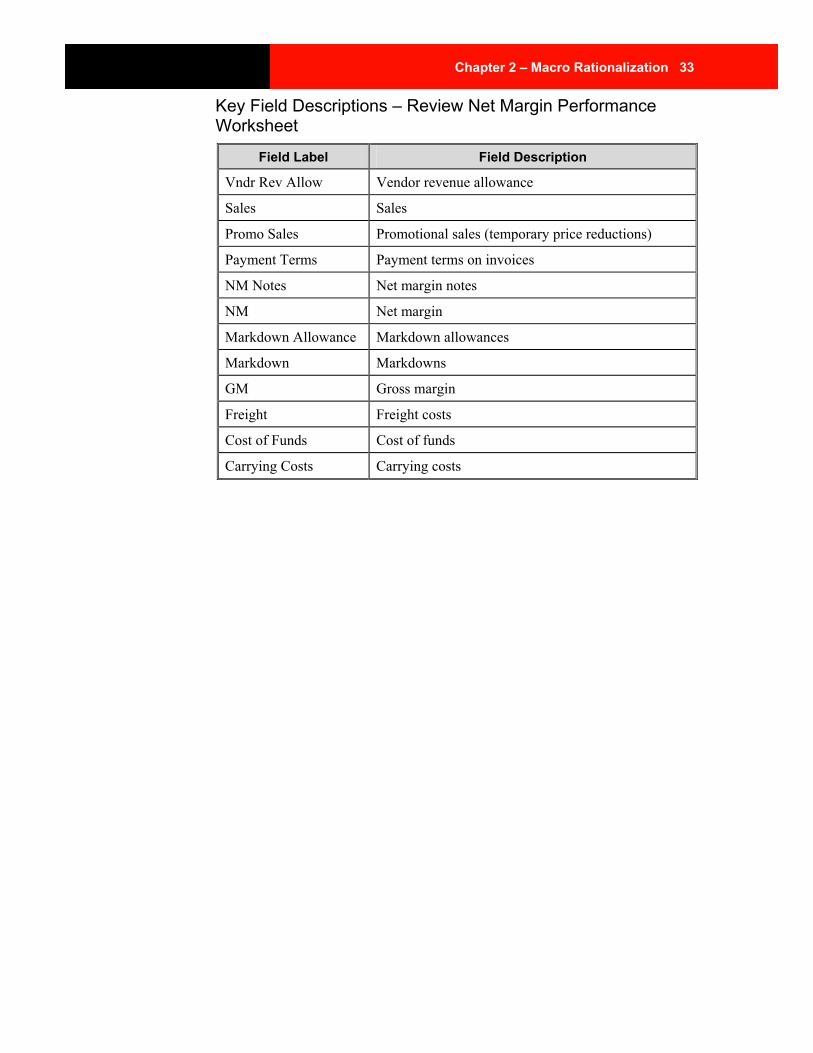
Key Field Descriptions – Review Net Margin Performance Worksheet
Field Label Field Description
Vndr Rev Allow Vendor revenue allowance
Sales Sales
Promo Sales Promotional sales (temporary price reductions)
Payment Terms Payment terms on invoices
NM Notes Net margin notes
NM Net margin
Markdown Allowance Markdown allowances
Markdown Markdowns
GM Gross margin
Freight Freight costs
Cost of Funds Cost of funds
Carrying Costs Carrying costs
34 Retek Assort – Assortment and Space Optimization
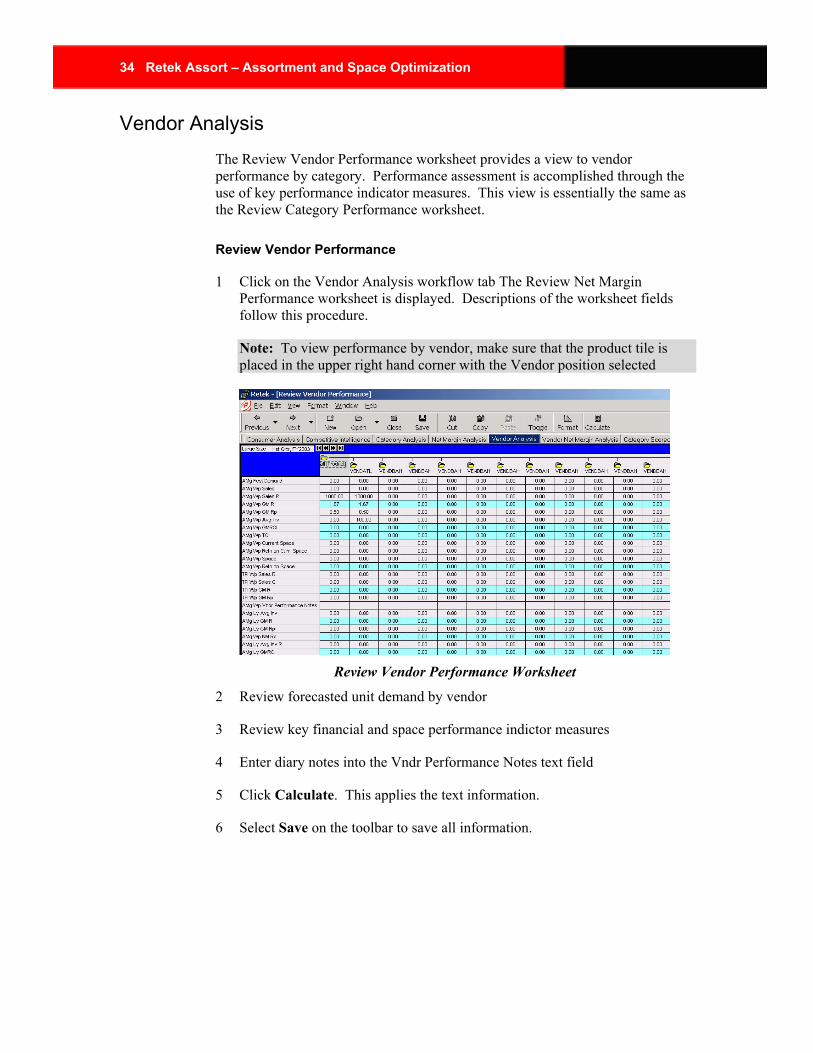
Vendor Analysis The Review Vendor Performance worksheet provides a view to vendor performance by category. Performance assessment is accomplished through the use of key performance indicator measures. This view is essentially the same as the Review Category Performance worksheet.
Review Vendor Performance
1 Click on the Vendor Analysis workflow tab The Review Net Margin Performance worksheet is displayed. Descriptions of the worksheet fields follow this procedure.
Note: To view performance by vendor, make sure that the product tile is placed in the upper right hand corner with the Vendor position selected
Review Vendor Performance Worksheet
2 Review forecasted unit demand by vendor
3 Review key financial and space performance indictor measures
4 Enter diary notes into the Vndr Performance Notes text field
5 Click Calculate. This applies the text information.
6 Select Save on the toolbar to save all information.
Chapter 2 – Macro Rationalization 35
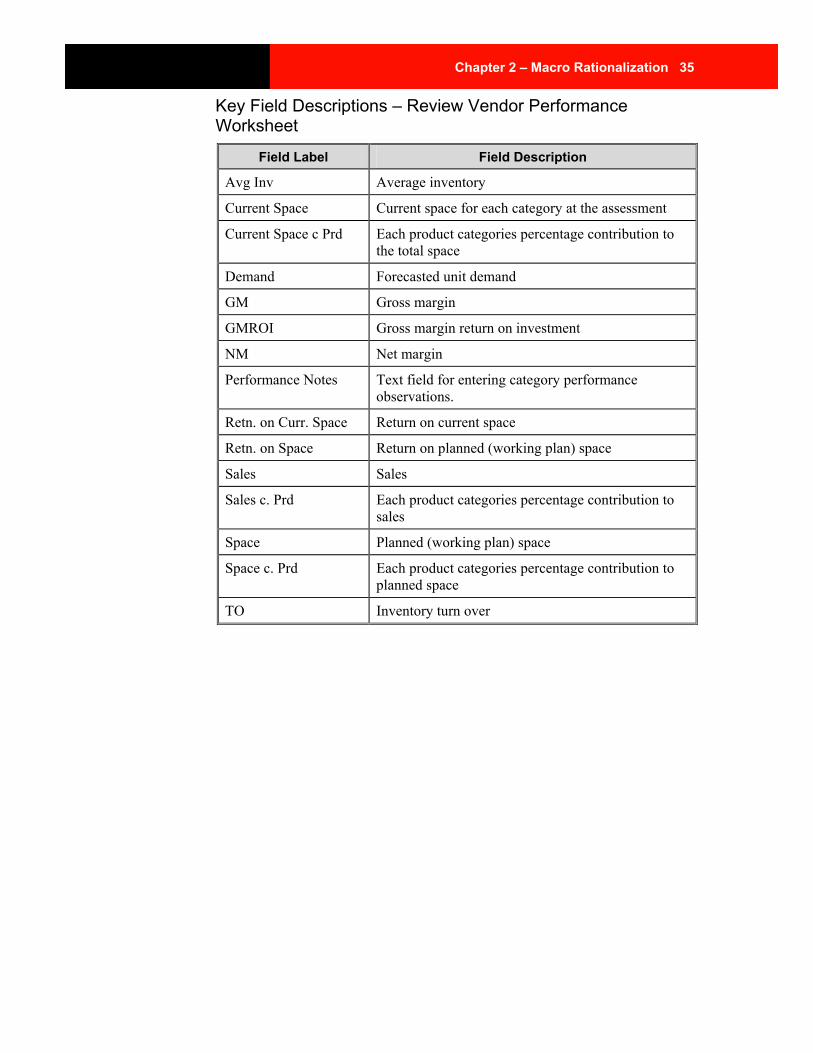
Key Field Descriptions – Review Vendor Performance Worksheet
Field Label Field Description
Avg Inv Average inventory
Current Space Current space for each category at the assessment
Current Space c Prd Each product categories percentage contribution to the total space
Demand Forecasted unit demand
GM Gross margin
GMROI Gross margin return on investment
NM Net margin
Performance Notes Text field for entering category performance observations.
Retn. on Curr. Space Return on current space
Retn. on Space Return on planned (working plan) space
Sales Sales
Sales c. Prd Each product categories percentage contribution to sales
Space Planned (working plan) space
Space c. Prd Each product categories percentage contribution to planned space
TO Inventory turn over
36 Retek Assort – Assortment and Space Optimization
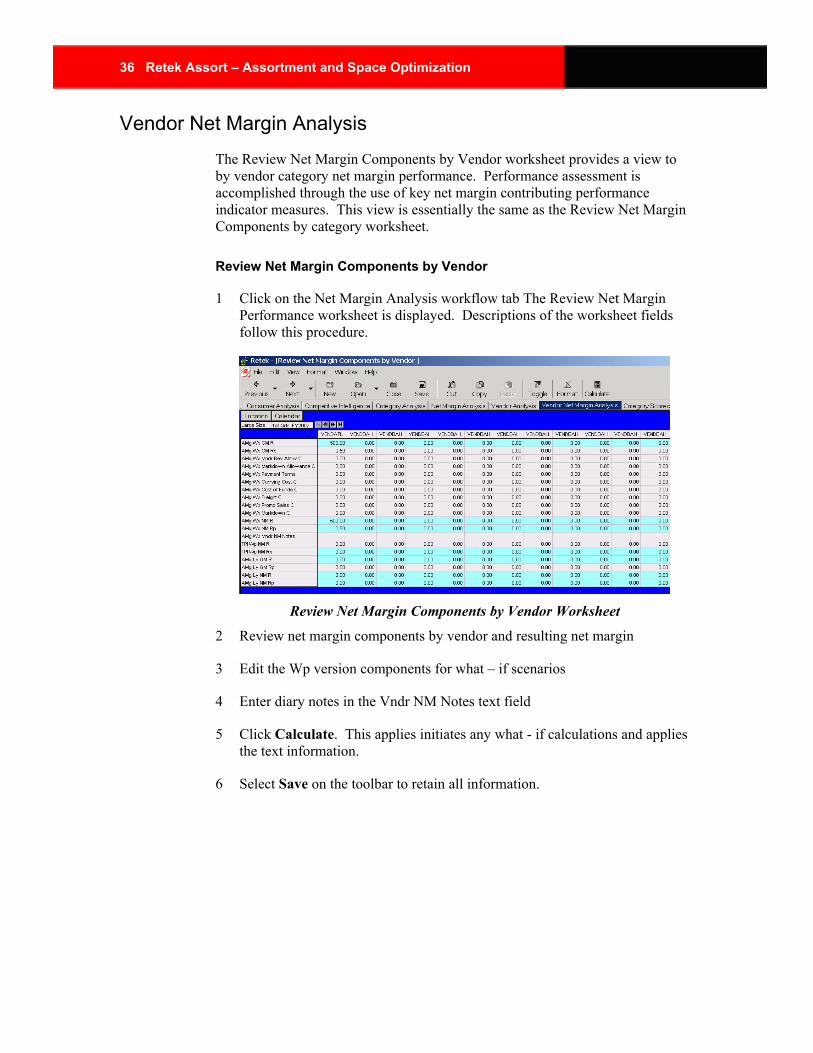
Vendor Net Margin Analysis The Review Net Margin Components by Vendor worksheet provides a view to by vendor category net margin performance. Performance assessment is accomplished through the use of key net margin contributing performance indicator measures. This view is essentially the same as the Review Net Margin Components by category worksheet.
Review Net Margin Components by Vendor
1 Click on the Net Margin Analysis workflow tab The Review Net Margin Performance worksheet is displayed. Descriptions of the worksheet fields follow this procedure.
Review Net Margin Components by Vendor Worksheet
2 Review net margin components by vendor and resulting net margin
3 Edit the Wp version components for what – if scenarios
4 Enter diary notes in the Vndr NM Notes text field
5 Click Calculate. This applies initiates any what - if calculations and applies the text information.
6 Select Save on the toolbar to retain all information.

Chapter 2 – Macro Rationalization 37
Key Field Descriptions – Review Net Margin Components by Vendor
Field Label Field Description
Vndr Rev Allow Vendor revenue allowance
Vndr NM Notes Vendor net margin notes
Sales Sales
Promo Sales Promotional sales (temporary price reduction)
Payment Terms Payment terms
NM Net margin
Markdown Allowance Markdown allowance
Markdown Markdown
GM Gross margin
Freight Freight costs
Cost of Funds Cost of funds
Carrying Costs Carrying costs
38 Retek Assort – Assortment and Space Optimization
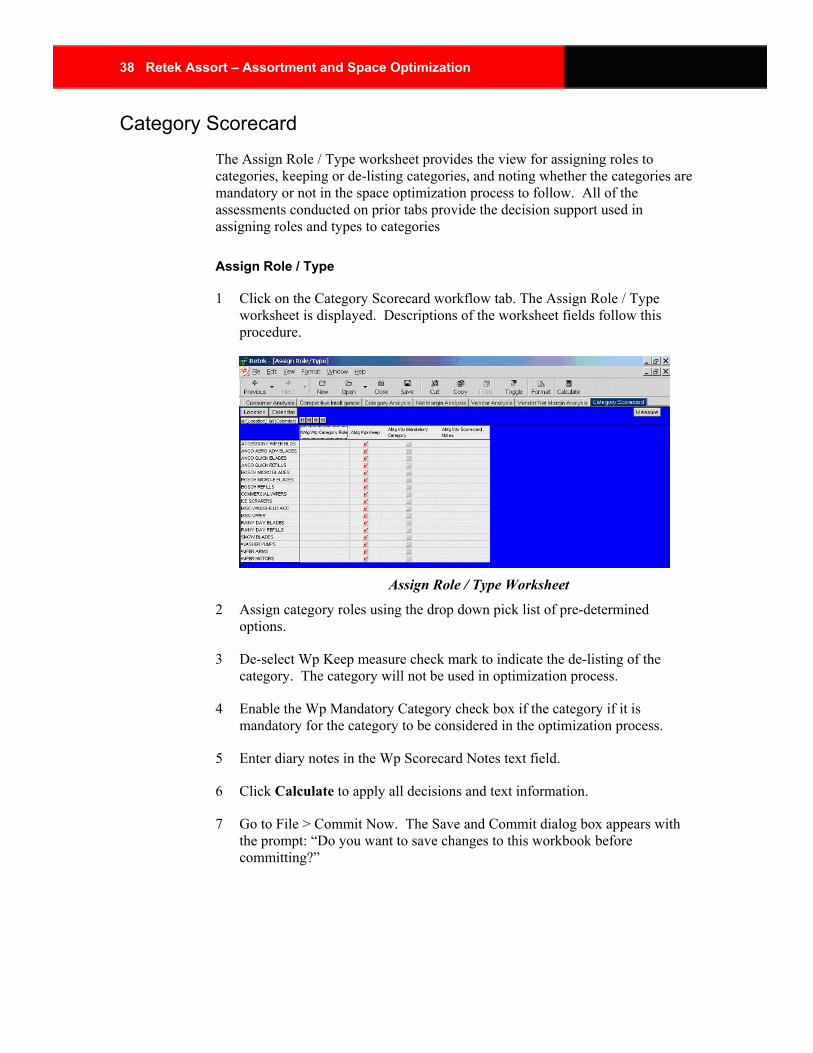
Category Scorecard The Assign Role / Type worksheet provides the view for assigning roles to categories, keeping or de-listing categories, and noting whether the categories are mandatory or not in the space optimization process to follow. All of the assessments conducted on prior tabs provide the decision support used in assigning roles and types to categories
Assign Role / Type
1 Click on the Category Scorecard workflow tab. The Assign Role / Type worksheet is displayed. Descriptions of the worksheet fields follow this procedure.
Assign Role / Type Worksheet
2 Assign category roles using the drop down pick list of pre-determined options.
3 De-select Wp Keep measure check mark to indicate the de-listing of the category. The category will not be used in optimization process.
4 Enable the Wp Mandatory Category check box if the category if it is mandatory for the category to be considered in the optimization process.
5 Enter diary notes in the Wp Scorecard Notes text field.
6 Click Calculate to apply all decisions and text information.
7 Go to File > Commit Now. The Save and Commit dialog box appears with the prompt: “Do you want to save changes to this workbook before committing?”
Chapter 2 – Macro Rationalization 39
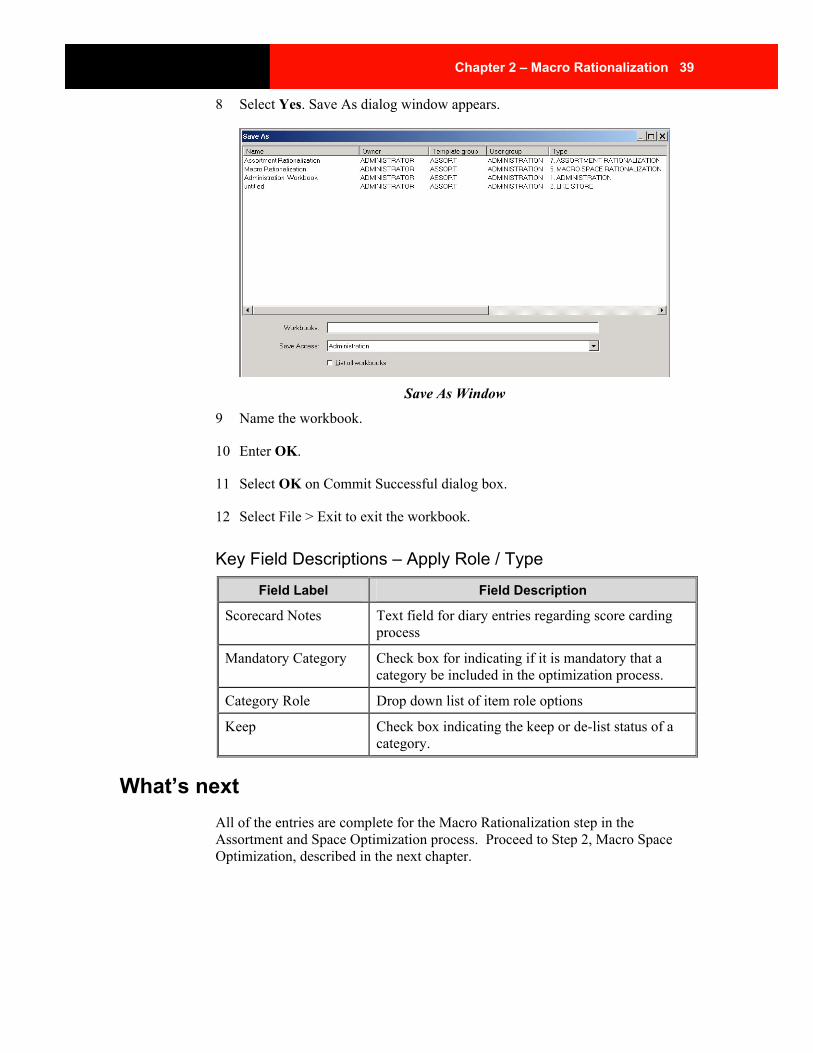
8 Select Yes. Save As dialog window appears.
Save As Window
9 Name the workbook.
10 Enter OK.
11 Select OK on Commit Successful dialog box.
12 Select File > Exit to exit the workbook.
Key Field Descriptions – Apply Role / Type
Field Label Field Description
Scorecard Notes Text field for diary entries regarding score carding process
Mandatory Category Check box for indicating if it is mandatory that a category be included in the optimization process.
Category Role Drop down list of item role options
Keep Check box indicating the keep or de-list status of a category.
What’s next All of the entries are complete for the Macro Rationalization step in the Assortment and Space Optimization process. Proceed to Step 2, Macro Space Optimization, described in the next chapter.

Chapter 3 – Macro Space Optimization 41
Chapter 3 – Macro Space Optimization Macro Space Optimization occurs on two levels of the organizational hierarchy. The first level is typically at the department and above level. The second is sub-category to department. Each level is distinguished from the other through the assignment of roles: Executive at the highest level and Manager at the level below and through separate workbooks. The processes and metrics in each workbook are the same. The measures are distinguished by role with AEx (Assort Executive) in the Macro Space Optimization EX workbook and AMg (Assort Manager) in the Macro Space Optimization workbook.
Note: The Executive User is thought to be most interested in the allocation of square footage. The Manager role typically is concerned with the base linear footage derived in collaboration with space planning organization. For the purposes of optimization, there is no understanding of square or base linear footage. The space measure used in the optimization routine recognizes the number numeric value entered, not its intent.
For the purposes of this documentation, both the Macro Space Optimization EX workbook and Macro Space Optimization workbook are detailed in this section.
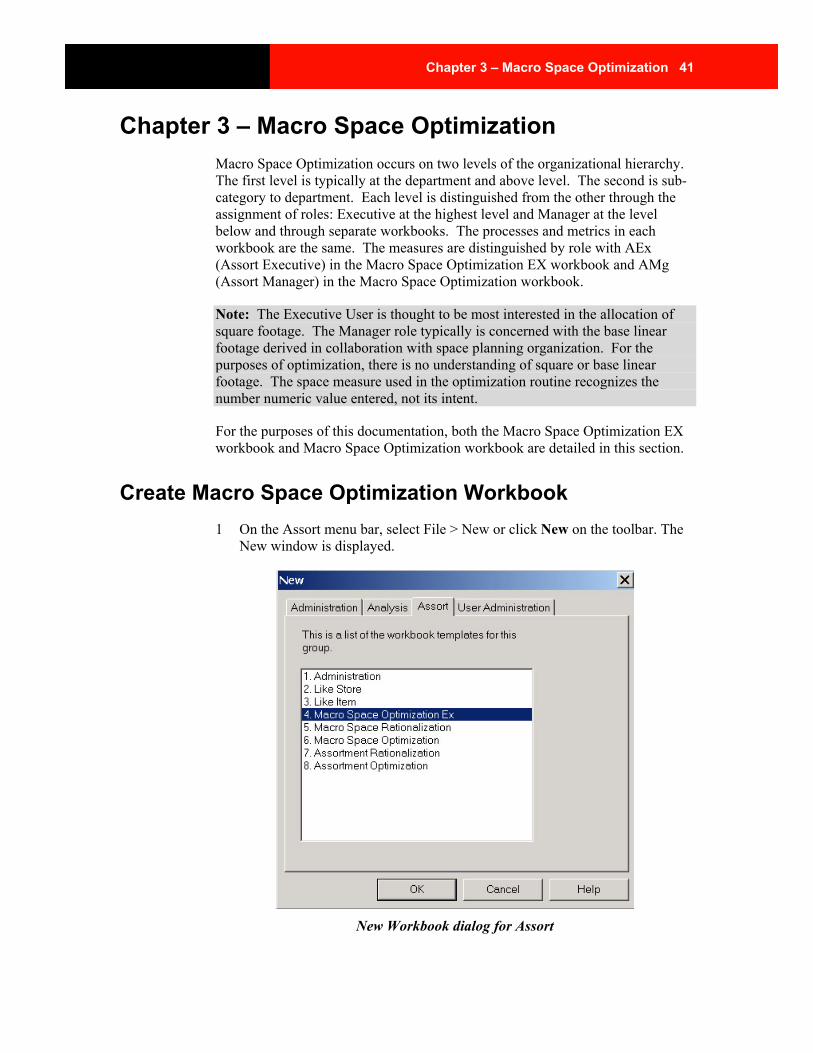
Create Macro Space Optimization Workbook 1 On the Assort menu bar, select File > New or click New on the toolbar. The
New window is displayed.
New Workbook dialog for Assort
42 Retek Assort – Assortment and Space Optimization
2 On the Assort tab, select Macro Space Optimization and click OK. The Macro Space Optimization Wizard opens. Using this wizard, you define several important plan parameters.
The Macro Space Optimization wizards have several buttons for navigating the wizard windows.
Button Name Button Description
Cancel Exits the window without saving changes or entries.
Help Displays a list of help topics available in Assort.
<Back Returns to the previous wizard question or window.
>Next Accepts the entry and moves to the next question or window.
Finish Completes the wizard entries and builds the windows for the planning steps.
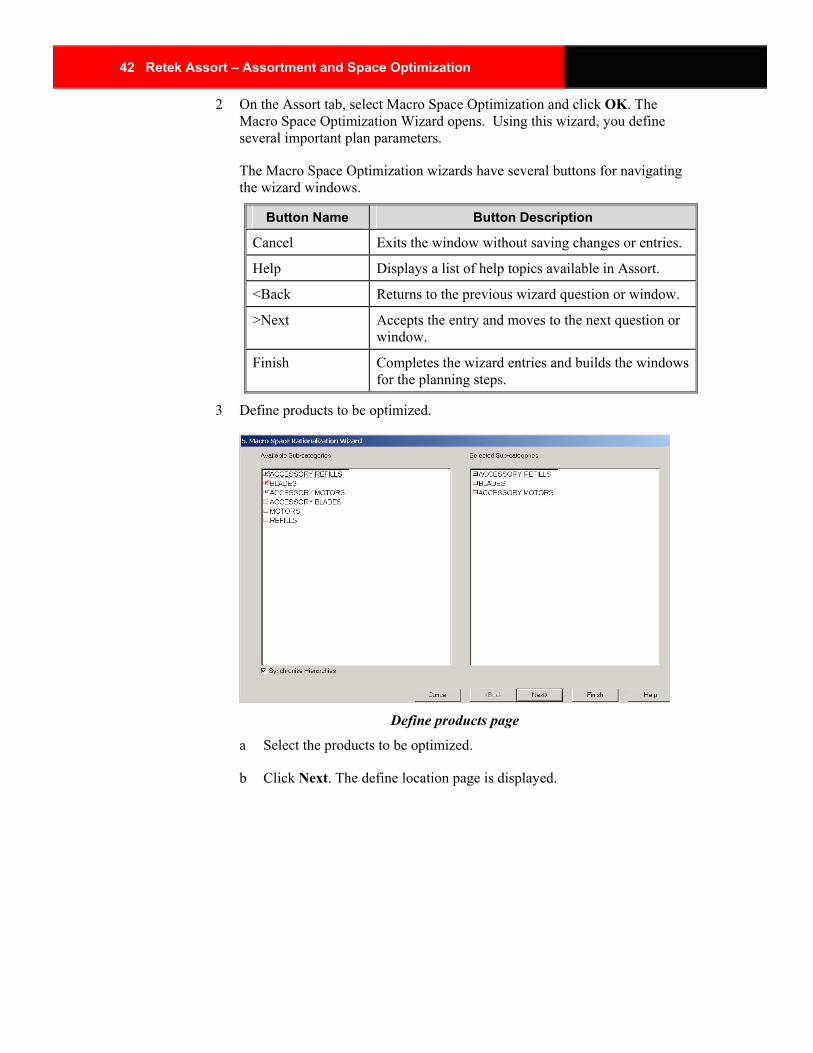
3 Define products to be optimized.
Define products page
a Select the products to be optimized.
b Click Next. The define location page is displayed.
Chapter 3 – Macro Space Optimization 43
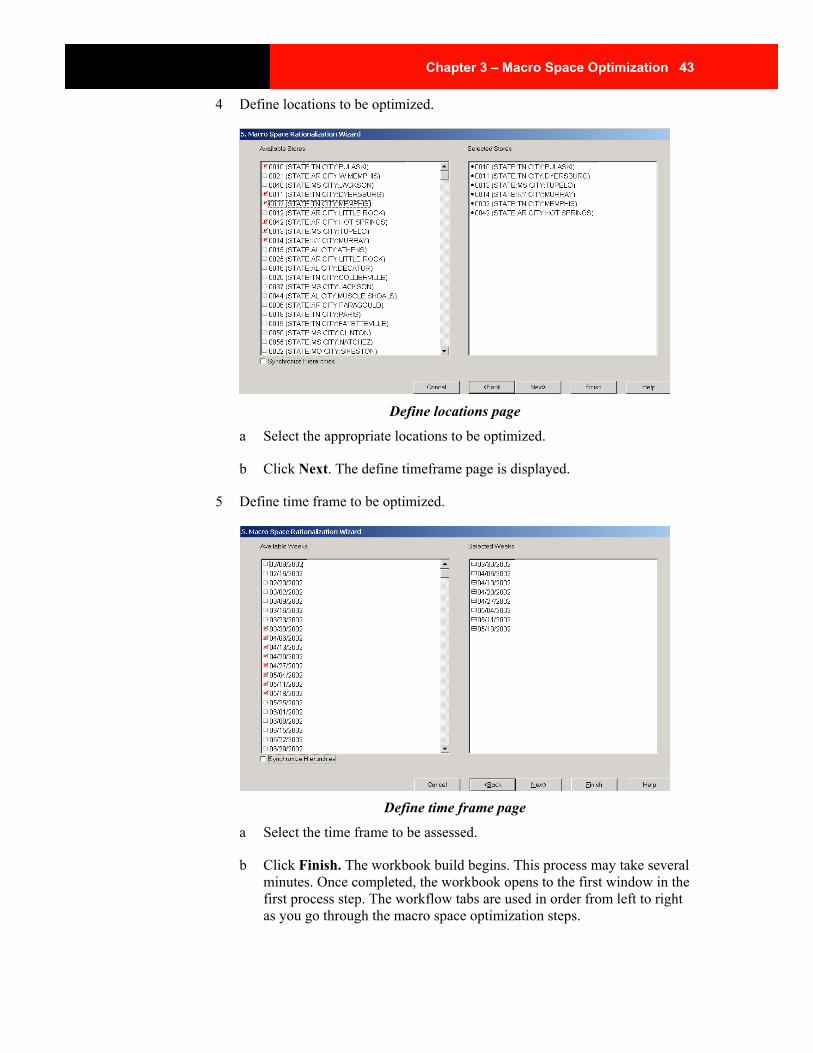
4 Define locations to be optimized.
Define locations page
a Select the appropriate locations to be optimized.
b Click Next. The define timeframe page is displayed.
5 Define time frame to be optimized.
Define time frame page
a Select the time frame to be assessed.
b Click Finish. The workbook build begins. This process may take several minutes. Once completed, the workbook opens to the first window in the first process step. The workflow tabs are used in order from left to right as you go through the macro space optimization steps.
44 Retek Assort – Assortment and Space Optimization
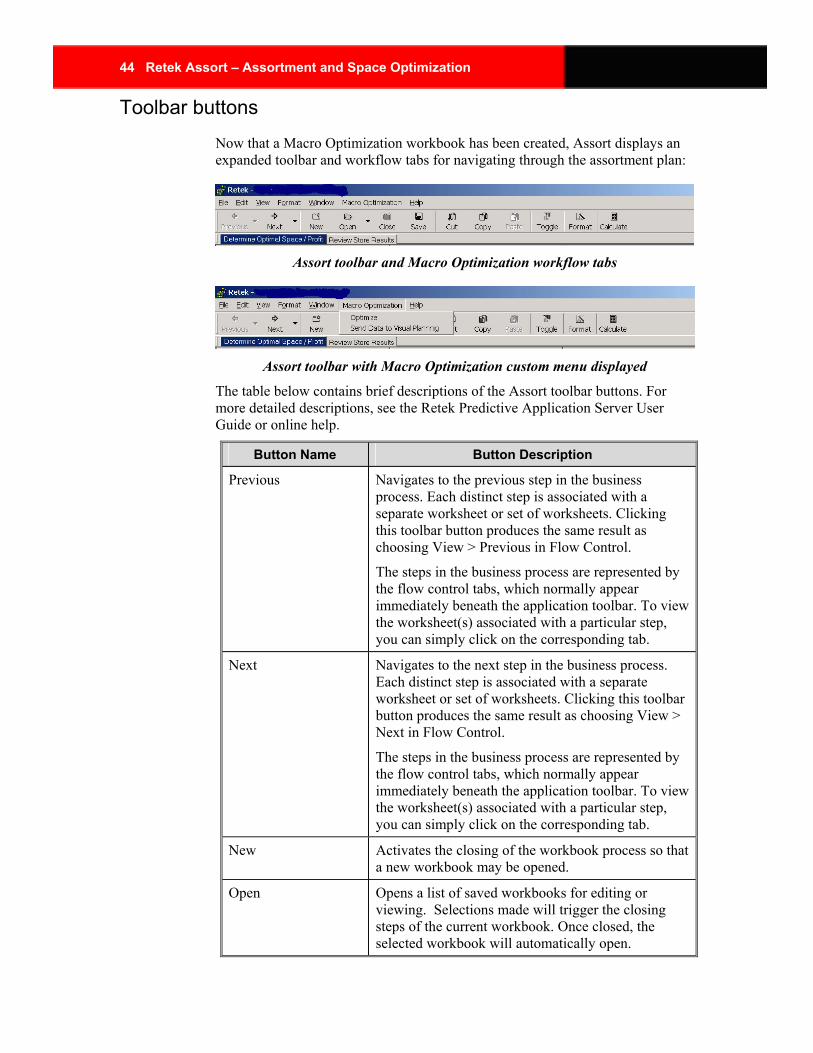
Toolbar buttons Now that a Macro Optimization workbook has been created, Assort displays an expanded toolbar and workflow tabs for navigating through the assortment plan:
Assort toolbar and Macro Optimization workflow tabs
Assort toolbar with Macro Optimization custom menu displayed
The table below contains brief descriptions of the Assort toolbar buttons. For more detailed descriptions, see the Retek Predictive Application Server User Guide or online help.
Button Name Button Description
Previous Navigates to the previous step in the business process. Each distinct step is associated with a separate worksheet or set of worksheets. Clicking this toolbar button produces the same result as choosing View > Previous in Flow Control.
The steps in the business process are represented by the flow control tabs, which normally appear immediately beneath the application toolbar. To view the worksheet(s) associated with a particular step, you can simply click on the corresponding tab.
Next Navigates to the next step in the business process. Each distinct step is associated with a separate worksheet or set of worksheets. Clicking this toolbar button produces the same result as choosing View > Next in Flow Control.
The steps in the business process are represented by the flow control tabs, which normally appear immediately beneath the application toolbar. To view the worksheet(s) associated with a particular step, you can simply click on the corresponding tab.
New Activates the closing of the workbook process so that a new workbook may be opened.
Open Opens a list of saved workbooks for editing or viewing. Selections made will trigger the closing steps of the current workbook. Once closed, the selected workbook will automatically open.
Chapter 3 – Macro Space Optimization 45
Button Name Button Description
Close Closes the currently opened workbook. There are a number of options for saving changes before closing.
Save Saves all information in the plan, including the current layout of windows within the steps. This has the same result as selecting File > Save or clicking Save on the toolbar.
Cut Copies selected worksheet data to an application clipboard and clears the data from the worksheet cells. Same action as choosing Edit > Cut. Only data from write able measures can be cut.
Copy Copies data at base level.
Paste Transfers data from the application clipboard to the cursor location. Multiple measure cut/copy in outline mode only supports read/write cells.
Toggle Display changes from grid view to graph (chart) view.
Format Allows you to customize the grid or chart view of assessment data.
Calculate Reads recent entries and applies the entries across all calculations.
Note: Assort calculates automatically when the active window is changed or when F9 is selected. In addition, deferred calculations can be undone by selecting Edit from the menu, then selecting Remove Last or Remove All Deferred Calculations.
Menu options The main menu options are described in detail in the online help accessible from the Help menu when running Assort, and in the Retek Predictive Application Server User Guide.
The custom menu component of the tool bar labeled Macro Optimization, once clicked on, produces a drop down list of User initiated actions that take place inside of the Marco Optimization workbook. They are detailed below:
Action Action Description
Optimize Initiates the running of the optimization routine.
Send Data to Visual Planning
Initiates the sending of optimized space recommendations to the visual planning application.
46 Retek Assort – Assortment and Space Optimization
Macro Space Optimization workflow tabs The macro space optimization workflow tabs are below the Assort toolbar and are used to move between sets of windows displaying aspects of optimizing category profit and space. You can either click on the workflow tabs, or use Next and Previous on the toolbar to move between them. The workflow tabs for macro rationalization are as follows:
Process Step Tab Descriptions
Determine Optimal Space / Profit
The Determine Optimal Space / Profit tab provides the ability to manipulate optimization constraints, view, and assess the results of the optimization routine. The results of this process step are viewed at aggregated levels such as store cluster and phase.
Review Store Results The Review Store Results tab provides a store level view of the optimization routine produced in the first step of the process. If desired, individual stores may be re-optimized in this view.
Determine Optimal Space / Profit Identification of constraints and macro space optimization take place on worksheets found under the Determine Optimal Space / Profit workflow tab. An additional worksheet is provided supplying a visual representation of the space to profit relationship data points. The worksheet procedures are described below.
Optimization Constraints
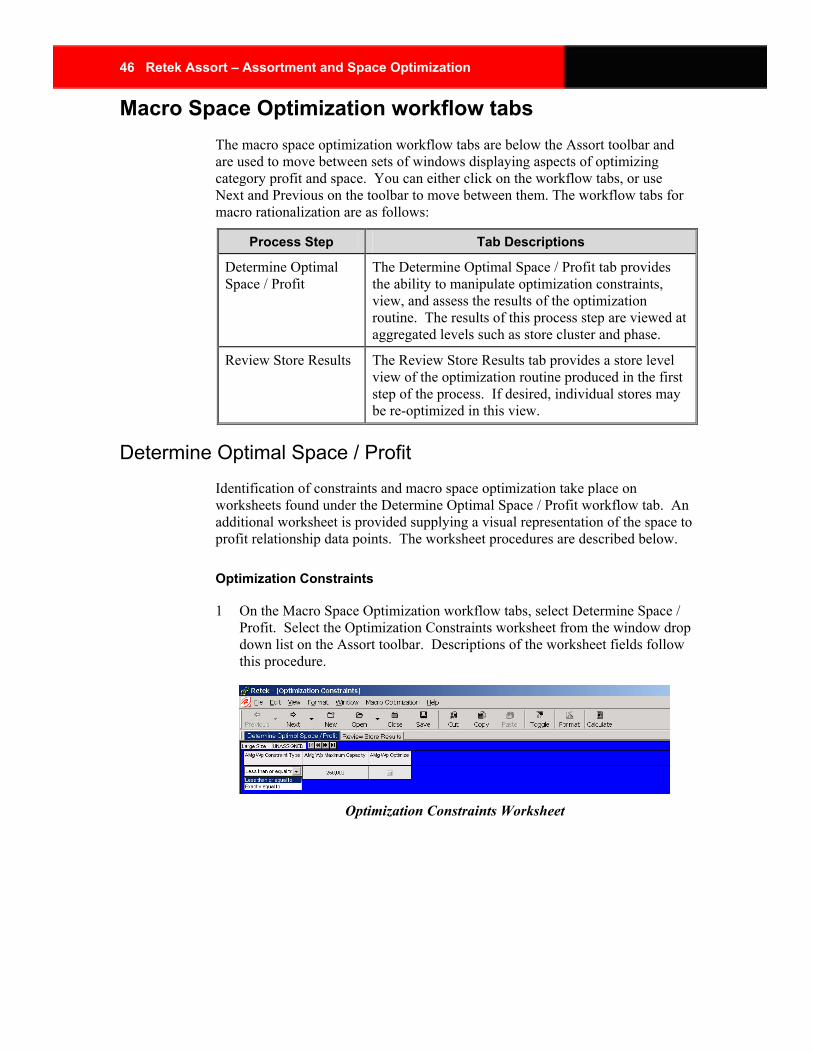
1 On the Macro Space Optimization workflow tabs, select Determine Space / Profit. Select the Optimization Constraints worksheet from the window drop down list on the Assort toolbar. Descriptions of the worksheet fields follow this procedure.
Optimization Constraints Worksheet
Chapter 3 – Macro Space Optimization 47
2 Select the constraint type from the drop down list provided.
3 Enter the maximum space available for optimization.
4 Select Calculate to apply data entered.
5 Select Save to retain the data.
Note: The Optimize check box measure will not be used until all optimization information is provided in the step below.
Key Field Descriptions – Optimization Constraints
Field Label Field Description
Constraint Type Constraint type is a single select drop down list consisting of two options. Choosing ‘less than or equal to’ produces the highest profit recommendation which is based upon using less space than or equal to the space constraint. Choosing ‘exactly equal to’ forces the optimization routine to choose the highest profit using the exact amount of space provided by the constraint.
Maximum Capacity The maximum space available to be allocated.
Optimize Check box measure that must be initialized to produce optimization results.
Optimize Space and Profit
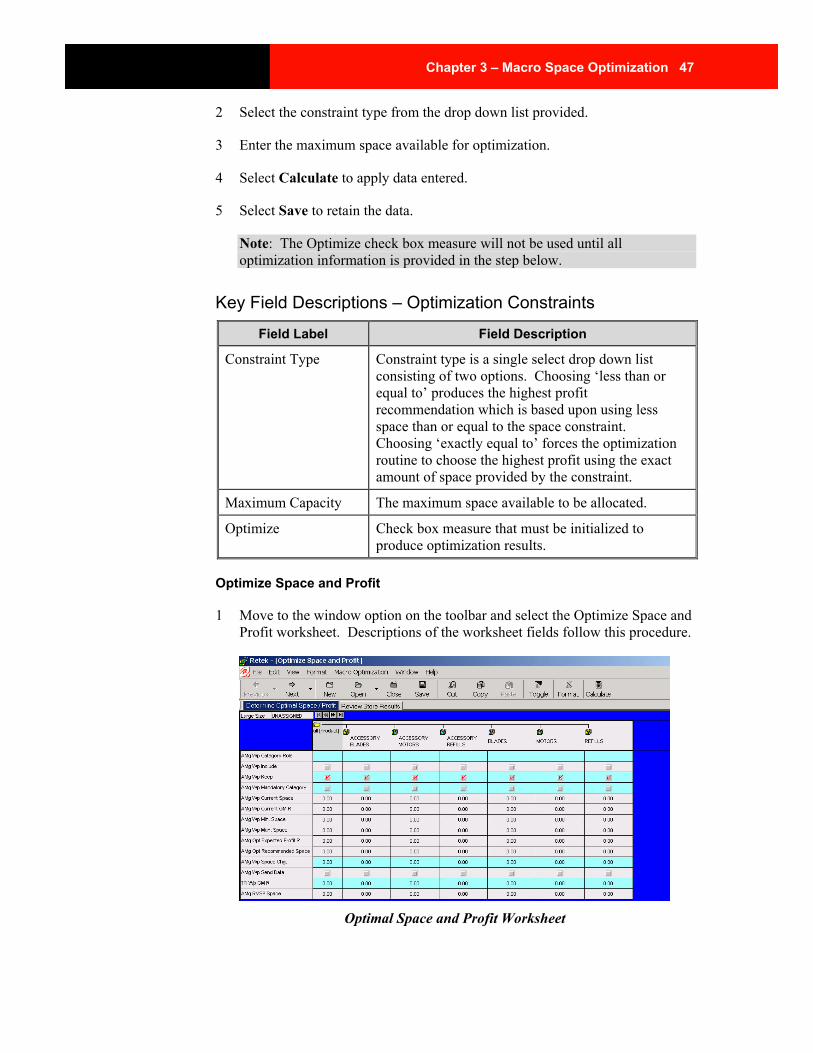
1 Move to the window option on the toolbar and select the Optimize Space and Profit worksheet. Descriptions of the worksheet fields follow this procedure.
Optimal Space and Profit Worksheet
48 Retek Assort – Assortment and Space Optimization
2 Review Category Role as designated in the Macro Rationalization workbook.
3 Enable Include check box measure if the category is to be included in the optimization routine.
4 Review Keep measure as designated in the Macro Rationalization workbook.
5 Review the Mandatory Category check box measure as designated in the Macro Rationalization workbook.
6 Review Current Space measure.
7 Review Current GM R measure.
8 Review Space recommendation from visual store planning application.
9 Enter numeric value into the Min. Space measure.
10 Enter numeric value into the Max. Space measure.
11 Select Calculate to apply inputs.
12 Return to the Optimization Constraints Worksheet. Enable the Optimize check box. Select Calculate to apply.
13 Click on Macro Optimization label on the Assort toolbar.
14 Select Optimize from the drop down options to begin the optimization routine.
15 Return to the Optimal Space and Profit worksheet.
16 Review optimized results Expected Profit R measure.
17 Review optimized results Recommended Space measure.
18 Review Space Chg. Measure
19 Compare the Expected Profit R measure to the GM R target from the financial planning process.
20 Review / adjust optimization inputs as needed.
21 Select Calculate to apply changes.
22 Return to the Optimization Constraints Worksheet. Enable the Optimize check box. Select Calculate to apply.
23 Click on Macro Optimization label on the Assort toolbar.
Chapter 3 – Macro Space Optimization 49
24 Select Optimize from the drop down options to re-initialize the optimization routine.
25 Click on the Send Data check box to initiate the passing of data from the optimal routine to the space planning application.
Note: You may choose to send data for selected categories by checking the Send Data check box at the Category level.
26 Select Calculate to apply the Send Data command
27 Click on Macro Optimization label on the Assort toolbar.
28 Select Send Data to Visual Planning to pass optimized space and profit to the space planning application.
29 Review adjusted space recommendations in the RVSP Space measure.
30 Enter the space planning recommendation into both the Min. Space and Max.Space measures, to accept the space planning recommendation.
31 Repeat optimization steps outlined above.
32 Select Save to retain the information
Key Field Descriptions – Optimize Space and Profit Worksheet
Field Label Field Description
Category Role Strategic role assigned to categories in the Macro Rationalization process.
Include Check box measure indicating whether the category should be included in the optimization routine.
Keep Check box measure from Macro Rationalization process step indicating the keep or de-list status of a category.
Mandatory Category Check box measure indicating if it is mandatory that space be recommended for the category
Current Space Current space that the category occupies at the time of the optimization activity.
Current GM Current gross margin of the category resulting from the current space
Min. Space Minimum amount of space allowed to be recommended
Max. Space Maximum amount of space allowed to be recommended
50 Retek Assort – Assortment and Space Optimization
Field Label Field Description
Expected Profit Expected profit resulting from the optimization routine
Recommended Space Recommended space resulting from the optimization routine.
Space Chg. Difference between Current Space and the Recommended Space
Send Data Check box used to initiate the passing of data between Assort and the space planning application
GM Target gross margin from financial planning
Space Space recommendation from the space planning application
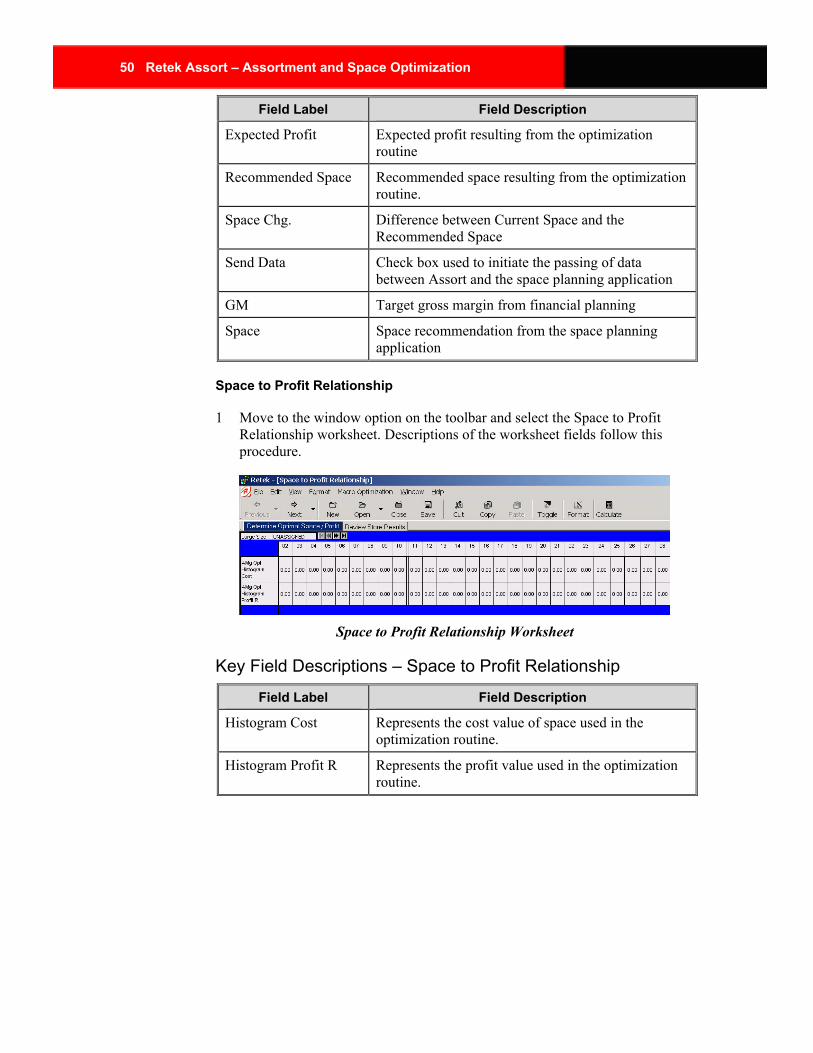
Space to Profit Relationship
1 Move to the window option on the toolbar and select the Space to Profit Relationship worksheet. Descriptions of the worksheet fields follow this procedure.
Space to Profit Relationship Worksheet
Key Field Descriptions – Space to Profit Relationship
Field Label Field Description
Histogram Cost Represents the cost value of space used in the optimization routine.
Histogram Profit R Represents the profit value used in the optimization routine.
Chapter 3 – Macro Space Optimization 51
Review Store Results Reviewing store level optimization results takes place in the worksheets found under the Review Store Results workflow tab. Once the space planning application processes the initial optimal space recommendations, and execution of floor layouts begins, there may be a need to communicate back to Assort exceptions to the initial optimal recommendations. After review, there may be a need to re- optimize in Assort based on those space planning, individual store constraints.
Optimize
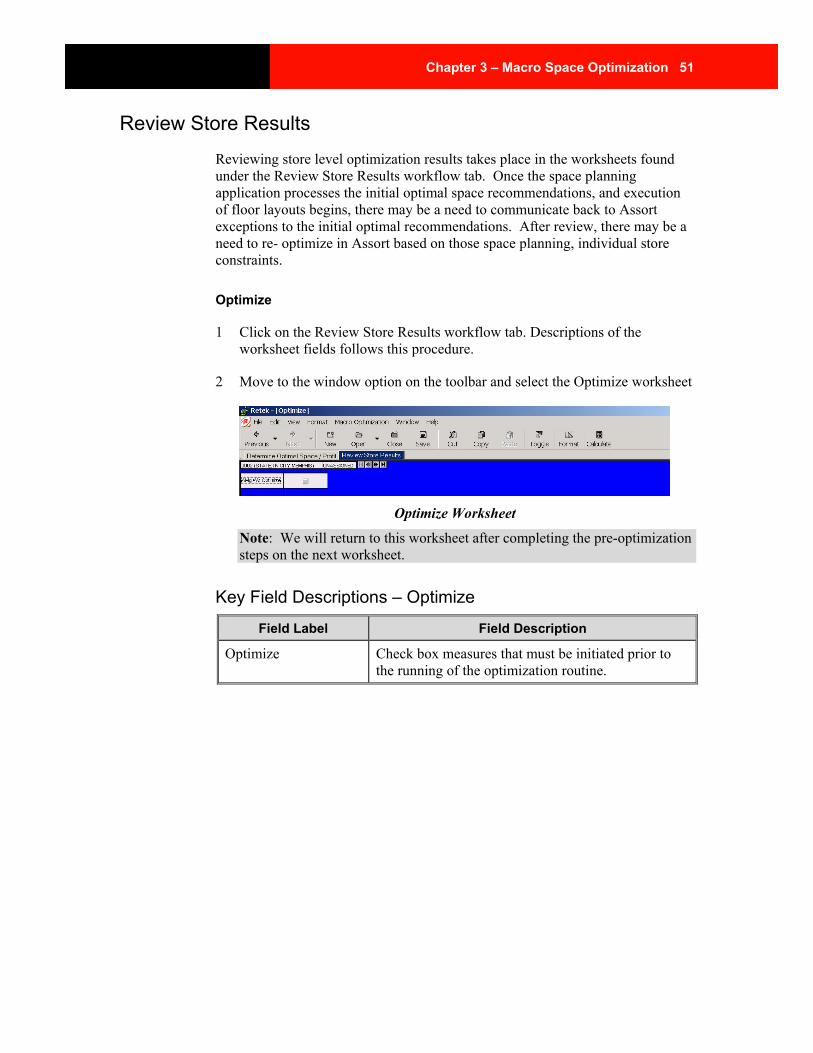
1 Click on the Review Store Results workflow tab. Descriptions of the worksheet fields follows this procedure.
2 Move to the window option on the toolbar and select the Optimize worksheet
Optimize Worksheet
Note: We will return to this worksheet after completing the pre-optimization steps on the next worksheet.
Key Field Descriptions – Optimize
Field Label Field Description
Optimize Check box measures that must be initiated prior to the running of the optimization routine.
52 Retek Assort – Assortment and Space Optimization
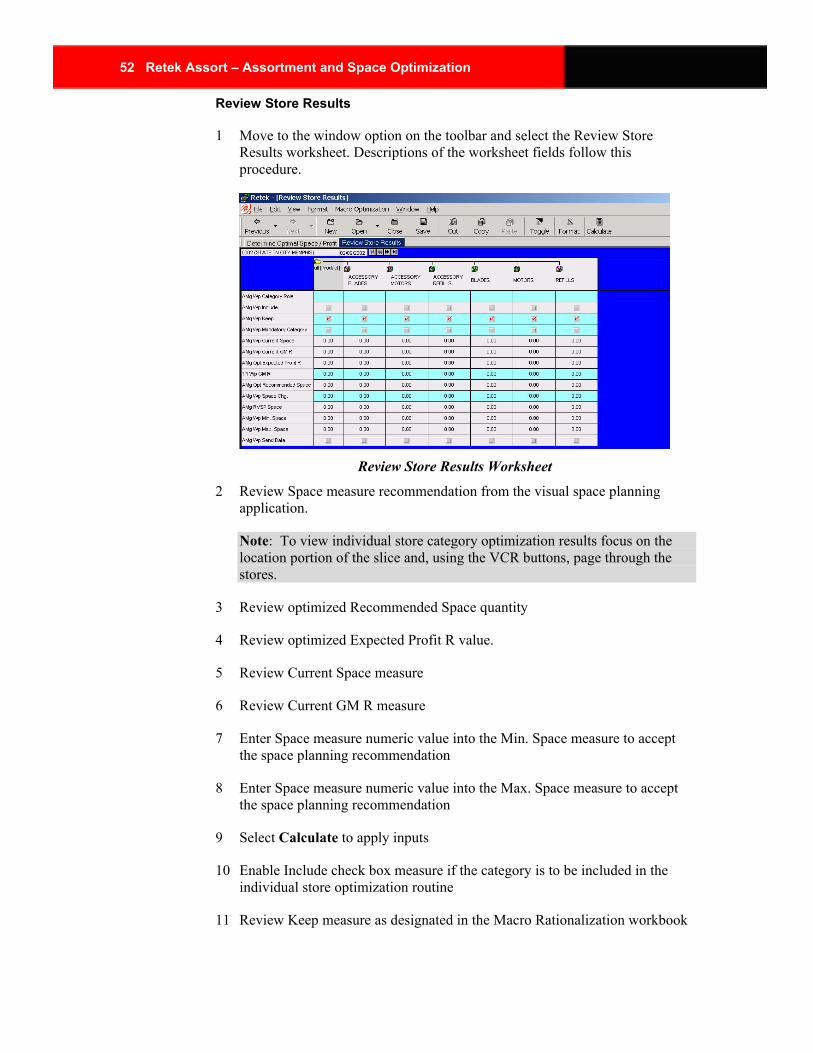
Review Store Results
1 Move to the window option on the toolbar and select the Review Store Results worksheet. Descriptions of the worksheet fields follow this procedure.
Review Store Results Worksheet
2 Review Space measure recommendation from the visual space planning application.
Note: To view individual store category optimization results focus on the location portion of the slice and, using the VCR buttons, page through the stores.
3 Review optimized Recommended Space quantity
4 Review optimized Expected Profit R value.
5 Review Current Space measure
6 Review Current GM R measure
7 Enter Space measure numeric value into the Min. Space measure to accept the space planning recommendation
8 Enter Space measure numeric value into the Max. Space measure to accept the space planning recommendation
9 Select Calculate to apply inputs
10 Enable Include check box measure if the category is to be included in the individual store optimization routine
11 Review Keep measure as designated in the Macro Rationalization workbook
Chapter 3 – Macro Space Optimization 53
12 Enable the Mandatory Category check box measure if it is mandatory that the category be allocated space in the optimization routine
13 Select Calculate to apply inputs
14 Return to the Optimize worksheet. Enable the Optimize check box. Select Calculate to apply
15 Click on Macro Optimization label on the Assort toolbar
16 Select Optimize from the drop down options to begin the optimization routine
17 Review optimized Recommended Space quantity
18 Review optimized Expected Profit R value
19 Click on the Send Data check box to initiate the passing of data from Assort to the space planning application
20 Select Calculate to apply the Send Data command
21 Click on Macro Optimization label on the Assort toolbar
22 Select Send Data to Visual Planning to pass optimized space and profit to the space planning application.
23 Go to File > Commit Now. The Save and Commit dialog box appears with the prompt: “Do you want to save changes to this workbook before committing?”
24 Select Yes. Save As dialog window appears.
Save As Window
54 Retek Assort – Assortment and Space Optimization
25 Name the workbook.
26 Select OK.
27 Select OK on Commit Successful dialog box
28 Select File > Exit to exit the workbook.
29 Select File > Exit to exit the workbook.
Key Field Descriptions – Review Store Results Worksheet
Field Label Field Description
Category Role Strategic role assigned to categories in the Macro Rationalization process.
Include Check box measure indicating whether the category should be included in the optimization routine.
Keep Check box measure from Macro Rationalization process step indicating the keep or de-list status of a category.
Mandatory Category Check box measure indicating if it is mandatory that space be recommended for the category
Current Space Current space that the category occupies at the time of the optimization activity.
Current GM Current gross margin of the category resulting from the current space
Min. Space Minimum amount of space allowed to be recommended
Max. Space Maximum amount of space allowed to be recommended
Expected Profit Expected profit resulting from the optimization routine
Recommended Space Recommended space resulting from the optimization routine.
Space Chg. Difference between Current Space and the Recommended Space
Send Data Check box used to initiate the passing of data between Assort and the space planning application
GM Target gross margin from financial planning
Space Space recommendation from the space planning application

Chapter 3 – Macro Space Optimization 55
What’s next All of the entries are complete for the Macro Space Optimization step of the assortment and space optimization process. Proceed to Step 3, Assortment Rationalization, described in the next chapter.

Chapter 4 – Assortment Rationalization 57
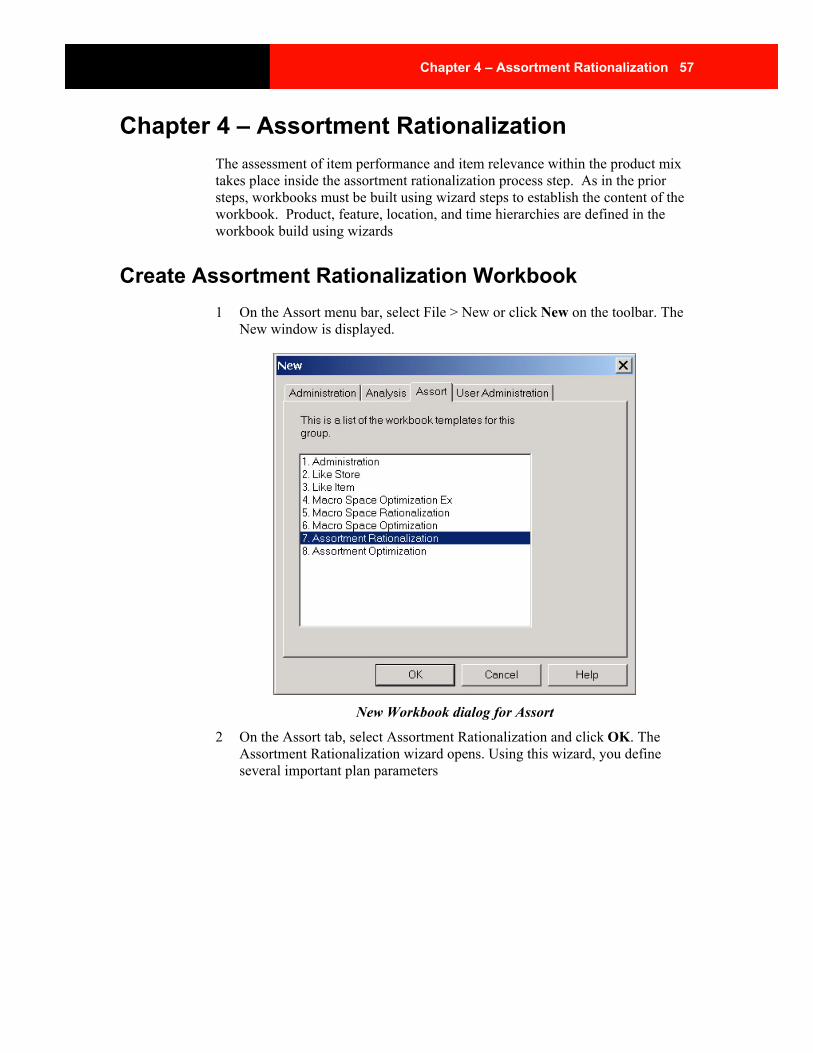
Chapter 4 – Assortment Rationalization The assessment of item performance and item relevance within the product mix takes place inside the assortment rationalization process step. As in the prior steps, workbooks must be built using wizard steps to establish the content of the workbook. Product, feature, location, and time hierarchies are defined in the workbook build using wizards
Create Assortment Rationalization Workbook 1 On the Assort menu bar, select File > New or click New on the toolbar. The
New window is displayed.
New Workbook dialog for Assort
2 On the Assort tab, select Assortment Rationalization and click OK. The Assortment Rationalization wizard opens. Using this wizard, you define several important plan parameters
58 Retek Assort – Assortment and Space Optimization
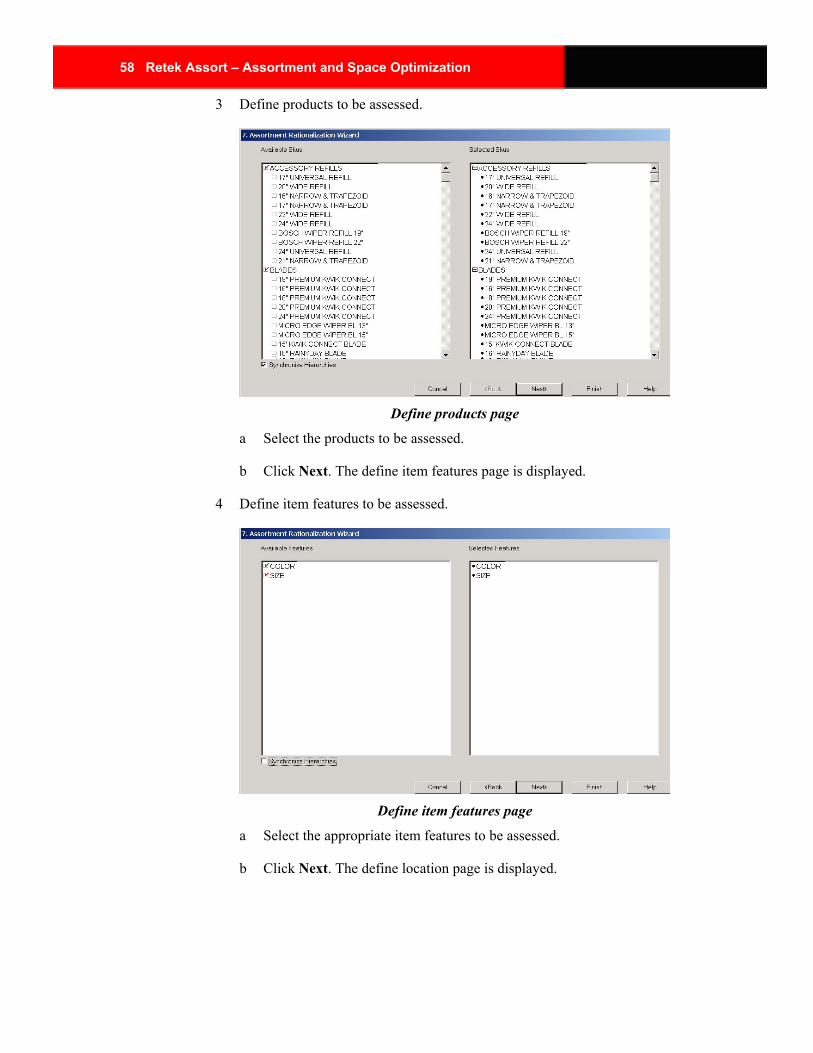
3 Define products to be assessed.
Define products page
a Select the products to be assessed.
b Click Next. The define item features page is displayed.
4 Define item features to be assessed.
Define item features page
a Select the appropriate item features to be assessed.
b Click Next. The define location page is displayed.
Chapter 4 – Assortment Rationalization 59
5 Define locations to be assessed.
Define locations page
a Select the appropriate locations to be assessed.
b Click Next. The define timeframe page is displayed.
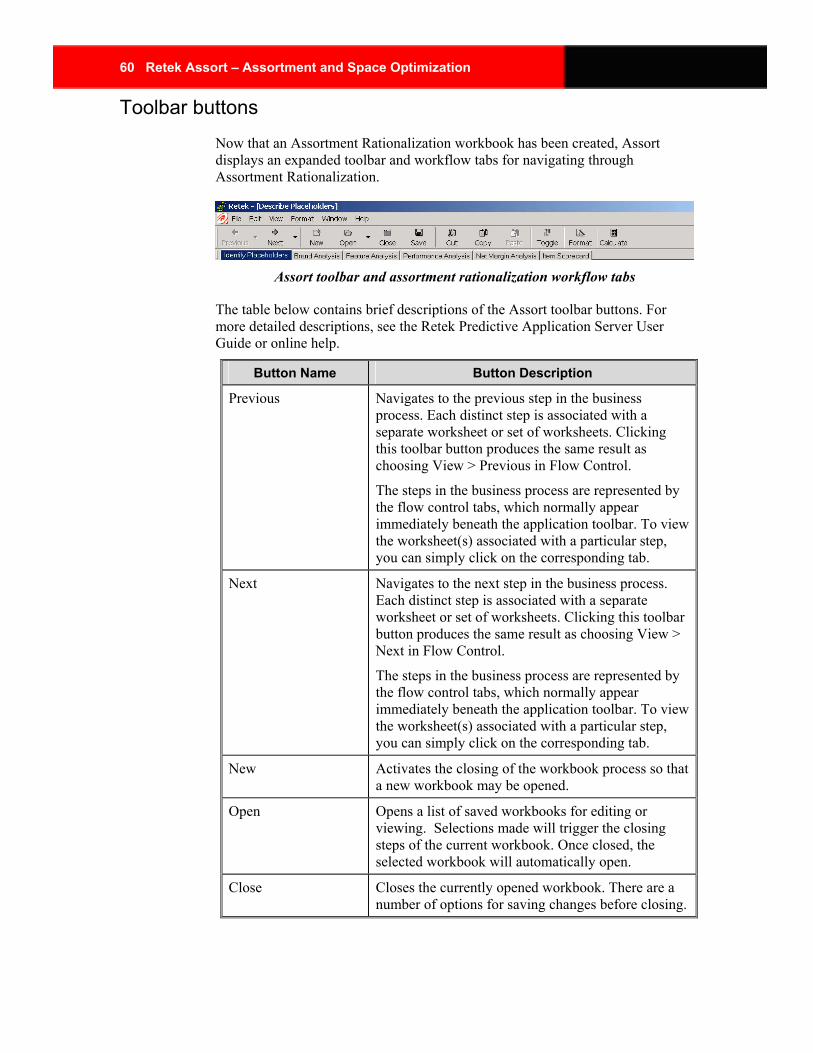
6 Define time frame to be assessed.
Define time frame page
a Select the time frame to be assessed.
b Click Finish. The workbook build begins. This process may take several minutes. Once completed, the workbook opens to the first window in the first process step. The workflow tabs are used in order from left to right as you go through the assortment rationalization steps.
60 Retek Assort – Assortment and Space Optimization
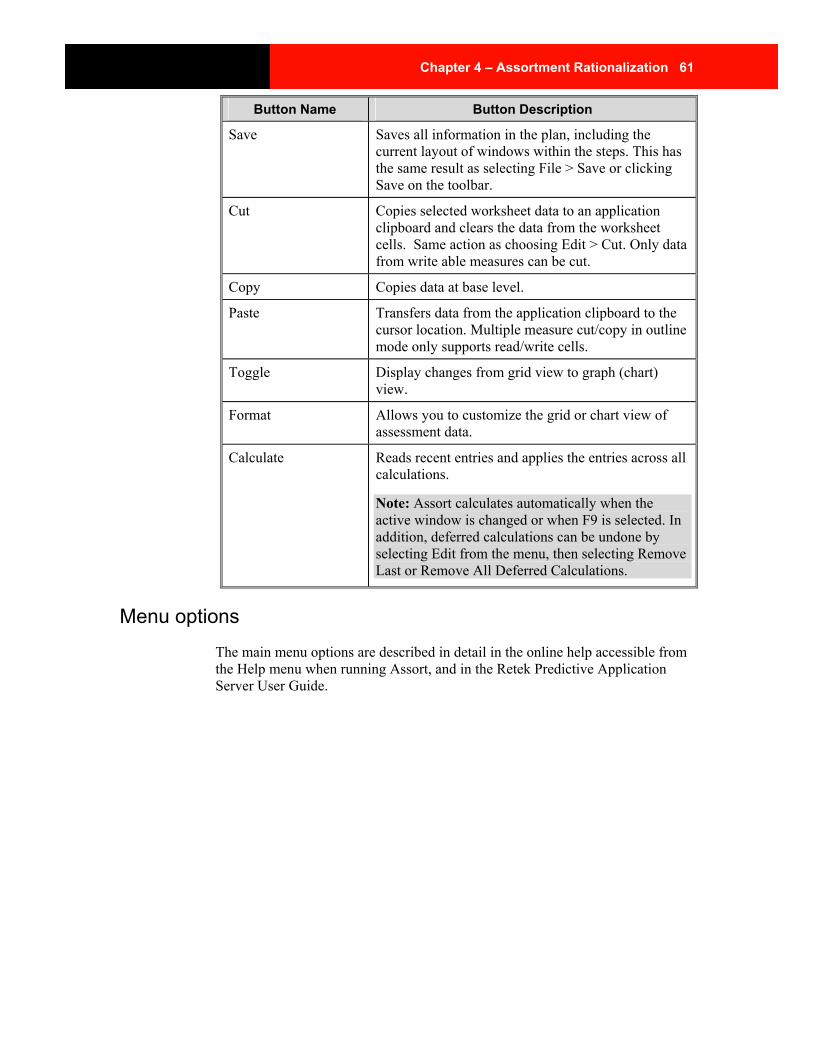
Toolbar buttons Now that an Assortment Rationalization workbook has been created, Assort displays an expanded toolbar and workflow tabs for navigating through Assortment Rationalization.
Assort toolbar and assortment rationalization workflow tabs
The table below contains brief descriptions of the Assort toolbar buttons. For more detailed descriptions, see the Retek Predictive Application Server User Guide or online help.
Button Name Button Description
Previous Navigates to the previous step in the business process. Each distinct step is associated with a separate worksheet or set of worksheets. Clicking this toolbar button produces the same result as choosing View > Previous in Flow Control.
The steps in the business process are represented by the flow control tabs, which normally appear immediately beneath the application toolbar. To view the worksheet(s) associated with a particular step, you can simply click on the corresponding tab.
Next Navigates to the next step in the business process. Each distinct step is associated with a separate worksheet or set of worksheets. Clicking this toolbar button produces the same result as choosing View > Next in Flow Control.
The steps in the business process are represented by the flow control tabs, which normally appear immediately beneath the application toolbar. To view the worksheet(s) associated with a particular step, you can simply click on the corresponding tab.
New Activates the closing of the workbook process so that a new workbook may be opened.
Open Opens a list of saved workbooks for editing or viewing. Selections made will trigger the closing steps of the current workbook. Once closed, the selected workbook will automatically open.
Close Closes the currently opened workbook. There are a number of options for saving changes before closing.
Chapter 4 – Assortment Rationalization 61
Button Name Button Description
Save Saves all information in the plan, including the current layout of windows within the steps. This has the same result as selecting File > Save or clicking Save on the toolbar.
Cut Copies selected worksheet data to an application clipboard and clears the data from the worksheet cells. Same action as choosing Edit > Cut. Only data from write able measures can be cut.
Copy Copies data at base level.
Paste Transfers data from the application clipboard to the cursor location. Multiple measure cut/copy in outline mode only supports read/write cells.
Toggle Display changes from grid view to graph (chart) view.
Format Allows you to customize the grid or chart view of assessment data.
Calculate Reads recent entries and applies the entries across all calculations.
Note: Assort calculates automatically when the active window is changed or when F9 is selected. In addition, deferred calculations can be undone by selecting Edit from the menu, then selecting Remove Last or Remove All Deferred Calculations.
Menu options The main menu options are described in detail in the online help accessible from the Help menu when running Assort, and in the Retek Predictive Application Server User Guide.
62 Retek Assort – Assortment and Space Optimization
Assortment Rationalization workflow tabs The assortment rationalization workflow tabs are below the Assort toolbar and are used to move between sets of windows displaying the process steps used in assortment rationalization. You can either click on the workflow tabs, or use Next and Previous on the toolbar to move between them. The workflow tabs for assortment rationalization are as follows:
Process Step Tab Descriptions
Identify Placeholders When placeholder items are added to the assortment mix, they are described (labeled) using the worksheet provided on the Identify Placeholders tab.
Brand Analysis The Brand Analysis tab provides a view to item performance by brand, the ability for you to assign an importance ranking to each brand, and a calculated brand ranking.
Feature Analysis The Feature Analysis tab provides the ability to weight importance of pre-defined features in order to calculate a feature ranking.
Performance Analysis The Performance Analysis tab provides a view facilitating financial performance analysis. Financial and item planning targets are provided.
Net Margin Analysis The Net Margin Analysis tab provides an assessment view to the net margin components for each item.
Item Scorecard Items are ranked and roles assigned using worksheets on the Item Scorecard tab.
Chapter 4 – Assortment Rationalization 63
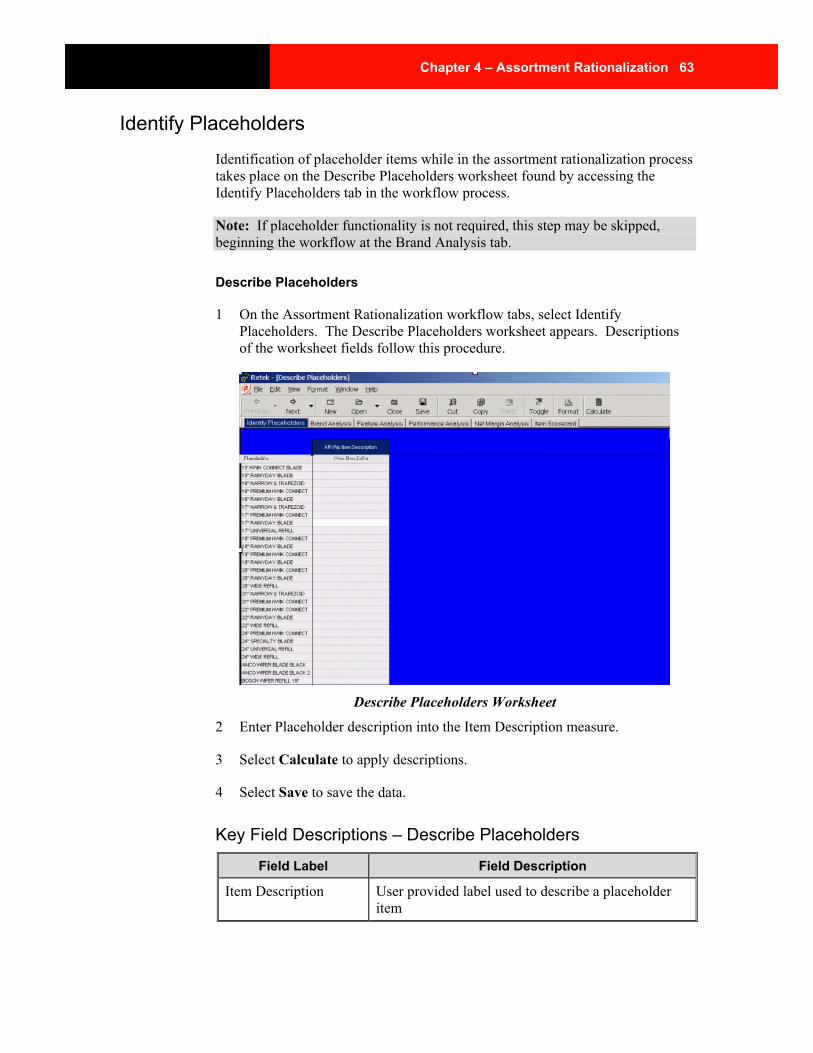
Identify Placeholders Identification of placeholder items while in the assortment rationalization process takes place on the Describe Placeholders worksheet found by accessing the Identify Placeholders tab in the workflow process.
Note: If placeholder functionality is not required, this step may be skipped, beginning the workflow at the Brand Analysis tab.
Describe Placeholders
1 On the Assortment Rationalization workflow tabs, select Identify Placeholders. The Describe Placeholders worksheet appears. Descriptions of the worksheet fields follow this procedure.
Describe Placeholders Worksheet
2 Enter Placeholder description into the Item Description measure.
3 Select Calculate to apply descriptions.
4 Select Save to save the data.
Key Field Descriptions – Describe Placeholders
Field Label Field Description
Item Description User provided label used to describe a placeholder item
64 Retek Assort – Assortment and Space Optimization
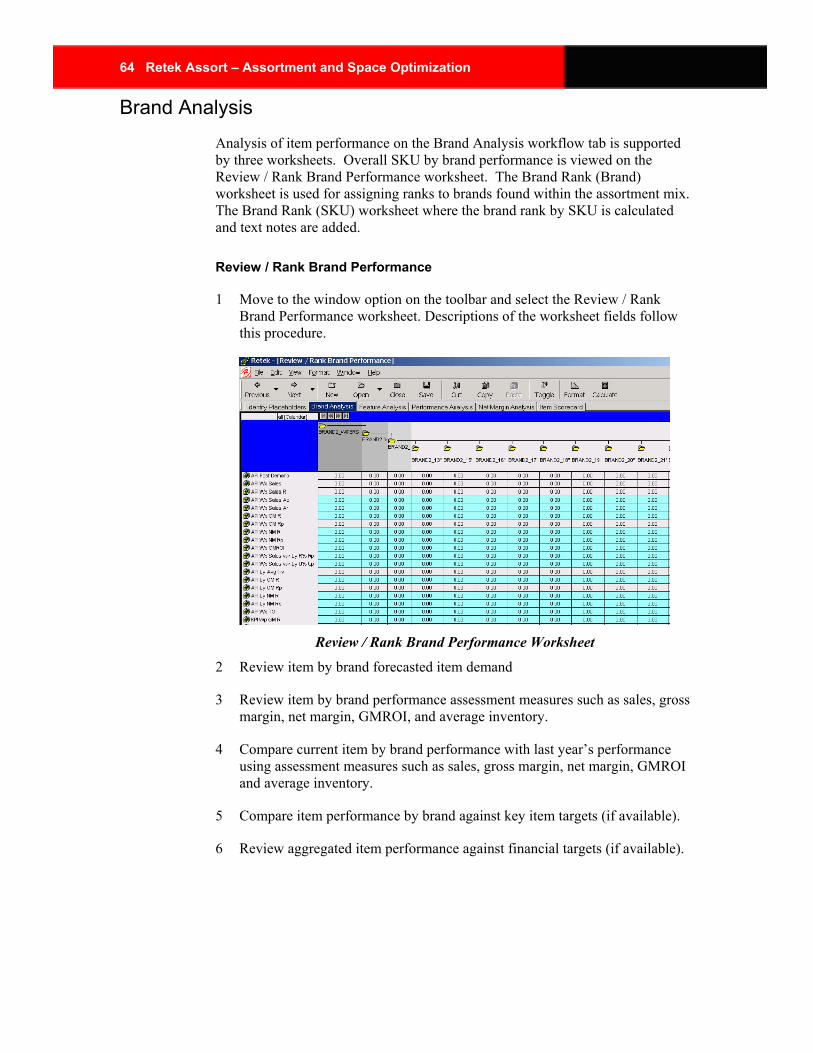
Brand Analysis Analysis of item performance on the Brand Analysis workflow tab is supported by three worksheets. Overall SKU by brand performance is viewed on the Review / Rank Brand Performance worksheet. The Brand Rank (Brand) worksheet is used for assigning ranks to brands found within the assortment mix. The Brand Rank (SKU) worksheet where the brand rank by SKU is calculated and text notes are added.
Review / Rank Brand Performance
1 Move to the window option on the toolbar and select the Review / Rank Brand Performance worksheet. Descriptions of the worksheet fields follow this procedure.
Review / Rank Brand Performance Worksheet
2 Review item by brand forecasted item demand
3 Review item by brand performance assessment measures such as sales, gross margin, net margin, GMROI, and average inventory.
4 Compare current item by brand performance with last year’s performance using assessment measures such as sales, gross margin, net margin, GMROI and average inventory.
5 Compare item performance by brand against key item targets (if available).
6 Review aggregated item performance against financial targets (if available).
Chapter 4 – Assortment Rationalization 65
Key Field Descriptions – Review / Rank Brand Performance
Field Label Field Description
TO Inventory turn over
Sales var Ly Sales variance to last year expressed as a percentage
Sales Sales
NM Net margin
GMROI Gross margin return on investment
GM Gross margin
Demand Forecasted unit demand
Avg Inv Average inventory
% Cont. Sales Child sales contribution to parent sales expressed as a percentage
Brand Rank (Brand)
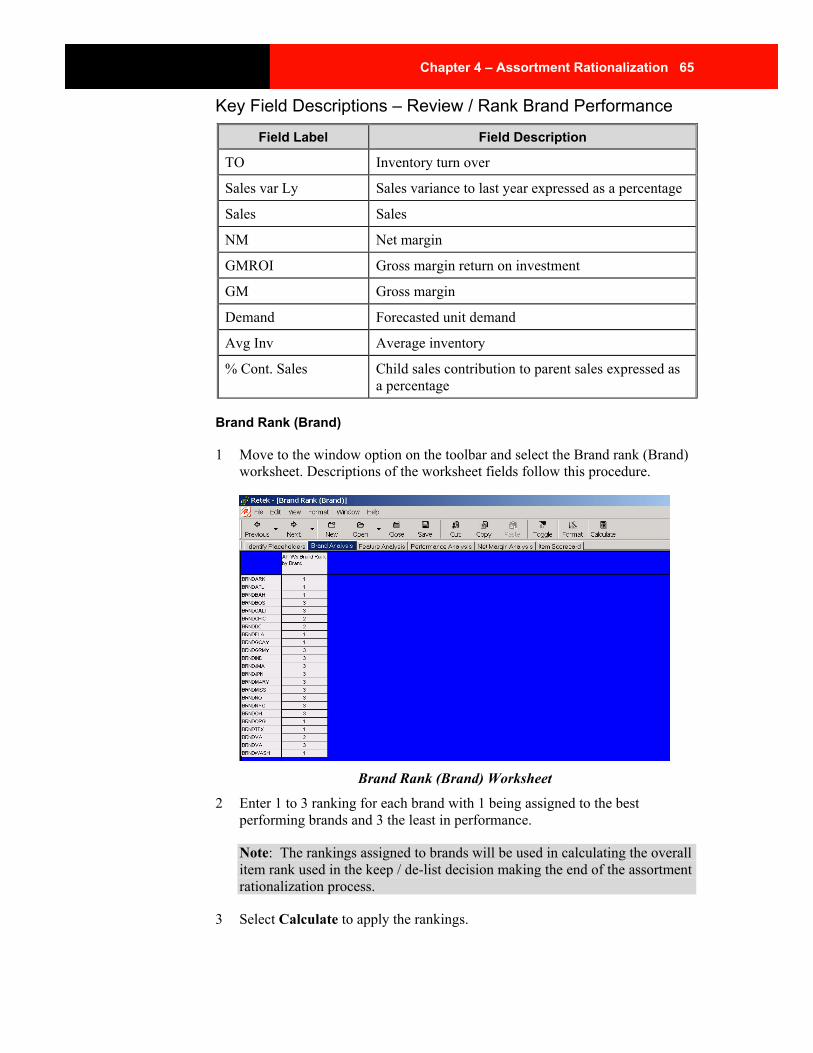
1 Move to the window option on the toolbar and select the Brand rank (Brand) worksheet. Descriptions of the worksheet fields follow this procedure.
Brand Rank (Brand) Worksheet
2 Enter 1 to 3 ranking for each brand with 1 being assigned to the best performing brands and 3 the least in performance.
Note: The rankings assigned to brands will be used in calculating the overall item rank used in the keep / de-list decision making the end of the assortment rationalization process.
3 Select Calculate to apply the rankings.
66 Retek Assort – Assortment and Space Optimization
4 Select Save to retain the information.
Key Field Descriptions – Brand Rank (Brand)
Field Label Field Description
Brand Rank By Brand Ranking from 1 to 3 of brand performance.
Brand Rank (SKU)
1 Move to the window option on the toolbar and select the Brand rank (Brand) worksheet. Descriptions of the worksheet fields follow this procedure.
Brand Rank (SKU) Worksheet
2 Click on the Brand Rank by SKU measure label.
3 From the Assort Toolbar, select View > Sort. Create Sort Attribute wizard appears.
Create Sort Attribute Wizard
Chapter 4 – Assortment Rationalization 67
4 Define sorting parameters. Click OK.
5 Review SKUs sorted by brand ranking. SKUs with the highest ranking will be ranked with a 1.
6 Enter comments into Brand Notes text measure provided.
7 Select Calculate to apply the text information.
8 Select Save to retain the information.
Key Field Descriptions – Brand Rank (SKU)
Field Label Field Description
Brand Rank by SKU Item by brand ranking assignment reflecting previously assigned brand rank.
Brand Notes Text field for entering item by brand rank observations.
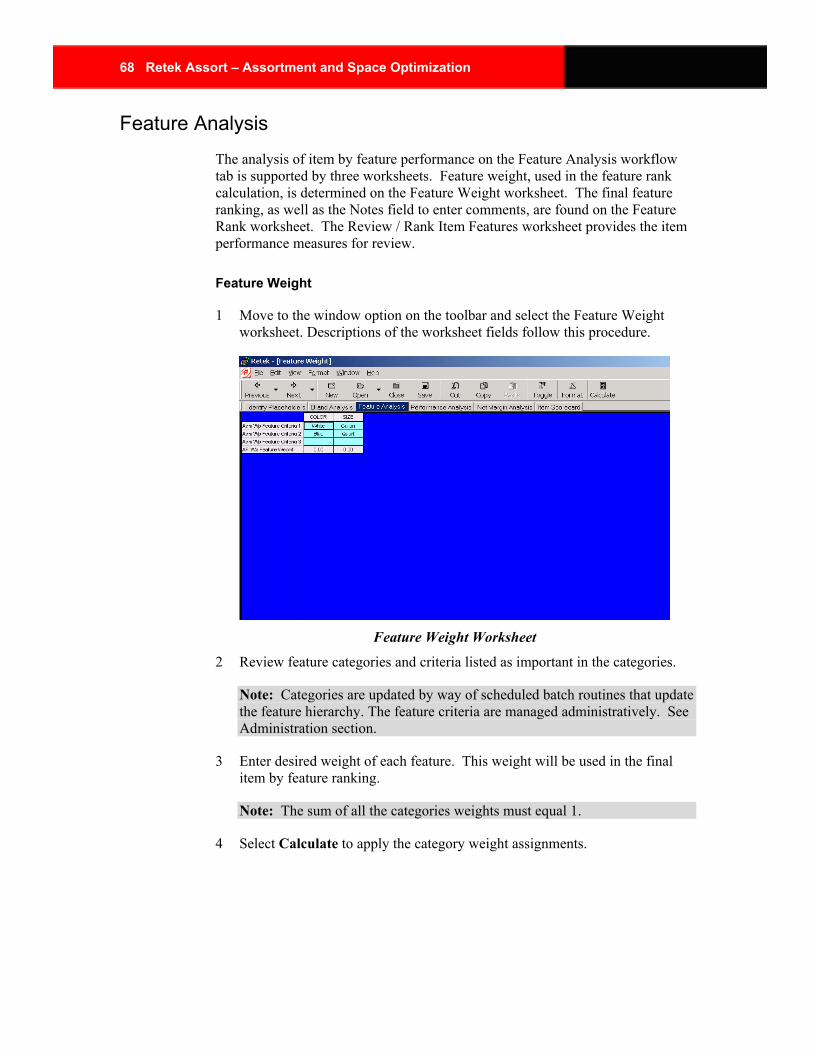
68 Retek Assort – Assortment and Space Optimization
Feature Analysis The analysis of item by feature performance on the Feature Analysis workflow tab is supported by three worksheets. Feature weight, used in the feature rank calculation, is determined on the Feature Weight worksheet. The final feature ranking, as well as the Notes field to enter comments, are found on the Feature Rank worksheet. The Review / Rank Item Features worksheet provides the item performance measures for review.
Feature Weight
1 Move to the window option on the toolbar and select the Feature Weight worksheet. Descriptions of the worksheet fields follow this procedure.
Feature Weight Worksheet
2 Review feature categories and criteria listed as important in the categories.
Note: Categories are updated by way of scheduled batch routines that update the feature hierarchy. The feature criteria are managed administratively. See Administration section.
3 Enter desired weight of each feature. This weight will be used in the final item by feature ranking.
Note: The sum of all the categories weights must equal 1.
4 Select Calculate to apply the category weight assignments.
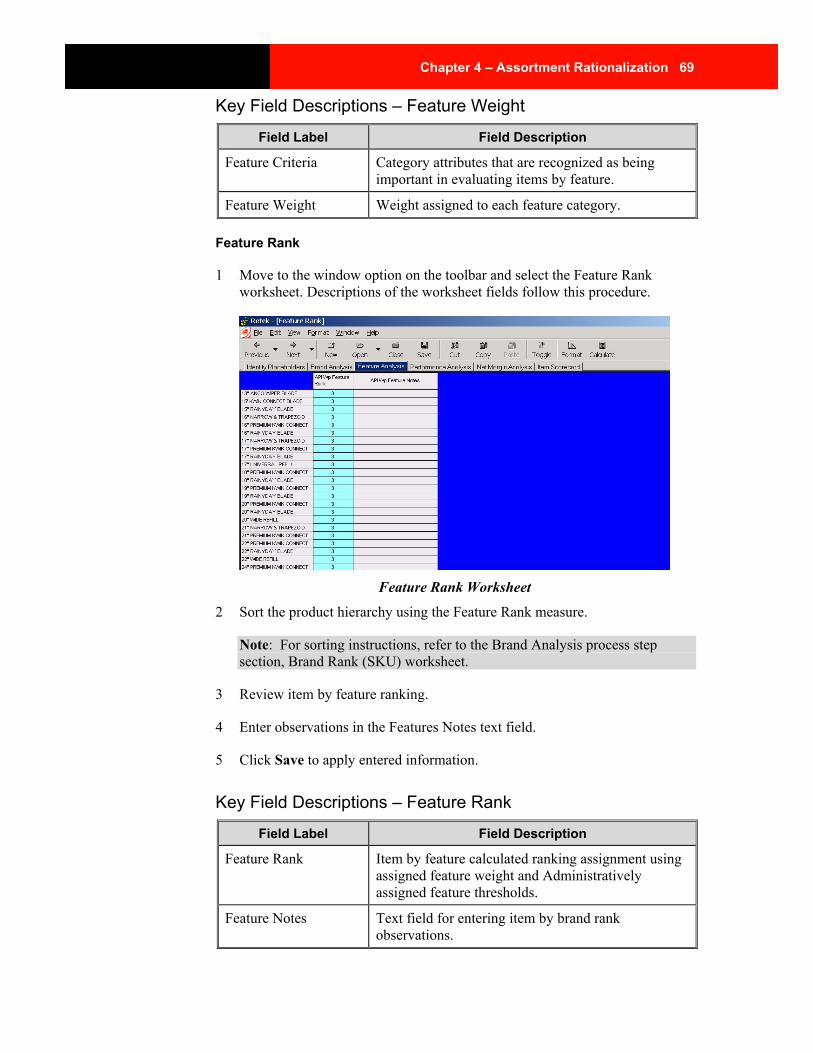
Chapter 4 – Assortment Rationalization 69
Key Field Descriptions – Feature Weight
Field Label Field Description
Feature Criteria Category attributes that are recognized as being important in evaluating items by feature.
Feature Weight Weight assigned to each feature category.
Feature Rank
1 Move to the window option on the toolbar and select the Feature Rank worksheet. Descriptions of the worksheet fields follow this procedure.
Feature Rank Worksheet
2 Sort the product hierarchy using the Feature Rank measure.
Note: For sorting instructions, refer to the Brand Analysis process step section, Brand Rank (SKU) worksheet.
3 Review item by feature ranking.
4 Enter observations in the Features Notes text field.
5 Click Save to apply entered information.
Key Field Descriptions – Feature Rank
Field Label Field Description
Feature Rank Item by feature calculated ranking assignment using assigned feature weight and Administratively assigned feature thresholds.
Feature Notes Text field for entering item by brand rank observations.
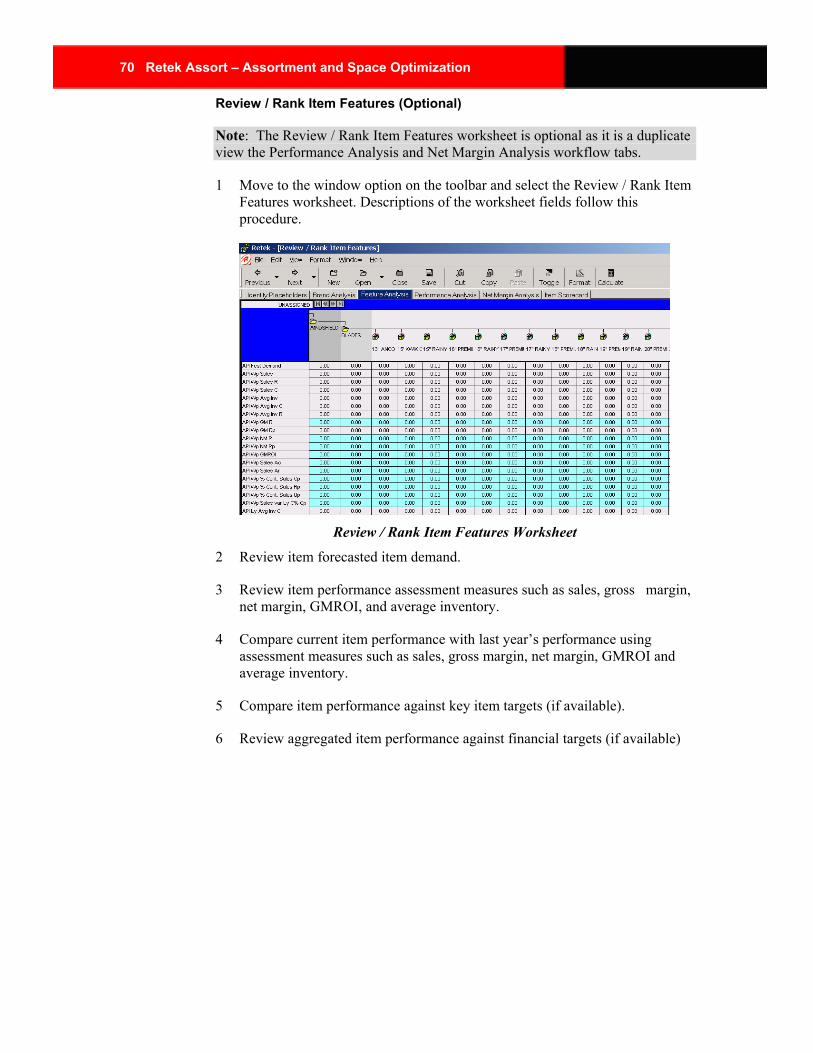
70 Retek Assort – Assortment and Space Optimization
Review / Rank Item Features (Optional)
Note: The Review / Rank Item Features worksheet is optional as it is a duplicate view the Performance Analysis and Net Margin Analysis workflow tabs.
1 Move to the window option on the toolbar and select the Review / Rank Item Features worksheet. Descriptions of the worksheet fields follow this procedure.
Review / Rank Item Features Worksheet
2 Review item forecasted item demand.
3 Review item performance assessment measures such as sales, gross margin, net margin, GMROI, and average inventory.
4 Compare current item performance with last year’s performance using assessment measures such as sales, gross margin, net margin, GMROI and average inventory.
5 Compare item performance against key item targets (if available).
6 Review aggregated item performance against financial targets (if available)
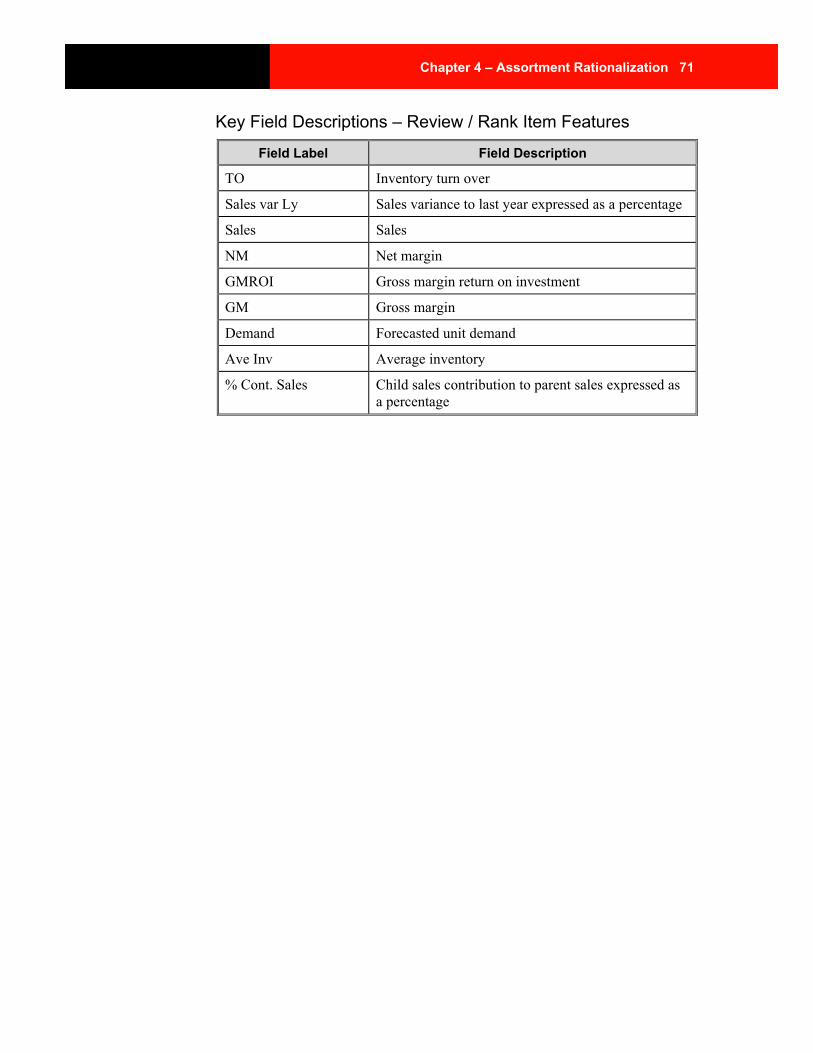
Chapter 4 – Assortment Rationalization 71
Key Field Descriptions – Review / Rank Item Features
Field Label Field Description
TO Inventory turn over
Sales var Ly Sales variance to last year expressed as a percentage
Sales Sales
NM Net margin
GMROI Gross margin return on investment
GM Gross margin
Demand Forecasted unit demand
Ave Inv Average inventory
% Cont. Sales Child sales contribution to parent sales expressed as a percentage
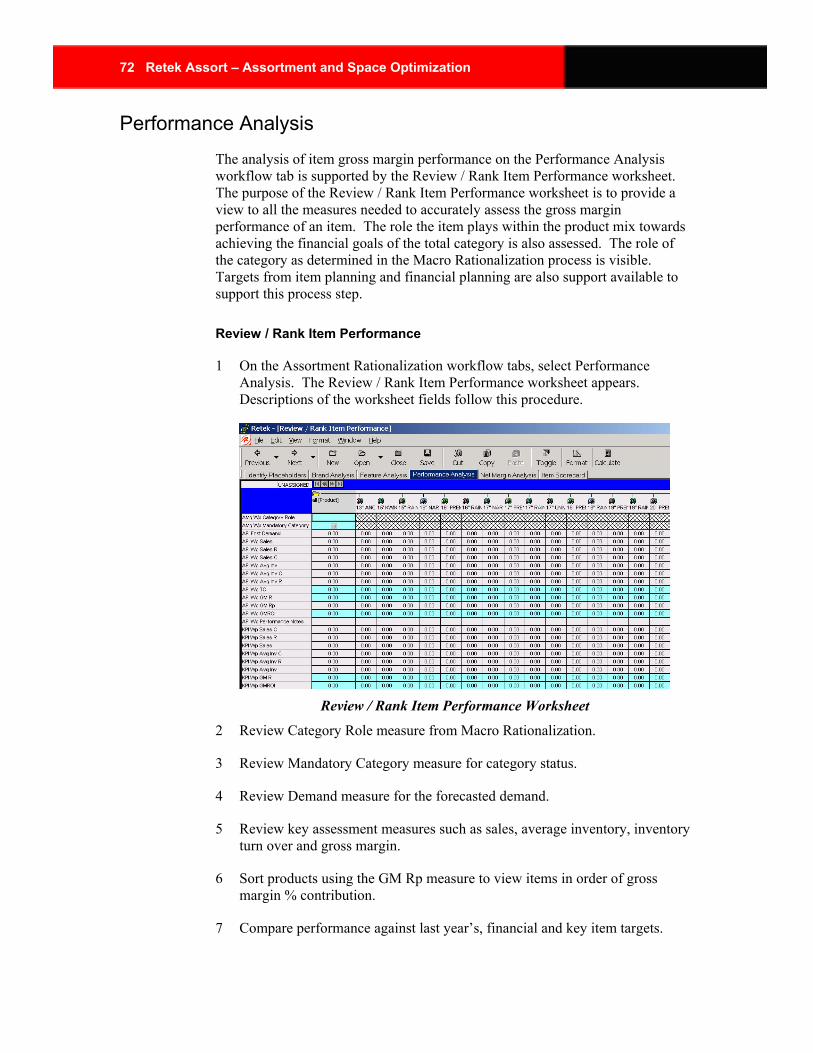
72 Retek Assort – Assortment and Space Optimization
Performance Analysis The analysis of item gross margin performance on the Performance Analysis workflow tab is supported by the Review / Rank Item Performance worksheet. The purpose of the Review / Rank Item Performance worksheet is to provide a view to all the measures needed to accurately assess the gross margin performance of an item. The role the item plays within the product mix towards achieving the financial goals of the total category is also assessed. The role of the category as determined in the Macro Rationalization process is visible. Targets from item planning and financial planning are also support available to support this process step.
Review / Rank Item Performance
1 On the Assortment Rationalization workflow tabs, select Performance Analysis. The Review / Rank Item Performance worksheet appears. Descriptions of the worksheet fields follow this procedure.
Review / Rank Item Performance Worksheet
2 Review Category Role measure from Macro Rationalization.
3 Review Mandatory Category measure for category status.
4 Review Demand measure for the forecasted demand.
5 Review key assessment measures such as sales, average inventory, inventory turn over and gross margin.
6 Sort products using the GM Rp measure to view items in order of gross margin % contribution.
7 Compare performance against last year’s, financial and key item targets.
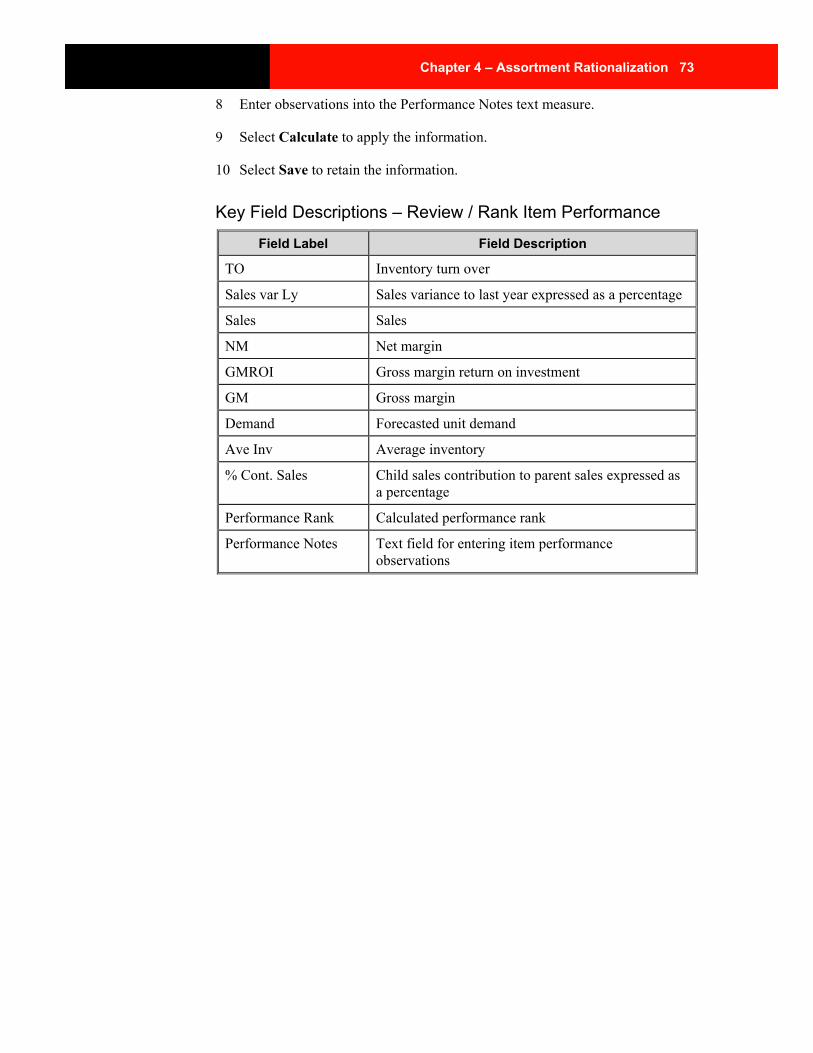
Chapter 4 – Assortment Rationalization 73
8 Enter observations into the Performance Notes text measure.
9 Select Calculate to apply the information.
10 Select Save to retain the information.
Key Field Descriptions – Review / Rank Item Performance
Field Label Field Description
TO Inventory turn over
Sales var Ly Sales variance to last year expressed as a percentage
Sales Sales
NM Net margin
GMROI Gross margin return on investment
GM Gross margin
Demand Forecasted unit demand
Ave Inv Average inventory
% Cont. Sales Child sales contribution to parent sales expressed as a percentage
Performance Rank Calculated performance rank
Performance Notes Text field for entering item performance observations
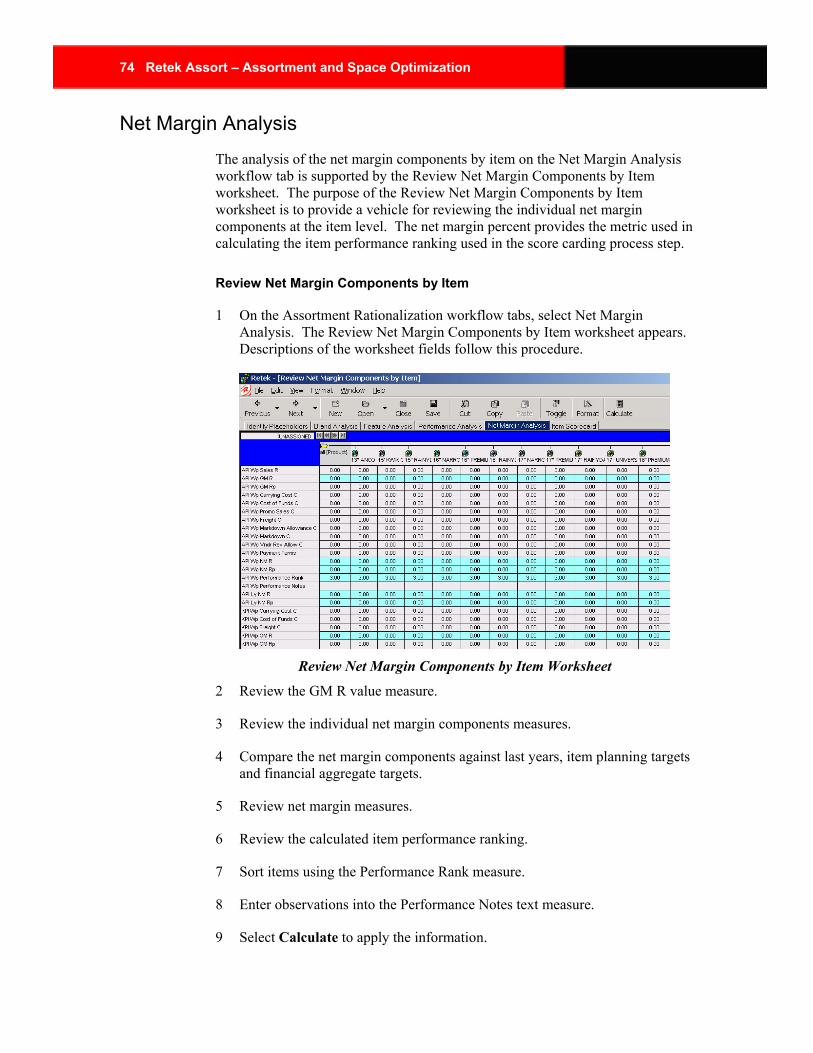
74 Retek Assort – Assortment and Space Optimization
Net Margin Analysis The analysis of the net margin components by item on the Net Margin Analysis workflow tab is supported by the Review Net Margin Components by Item worksheet. The purpose of the Review Net Margin Components by Item worksheet is to provide a vehicle for reviewing the individual net margin components at the item level. The net margin percent provides the metric used in calculating the item performance ranking used in the score carding process step.
Review Net Margin Components by Item
1 On the Assortment Rationalization workflow tabs, select Net Margin Analysis. The Review Net Margin Components by Item worksheet appears. Descriptions of the worksheet fields follow this procedure.
Review Net Margin Components by Item Worksheet
2 Review the GM R value measure.
3 Review the individual net margin components measures.
4 Compare the net margin components against last years, item planning targets and financial aggregate targets.
5 Review net margin measures.
6 Review the calculated item performance ranking.
7 Sort items using the Performance Rank measure.
8 Enter observations into the Performance Notes text measure.
9 Select Calculate to apply the information.
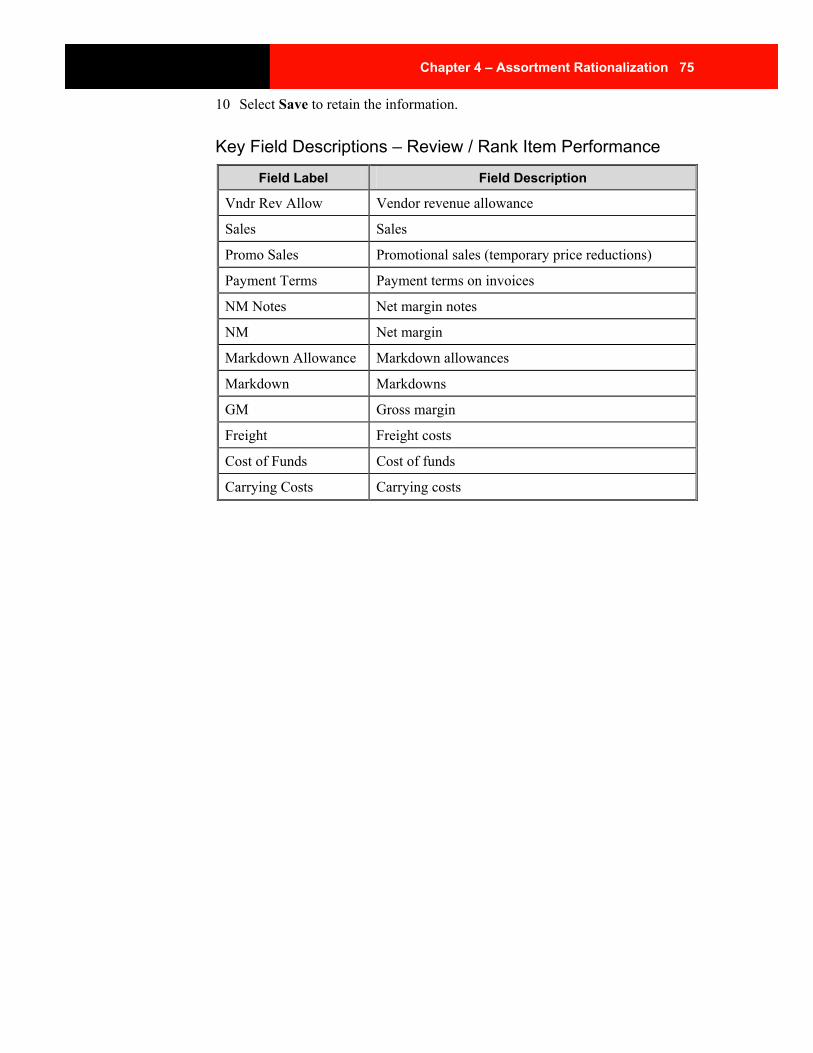
Chapter 4 – Assortment Rationalization 75
10 Select Save to retain the information.
Key Field Descriptions – Review / Rank Item Performance
Field Label Field Description
Vndr Rev Allow Vendor revenue allowance
Sales Sales
Promo Sales Promotional sales (temporary price reductions)
Payment Terms Payment terms on invoices
NM Notes Net margin notes
NM Net margin
Markdown Allowance Markdown allowances
Markdown Markdowns
GM Gross margin
Freight Freight costs
Cost of Funds Cost of funds
Carrying Costs Carrying costs
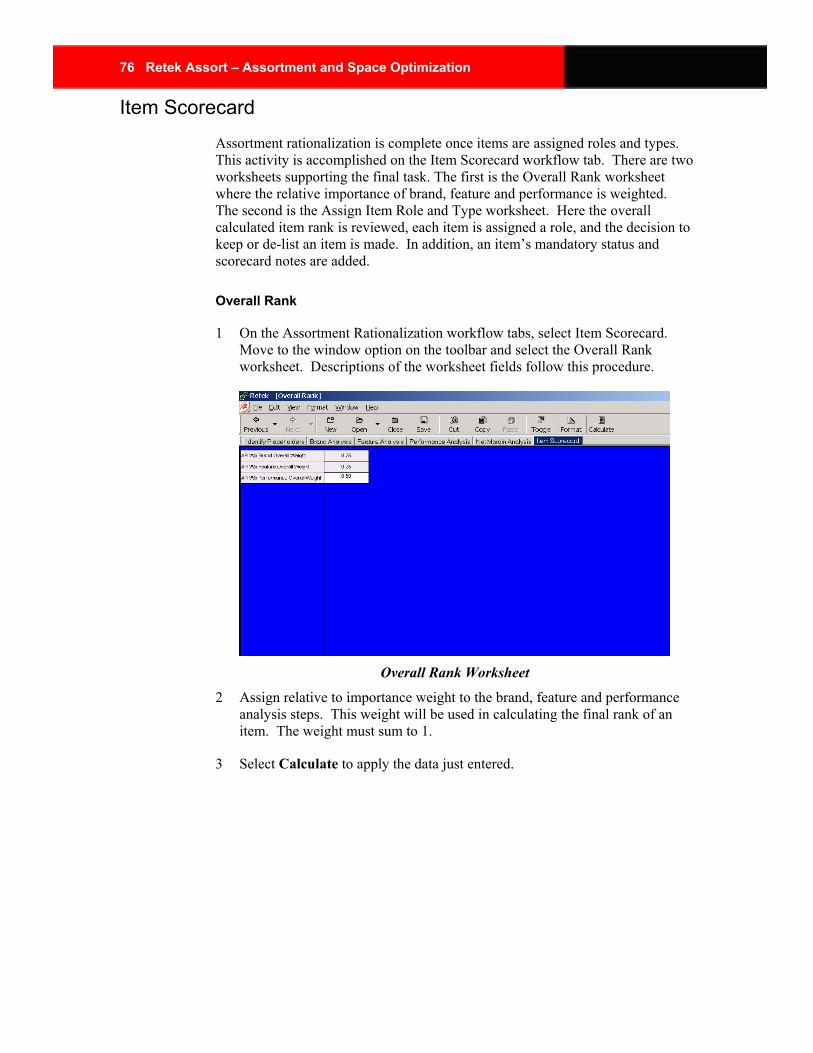
76 Retek Assort – Assortment and Space Optimization
Item Scorecard Assortment rationalization is complete once items are assigned roles and types. This activity is accomplished on the Item Scorecard workflow tab. There are two worksheets supporting the final task. The first is the Overall Rank worksheet where the relative importance of brand, feature and performance is weighted. The second is the Assign Item Role and Type worksheet. Here the overall calculated item rank is reviewed, each item is assigned a role, and the decision to keep or de-list an item is made. In addition, an item’s mandatory status and scorecard notes are added.
Overall Rank
1 On the Assortment Rationalization workflow tabs, select Item Scorecard. Move to the window option on the toolbar and select the Overall Rank worksheet. Descriptions of the worksheet fields follow this procedure.
Overall Rank Worksheet
2 Assign relative to importance weight to the brand, feature and performance analysis steps. This weight will be used in calculating the final rank of an item. The weight must sum to 1.
3 Select Calculate to apply the data just entered.
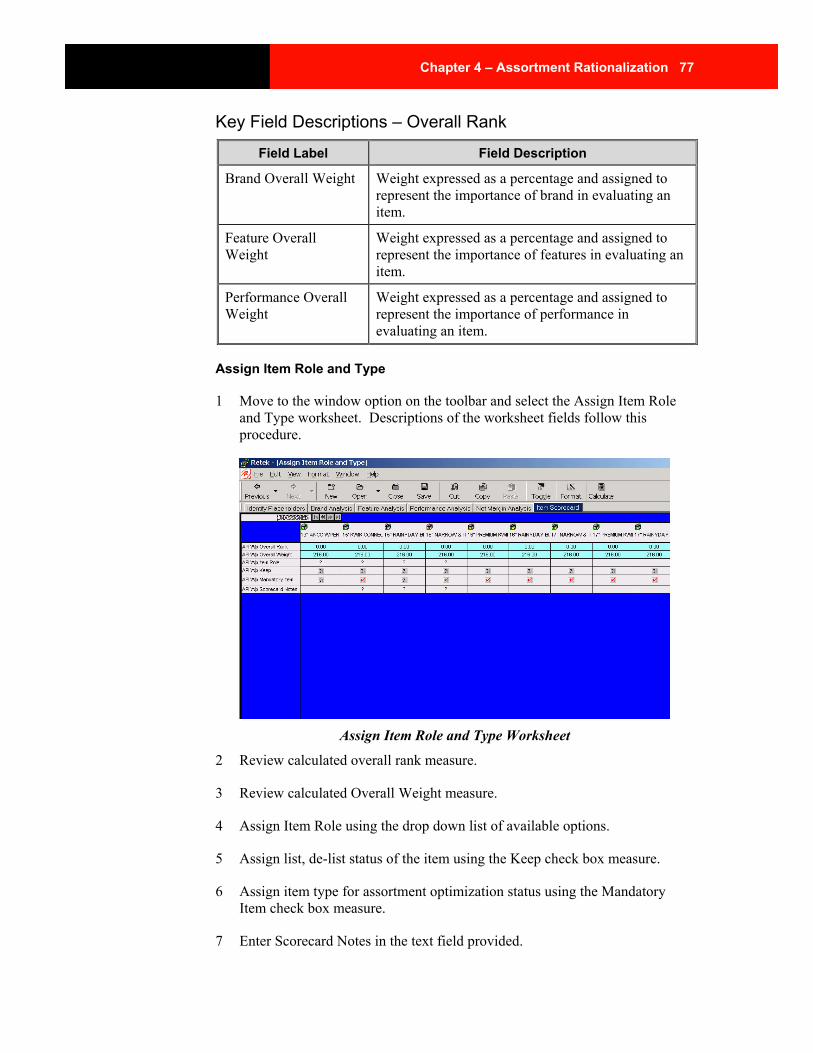
Chapter 4 – Assortment Rationalization 77
Key Field Descriptions – Overall Rank
Field Label Field Description
Brand Overall Weight Weight expressed as a percentage and assigned to represent the importance of brand in evaluating an item.
Feature Overall Weight
Weight expressed as a percentage and assigned to represent the importance of features in evaluating an item.
Performance Overall Weight
Weight expressed as a percentage and assigned to represent the importance of performance in evaluating an item.
Assign Item Role and Type
1 Move to the window option on the toolbar and select the Assign Item Role and Type worksheet. Descriptions of the worksheet fields follow this procedure.
Assign Item Role and Type Worksheet
2 Review calculated overall rank measure.
3 Review calculated Overall Weight measure.
4 Assign Item Role using the drop down list of available options.
5 Assign list, de-list status of the item using the Keep check box measure.
6 Assign item type for assortment optimization status using the Mandatory Item check box measure.
7 Enter Scorecard Notes in the text field provided.
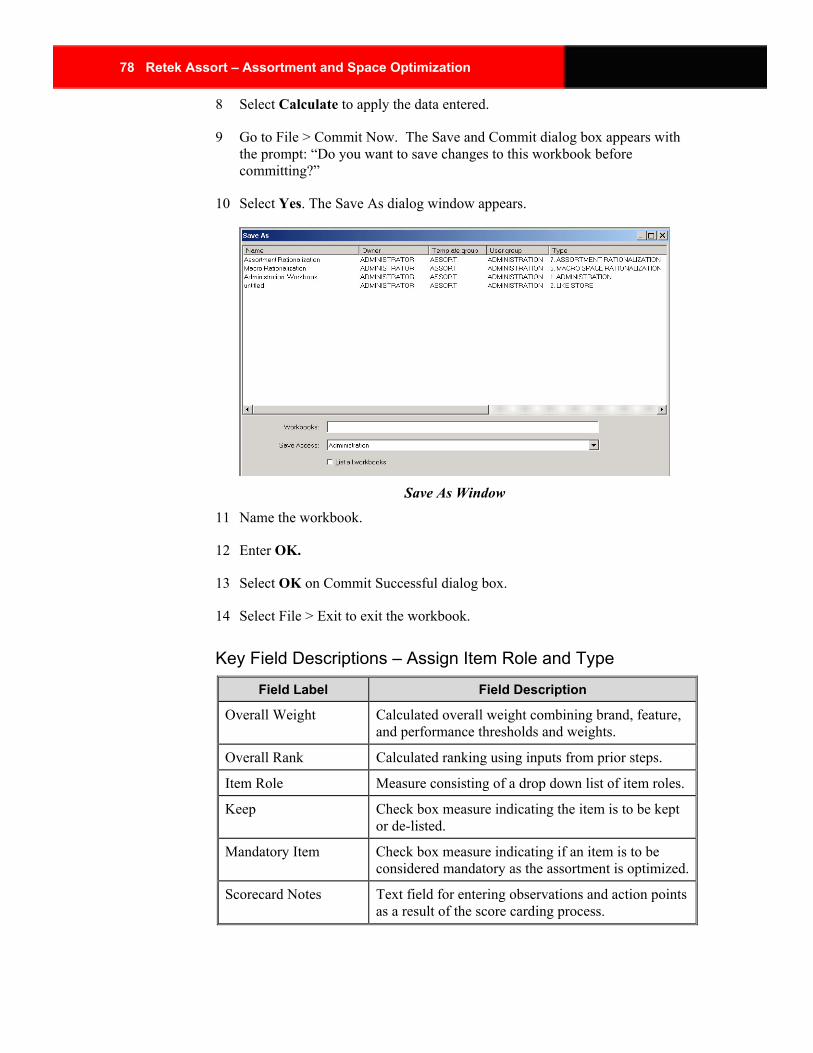
78 Retek Assort – Assortment and Space Optimization
8 Select Calculate to apply the data entered.
9 Go to File > Commit Now. The Save and Commit dialog box appears with the prompt: “Do you want to save changes to this workbook before committing?”
10 Select Yes. The Save As dialog window appears.
Save As Window
11 Name the workbook.
12 Enter OK.
13 Select OK on Commit Successful dialog box.
14 Select File > Exit to exit the workbook.
Key Field Descriptions – Assign Item Role and Type
Field Label Field Description
Overall Weight Calculated overall weight combining brand, feature, and performance thresholds and weights.
Overall Rank Calculated ranking using inputs from prior steps.
Item Role Measure consisting of a drop down list of item roles.
Keep Check box measure indicating the item is to be kept or de-listed.
Mandatory Item Check box measure indicating if an item is to be considered mandatory as the assortment is optimized.
Scorecard Notes Text field for entering observations and action points as a result of the score carding process.

Chapter 4 – Assortment Rationalization 79
What’s next All of the entries are complete for the Assortment Rationalization step of the Assortment and Space Optimization process. Proceed to Step 3, Assortment Optimization, described in the next chapter.

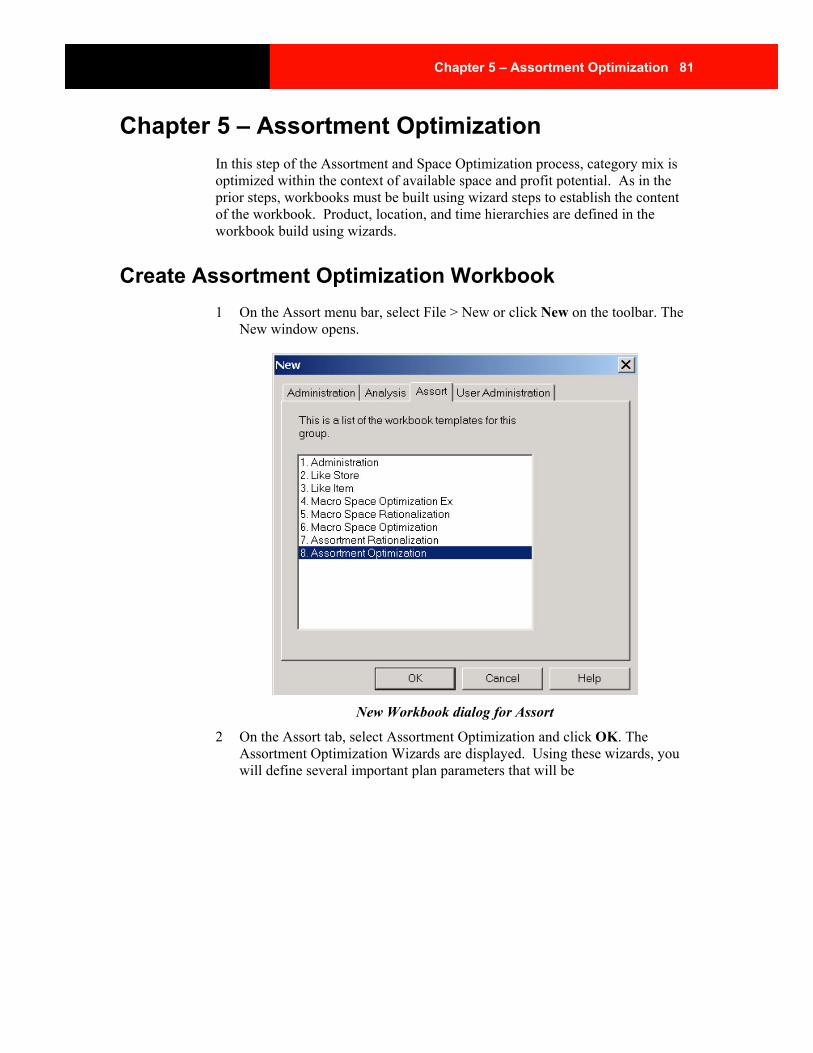
Chapter 5 – Assortment Optimization 81
Chapter 5 – Assortment Optimization In this step of the Assortment and Space Optimization process, category mix is optimized within the context of available space and profit potential. As in the prior steps, workbooks must be built using wizard steps to establish the content of the workbook. Product, location, and time hierarchies are defined in the workbook build using wizards.
Create Assortment Optimization Workbook 1 On the Assort menu bar, select File > New or click New on the toolbar. The
New window opens.
New Workbook dialog for Assort
2 On the Assort tab, select Assortment Optimization and click OK. The Assortment Optimization Wizards are displayed. Using these wizards, you will define several important plan parameters that will be
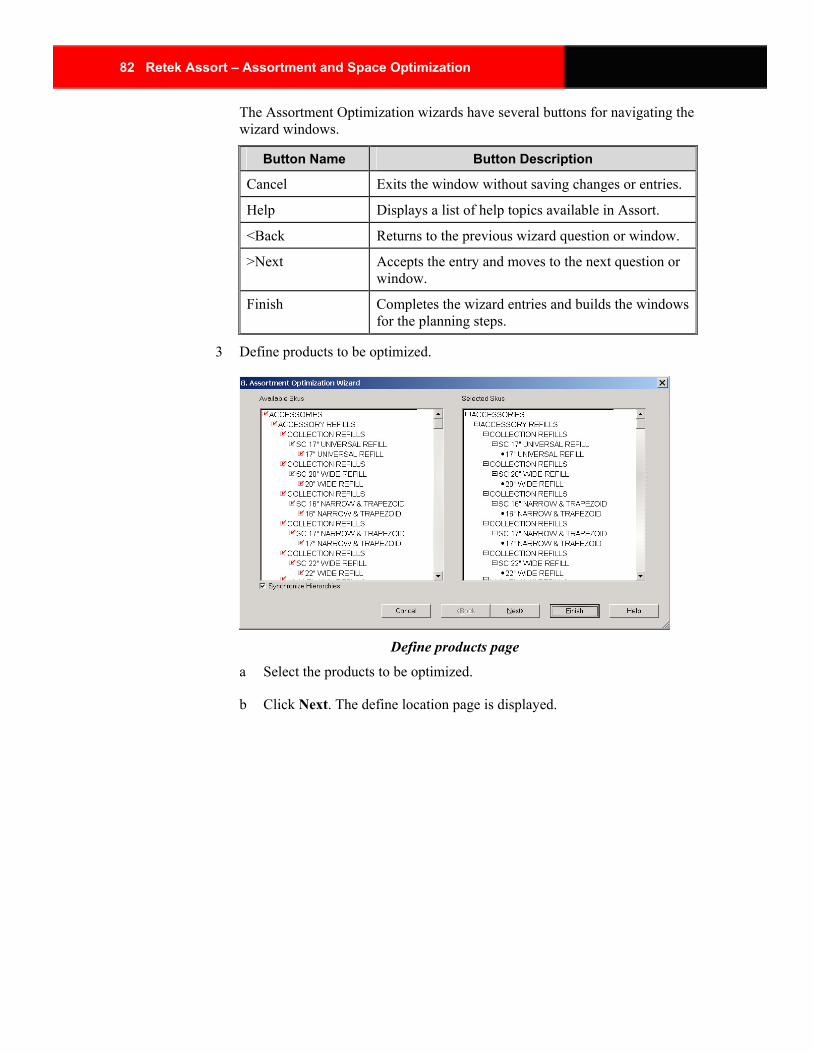
82 Retek Assort – Assortment and Space Optimization
The Assortment Optimization wizards have several buttons for navigating the wizard windows.
Button Name Button Description
Cancel Exits the window without saving changes or entries.
Help Displays a list of help topics available in Assort.
<Back Returns to the previous wizard question or window.
>Next Accepts the entry and moves to the next question or window.
Finish Completes the wizard entries and builds the windows for the planning steps.
3 Define products to be optimized.
Define products page
a Select the products to be optimized.
b Click Next. The define location page is displayed.
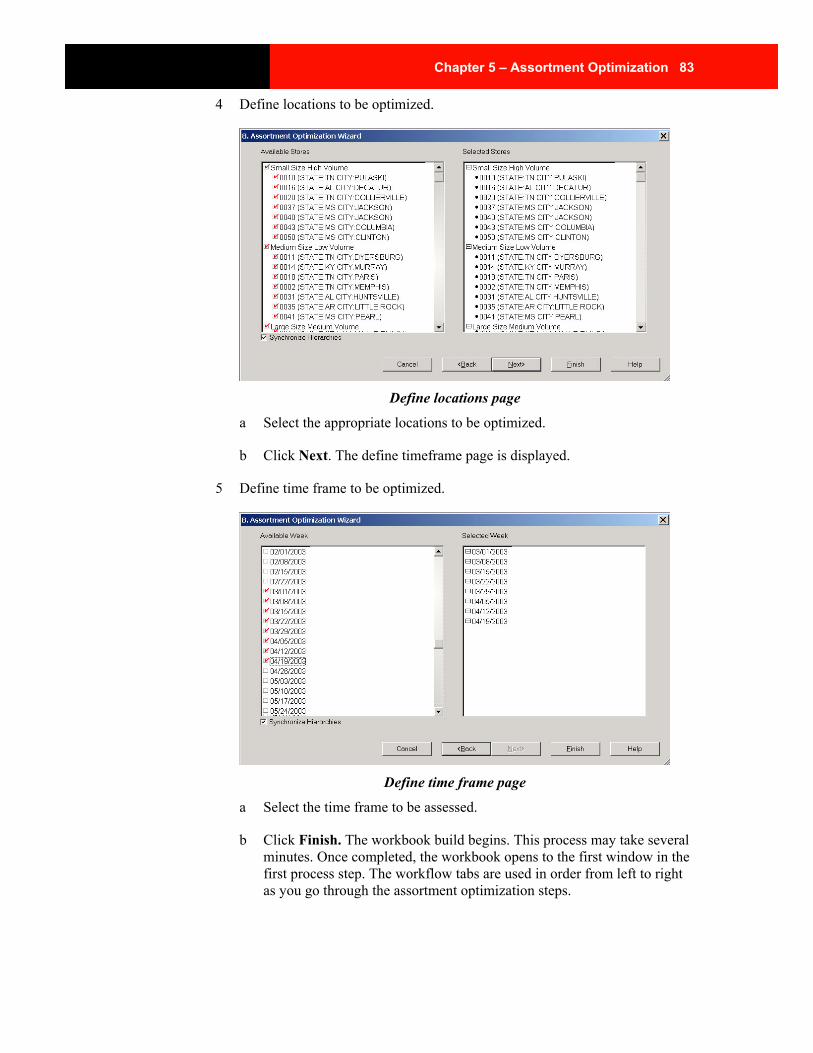
Chapter 5 – Assortment Optimization 83
4 Define locations to be optimized.
Define locations page
a Select the appropriate locations to be optimized.
b Click Next. The define timeframe page is displayed.
5 Define time frame to be optimized.
Define time frame page
a Select the time frame to be assessed.
b Click Finish. The workbook build begins. This process may take several minutes. Once completed, the workbook opens to the first window in the first process step. The workflow tabs are used in order from left to right as you go through the assortment optimization steps.
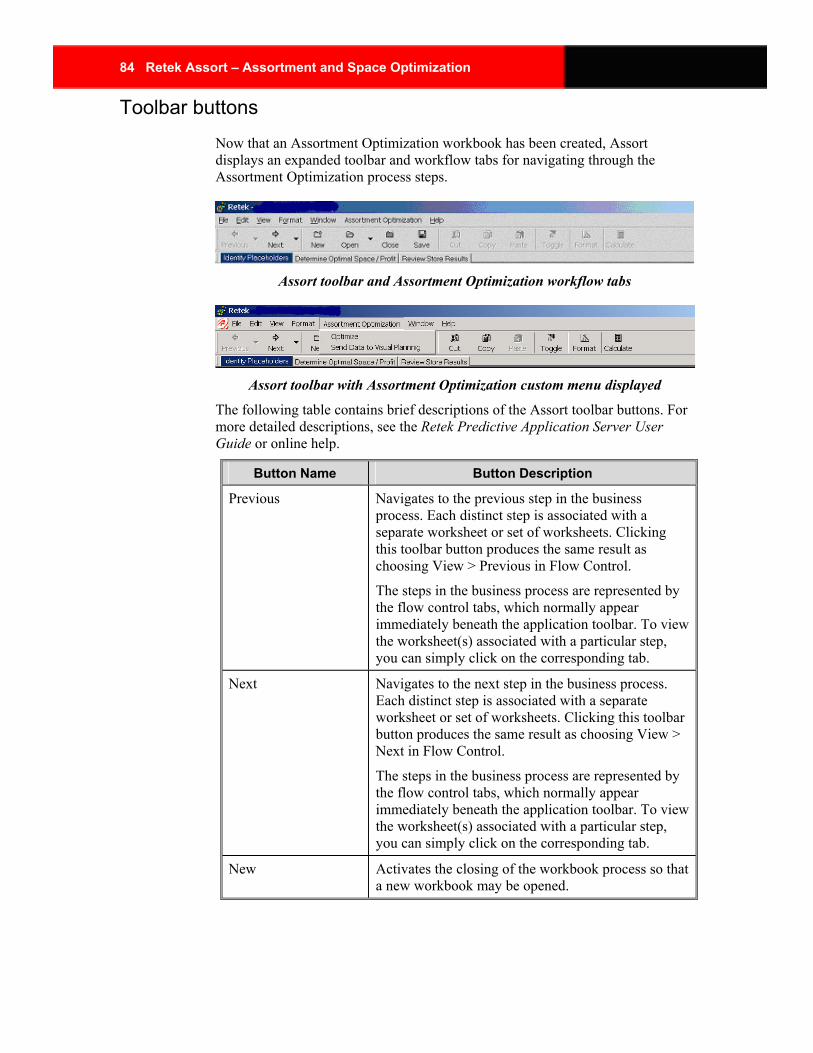
84 Retek Assort – Assortment and Space Optimization
Toolbar buttons Now that an Assortment Optimization workbook has been created, Assort displays an expanded toolbar and workflow tabs for navigating through the Assortment Optimization process steps.
Assort toolbar and Assortment Optimization workflow tabs
Assort toolbar with Assortment Optimization custom menu displayed
The following table contains brief descriptions of the Assort toolbar buttons. For more detailed descriptions, see the Retek Predictive Application Server User Guide or online help.
Button Name Button Description
Previous Navigates to the previous step in the business process. Each distinct step is associated with a separate worksheet or set of worksheets. Clicking this toolbar button produces the same result as choosing View > Previous in Flow Control.
The steps in the business process are represented by the flow control tabs, which normally appear immediately beneath the application toolbar. To view the worksheet(s) associated with a particular step, you can simply click on the corresponding tab.
Next Navigates to the next step in the business process. Each distinct step is associated with a separate worksheet or set of worksheets. Clicking this toolbar button produces the same result as choosing View > Next in Flow Control.
The steps in the business process are represented by the flow control tabs, which normally appear immediately beneath the application toolbar. To view the worksheet(s) associated with a particular step, you can simply click on the corresponding tab.
New Activates the closing of the workbook process so that a new workbook may be opened.
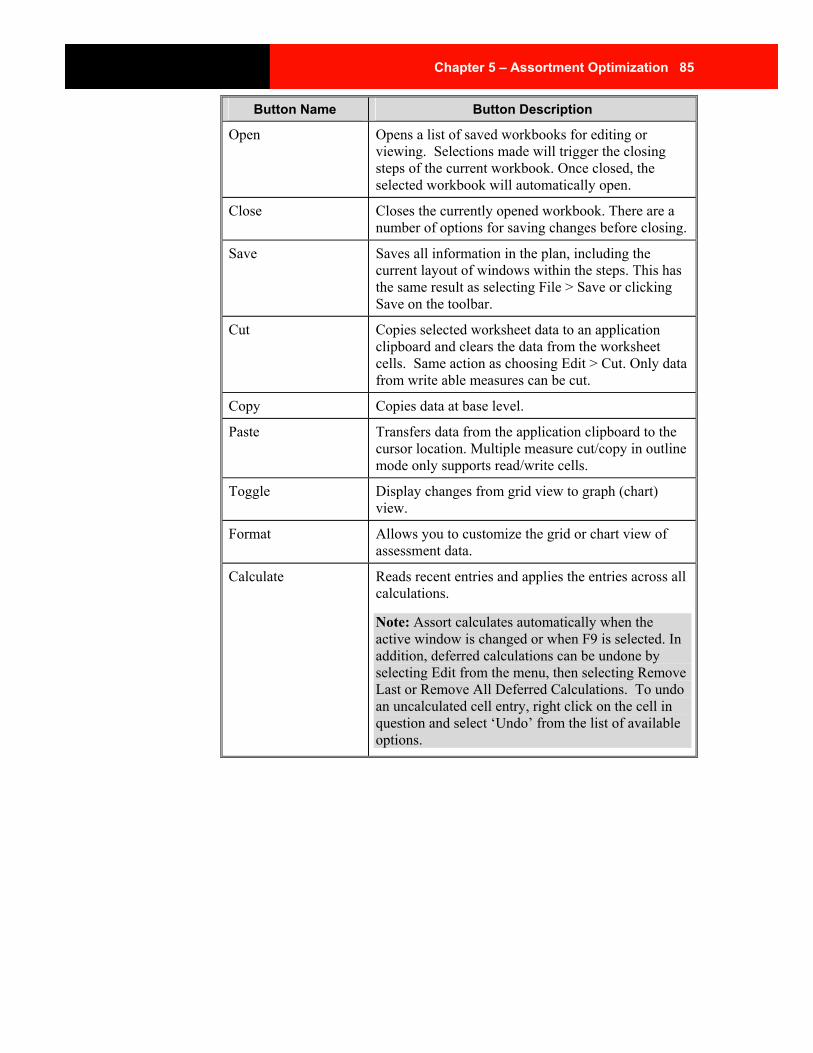
Chapter 5 – Assortment Optimization 85
Button Name Button Description
Open Opens a list of saved workbooks for editing or viewing. Selections made will trigger the closing steps of the current workbook. Once closed, the selected workbook will automatically open.
Close Closes the currently opened workbook. There are a number of options for saving changes before closing.
Save Saves all information in the plan, including the current layout of windows within the steps. This has the same result as selecting File > Save or clicking Save on the toolbar.
Cut Copies selected worksheet data to an application clipboard and clears the data from the worksheet cells. Same action as choosing Edit > Cut. Only data from write able measures can be cut.
Copy Copies data at base level.
Paste Transfers data from the application clipboard to the cursor location. Multiple measure cut/copy in outline mode only supports read/write cells.
Toggle Display changes from grid view to graph (chart) view.
Format Allows you to customize the grid or chart view of assessment data.
Calculate Reads recent entries and applies the entries across all calculations.
Note: Assort calculates automatically when the active window is changed or when F9 is selected. In addition, deferred calculations can be undone by selecting Edit from the menu, then selecting Remove Last or Remove All Deferred Calculations. To undo an uncalculated cell entry, right click on the cell in question and select ‘Undo’ from the list of available options.
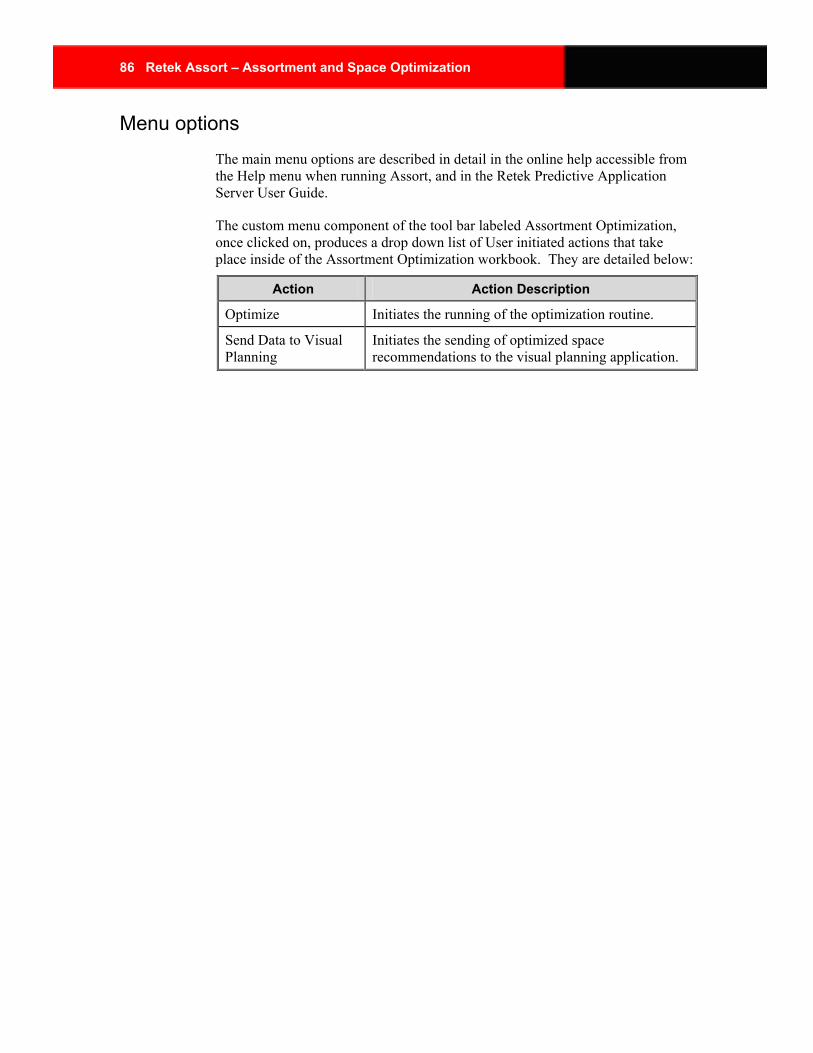
86 Retek Assort – Assortment and Space Optimization
Menu options The main menu options are described in detail in the online help accessible from the Help menu when running Assort, and in the Retek Predictive Application Server User Guide.
The custom menu component of the tool bar labeled Assortment Optimization, once clicked on, produces a drop down list of User initiated actions that take place inside of the Assortment Optimization workbook. They are detailed below:
Action Action Description
Optimize Initiates the running of the optimization routine.
Send Data to Visual Planning
Initiates the sending of optimized space recommendations to the visual planning application.
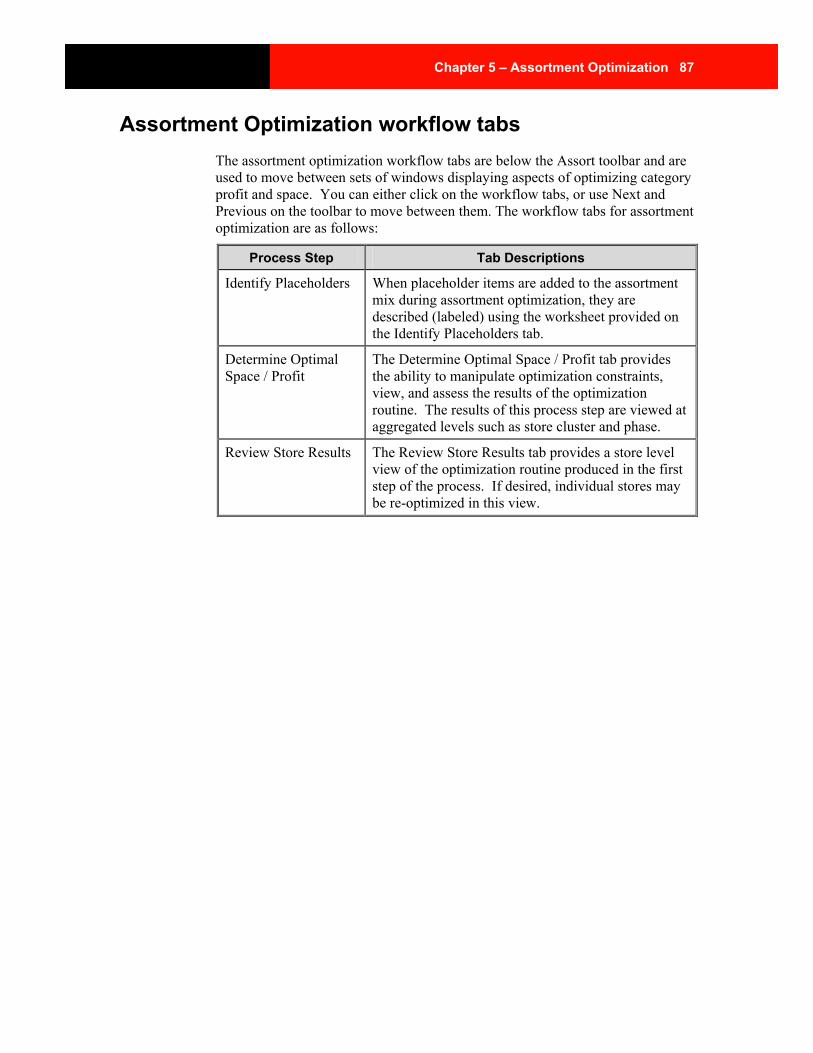
Chapter 5 – Assortment Optimization 87
Assortment Optimization workflow tabs The assortment optimization workflow tabs are below the Assort toolbar and are used to move between sets of windows displaying aspects of optimizing category profit and space. You can either click on the workflow tabs, or use Next and Previous on the toolbar to move between them. The workflow tabs for assortment optimization are as follows:
Process Step Tab Descriptions
Identify Placeholders When placeholder items are added to the assortment mix during assortment optimization, they are described (labeled) using the worksheet provided on the Identify Placeholders tab.
Determine Optimal Space / Profit
The Determine Optimal Space / Profit tab provides the ability to manipulate optimization constraints, view, and assess the results of the optimization routine. The results of this process step are viewed at aggregated levels such as store cluster and phase.
Review Store Results The Review Store Results tab provides a store level view of the optimization routine produced in the first step of the process. If desired, individual stores may be re-optimized in this view.
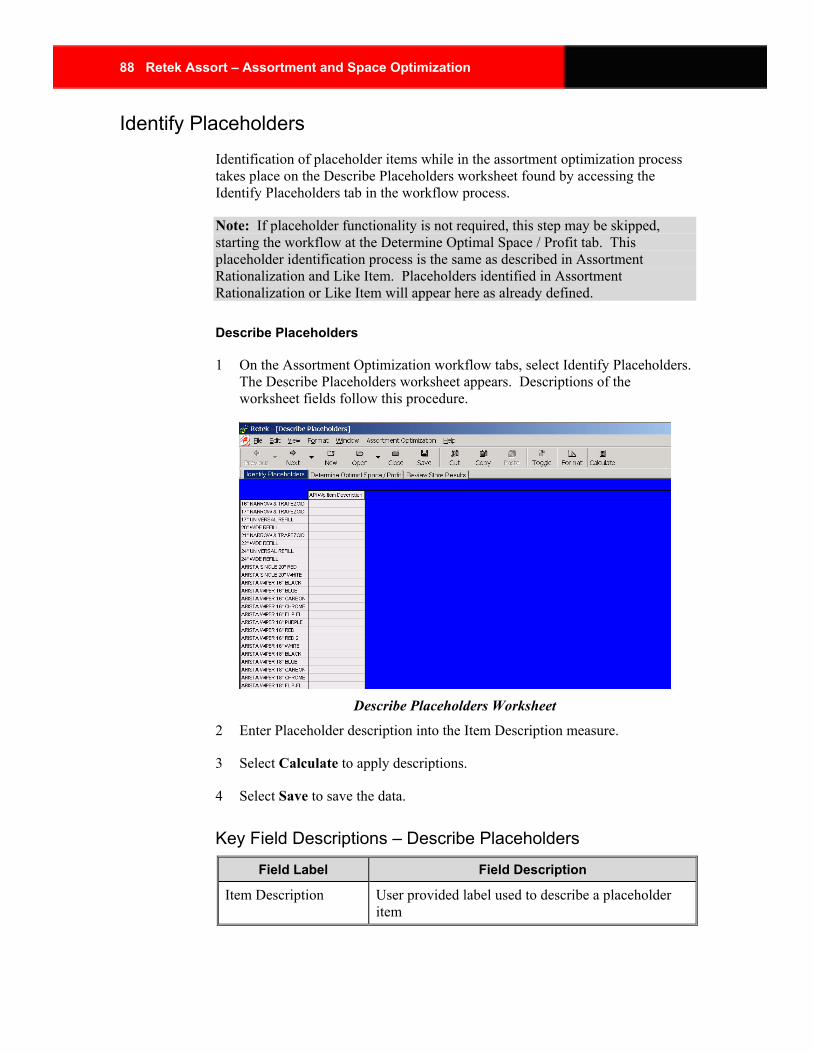
88 Retek Assort – Assortment and Space Optimization
Identify Placeholders Identification of placeholder items while in the assortment optimization process takes place on the Describe Placeholders worksheet found by accessing the Identify Placeholders tab in the workflow process.
Note: If placeholder functionality is not required, this step may be skipped, starting the workflow at the Determine Optimal Space / Profit tab. This placeholder identification process is the same as described in Assortment Rationalization and Like Item. Placeholders identified in Assortment Rationalization or Like Item will appear here as already defined.
Describe Placeholders
1 On the Assortment Optimization workflow tabs, select Identify Placeholders. The Describe Placeholders worksheet appears. Descriptions of the worksheet fields follow this procedure.
Describe Placeholders Worksheet
2 Enter Placeholder description into the Item Description measure.
3 Select Calculate to apply descriptions.
4 Select Save to save the data.
Key Field Descriptions – Describe Placeholders
Field Label Field Description
Item Description User provided label used to describe a placeholder item
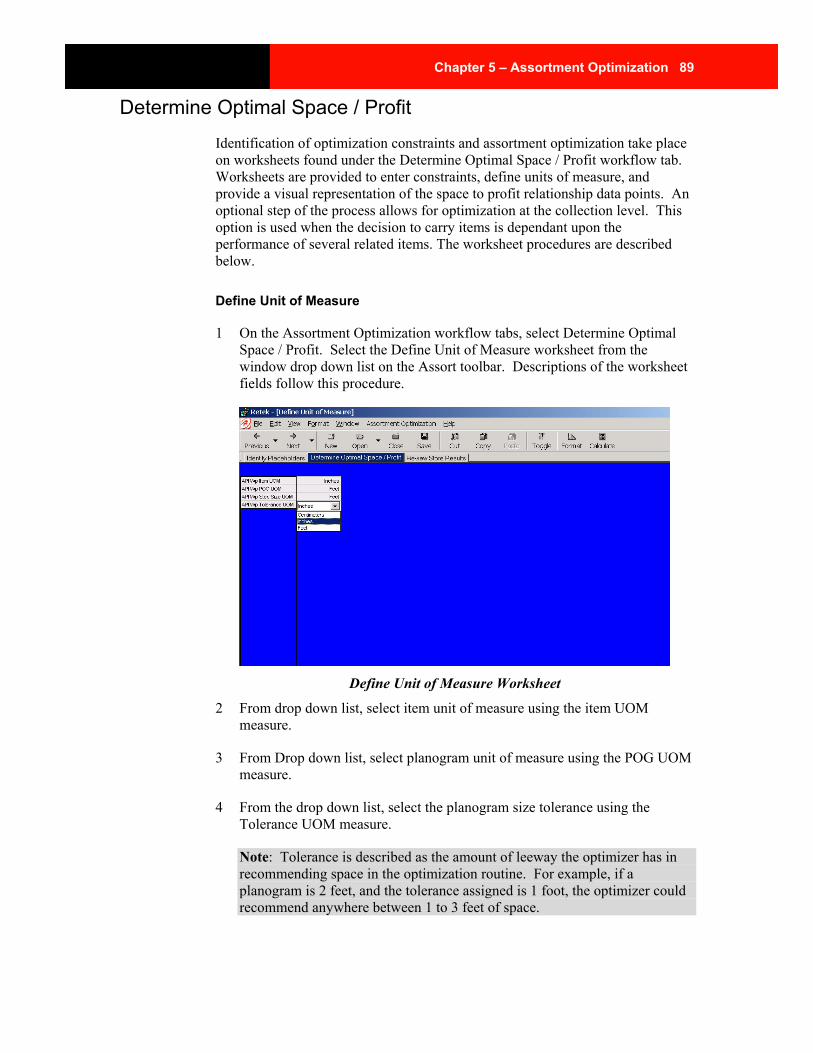
Chapter 5 – Assortment Optimization 89
Determine Optimal Space / Profit Identification of optimization constraints and assortment optimization take place on worksheets found under the Determine Optimal Space / Profit workflow tab. Worksheets are provided to enter constraints, define units of measure, and provide a visual representation of the space to profit relationship data points. An optional step of the process allows for optimization at the collection level. This option is used when the decision to carry items is dependant upon the performance of several related items. The worksheet procedures are described below.
Define Unit of Measure
1 On the Assortment Optimization workflow tabs, select Determine Optimal Space / Profit. Select the Define Unit of Measure worksheet from the window drop down list on the Assort toolbar. Descriptions of the worksheet fields follow this procedure.
Define Unit of Measure Worksheet
2 From drop down list, select item unit of measure using the item UOM measure.
3 From Drop down list, select planogram unit of measure using the POG UOM measure.
4 From the drop down list, select the planogram size tolerance using the Tolerance UOM measure.
Note: Tolerance is described as the amount of leeway the optimizer has in recommending space in the optimization routine. For example, if a planogram is 2 feet, and the tolerance assigned is 1 foot, the optimizer could recommend anywhere between 1 to 3 feet of space.
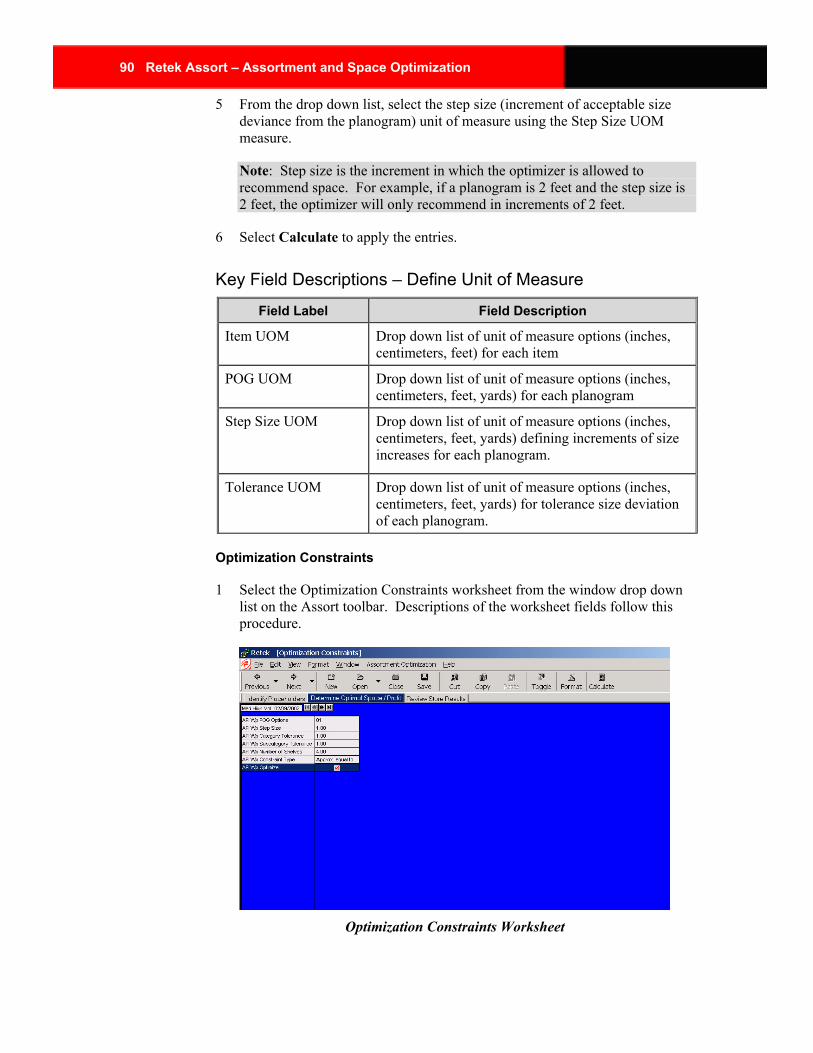
90 Retek Assort – Assortment and Space Optimization
5 From the drop down list, select the step size (increment of acceptable size deviance from the planogram) unit of measure using the Step Size UOM measure.
Note: Step size is the increment in which the optimizer is allowed to recommend space. For example, if a planogram is 2 feet and the step size is 2 feet, the optimizer will only recommend in increments of 2 feet.
6 Select Calculate to apply the entries.
Key Field Descriptions – Define Unit of Measure
Field Label Field Description
Item UOM Drop down list of unit of measure options (inches, centimeters, feet) for each item
POG UOM Drop down list of unit of measure options (inches, centimeters, feet, yards) for each planogram
Step Size UOM Drop down list of unit of measure options (inches, centimeters, feet, yards) defining increments of size increases for each planogram.
Tolerance UOM Drop down list of unit of measure options (inches, centimeters, feet, yards) for tolerance size deviation of each planogram.
Optimization Constraints
1 Select the Optimization Constraints worksheet from the window drop down list on the Assort toolbar. Descriptions of the worksheet fields follow this procedure.
Optimization Constraints Worksheet
Chapter 5 – Assortment Optimization 91
2 Select from the drop down list of options, the desired planogram length using the POG options measure.
3 Enter the step size for this planogram length in the Step Size measure.
4 Enter the tolerance level for the category in the Category Tolerance measure.
5 Enter the tolerance level for the subcategory in the Subcategory Tolerance measure.
6 Enter the number of shelves, using the Number of Shelves measure, located on the planogram selected in Step 1.
7 Using the Constraint Type measure, select the constraint type from the options appearing in the drop down list.
Note: Selecting ‘Approx. equal to’ will require the optimizer to recommend the most profitable option of space that is approximately equal to the amount of space you entered. Selecting ‘Exactly equal to’ requires the optimizer to recommend the space with the highest profit that is the closet to the amount of space that you entered.
The Optimize measure will be used after completing the remaining worksheets in the steps that follow.
8 Select Calculate to apply the data.
Key Field Descriptions – Define Unit of Measure
Field Label Field Description
POG Options Single select measure with a list of appropriate planogram lengths for the subcategory to be optimized.
Step Size Increments of size allowed in the optimization recommendations.
Category Tolerance Amount of leeway allowed from the category planogram length specified by the User.
Subcategory Tolerance Amount of leeway allowed from the subcategory planogram length specified by the User.
Number Of Shelves Number of shelves on the planogram to be optimized.
Constraint Type Single select measure specifying the level of tolerance the space / profit recommendation.
Optimize Check box measure that when enabled, initiates the optimization routine.
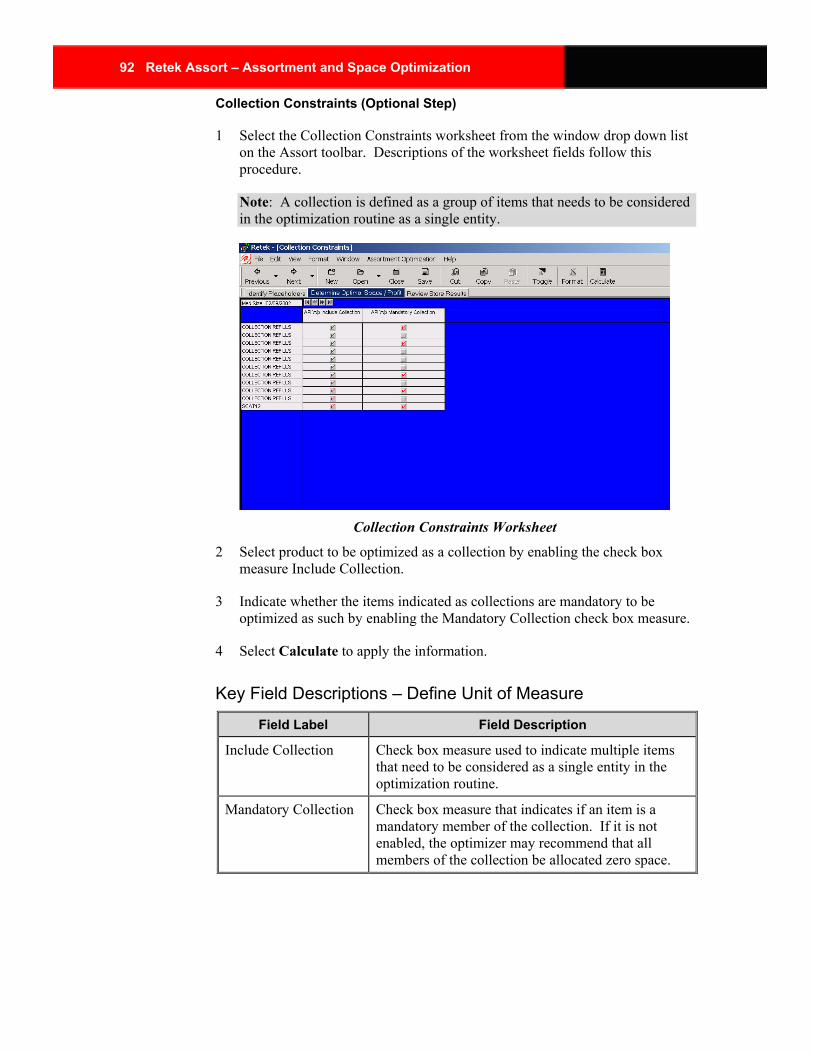
92 Retek Assort – Assortment and Space Optimization
Collection Constraints (Optional Step)
1 Select the Collection Constraints worksheet from the window drop down list on the Assort toolbar. Descriptions of the worksheet fields follow this procedure.
Note: A collection is defined as a group of items that needs to be considered in the optimization routine as a single entity.
Collection Constraints Worksheet
2 Select product to be optimized as a collection by enabling the check box measure Include Collection.
3 Indicate whether the items indicated as collections are mandatory to be optimized as such by enabling the Mandatory Collection check box measure.
4 Select Calculate to apply the information.
Key Field Descriptions – Define Unit of Measure
Field Label Field Description
Include Collection Check box measure used to indicate multiple items that need to be considered as a single entity in the optimization routine.
Mandatory Collection Check box measure that indicates if an item is a mandatory member of the collection. If it is not enabled, the optimizer may recommend that all members of the collection be allocated zero space.
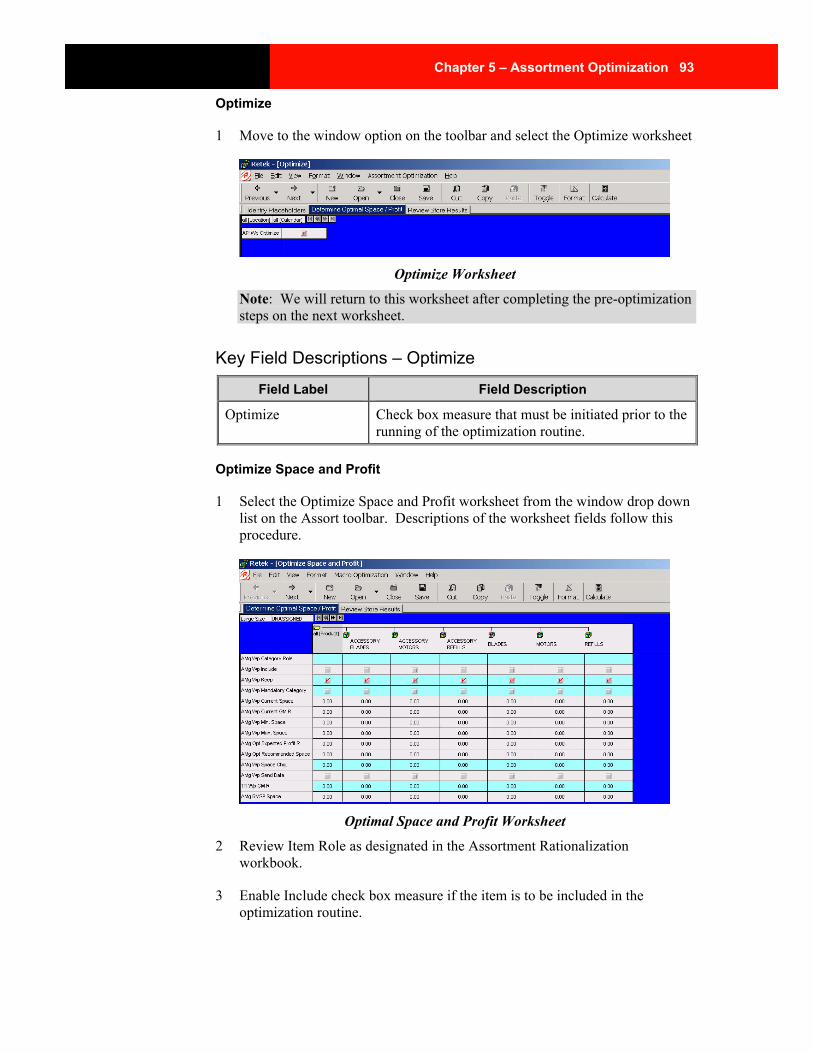
Chapter 5 – Assortment Optimization 93
Optimize
1 Move to the window option on the toolbar and select the Optimize worksheet
Optimize Worksheet
Note: We will return to this worksheet after completing the pre-optimization steps on the next worksheet.
Key Field Descriptions – Optimize
Field Label Field Description
Optimize Check box measure that must be initiated prior to the running of the optimization routine.
Optimize Space and Profit
1 Select the Optimize Space and Profit worksheet from the window drop down list on the Assort toolbar. Descriptions of the worksheet fields follow this procedure.
Optimal Space and Profit Worksheet
2 Review Item Role as designated in the Assortment Rationalization workbook.
3 Enable Include check box measure if the item is to be included in the optimization routine.
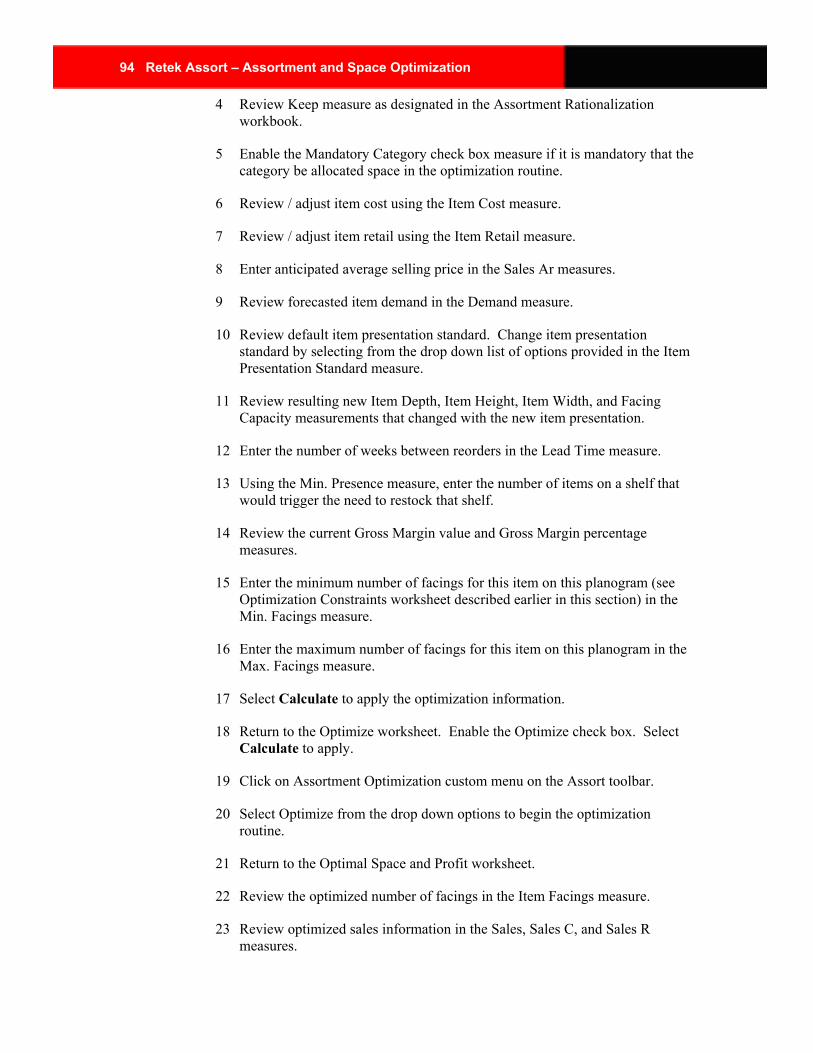
94 Retek Assort – Assortment and Space Optimization
4 Review Keep measure as designated in the Assortment Rationalization workbook.
5 Enable the Mandatory Category check box measure if it is mandatory that the category be allocated space in the optimization routine.
6 Review / adjust item cost using the Item Cost measure.
7 Review / adjust item retail using the Item Retail measure.
8 Enter anticipated average selling price in the Sales Ar measures.
9 Review forecasted item demand in the Demand measure.
10 Review default item presentation standard. Change item presentation standard by selecting from the drop down list of options provided in the Item Presentation Standard measure.
11 Review resulting new Item Depth, Item Height, Item Width, and Facing Capacity measurements that changed with the new item presentation.
12 Enter the number of weeks between reorders in the Lead Time measure.
13 Using the Min. Presence measure, enter the number of items on a shelf that would trigger the need to restock that shelf.
14 Review the current Gross Margin value and Gross Margin percentage measures.
15 Enter the minimum number of facings for this item on this planogram (see Optimization Constraints worksheet described earlier in this section) in the Min. Facings measure.
16 Enter the maximum number of facings for this item on this planogram in the Max. Facings measure.
17 Select Calculate to apply the optimization information.
18 Return to the Optimize worksheet. Enable the Optimize check box. Select Calculate to apply.
19 Click on Assortment Optimization custom menu on the Assort toolbar.
20 Select Optimize from the drop down options to begin the optimization routine.
21 Return to the Optimal Space and Profit worksheet.
22 Review the optimized number of facings in the Item Facings measure.
23 Review optimized sales information in the Sales, Sales C, and Sales R measures.
Chapter 5 – Assortment Optimization 95
24 Review the anticipated gross margin value resulting from the optimization routine.
25 Revise optimization inputs as necessary.
26 Select Calculate to apply changes.
27 Return to the Optimize worksheet. Enable the Optimize check box. Select Calculate to apply.
28 Click on Assortment Optimization label on the Assort toolbar.
29 Select Optimize from the drop down options to re-initialize the optimization routine.
30 Click on the Send Data check box on the Optimize Space / Profit worksheet box to initiate the passing of data from Assort to the space planning application.
Note: You may choose to send data for selected items by checking the Send Data check box at the item level.
31 Select Calculate to apply the Send Data command
32 Click on Assortment Optimization custom measure on the Assort toolbar.
33 Select Send Data to Visual Planning to pass optimized space and profit to the space planning application.
34 Review adjusted space recommendations in the RVSP Space measure.
35 Enter the space planning recommendation into both the Min. Facing and Max. Facing measures, to accept the space planning recommendation.
36 Repeat optimization steps outlined above.
37 Select Save to retain the information.
Key Field Descriptions – Optimize Space / Profit
Field Label Field Description
Item Role Strategic role assigned to items in the Assortment Rationalization process.
Include Check box measure indicating whether the item should be included in the optimization routine.
Keep Check box measure from Assortment Rationalization process step indicating the keep or de-list status of an item.
96 Retek Assort – Assortment and Space Optimization
Field Label Field Description
Mandatory Item Check box measure indicating if it is mandatory that space be recommended for the item.
Item Cost Amount paid to the Vendor for the item.
Item Retail Full retail value of the item.
Sales Ar Average selling price for the item.
Demand Embedded unconstrained forecasted consumer demand for the item.
Item Presentation Standard
Single select drop down list of presentation options for each item. Each item is seeded with a default presentation style such as front or side.
Item Depth Depth of the item given the presentation standard chosen.
Item Height Height of the item given the presentation standard chosen.
Item Width Width of the item given the presentation standard chosen.
Facing Capacity Number of items behind each facing given the presentation standard chosen.
Lead Time Number of weeks between reorders.
Min. Presence Shelf quantity that triggers the restocking of that shelf.
GM Gross margin
Min. Facings Minimum number of facings to be considered in the optimization routine.
Max. Facings Maximum number of facings to be considered in the optimization routine.
Item Facings The number of item facings returned by the optimization routine between the minimum and maximum boundaries.
Sales Sales
Send Data Check box measure indicating which optimized items may be sent to the visual space planning solution.
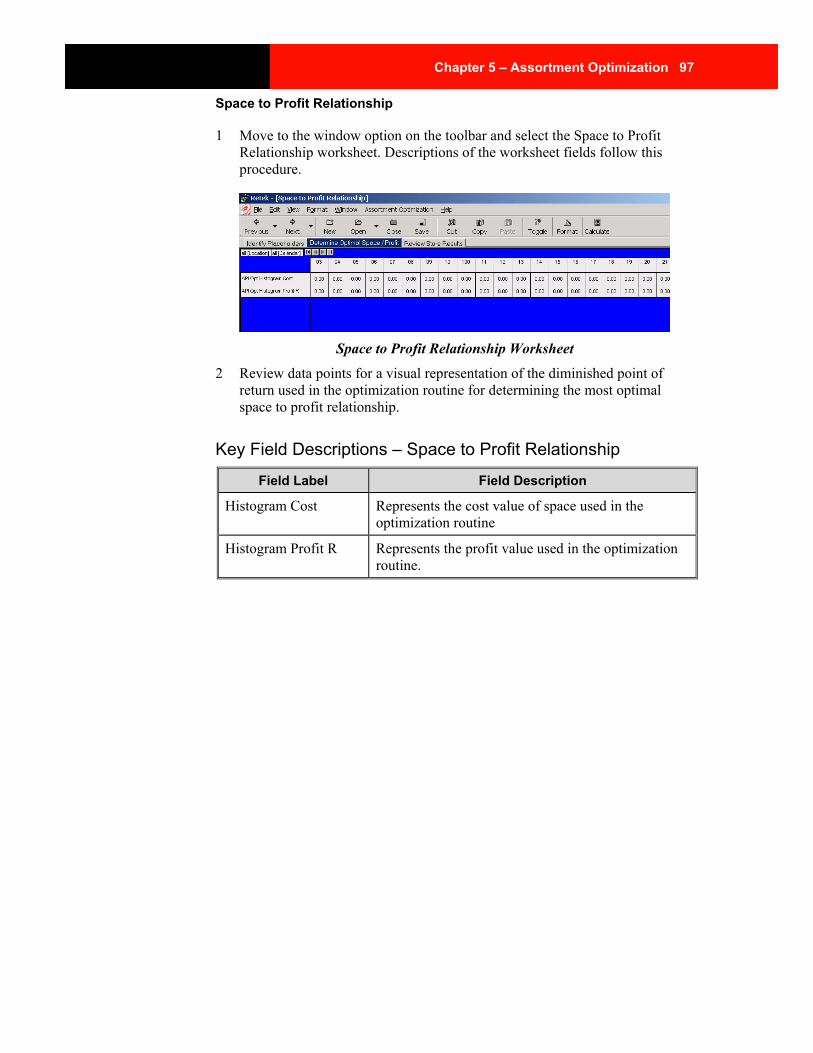
Chapter 5 – Assortment Optimization 97
Space to Profit Relationship
1 Move to the window option on the toolbar and select the Space to Profit Relationship worksheet. Descriptions of the worksheet fields follow this procedure.
Space to Profit Relationship Worksheet
2 Review data points for a visual representation of the diminished point of return used in the optimization routine for determining the most optimal space to profit relationship.
Key Field Descriptions – Space to Profit Relationship
Field Label Field Description
Histogram Cost Represents the cost value of space used in the optimization routine
Histogram Profit R Represents the profit value used in the optimization routine.
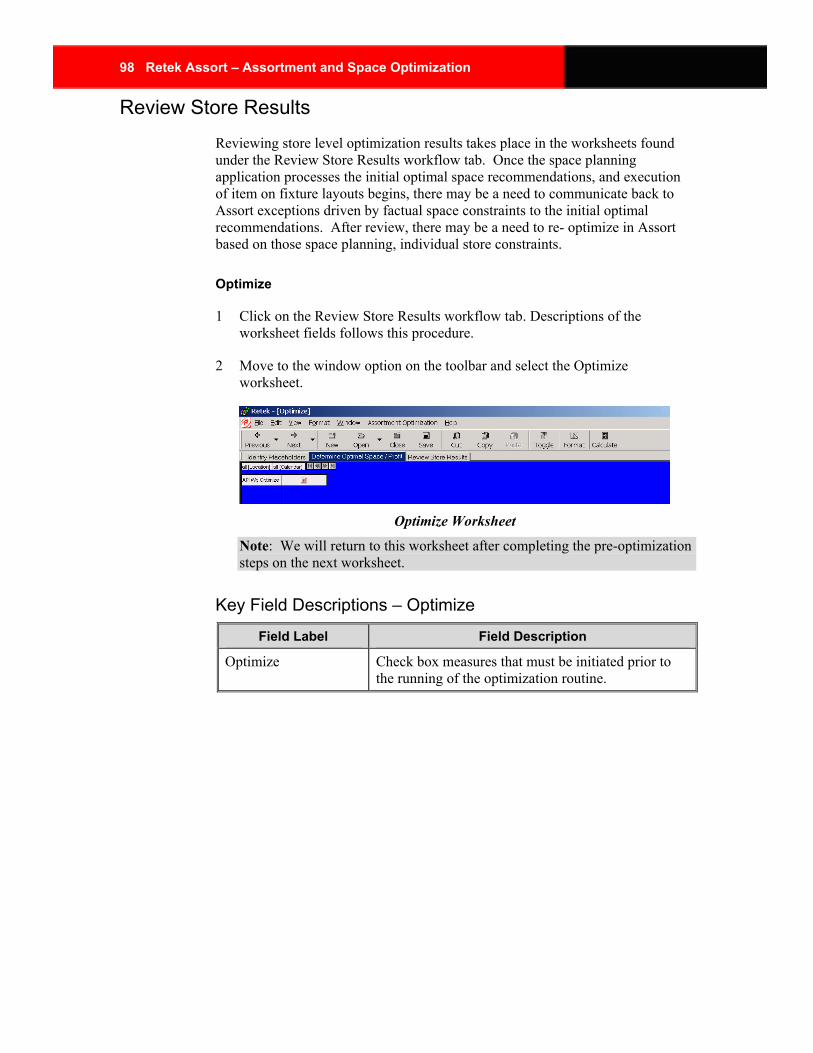
98 Retek Assort – Assortment and Space Optimization
Review Store Results Reviewing store level optimization results takes place in the worksheets found under the Review Store Results workflow tab. Once the space planning application processes the initial optimal space recommendations, and execution of item on fixture layouts begins, there may be a need to communicate back to Assort exceptions driven by factual space constraints to the initial optimal recommendations. After review, there may be a need to re- optimize in Assort based on those space planning, individual store constraints.
Optimize
1 Click on the Review Store Results workflow tab. Descriptions of the worksheet fields follows this procedure.
2 Move to the window option on the toolbar and select the Optimize worksheet.
Optimize Worksheet
Note: We will return to this worksheet after completing the pre-optimization steps on the next worksheet.
Key Field Descriptions – Optimize
Field Label Field Description
Optimize Check box measures that must be initiated prior to the running of the optimization routine.
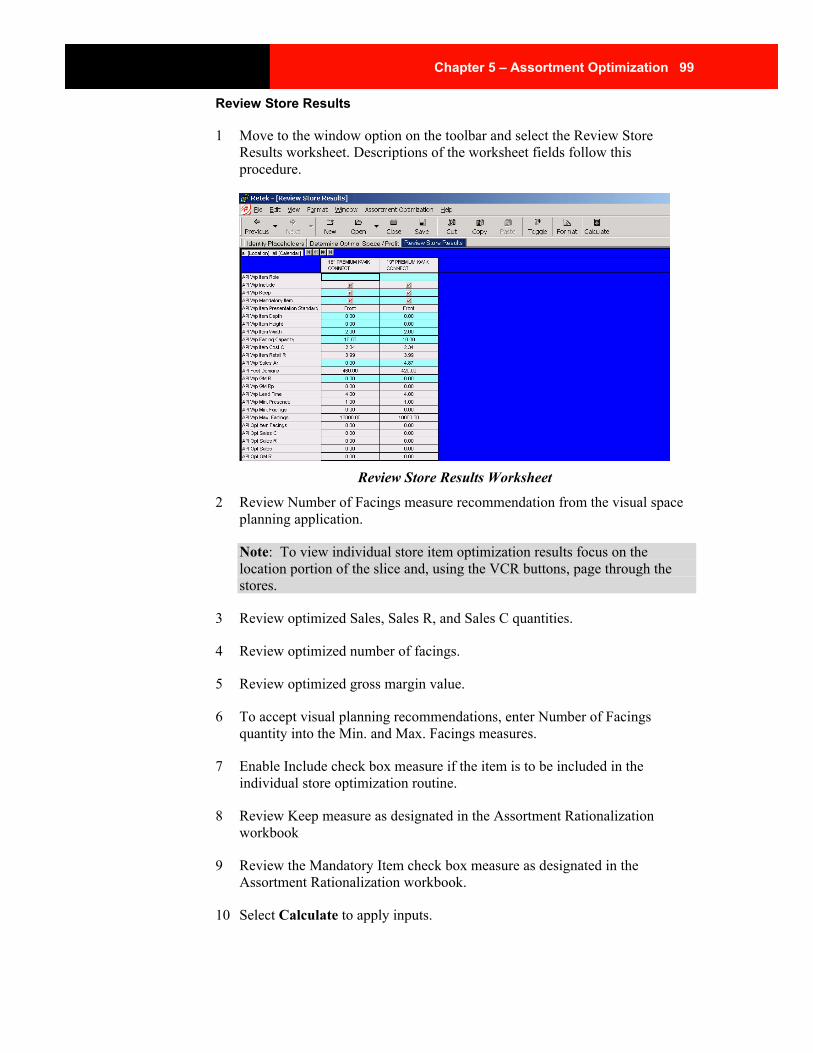
Chapter 5 – Assortment Optimization 99
Review Store Results
1 Move to the window option on the toolbar and select the Review Store Results worksheet. Descriptions of the worksheet fields follow this procedure.
Review Store Results Worksheet
2 Review Number of Facings measure recommendation from the visual space planning application.
Note: To view individual store item optimization results focus on the location portion of the slice and, using the VCR buttons, page through the stores.
3 Review optimized Sales, Sales R, and Sales C quantities.
4 Review optimized number of facings.
5 Review optimized gross margin value.
6 To accept visual planning recommendations, enter Number of Facings quantity into the Min. and Max. Facings measures.
7 Enable Include check box measure if the item is to be included in the individual store optimization routine.
8 Review Keep measure as designated in the Assortment Rationalization workbook
9 Review the Mandatory Item check box measure as designated in the Assortment Rationalization workbook.
10 Select Calculate to apply inputs.
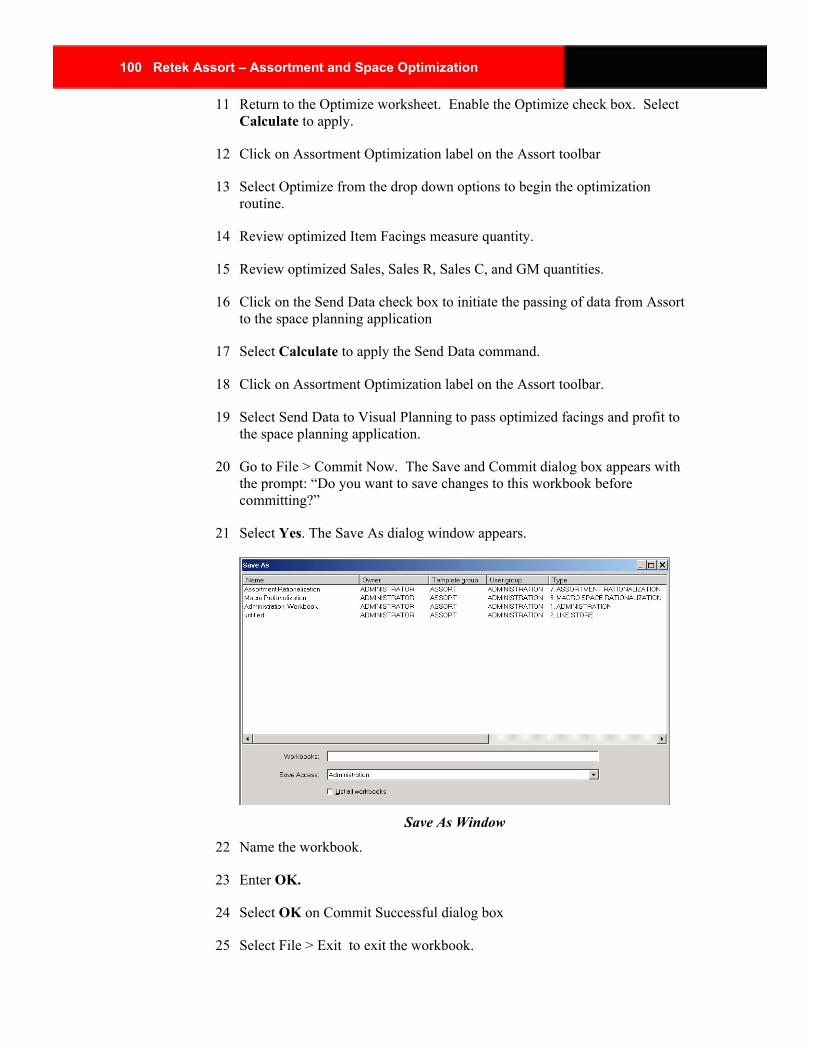
100 Retek Assort – Assortment and Space Optimization
11 Return to the Optimize worksheet. Enable the Optimize check box. Select Calculate to apply.
12 Click on Assortment Optimization label on the Assort toolbar
13 Select Optimize from the drop down options to begin the optimization routine.
14 Review optimized Item Facings measure quantity.
15 Review optimized Sales, Sales R, Sales C, and GM quantities.
16 Click on the Send Data check box to initiate the passing of data from Assort to the space planning application
17 Select Calculate to apply the Send Data command.
18 Click on Assortment Optimization label on the Assort toolbar.
19 Select Send Data to Visual Planning to pass optimized facings and profit to the space planning application.
20 Go to File > Commit Now. The Save and Commit dialog box appears with the prompt: “Do you want to save changes to this workbook before committing?”
21 Select Yes. The Save As dialog window appears.
Save As Window
22 Name the workbook.
23 Enter OK.
24 Select OK on Commit Successful dialog box
25 Select File > Exit to exit the workbook.
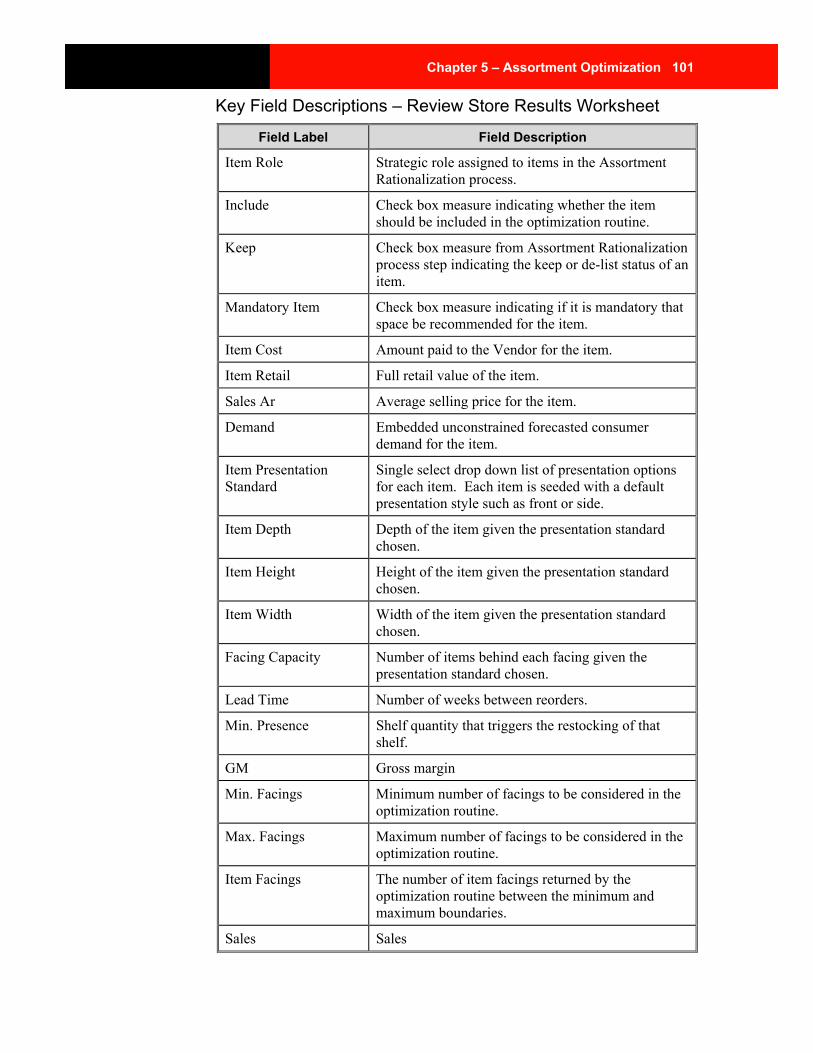
Chapter 5 – Assortment Optimization 101
Key Field Descriptions – Review Store Results Worksheet
Field Label Field Description
Item Role Strategic role assigned to items in the Assortment Rationalization process.
Include Check box measure indicating whether the item should be included in the optimization routine.
Keep Check box measure from Assortment Rationalization process step indicating the keep or de-list status of an item.
Mandatory Item Check box measure indicating if it is mandatory that space be recommended for the item.
Item Cost Amount paid to the Vendor for the item.
Item Retail Full retail value of the item.
Sales Ar Average selling price for the item.
Demand Embedded unconstrained forecasted consumer demand for the item.
Item Presentation Standard
Single select drop down list of presentation options for each item. Each item is seeded with a default presentation style such as front or side.
Item Depth Depth of the item given the presentation standard chosen.
Item Height Height of the item given the presentation standard chosen.
Item Width Width of the item given the presentation standard chosen.
Facing Capacity Number of items behind each facing given the presentation standard chosen.
Lead Time Number of weeks between reorders.
Min. Presence Shelf quantity that triggers the restocking of that shelf.
GM Gross margin
Min. Facings Minimum number of facings to be considered in the optimization routine.
Max. Facings Maximum number of facings to be considered in the optimization routine.
Item Facings The number of item facings returned by the optimization routine between the minimum and maximum boundaries.
Sales Sales
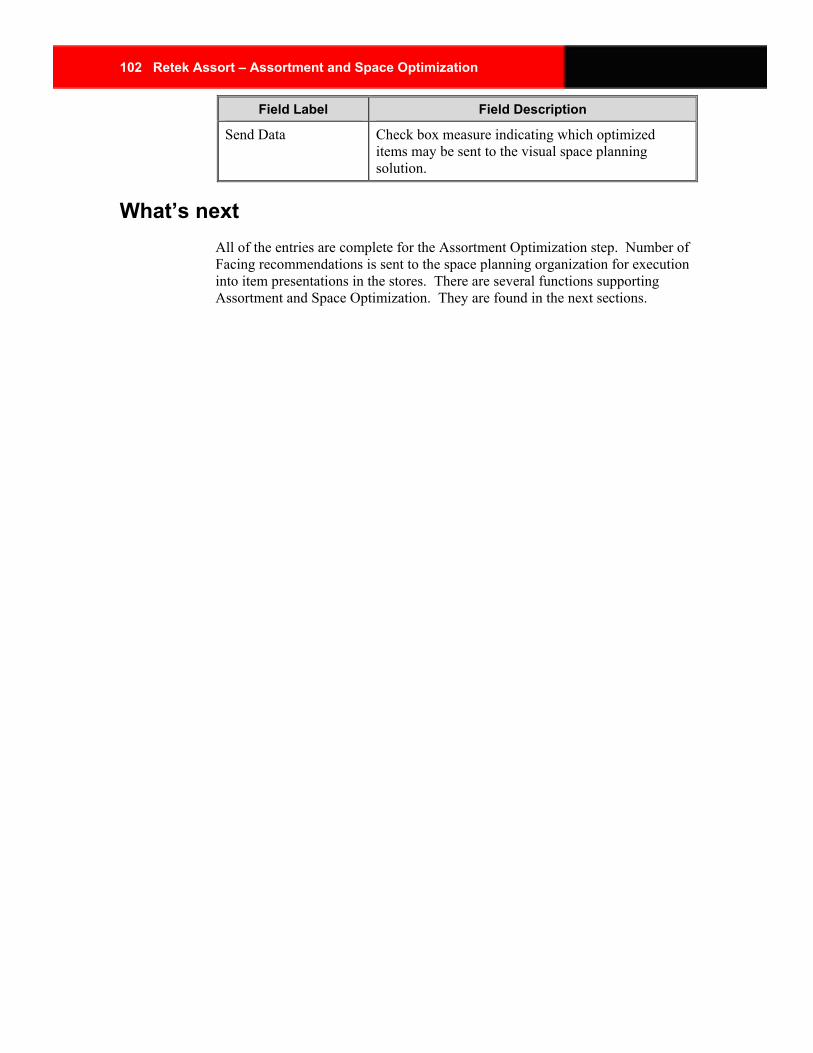
102 Retek Assort – Assortment and Space Optimization
Field Label Field Description
Send Data Check box measure indicating which optimized items may be sent to the visual space planning solution.
What’s next All of the entries are complete for the Assortment Optimization step. Number of Facing recommendations is sent to the space planning organization for execution into item presentations in the stores. There are several functions supporting Assortment and Space Optimization. They are found in the next sections.
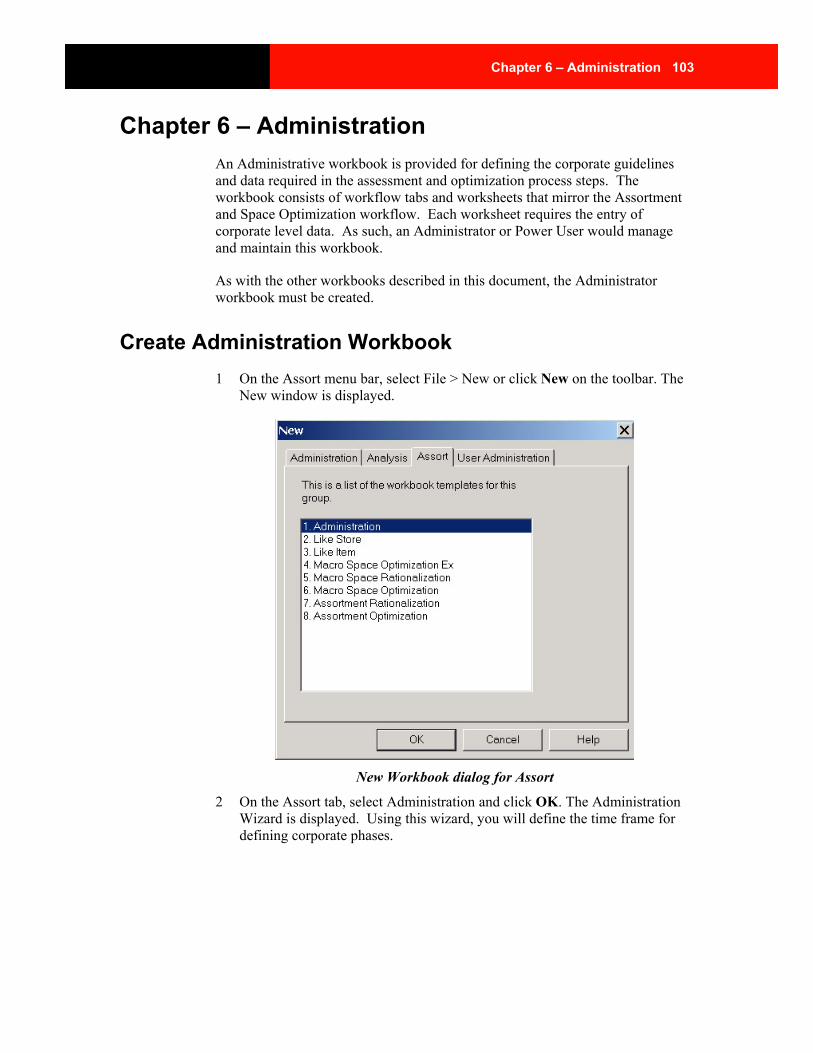
Chapter 6 – Administration 103
Chapter 6 – Administration An Administrative workbook is provided for defining the corporate guidelines and data required in the assessment and optimization process steps. The workbook consists of workflow tabs and worksheets that mirror the Assortment and Space Optimization workflow. Each worksheet requires the entry of corporate level data. As such, an Administrator or Power User would manage and maintain this workbook.
As with the other workbooks described in this document, the Administrator workbook must be created.
Create Administration Workbook 1 On the Assort menu bar, select File > New or click New on the toolbar. The
New window is displayed.
New Workbook dialog for Assort
2 On the Assort tab, select Administration and click OK. The Administration Wizard is displayed. Using this wizard, you will define the time frame for defining corporate phases.
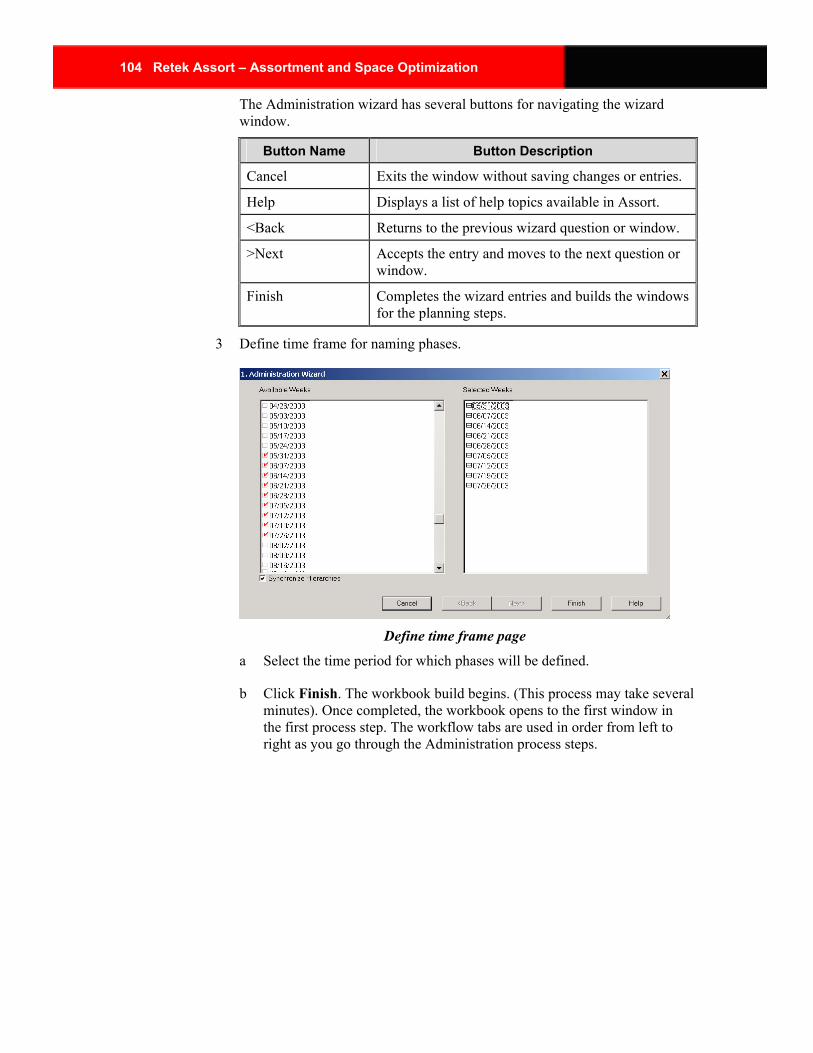
104 Retek Assort – Assortment and Space Optimization
The Administration wizard has several buttons for navigating the wizard window.
Button Name Button Description
Cancel Exits the window without saving changes or entries.
Help Displays a list of help topics available in Assort.
<Back Returns to the previous wizard question or window.
>Next Accepts the entry and moves to the next question or window.
Finish Completes the wizard entries and builds the windows for the planning steps.
3 Define time frame for naming phases.
Define time frame page
a Select the time period for which phases will be defined.
b Click Finish. The workbook build begins. (This process may take several minutes). Once completed, the workbook opens to the first window in the first process step. The workflow tabs are used in order from left to right as you go through the Administration process steps.

Chapter 6 – Administration 105
Toolbar buttons Now that an Administration workbook has been created, Assort displays an expanded toolbar and workflow tabs for navigating through the administrative processes.
Assort toolbar and Administration workflow tabs
The table below contains brief descriptions of the Assort toolbar buttons. For more detailed descriptions, see the Retek Predictive Application Server User Guide or online help.
Button Name Button Description
Previous Navigates to the previous step in the business process. Each distinct step is associated with a separate worksheet or set of worksheets. Clicking this toolbar button produces the same result as choosing View > Previous in Flow Control.
The steps in the business process are represented by the flow control tabs, which normally appear immediately beneath the application toolbar. To view the worksheet(s) associated with a particular step, you can simply click on the corresponding tab.
Next Navigates to the next step in the business process. Each distinct step is associated with a separate worksheet or set of worksheets. Clicking this toolbar button produces the same result as choosing View > Next in Flow Control.
The steps in the business process are represented by the flow control tabs, which normally appear immediately beneath the application toolbar. To view the worksheet(s) associated with a particular step, you can simply click on the corresponding tab.
New Activates the closing of the workbook process so that a new workbook may be opened.
Open Opens a list of saved workbooks for editing or viewing. Selections made will trigger the closing steps of the current workbook. Once closed, the selected workbook will automatically open.
Close Closes the currently opened workbook. There are a number of options for saving changes before closing.
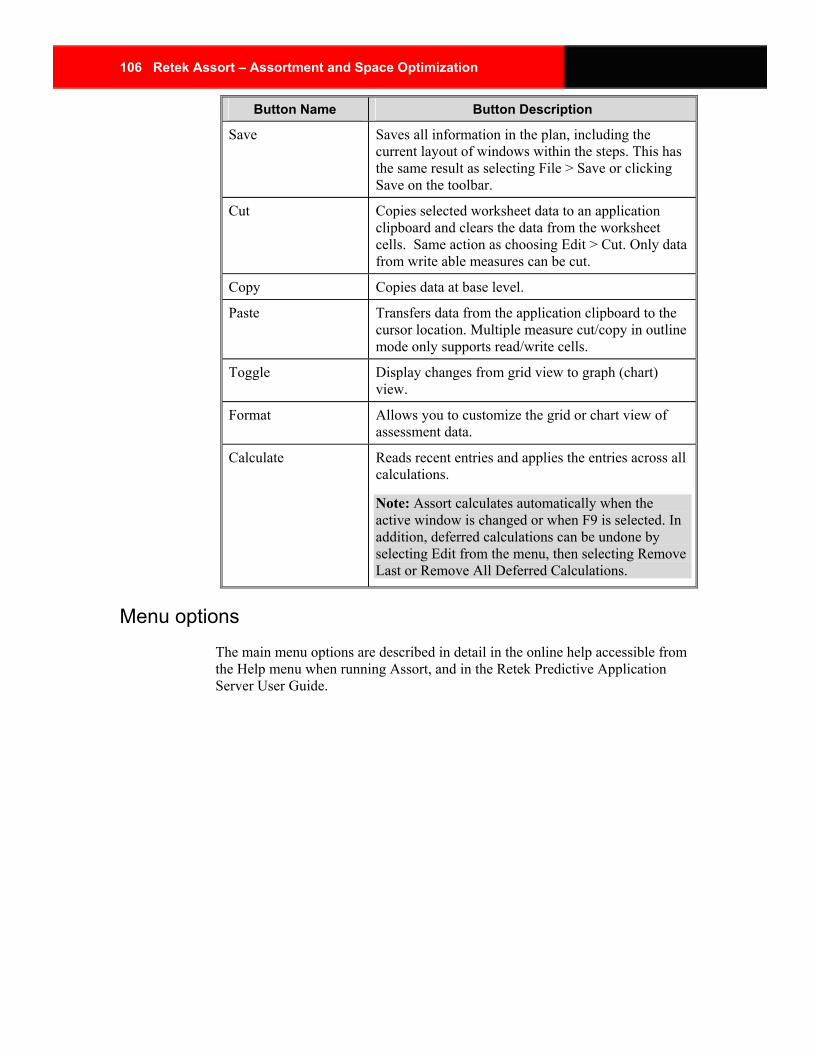
106 Retek Assort – Assortment and Space Optimization
Button Name Button Description
Save Saves all information in the plan, including the current layout of windows within the steps. This has the same result as selecting File > Save or clicking Save on the toolbar.
Cut Copies selected worksheet data to an application clipboard and clears the data from the worksheet cells. Same action as choosing Edit > Cut. Only data from write able measures can be cut.
Copy Copies data at base level.
Paste Transfers data from the application clipboard to the cursor location. Multiple measure cut/copy in outline mode only supports read/write cells.
Toggle Display changes from grid view to graph (chart) view.
Format Allows you to customize the grid or chart view of assessment data.
Calculate Reads recent entries and applies the entries across all calculations.
Note: Assort calculates automatically when the active window is changed or when F9 is selected. In addition, deferred calculations can be undone by selecting Edit from the menu, then selecting Remove Last or Remove All Deferred Calculations.
Menu options The main menu options are described in detail in the online help accessible from the Help menu when running Assort, and in the Retek Predictive Application Server User Guide.
Chapter 6 – Administration 107
Administration workflow tabs The Administration workflow tabs are below the Assort toolbar and are used to move between sets of windows supporting the assortment and space optimization workflow. You can either click on the workflow tabs, or use Next and Previous on the toolbar to move between them. The workflow tabs for the Administration functionality are as follows:
Process Step Tab Descriptions
Phase Definition Corporate phases are defined, appearing in the solution workbooks as an alternate hierarchy based at the week level.
Macro Rationalization Location for the definition of competitors and the input of market share data supporting the Competitive Analysis process step.
Macro and Assortment Optimization
Corporate optimization parameters are defined, macro level profit / space relationship information is provided, and store level optimization parameters are inputted.
Assortment Rationalization
Feature criteria and thresholds for each of the assessment categories are defined in this process step.
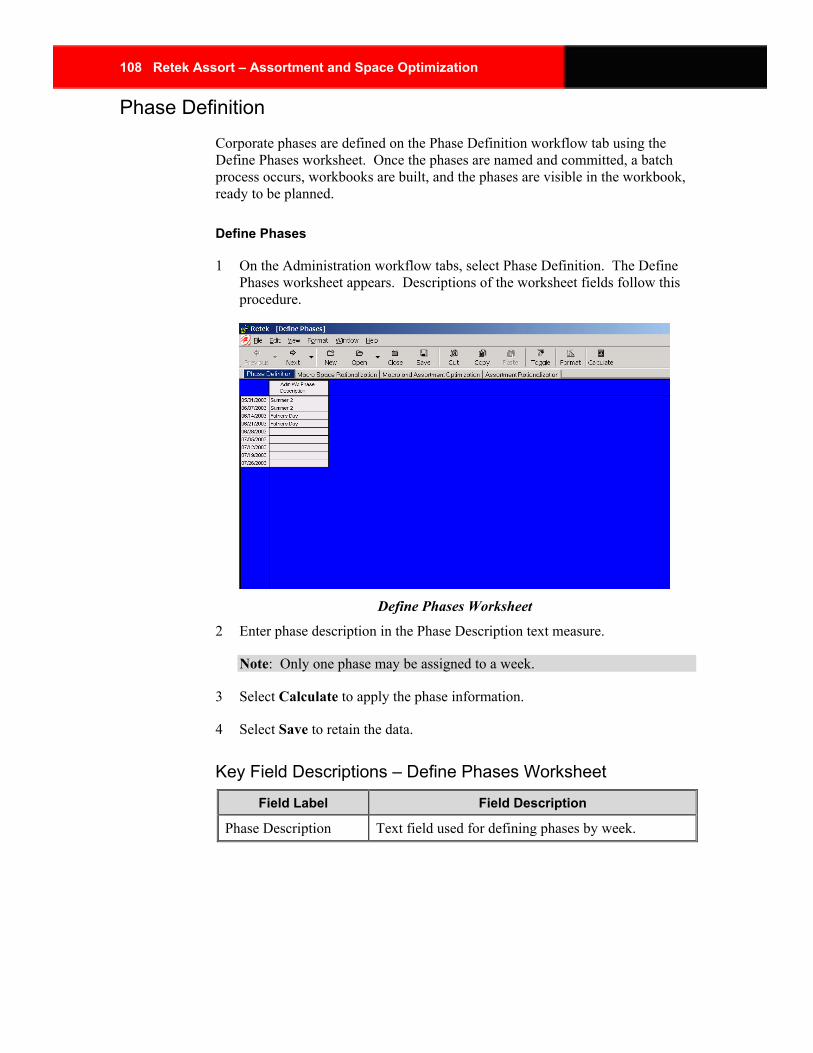
108 Retek Assort – Assortment and Space Optimization
Phase Definition Corporate phases are defined on the Phase Definition workflow tab using the Define Phases worksheet. Once the phases are named and committed, a batch process occurs, workbooks are built, and the phases are visible in the workbook, ready to be planned.
Define Phases
1 On the Administration workflow tabs, select Phase Definition. The Define Phases worksheet appears. Descriptions of the worksheet fields follow this procedure.
Define Phases Worksheet
2 Enter phase description in the Phase Description text measure.
Note: Only one phase may be assigned to a week.
3 Select Calculate to apply the phase information.
4 Select Save to retain the data.
Key Field Descriptions – Define Phases Worksheet
Field Label Field Description
Phase Description Text field used for defining phases by week.
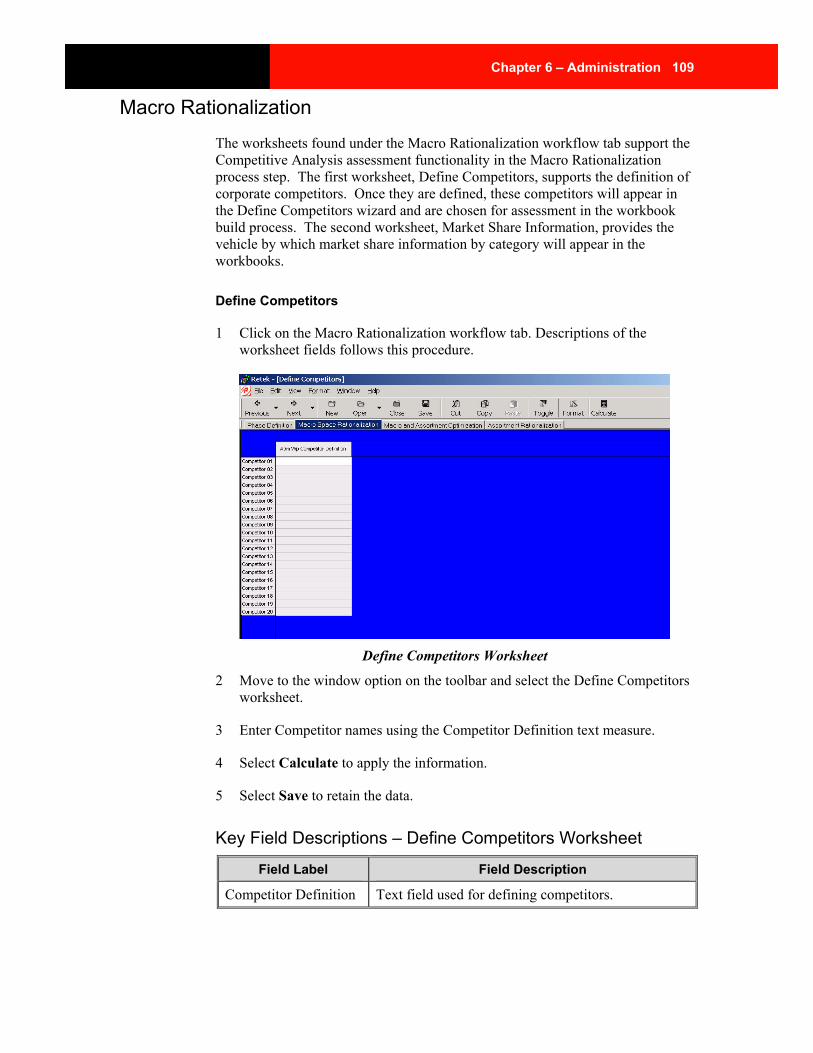
Chapter 6 – Administration 109
Macro Rationalization The worksheets found under the Macro Rationalization workflow tab support the Competitive Analysis assessment functionality in the Macro Rationalization process step. The first worksheet, Define Competitors, supports the definition of corporate competitors. Once they are defined, these competitors will appear in the Define Competitors wizard and are chosen for assessment in the workbook build process. The second worksheet, Market Share Information, provides the vehicle by which market share information by category will appear in the workbooks.
Define Competitors
1 Click on the Macro Rationalization workflow tab. Descriptions of the worksheet fields follows this procedure.
Define Competitors Worksheet
2 Move to the window option on the toolbar and select the Define Competitors worksheet.
3 Enter Competitor names using the Competitor Definition text measure.
4 Select Calculate to apply the information.
5 Select Save to retain the data.
Key Field Descriptions – Define Competitors Worksheet
Field Label Field Description
Competitor Definition Text field used for defining competitors.
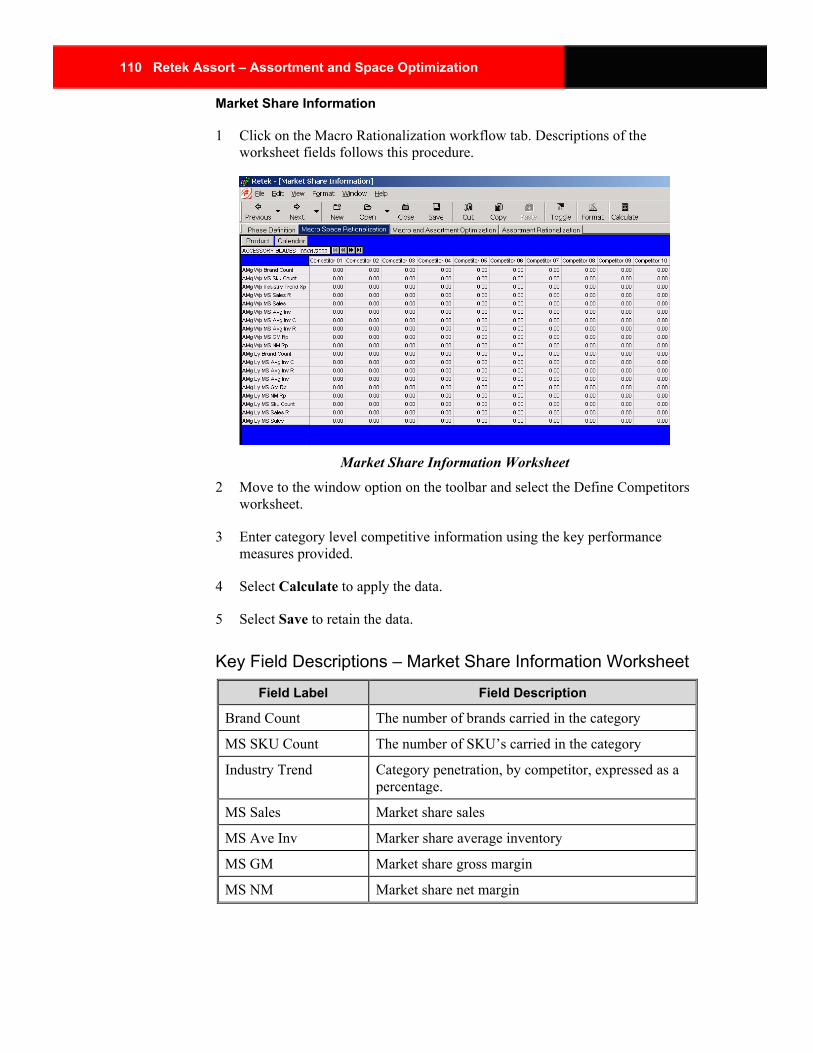
110 Retek Assort – Assortment and Space Optimization
Market Share Information
1 Click on the Macro Rationalization workflow tab. Descriptions of the worksheet fields follows this procedure.
Market Share Information Worksheet
2 Move to the window option on the toolbar and select the Define Competitors worksheet.
3 Enter category level competitive information using the key performance measures provided.
4 Select Calculate to apply the data.
5 Select Save to retain the data.
Key Field Descriptions – Market Share Information Worksheet
Field Label Field Description
Brand Count The number of brands carried in the category
MS SKU Count The number of SKU’s carried in the category
Industry Trend Category penetration, by competitor, expressed as a percentage.
MS Sales Market share sales
MS Ave Inv Marker share average inventory
MS GM Market share gross margin
MS NM Market share net margin
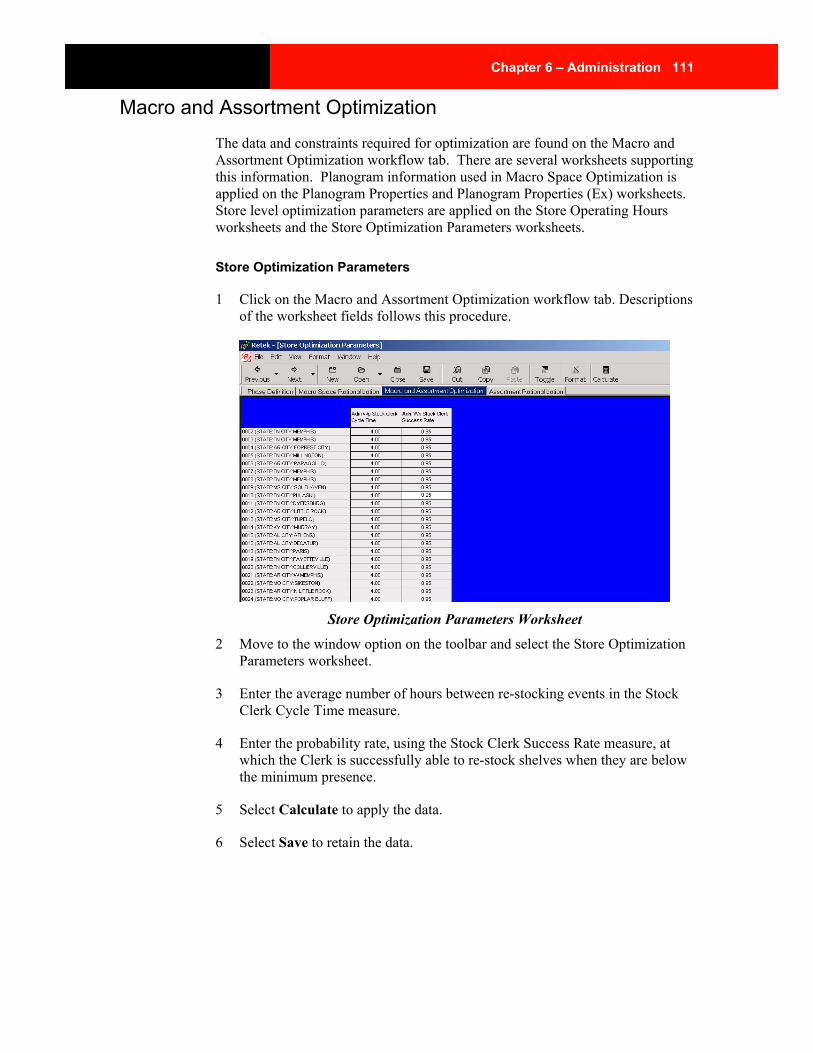
Chapter 6 – Administration 111
Macro and Assortment Optimization The data and constraints required for optimization are found on the Macro and Assortment Optimization workflow tab. There are several worksheets supporting this information. Planogram information used in Macro Space Optimization is applied on the Planogram Properties and Planogram Properties (Ex) worksheets. Store level optimization parameters are applied on the Store Operating Hours worksheets and the Store Optimization Parameters worksheets.
Store Optimization Parameters
1 Click on the Macro and Assortment Optimization workflow tab. Descriptions of the worksheet fields follows this procedure.
Store Optimization Parameters Worksheet
2 Move to the window option on the toolbar and select the Store Optimization Parameters worksheet.
3 Enter the average number of hours between re-stocking events in the Stock Clerk Cycle Time measure.
4 Enter the probability rate, using the Stock Clerk Success Rate measure, at which the Clerk is successfully able to re-stock shelves when they are below the minimum presence.
5 Select Calculate to apply the data.
6 Select Save to retain the data.
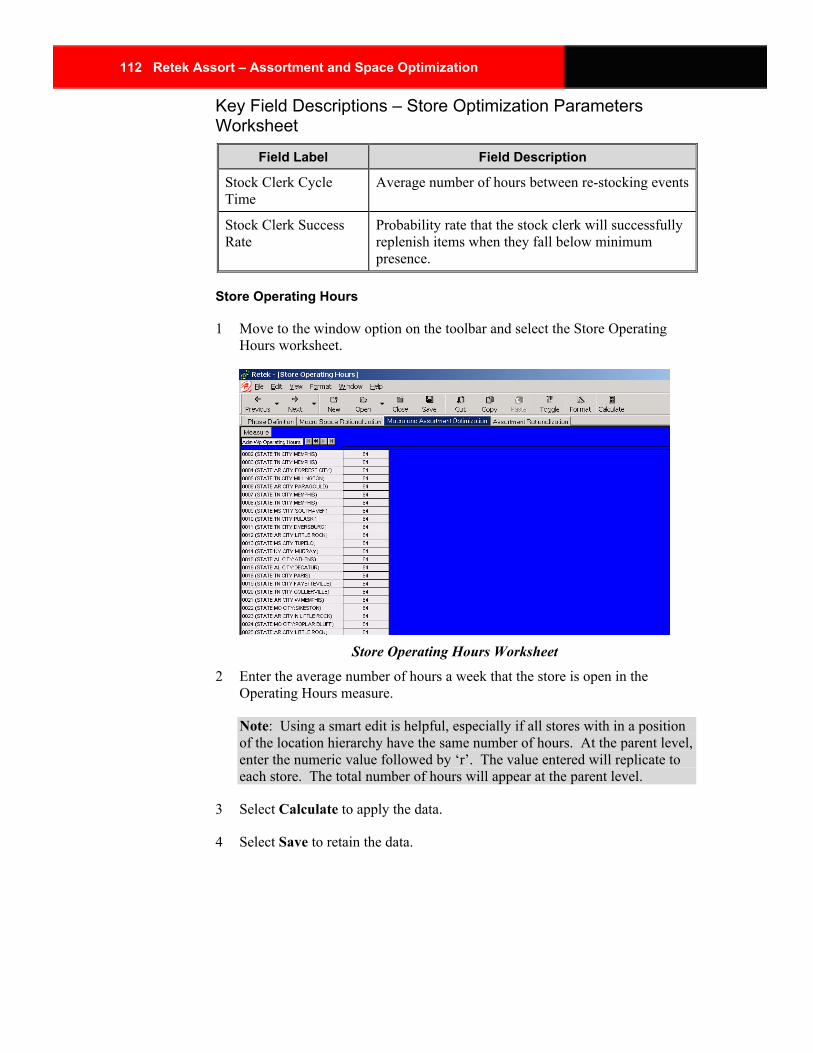
112 Retek Assort – Assortment and Space Optimization
Key Field Descriptions – Store Optimization Parameters Worksheet
Field Label Field Description
Stock Clerk Cycle Time
Average number of hours between re-stocking events
Stock Clerk Success Rate
Probability rate that the stock clerk will successfully replenish items when they fall below minimum presence.
Store Operating Hours
1 Move to the window option on the toolbar and select the Store Operating Hours worksheet.
Store Operating Hours Worksheet
2 Enter the average number of hours a week that the store is open in the Operating Hours measure.
Note: Using a smart edit is helpful, especially if all stores with in a position of the location hierarchy have the same number of hours. At the parent level, enter the numeric value followed by ‘r’. The value entered will replicate to each store. The total number of hours will appear at the parent level.
3 Select Calculate to apply the data.
4 Select Save to retain the data.
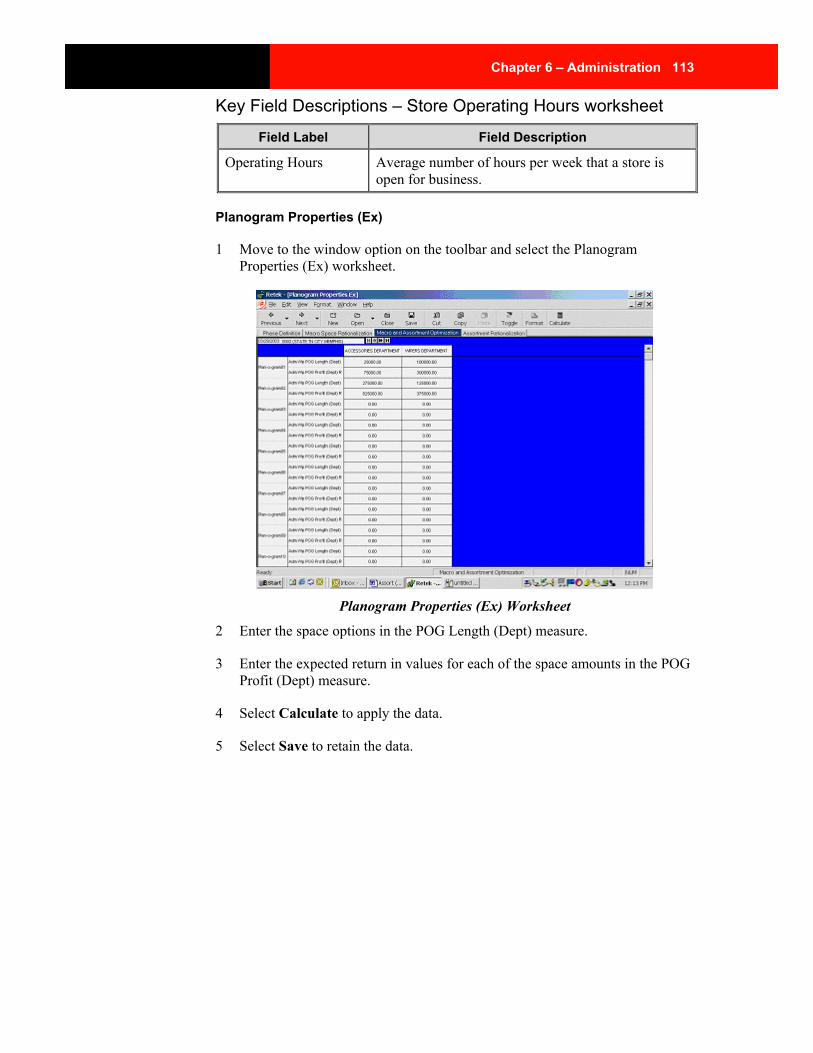
Chapter 6 – Administration 113
Key Field Descriptions – Store Operating Hours worksheet
Field Label Field Description
Operating Hours Average number of hours per week that a store is open for business.
Planogram Properties (Ex)
1 Move to the window option on the toolbar and select the Planogram Properties (Ex) worksheet.
Planogram Properties (Ex) Worksheet
2 Enter the space options in the POG Length (Dept) measure.
3 Enter the expected return in values for each of the space amounts in the POG Profit (Dept) measure.
4 Select Calculate to apply the data.
5 Select Save to retain the data.
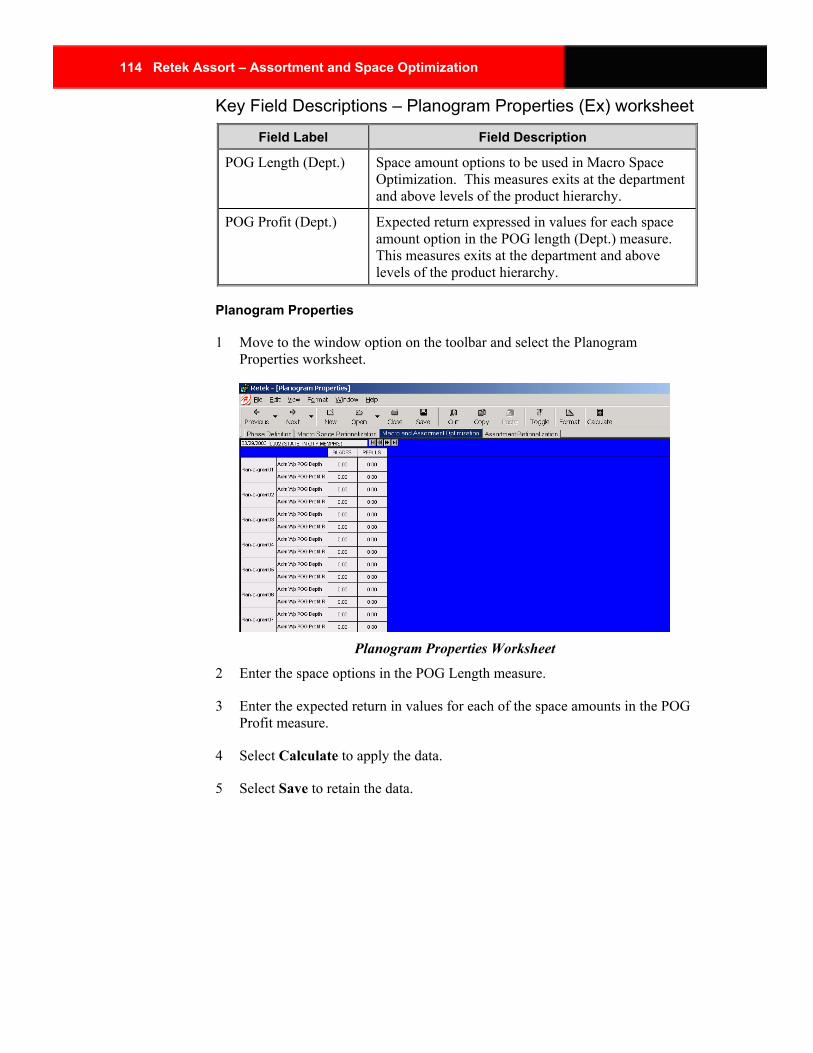
114 Retek Assort – Assortment and Space Optimization
Key Field Descriptions – Planogram Properties (Ex) worksheet
Field Label Field Description
POG Length (Dept.) Space amount options to be used in Macro Space Optimization. This measures exits at the department and above levels of the product hierarchy.
POG Profit (Dept.) Expected return expressed in values for each space amount option in the POG length (Dept.) measure. This measures exits at the department and above levels of the product hierarchy.
Planogram Properties
1 Move to the window option on the toolbar and select the Planogram Properties worksheet.
Planogram Properties Worksheet
2 Enter the space options in the POG Length measure.
3 Enter the expected return in values for each of the space amounts in the POG Profit measure.
4 Select Calculate to apply the data.
5 Select Save to retain the data.
Chapter 6 – Administration 115
Key Field Descriptions – Planogram Properties worksheet
Field Label Field Description
POG Length Space amount options to be used in Macro Space Optimization. This measures exits at the sub-category to department levels of the product hierarchy.
POG Profit Expected return expressed in values for each space amount option in the POG length measure. This measures exits at the sub-category to department levels of the product hierarchy.
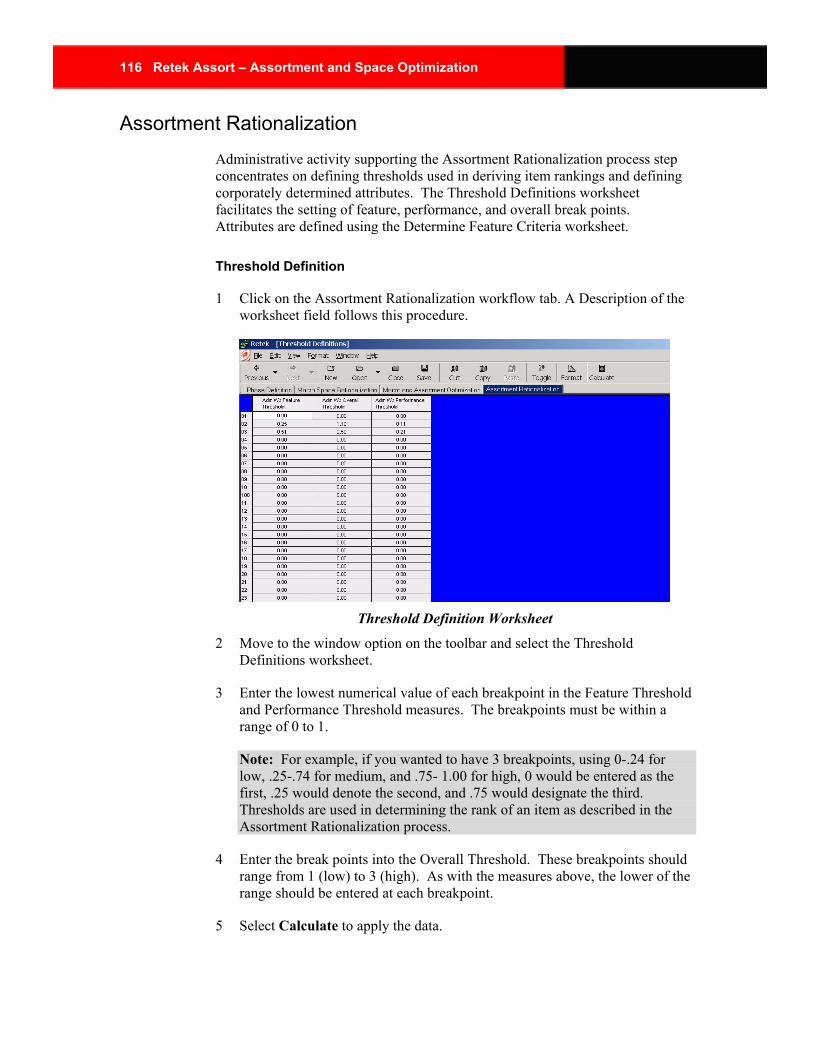
116 Retek Assort – Assortment and Space Optimization
Assortment Rationalization Administrative activity supporting the Assortment Rationalization process step concentrates on defining thresholds used in deriving item rankings and defining corporately determined attributes. The Threshold Definitions worksheet facilitates the setting of feature, performance, and overall break points. Attributes are defined using the Determine Feature Criteria worksheet.
Threshold Definition
1 Click on the Assortment Rationalization workflow tab. A Description of the worksheet field follows this procedure.
Threshold Definition Worksheet
2 Move to the window option on the toolbar and select the Threshold Definitions worksheet.
3 Enter the lowest numerical value of each breakpoint in the Feature Threshold and Performance Threshold measures. The breakpoints must be within a range of 0 to 1.
Note: For example, if you wanted to have 3 breakpoints, using 0-.24 for low, .25-.74 for medium, and .75- 1.00 for high, 0 would be entered as the first, .25 would denote the second, and .75 would designate the third. Thresholds are used in determining the rank of an item as described in the Assortment Rationalization process.
4 Enter the break points into the Overall Threshold. These breakpoints should range from 1 (low) to 3 (high). As with the measures above, the lower of the range should be entered at each breakpoint.
5 Select Calculate to apply the data.
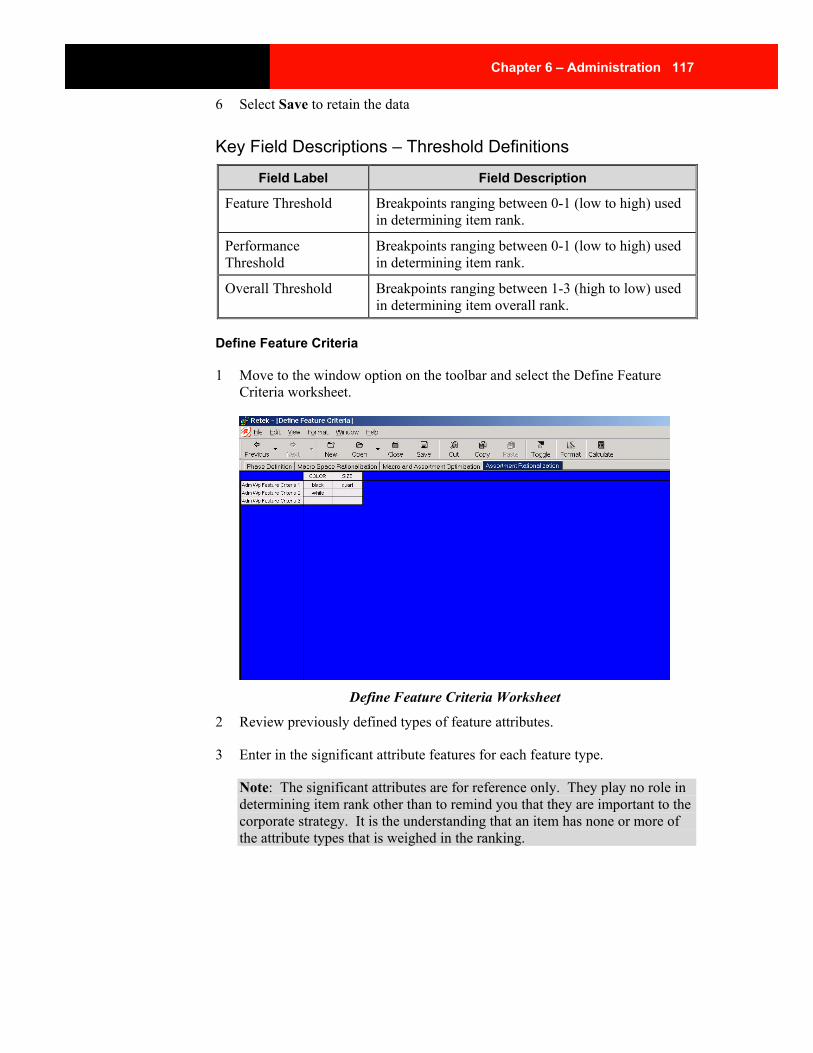
Chapter 6 – Administration 117
6 Select Save to retain the data
Key Field Descriptions – Threshold Definitions
Field Label Field Description
Feature Threshold Breakpoints ranging between 0-1 (low to high) used in determining item rank.
Performance Threshold
Breakpoints ranging between 0-1 (low to high) used in determining item rank.
Overall Threshold Breakpoints ranging between 1-3 (high to low) used in determining item overall rank.
Define Feature Criteria
1 Move to the window option on the toolbar and select the Define Feature Criteria worksheet.
Define Feature Criteria Worksheet
2 Review previously defined types of feature attributes.
3 Enter in the significant attribute features for each feature type.
Note: The significant attributes are for reference only. They play no role in determining item rank other than to remind you that they are important to the corporate strategy. It is the understanding that an item has none or more of the attribute types that is weighed in the ranking.
118 Retek Assort – Assortment and Space Optimization
4 Select Calculate to apply the data.
5 Select Save to retain the information.
6 Select File > Commit Now to commit all of the data in the Administrative workbook to the database.
What’s next All of the Administrative functions are now complete. In the following sections, the ability to name and map history to placeholder stores and items is covered.
Chapter 7 – Like Store 119
Chapter 7 – Like Store Occasionally, you may want to include new stores, not yet part of the organizational hierarchy, in the optimization routine. These placeholder stores may be identified using the Like Store workbook template. In order for a forecast to be generated, the Like Store workbook template also facilitates the mapping history from one store to another. Once identified and mapped to a like store, a new store may be included in the space and assortment optimization routines.
As with the other workbooks described in this document, the Like Store workbook must be created.
Create Like Store Workbook 1 On the Assort menu bar, select File > New or click New on the toolbar. The
New window is displayed.
New Workbook dialog for Assort
2 On the Assort tab, select Like Store and click OK. The Like Store Wizard is displayed. Using this wizard, you will select the pre-created placeholder store positions to name and map history.
Note: The stores available to map history from must also be chosen in this wizard step.
120 Retek Assort – Assortment and Space Optimization
The Like Store wizard has several buttons for navigating the wizard window.
Button Name Button Description
Cancel Exits the window without saving changes or entries.
Help Displays a list of help topics available in Assort.
<Back Returns to the previous wizard question or window.
>Next Accepts the entry and moves to the next question or window.
Finish Completes the wizard entries and builds the windows for the Like Store steps.
3 Select the pre-created placeholders and the existing stores to which they will be mapped.
Note: The selected already existing stores will appear in the pick list of stores available for mapping.
Define Placeholder and Existing Stores Wizard
4 Click Finish. The workbook build begins. (This process may take several minutes). Once completed, the workbook will open to the Define Like Stores worksheet.
Chapter 7 – Like Store 121
Toolbar buttons Now that a Like Store workbook has been created, Assort displays an expanded toolbar and a workflow tab for navigating through the like store processes.
Assort toolbar and Like Store workflow tab
The table below contains brief descriptions of the Assort toolbar buttons. For more detailed descriptions, see the Retek Predictive Application Server User Guide or online help.
Button Name Button Description
Previous Navigates to the previous step in the business process. Each distinct step is associated with a separate worksheet or set of worksheets. Clicking this toolbar button produces the same result as choosing View > Previous in Flow Control.
The steps in the business process are represented by the flow control tabs, which normally appear immediately beneath the application toolbar. To view the worksheet(s) associated with a particular step, you can simply click on the corresponding tab.
Next Navigates to the next step in the business process. Each distinct step is associated with a separate worksheet or set of worksheets. Clicking this toolbar button produces the same result as choosing View > Next in Flow Control.
The steps in the business process are represented by the flow control tabs, which normally appear immediately beneath the application toolbar. To view the worksheet(s) associated with a particular step, you can simply click on the corresponding tab.
New Activates the closing of the workbook process so that a new workbook may be opened.
Open Opens a list of saved workbooks for editing or viewing. Selections made will trigger the closing steps of the current workbook. Once closed, the selected workbook will automatically open.
Close Closes the currently opened workbook. There are a number of options for saving changes before closing.

122 Retek Assort – Assortment and Space Optimization
Button Name Button Description
Save Saves all information in the plan, including the current layout of windows within the steps. This has the same result as selecting File > Save or clicking Save on the toolbar.
Cut Copies selected worksheet data to an application clipboard and clears the data from the worksheet cells. Same action as choosing Edit > Cut. Only data from write able measures can be cut.
Copy Copies data at base level.
Paste Transfers data from the application clipboard to the cursor location. Multiple measure cut/copy in outline mode only supports read/write cells.
Toggle Display changes from grid view to graph (chart) view.
Format Allows you to customize the grid or chart view of assessment data.
Calculate Reads recent entries and applies the entries across all calculations.
Note: Assort calculates automatically when the active window is changed or when F9 is selected. In addition, deferred calculations can be undone by selecting Edit from the menu, then selecting Remove Last or Remove All Deferred Calculations.
Menu options The main menu options are described in detail in the online help accessible from the Help menu when running Assort, and in the Retek Predictive Application Server User Guide.
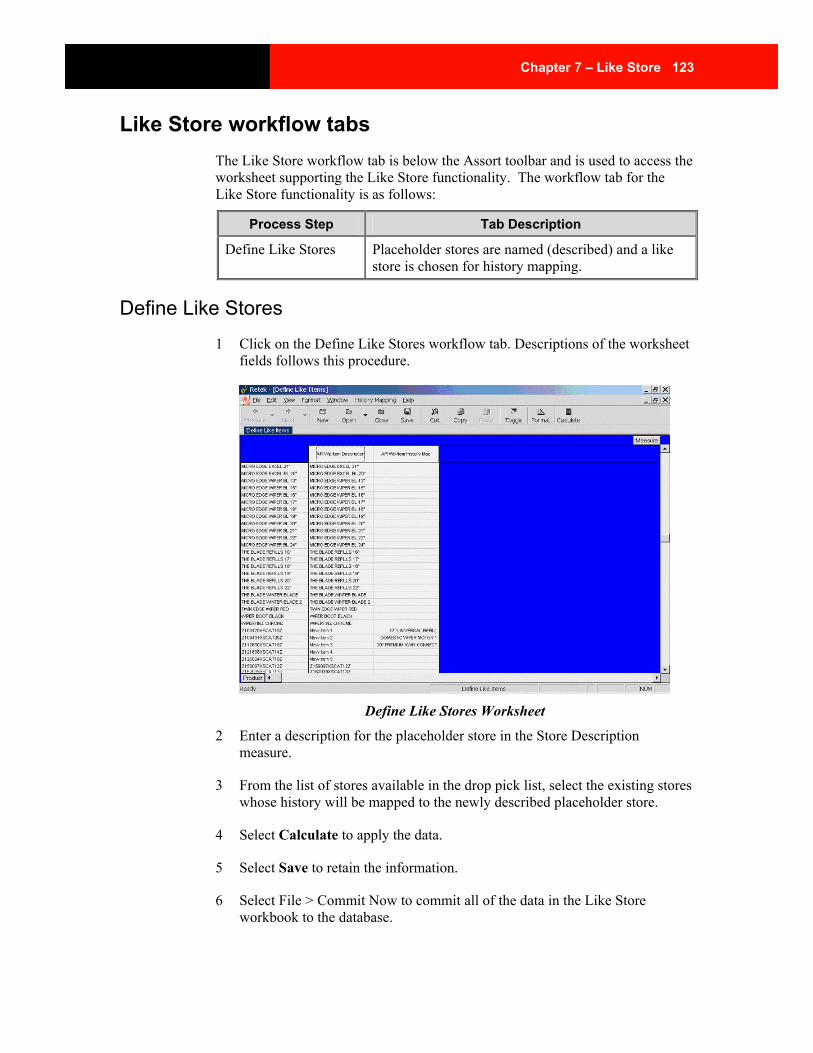
Chapter 7 – Like Store 123
Like Store workflow tabs The Like Store workflow tab is below the Assort toolbar and is used to access the worksheet supporting the Like Store functionality. The workflow tab for the Like Store functionality is as follows:
Process Step Tab Description
Define Like Stores Placeholder stores are named (described) and a like store is chosen for history mapping.
Define Like Stores 1 Click on the Define Like Stores workflow tab. Descriptions of the worksheet
fields follows this procedure.
Define Like Stores Worksheet
2 Enter a description for the placeholder store in the Store Description measure.
3 From the list of stores available in the drop pick list, select the existing stores whose history will be mapped to the newly described placeholder store.
4 Select Calculate to apply the data.
5 Select Save to retain the information.
6 Select File > Commit Now to commit all of the data in the Like Store workbook to the database.

124 Retek Assort – Assortment and Space Optimization
Key Field Descriptions – Define Like Stores
Field Label Field Description
Store Description Text field used for naming the placeholder stores.
Store History map Select list from which stores are chosen to map history.
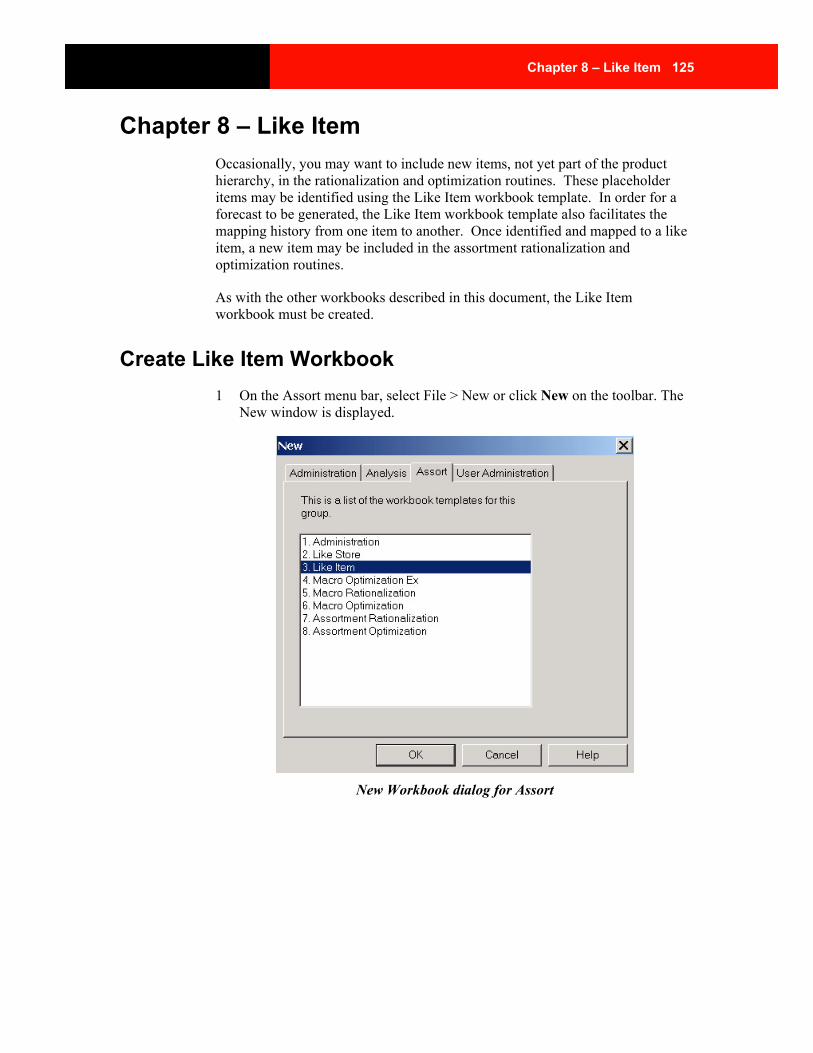
Chapter 8 – Like Item 125
Chapter 8 – Like Item Occasionally, you may want to include new items, not yet part of the product hierarchy, in the rationalization and optimization routines. These placeholder items may be identified using the Like Item workbook template. In order for a forecast to be generated, the Like Item workbook template also facilitates the mapping history from one item to another. Once identified and mapped to a like item, a new item may be included in the assortment rationalization and optimization routines.
As with the other workbooks described in this document, the Like Item workbook must be created.
Create Like Item Workbook 1 On the Assort menu bar, select File > New or click New on the toolbar. The
New window is displayed.
New Workbook dialog for Assort
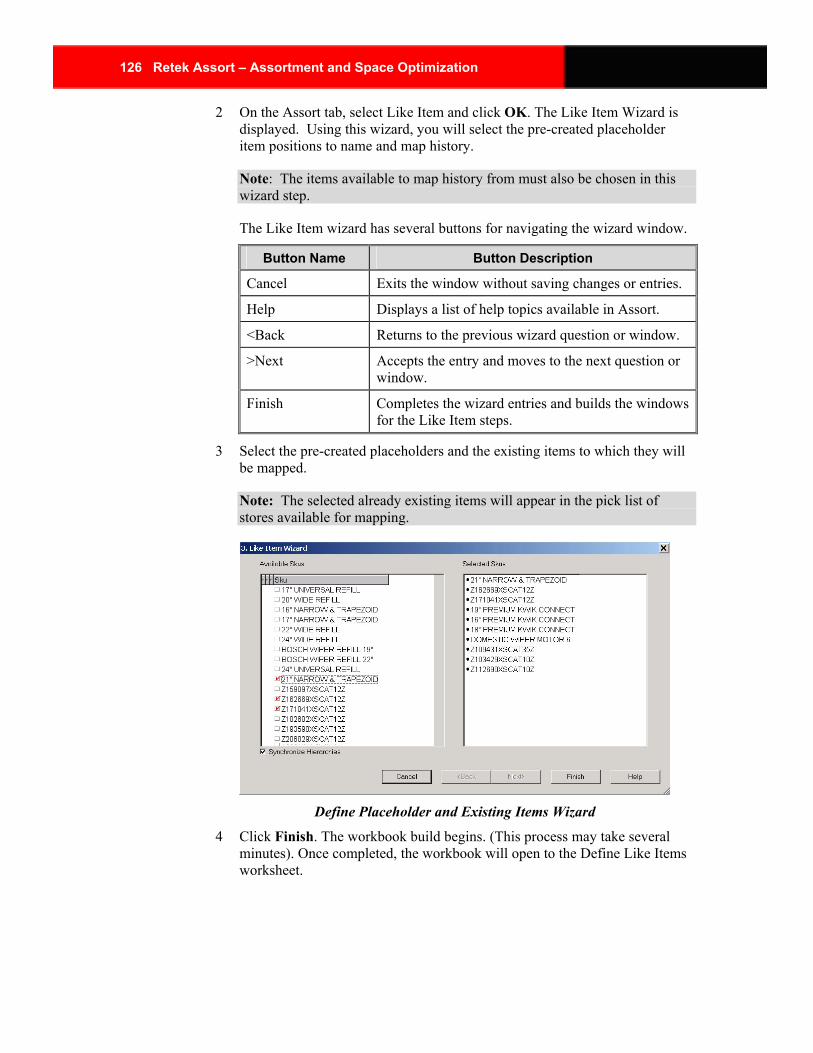
126 Retek Assort – Assortment and Space Optimization
2 On the Assort tab, select Like Item and click OK. The Like Item Wizard is displayed. Using this wizard, you will select the pre-created placeholder item positions to name and map history.
Note: The items available to map history from must also be chosen in this wizard step.
The Like Item wizard has several buttons for navigating the wizard window.
Button Name Button Description
Cancel Exits the window without saving changes or entries.
Help Displays a list of help topics available in Assort.
<Back Returns to the previous wizard question or window.
>Next Accepts the entry and moves to the next question or window.
Finish Completes the wizard entries and builds the windows for the Like Item steps.
3 Select the pre-created placeholders and the existing items to which they will be mapped.
Note: The selected already existing items will appear in the pick list of stores available for mapping.
Define Placeholder and Existing Items Wizard
4 Click Finish. The workbook build begins. (This process may take several minutes). Once completed, the workbook will open to the Define Like Items worksheet.
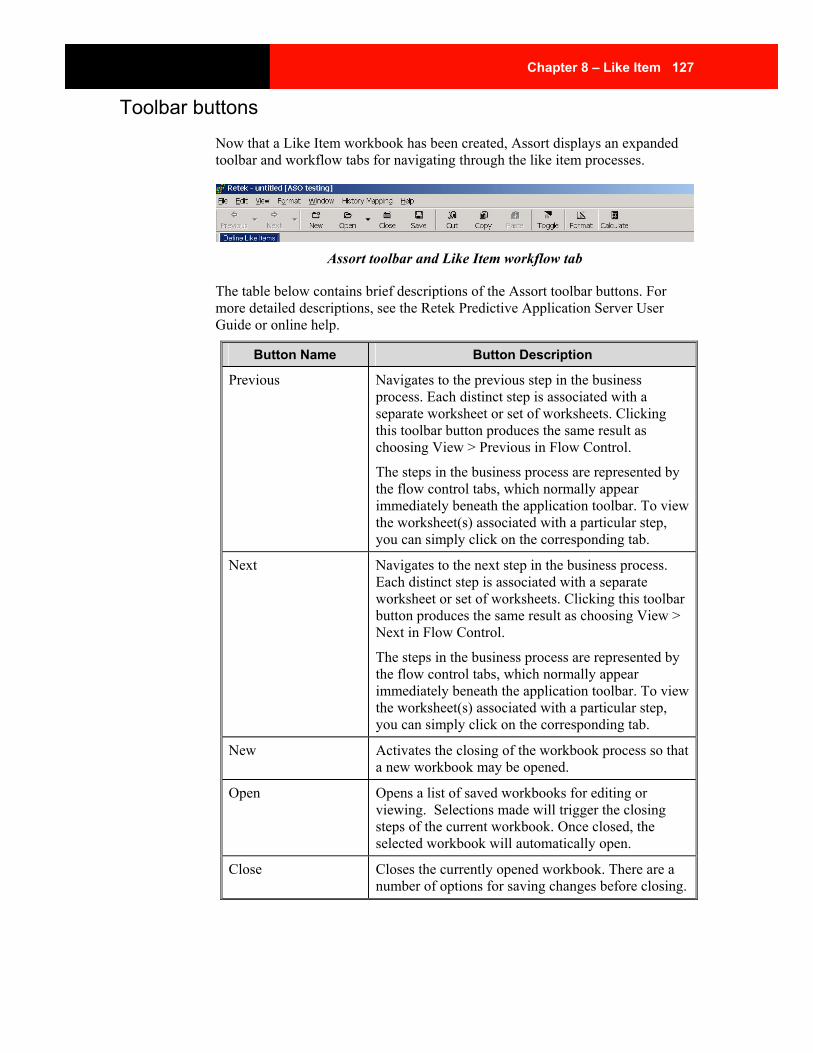
Chapter 8 – Like Item 127
Toolbar buttons Now that a Like Item workbook has been created, Assort displays an expanded toolbar and workflow tabs for navigating through the like item processes.
Assort toolbar and Like Item workflow tab
The table below contains brief descriptions of the Assort toolbar buttons. For more detailed descriptions, see the Retek Predictive Application Server User Guide or online help.
Button Name Button Description
Previous Navigates to the previous step in the business process. Each distinct step is associated with a separate worksheet or set of worksheets. Clicking this toolbar button produces the same result as choosing View > Previous in Flow Control.
The steps in the business process are represented by the flow control tabs, which normally appear immediately beneath the application toolbar. To view the worksheet(s) associated with a particular step, you can simply click on the corresponding tab.
Next Navigates to the next step in the business process. Each distinct step is associated with a separate worksheet or set of worksheets. Clicking this toolbar button produces the same result as choosing View > Next in Flow Control.
The steps in the business process are represented by the flow control tabs, which normally appear immediately beneath the application toolbar. To view the worksheet(s) associated with a particular step, you can simply click on the corresponding tab.
New Activates the closing of the workbook process so that a new workbook may be opened.
Open Opens a list of saved workbooks for editing or viewing. Selections made will trigger the closing steps of the current workbook. Once closed, the selected workbook will automatically open.
Close Closes the currently opened workbook. There are a number of options for saving changes before closing.

128 Retek Assort – Assortment and Space Optimization
Button Name Button Description
Save Saves all information in the plan, including the current layout of windows within the steps. This has the same result as selecting File > Save or clicking Save on the toolbar.
Cut Copies selected worksheet data to an application clipboard and clears the data from the worksheet cells. Same action as choosing Edit > Cut. Only data from write able measures can be cut.
Copy Copies data at base level.
Paste Transfers data from the application clipboard to the cursor location. Multiple measure cut/copy in outline mode only supports read/write cells.
Toggle Display changes from grid view to graph (chart) view.
Format Allows you to customize the grid or chart view of assessment data.
Calculate Reads recent entries and applies the entries across all calculations.
Note: Assort calculates automatically when the active window is changed or when F9 is selected. In addition, deferred calculations can be undone by selecting Edit from the menu, then selecting Remove Last or Remove All Deferred Calculations.
Menu options The main menu options are described in detail in the online help accessible from the Help menu when running Assort, and in the Retek Predictive Application Server User Guide.
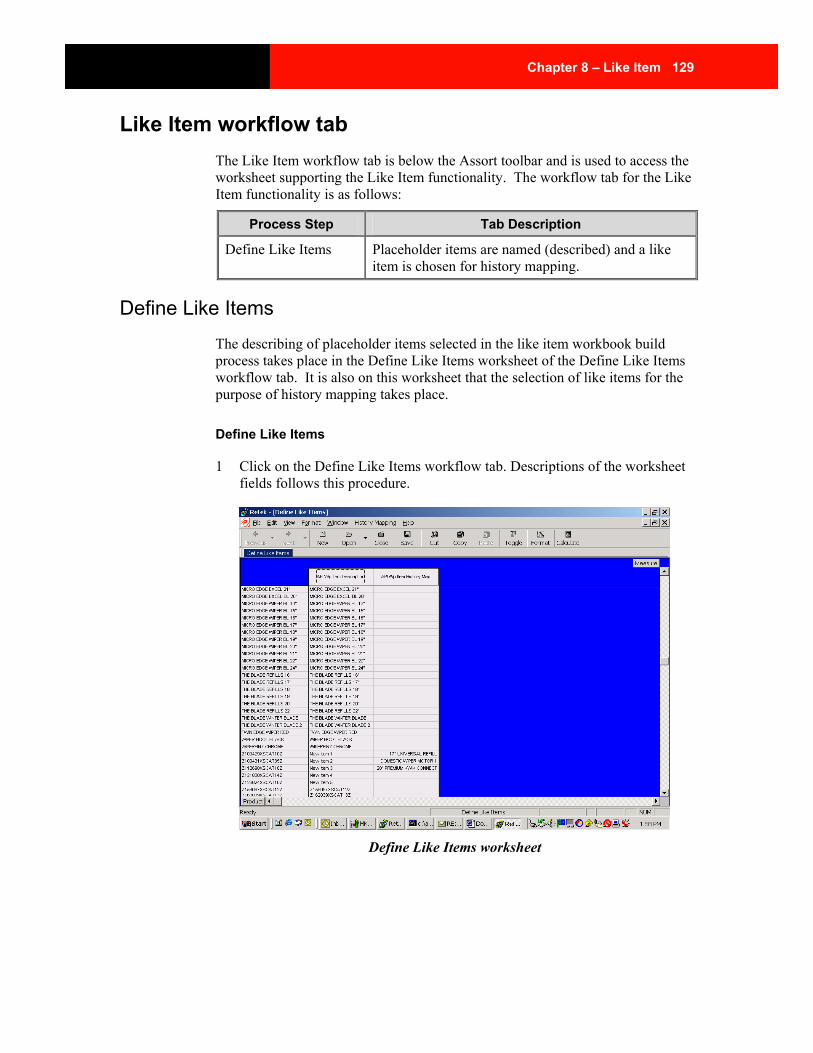
Chapter 8 – Like Item 129
Like Item workflow tab The Like Item workflow tab is below the Assort toolbar and is used to access the worksheet supporting the Like Item functionality. The workflow tab for the Like Item functionality is as follows:
Process Step Tab Description
Define Like Items Placeholder items are named (described) and a like item is chosen for history mapping.
Define Like Items The describing of placeholder items selected in the like item workbook build process takes place in the Define Like Items worksheet of the Define Like Items workflow tab. It is also on this worksheet that the selection of like items for the purpose of history mapping takes place.
Define Like Items
1 Click on the Define Like Items workflow tab. Descriptions of the worksheet fields follows this procedure.
Define Like Items worksheet
130 Retek Assort – Assortment and Space Optimization
2 Enter a description for the placeholder item in the Item Description measure.
3 From the list of items available in the drop pick list, select the existing items whose history will be mapped to the newly described placeholder item.
4 Select Calculate to apply the data.
5 Select Save to retain the information.
6 Select File > Commit Now to commit all of the data in the Like Item workbook to the database
Key Field Descriptions – Define Like Items
Field Label Field Description
Item Description Text measure used for naming the placeholder item.
Item History Map Pick list of items inside of the workbook from which may be chosen to map history.
Index 131
Index % Cont. Sales ................................65, 71, 73 Administration.........................................103
Assortment Rationalization........................116 Create the workbook..................................103 Macro and Assortment Optimization.........111 Macro Rationalization ...............................109 Phase Definition ........................................108
Assign Item Role and Type Worksheet.....77 Assign Role / Type Worksheet..................38 Assortment Optimization...........................81
Business process ............................................7 Create the workbook....................................81 Determine Optimal Space / Profit................89 Identify Placeholders ...................................88 Review Store Results...................................98
Assortment plan Deleting .......................................................18 Editing .........................................................17 Saving ..........................................................15
Assortment Rationalization .......................57 Administration ...........................................116 Brand Analysis ............................................64 Business process ............................................5 Create the workbook....................................57 Feature Analysis ..........................................68 Identify Placeholders ...................................63 Item Scorecard.............................................76 Net Margin Analysis....................................74 Performance Analysis ..................................72
Ave Inv ................................................71, 73 Ave. GM....................................................27 Avg Inv..........................................31, 35, 65 Avg. Spend ................................................27 Avg. Store Visit .........................................27 Brand Analysis ..........................................64 Brand Count ......................................29, 110 Brand Notes...............................................67 Brand Overall Weight ...............................77 Brand Rank (Brand) Worksheet ................65 Brand Rank (SKU) Worksheet ..................66 Brand Rank By Brand ...............................66 Brand Rank by SKU..................................67 Business process..........................................2
Assortment Optimization...............................7 Assortment Rationalization............................5 Macro Rationalization ...................................2 Macro Space Optimization ............................4
Cancel menu option...................................17 Carrying Costs...............................33, 37, 75 Category Analysis .....................................30
Category Role ................................39, 49, 54 Category Scorecard................................... 38 Category Tolerance................................... 91 Collection Constraints Worksheet ............ 92 Commit Now menu option ....................... 17 Competitive Intelligence........................... 28 Competitor Definition............................. 109 Competitor Notes...................................... 29 Constraint Type .................................. 47, 91 Consumer Analysis................................... 26 Consumer Notes ....................................... 27 Consumer Seg. Name ............................... 27 Cost of Funds.................................33, 37, 75 Current GM......................................... 49, 54 Current Space ..........................31, 35, 49, 54 Current Space c Prd ............................ 31, 35 Define Competitors Worksheet .............. 109 Define Feature Criteria Worksheet ......... 117 Define Like Items ................................... 129 Define Like Items worksheet.................. 129 Define Like Stores .................................. 123 Define Like Stores Worksheet................ 123 Define Phases Worksheet ....................... 108 Define Unit of Measure Worksheet .......... 89 Delete a plan ............................................. 18 Delete window.......................................... 18 Demand................31, 35, 65, 71, 73, 96, 101 Describe Placeholders Worksheet ...... 63, 88 Determine Optimal Space / Profit....... 46, 89 Display or edit a plan................................ 17 Expected Profit ................................... 50, 54 Facing Capacity ................................ 96, 101 Feature Analysis ....................................... 68 Feature Criteria ......................................... 69 Feature Notes............................................ 69 Feature Overall Weight ............................ 77 Feature Rank............................................. 69 Feature Rank Worksheet .......................... 69 Feature Threshold ................................... 117 Feature Weight ......................................... 69 Feature Weight Worksheet ....................... 68 File menu .................................................. 14 Freight............................................33, 37, 75 GM29, 31, 33, 35, 37, 50, 54, 65, 71, 73, 75,
96, 101 GMROI..............................31, 35, 65, 71, 73 Histogram Cost ................................... 50, 97 Histogram Profit R.............................. 50, 97
132 Retek Assort – Assortment and Space Optimization
Identify Placeholders ...........................63, 88 Ignore Changes menu option.....................17 Include checkbox...................49, 54, 95, 101 Include Collection .....................................92 Industry Trend ...................................29, 110 Item Cost ...........................................96, 101 Item Depth.........................................96, 101 Item Description ..........................63, 88, 130 Item Facings ......................................96, 101 Item Height........................................96, 101 Item History Map ....................................130 Item Presentation Standard................96, 101 Item Retail .........................................96, 101 Item Role .....................................78, 95, 101 Item Scorecard...........................................76 Item UOM .................................................90 Item Width.........................................96, 101 Keep checkbox ..........39, 49, 54, 78, 95, 101 Lead Time..........................................96, 101 Like Item .................................................125
Create the workbook..................................125 Define Like Items ......................................129
Like Store ................................................119 Create the workbook..................................119 Define Like Stores .....................................123
List All Workbooks check box..................16 Macro and Assortment Optimization ......111 Macro Rationalization ...............................19
Administration worksheets ........................109 Business process ............................................2 Category Analysis........................................30 Category Scorecard......................................38 Competitive Intelligence..............................28 Consumer Analysis......................................26 Create the workbook....................................19 Net Margin Analysis....................................32 Vendor Analysis ..........................................34 Vendor Net Margin Analysis.......................36
Macro Space Optimization ........................41 Business process ............................................4 Create the workbook....................................41 Determine Optimal Space / Profit................46 Review Store Results...................................51
Main menu.................................................14 Mandatory Category......................39, 49, 54 Mandatory Collection................................92 Mandatory Item ...........................78, 96, 101 Markdown .....................................33, 37, 75 Markdown Allowance ...................33, 37, 75 Market Share Information Worksheet .....110 Max. Facings .....................................96, 101 Max. Space ..........................................49, 54
Maximum Capacity .................................. 47 Measures................................................... 11 Metrics ...................................................... 12 Min. Facings ..................................... 96, 101 Min. Presence ................................... 96, 101 Min. Space .......................................... 49, 54 MS Ave Inv ............................................ 110 MS Avg Inv .............................................. 29 MS GM............................................. 29, 110 MS GMROI .............................................. 29 MS NM............................................. 29, 110 MS Sales ........................................... 29, 110 MS Sales c Prd.......................................... 29 MS Sales per item..................................... 29 MS Sales R var LY................................... 29 MS Sales U var Ly.................................... 29 MS SKU Count................................. 29, 110 MS TO ...................................................... 29 Net Margin Analysis........................... 32, 74 NM...................31, 33, 35, 37, 65, 71, 73, 75 NM Notes ........................................... 33, 75 Number Of Shelves .................................. 91 Operating Hours ..................................... 113 Optimal Space and Profit Worksheet . 47, 93 Optimization Constraints Worksheet.. 46, 90 Optimize checkbox ............47, 51, 91, 93, 98 Optimize Worksheet ......................51, 93, 98 Overall Rank............................................. 78 Overall Rank Worksheet .......................... 76 Overall Threshold ................................... 117 Overall Weight ......................................... 78 Payment Terms ..............................33, 37, 75 Performance Analysis............................... 72 Performance Notes ........................31, 35, 73 Performance Overall Weight .................... 77 Performance Rank .................................... 73 Performance Threshold........................... 117 Phase Definition ..................................... 108 Phase Description ................................... 108 Plan Information window ................... 30, 32 Planogram Properties (Ex) Worksheet ... 113 Planogram Properties Worksheet ........... 114 POG Length............................................ 115 POG Length (Dept.) ............................... 114 POG Options............................................. 91 POG Profit .............................................. 115 POG Profit (Dept.).................................. 114 POG UOM................................................ 90 Promo Sales ...................................33, 37, 75 Recommended Space.......................... 50, 54 Retn. on Curr. Space........................... 31, 35
Index 133
Retn. on Space.....................................31, 35 Review / Rank Brand Performance
Worksheet .............................................64 Review / Rank Item Features Worksheet ..70 Review / Rank Item Performance Worksheet
...............................................................72 Review Category Performance Worksheet30 Review Competitive Data Worksheet .......28 Review Consumer Data Worksheet...........26 Review Net Margin Components by Item
Worksheet .............................................74 Review Net Margin Components by Vendor
Worksheet .............................................36 Review Net Margin Components Worksheet
...............................................................32 Review Store Results...........................51, 98 Review Store Results Worksheet ........52, 99 Review Vendor Performance Worksheet ..34 Roles..........................................................11 Sales ..31, 33, 35, 37, 65, 71, 73, 75, 96, 101 Sales Ar .............................................96, 101 Sales c. Prd ..........................................31, 35 Sales var Ly ...................................65, 71, 73 Save and Commit Later menu option........17 Save and Commit Now menu option.........17 Save As dialog...........................................15 Save menu option ......................................17 Save the plan information..........................15 Scorecard Notes...................................39, 78 Send Data ..............................50, 54, 96, 102 Space .......................................31, 35, 50, 54 Space c. Prd .........................................31, 35 Space Chg............................................50, 54
Space to Profit Relationship Worksheet .. 50, 97
Spend ........................................................ 27 Step Size ................................................... 91 Step Size UOM......................................... 90 Stock Clerk Cycle Time ......................... 112 Stock Clerk Success Rate ....................... 112 Store Description .................................... 124 Store History map................................... 124 Store Operating Hours Worksheet.......... 112 Store Optimization Parameters Worksheet
............................................................ 111 Store Visits / Yr ........................................ 27 Subcategory Tolerance ............................. 91 Threshold Definition Worksheet ............ 116 TO......................................31, 35, 65, 71, 73 Tolerance UOM........................................ 90 Toolbar.............23, 44, 60, 84, 105, 121, 127 Units of measure....................................... 12 Vendor Analysis ....................................... 34 Vendor Net Margin Analysis.................... 36 Versions .................................................... 11 Vndr NM Notes ........................................ 37 Vndr Rev Allow.............................33, 37, 75 Workflow tabs
Administration .......................................... 107 Assortment Optimization ............................ 87 Assortment Rationalization......................... 62 Like Item................................................... 129 Like Store.................................................. 123 Macro Rationalization................................. 25 Macro Space Optimization ......................... 46