retail market power samples... · gafo general merchandise stores (naics 452) 218,490,881...
TRANSCRIPT
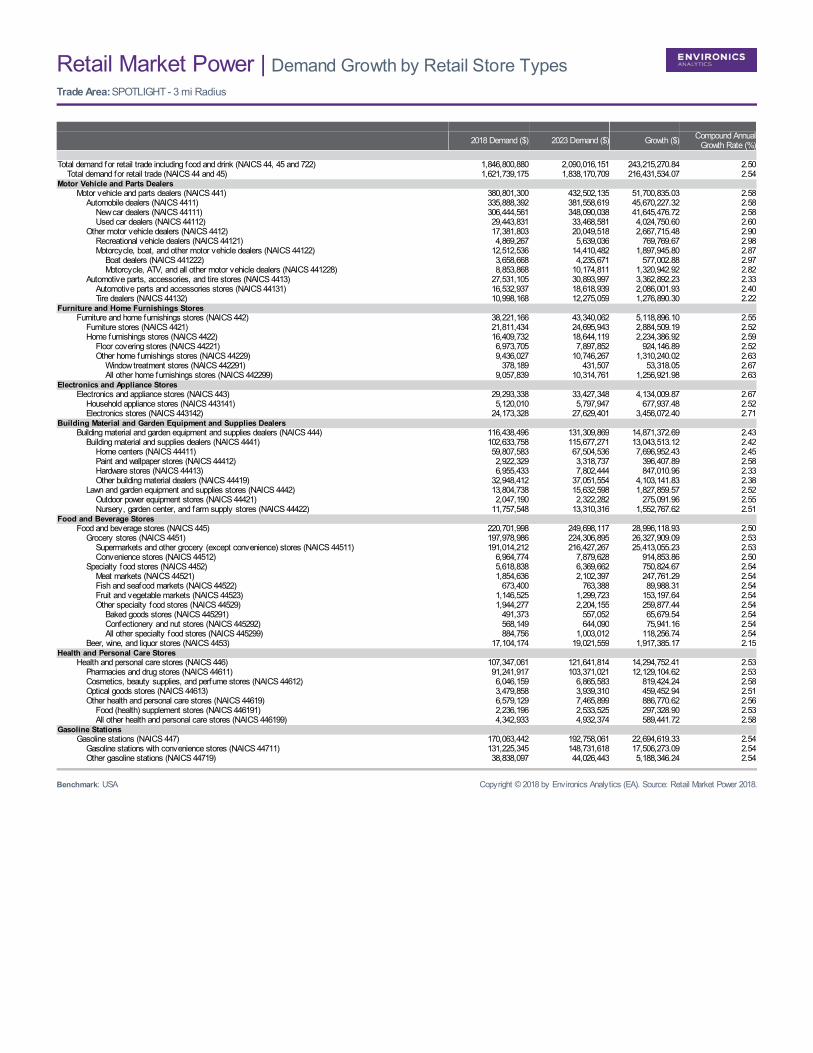
Retail Market Power | Demand Growth by Retail Store TypesTrade Area: SPOTLIGHT - 3 mi Radius
2018 Demand ($) 2023 Demand ($) Growth ($) Compound AnnualGrowth Rate (%)
Total demand for retail trade including food and drink (NAICS 44, 45 and 722) 1,846,800,880 2,090,016,151 243,215,270.84 2.50 Total demand for retail trade (NAICS 44 and 45) 1,621,739,175 1,838,170,709 216,431,534.07 2.54Motor Vehicle and Parts Dealers Motor vehicle and parts dealers (NAICS 441) 380,801,300 432,502,135 51,700,835.03 2.58 Automobile dealers (NAICS 4411) 335,888,392 381,558,619 45,670,227.32 2.58 New car dealers (NAICS 44111) 306,444,561 348,090,038 41,645,476.72 2.58 Used car dealers (NAICS 44112) 29,443,831 33,468,581 4,024,750.60 2.60 Other motor vehicle dealers (NAICS 4412) 17,381,803 20,049,518 2,667,715.48 2.90 Recreational vehicle dealers (NAICS 44121) 4,869,267 5,639,036 769,769.67 2.98 Motorcycle, boat, and other motor vehicle dealers (NAICS 44122) 12,512,536 14,410,482 1,897,945.80 2.87 Boat dealers (NAICS 441222) 3,658,668 4,235,671 577,002.88 2.97 Motorcycle, ATV, and all other motor vehicle dealers (NAICS 441228) 8,853,868 10,174,811 1,320,942.92 2.82 Automotive parts, accessories, and tire stores (NAICS 4413) 27,531,105 30,893,997 3,362,892.23 2.33 Automotive parts and accessories stores (NAICS 44131) 16,532,937 18,618,939 2,086,001.93 2.40 Tire dealers (NAICS 44132) 10,998,168 12,275,059 1,276,890.30 2.22Furniture and Home Furnishings Stores Furniture and home furnishings stores (NAICS 442) 38,221,166 43,340,062 5,118,896.10 2.55 Furniture stores (NAICS 4421) 21,811,434 24,695,943 2,884,509.19 2.52 Home furnishings stores (NAICS 4422) 16,409,732 18,644,119 2,234,386.92 2.59 Floor covering stores (NAICS 44221) 6,973,705 7,897,852 924,146.89 2.52 Other home furnishings stores (NAICS 44229) 9,436,027 10,746,267 1,310,240.02 2.63 Window treatment stores (NAICS 442291) 378,189 431,507 53,318.05 2.67 All other home furnishings stores (NAICS 442299) 9,057,839 10,314,761 1,256,921.98 2.63Electronics and Appliance Stores Electronics and appliance stores (NAICS 443) 29,293,338 33,427,348 4,134,009.87 2.67 Household appliance stores (NAICS 443141) 5,120,010 5,797,947 677,937.48 2.52 Electronics stores (NAICS 443142) 24,173,328 27,629,401 3,456,072.40 2.71Building Material and Garden Equipment and Supplies Dealers Building material and garden equipment and supplies dealers (NAICS 444) 116,438,496 131,309,869 14,871,372.69 2.43 Building material and supplies dealers (NAICS 4441) 102,633,758 115,677,271 13,043,513.12 2.42 Home centers (NAICS 44411) 59,807,583 67,504,536 7,696,952.43 2.45 Paint and wallpaper stores (NAICS 44412) 2,922,329 3,318,737 396,407.89 2.58 Hardware stores (NAICS 44413) 6,955,433 7,802,444 847,010.96 2.33 Other building material dealers (NAICS 44419) 32,948,412 37,051,554 4,103,141.83 2.38 Lawn and garden equipment and supplies stores (NAICS 4442) 13,804,738 15,632,598 1,827,859.57 2.52 Outdoor power equipment stores (NAICS 44421) 2,047,190 2,322,282 275,091.96 2.55 Nursery, garden center, and farm supply stores (NAICS 44422) 11,757,548 13,310,316 1,552,767.62 2.51Food and Beverage Stores Food and beverage stores (NAICS 445) 220,701,998 249,698,117 28,996,118.93 2.50 Grocery stores (NAICS 4451) 197,978,986 224,306,895 26,327,909.09 2.53 Supermarkets and other grocery (except convenience) stores (NAICS 44511) 191,014,212 216,427,267 25,413,055.23 2.53 Convenience stores (NAICS 44512) 6,964,774 7,879,628 914,853.86 2.50 Specialty food stores (NAICS 4452) 5,618,838 6,369,662 750,824.67 2.54 Meat markets (NAICS 44521) 1,854,636 2,102,397 247,761.29 2.54 Fish and seafood markets (NAICS 44522) 673,400 763,388 89,988.31 2.54 Fruit and vegetable markets (NAICS 44523) 1,146,525 1,299,723 153,197.64 2.54 Other specialty food stores (NAICS 44529) 1,944,277 2,204,155 259,877.44 2.54 Baked goods stores (NAICS 445291) 491,373 557,052 65,679.54 2.54 Confectionery and nut stores (NAICS 445292) 568,149 644,090 75,941.16 2.54 All other specialty food stores (NAICS 445299) 884,756 1,003,012 118,256.74 2.54 Beer, wine, and liquor stores (NAICS 4453) 17,104,174 19,021,559 1,917,385.17 2.15Health and Personal Care Stores Health and personal care stores (NAICS 446) 107,347,061 121,641,814 14,294,752.41 2.53 Pharmacies and drug stores (NAICS 44611) 91,241,917 103,371,021 12,129,104.62 2.53 Cosmetics, beauty supplies, and perfume stores (NAICS 44612) 6,046,159 6,865,583 819,424.24 2.58 Optical goods stores (NAICS 44613) 3,479,858 3,939,310 459,452.94 2.51 Other health and personal care stores (NAICS 44619) 6,579,129 7,465,899 886,770.62 2.56 Food (health) supplement stores (NAICS 446191) 2,236,196 2,533,525 297,328.90 2.53 All other health and personal care stores (NAICS 446199) 4,342,933 4,932,374 589,441.72 2.58Gasoline Stations Gasoline stations (NAICS 447) 170,063,442 192,758,061 22,694,619.33 2.54 Gasoline stations with convenience stores (NAICS 44711) 131,225,345 148,731,618 17,506,273.09 2.54 Other gasoline stations (NAICS 44719) 38,838,097 44,026,443 5,188,346.24 2.54
Benchmark: USA Copyright © 2018 by Environics Analytics (EA). Source: Retail Market Power 2018.
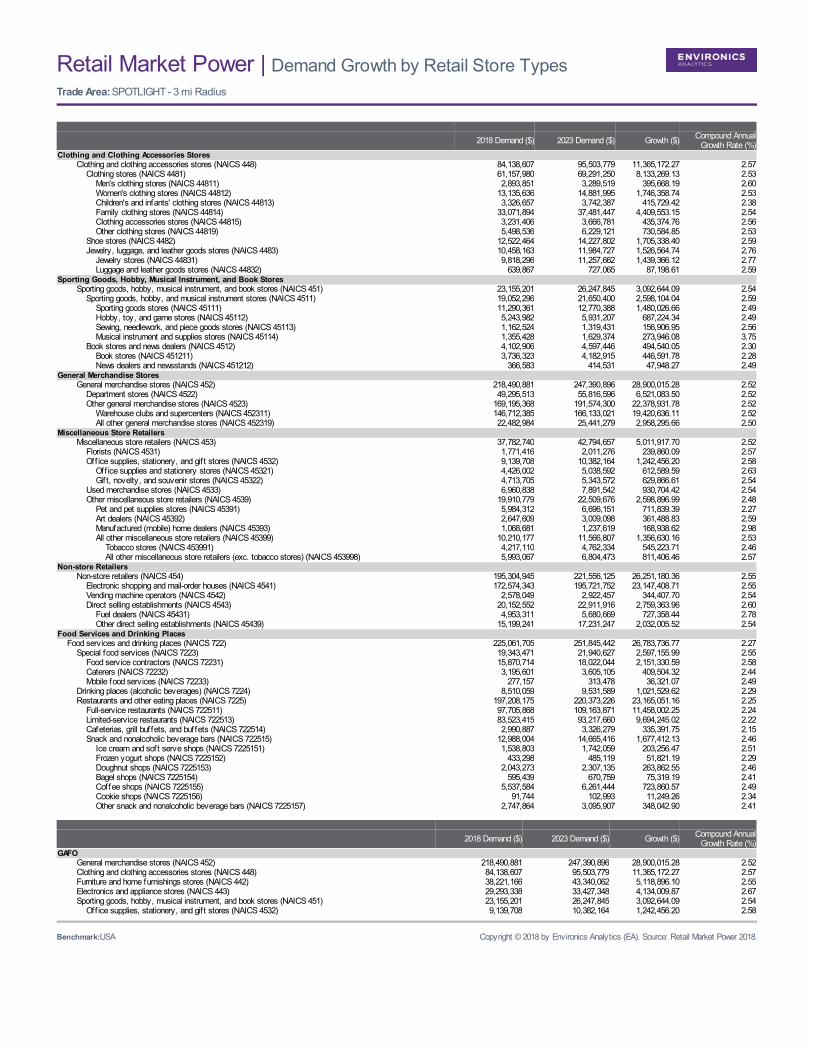
Retail Market Power | Demand Growth by Retail Store TypesTrade Area: SPOTLIGHT - 3 mi Radius
2018 Demand ($) 2023 Demand ($) Growth ($) Compound AnnualGrowth Rate (%)
Clothing and Clothing Accessories Stores Clothing and clothing accessories stores (NAICS 448) 84,138,607 95,503,779 11,365,172.27 2.57 Clothing stores (NAICS 4481) 61,157,980 69,291,250 8,133,269.13 2.53 Men's clothing stores (NAICS 44811) 2,893,851 3,289,519 395,668.19 2.60 Women's clothing stores (NAICS 44812) 13,135,636 14,881,995 1,746,358.74 2.53 Children's and infants' clothing stores (NAICS 44813) 3,326,657 3,742,387 415,729.42 2.38 Family clothing stores (NAICS 44814) 33,071,894 37,481,447 4,409,553.15 2.54 Clothing accessories stores (NAICS 44815) 3,231,406 3,666,781 435,374.76 2.56 Other clothing stores (NAICS 44819) 5,498,536 6,229,121 730,584.85 2.53 Shoe stores (NAICS 4482) 12,522,464 14,227,802 1,705,338.40 2.59 Jewelry, luggage, and leather goods stores (NAICS 4483) 10,458,163 11,984,727 1,526,564.74 2.76 Jewelry stores (NAICS 44831) 9,818,296 11,257,662 1,439,366.12 2.77 Luggage and leather goods stores (NAICS 44832) 639,867 727,065 87,198.61 2.59Sporting Goods, Hobby, Musical Instrument, and Book Stores Sporting goods, hobby, musical instrument, and book stores (NAICS 451) 23,155,201 26,247,845 3,092,644.09 2.54 Sporting goods, hobby, and musical instrument stores (NAICS 4511) 19,052,296 21,650,400 2,598,104.04 2.59 Sporting goods stores (NAICS 45111) 11,290,361 12,770,388 1,480,026.66 2.49 Hobby, toy, and game stores (NAICS 45112) 5,243,982 5,931,207 687,224.34 2.49 Sewing, needlework, and piece goods stores (NAICS 45113) 1,162,524 1,319,431 156,906.95 2.56 Musical instrument and supplies stores (NAICS 45114) 1,355,428 1,629,374 273,946.08 3.75 Book stores and news dealers (NAICS 4512) 4,102,906 4,597,446 494,540.05 2.30 Book stores (NAICS 451211) 3,736,323 4,182,915 446,591.78 2.28 News dealers and newsstands (NAICS 451212) 366,583 414,531 47,948.27 2.49General Merchandise Stores General merchandise stores (NAICS 452) 218,490,881 247,390,896 28,900,015.28 2.52 Department stores (NAICS 4522) 49,295,513 55,816,596 6,521,083.50 2.52 Other general merchandise stores (NAICS 4523) 169,195,368 191,574,300 22,378,931.78 2.52 Warehouse clubs and supercenters (NAICS 452311) 146,712,385 166,133,021 19,420,636.11 2.52 All other general merchandise stores (NAICS 452319) 22,482,984 25,441,279 2,958,295.66 2.50Miscellaneous Store Retailers Miscellaneous store retailers (NAICS 453) 37,782,740 42,794,657 5,011,917.70 2.52 Florists (NAICS 4531) 1,771,416 2,011,276 239,860.09 2.57 Off ice supplies, stationery, and gif t stores (NAICS 4532) 9,139,708 10,382,164 1,242,456.20 2.58 Off ice supplies and stationery stores (NAICS 45321) 4,426,002 5,038,592 612,589.59 2.63 Gif t, novelty, and souvenir stores (NAICS 45322) 4,713,705 5,343,572 629,866.61 2.54 Used merchandise stores (NAICS 4533) 6,960,838 7,891,542 930,704.42 2.54 Other miscellaneous store retailers (NAICS 4539) 19,910,779 22,509,676 2,598,896.99 2.48 Pet and pet supplies stores (NAICS 45391) 5,984,312 6,696,151 711,839.39 2.27 Art dealers (NAICS 45392) 2,647,609 3,009,098 361,488.83 2.59 Manufactured (mobile) home dealers (NAICS 45393) 1,068,681 1,237,619 168,938.62 2.98 All other miscellaneous store retailers (NAICS 45399) 10,210,177 11,566,807 1,356,630.16 2.53 Tobacco stores (NAICS 453991) 4,217,110 4,762,334 545,223.71 2.46 All other miscellaneous store retailers (exc. tobacco stores) (NAICS 453998) 5,993,067 6,804,473 811,406.46 2.57Non-store Retailers Non-store retailers (NAICS 454) 195,304,945 221,556,125 26,251,180.36 2.55 Electronic shopping and mail-order houses (NAICS 4541) 172,574,343 195,721,752 23,147,408.71 2.55 Vending machine operators (NAICS 4542) 2,578,049 2,922,457 344,407.70 2.54 Direct selling establishments (NAICS 4543) 20,152,552 22,911,916 2,759,363.96 2.60 Fuel dealers (NAICS 45431) 4,953,311 5,680,669 727,358.44 2.78 Other direct selling establishments (NAICS 45439) 15,199,241 17,231,247 2,032,005.52 2.54Food Services and Drinking Places Food services and drinking places (NAICS 722) 225,061,705 251,845,442 26,783,736.77 2.27 Special food services (NAICS 7223) 19,343,471 21,940,627 2,597,155.99 2.55 Food service contractors (NAICS 72231) 15,870,714 18,022,044 2,151,330.59 2.58 Caterers (NAICS 72232) 3,195,601 3,605,105 409,504.32 2.44 Mobile food services (NAICS 72233) 277,157 313,478 36,321.07 2.49 Drinking places (alcoholic beverages) (NAICS 7224) 8,510,059 9,531,589 1,021,529.62 2.29 Restaurants and other eating places (NAICS 7225) 197,208,175 220,373,226 23,165,051.16 2.25 Full-service restaurants (NAICS 722511) 97,705,868 109,163,871 11,458,002.25 2.24 Limited-service restaurants (NAICS 722513) 83,523,415 93,217,660 9,694,245.02 2.22 Cafeterias, grill buffets, and buffets (NAICS 722514) 2,990,887 3,326,279 335,391.75 2.15 Snack and nonalcoholic beverage bars (NAICS 722515) 12,988,004 14,665,416 1,677,412.13 2.46 Ice cream and soft serve shops (NAICS 7225151) 1,538,803 1,742,059 203,256.47 2.51 Frozen yogurt shops (NAICS 7225152) 433,298 485,119 51,821.19 2.29 Doughnut shops (NAICS 7225153) 2,043,273 2,307,135 263,862.55 2.46 Bagel shops (NAICS 7225154) 595,439 670,759 75,319.19 2.41 Coffee shops (NAICS 7225155) 5,537,584 6,261,444 723,860.57 2.49 Cookie shops (NAICS 7225156) 91,744 102,993 11,249.26 2.34 Other snack and nonalcoholic beverage bars (NAICS 7225157) 2,747,864 3,095,907 348,042.90 2.41
2018 Demand ($) 2023 Demand ($) Growth ($) Compound AnnualGrowth Rate (%)
GAFO General merchandise stores (NAICS 452) 218,490,881 247,390,896 28,900,015.28 2.52 Clothing and clothing accessories stores (NAICS 448) 84,138,607 95,503,779 11,365,172.27 2.57 Furniture and home furnishings stores (NAICS 442) 38,221,166 43,340,062 5,118,896.10 2.55 Electronics and appliance stores (NAICS 443) 29,293,338 33,427,348 4,134,009.87 2.67 Sporting goods, hobby, musical instrument, and book stores (NAICS 451) 23,155,201 26,247,845 3,092,644.09 2.54 Off ice supplies, stationery, and gif t stores (NAICS 4532) 9,139,708 10,382,164 1,242,456.20 2.58
Benchmark:USA Copyright © 2018 by Environics Analytics (EA). Source: Retail Market Power 2018.
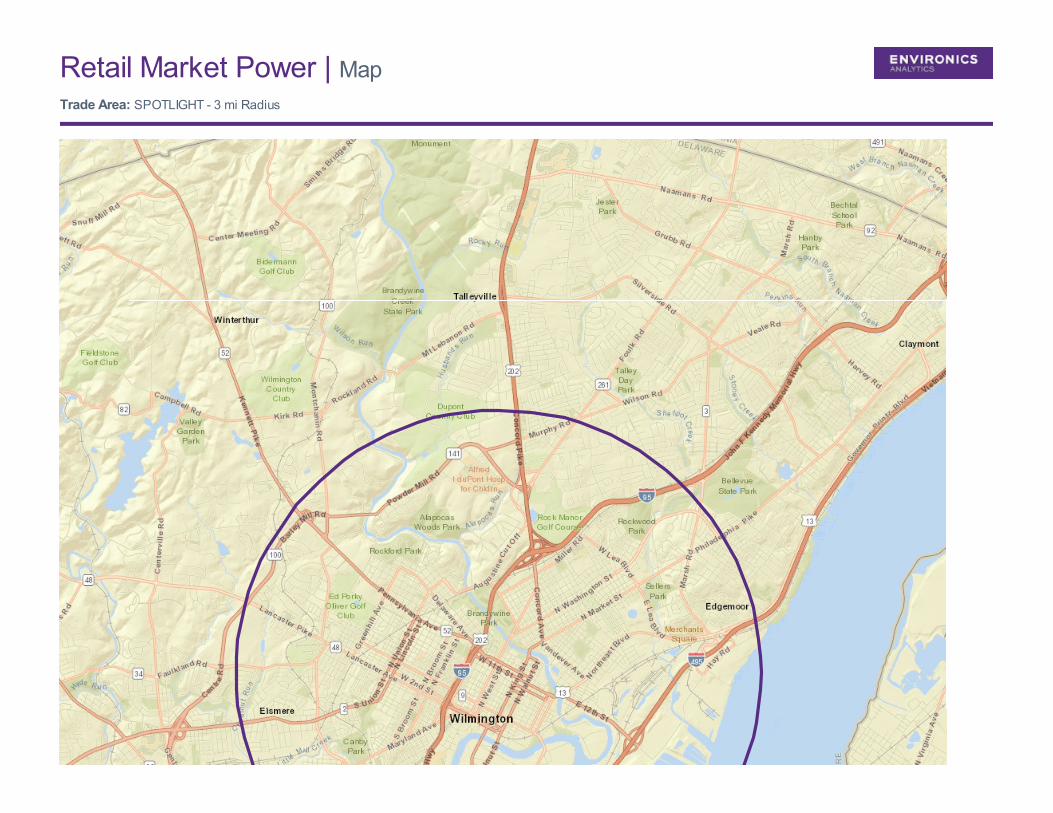
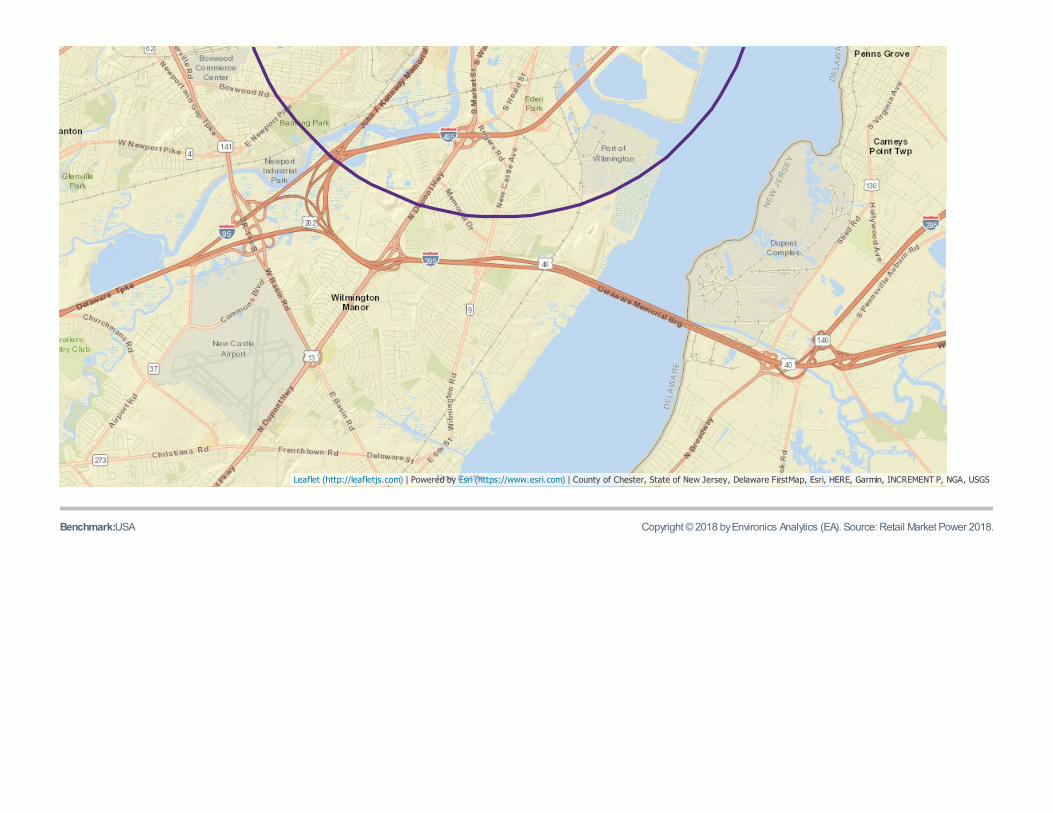
Retail Market Power | MapTrade Area: SPOTLIGHT - 3 mi Radius
Benchmark:USA Copyright © 2018 by Environics Analytics (EA). Source: Retail Market Power 2018.
Leaflet (http://leafletjs.com) | Powered by Esri (https://www.esri.com) | County of Chester, State of New Jersey, Delaware FirstMap, Esri, HERE, Garmin, INCREMENT P, NGA, USGS
Report Details
Name: Retail Market Power - Demand Growth by Retail Store Types 2018Date / Time: 5/22/2018 12:56:48 PMDataVintage: 2018 Trade Area
Name Level Geographies
SPOTLIGHT - 3 mi Radius 3 mi Radius N/A
Benchmark:
Name Level Geographies
USA Entire US United States
DataSource:
Name Copyright
Retail Market Power - 2018 - Current Year Estimate Environics Analytics: Retail Market Power 2018
Retail Market Power - 2023 - Five Year Projection Environics Analytics: Retail Market Power 2018
SPOTLIGHT Retail Market Power - GROW And CAGR Environics Analytics: Retail Market Power 2018
Copyright © 2018 by Environics Analytics (EA). Source: Retail Market Power 2018.