results presentation - commbank · pdf fileresults presentation ... australian government debt...
TRANSCRIPT
Commonwealth Bank of Australia ACN 123 123 124
Results PresentationFor the half year ended 31 December 2009
10 February 2010
Australian Covered Bonds PrimerDETERMINED TO BE BETTER THAN WE’VE EVER BEEN.
September 2011 | COMMONWEALTH BANK OF AUSTRALIA | CAN 123 123 124
2
Disclaimer
Disclaimer
This presentation is confidential and is not intended to be used by anyone other than you. The information does not take into account your investment objectives, financial situation or particular needs. Nothing contained in the information constitutes tax, accounting, legal, financial product or investment advice or a recommendation.
This presentation is not an offer to sell, or the solicitation of an offer to buy, any securities in any jurisdiction to any person to whom it is unlawful to make such an offer or solicitation in such jurisdiction. Neither Commonwealth Bank nor any of its affiliates, nor any of their directors, employees or agents accepts any liability for any loss or damage arising out of the use of all or any part of this presentation. Commonwealth Bank makes no representation or warranty, express or implied as to, and assumes no responsibility or liability for, the accuracy or completeness of, or any errors or omissions in, any information contained herein or in any accompanying material.

3
Australian Covered Bonds
Previously not allowed in AustraliaBanking Act 1959 provides that depositors rank above other claims on the bankNo deposit insurance scheme in Australia prior to 2008 Financial Claims Scheme (FCS)
Draft legislation released in March 2011Final legislation expected to be passed in late 2011Issuance only allowed under the legislative frameworkApproved Deposit-taking Institution (ADI) (i.e. APRA regulated bank) will be the covered bond issuerSegregation of cover assets will be achieved via a special purpose vehicle (SPV)Legislation will provide legal certainty for the segregation of the cover pool in bankruptcyAPRA will have prudential supervision responsibilities for CB issuersLimits on issuance and certain minimum standards and requirements for issuers and their programsIndependent cover pool monitor requiredExpect monthly testing and reportingProposed maximum issuance cap of 8% of ADI Australian assets
for CBA implies covered bond programme cap of ~$30-35bn based on current balance sheetFirst issuance expected early 2012
4
Australian Covered Bonds
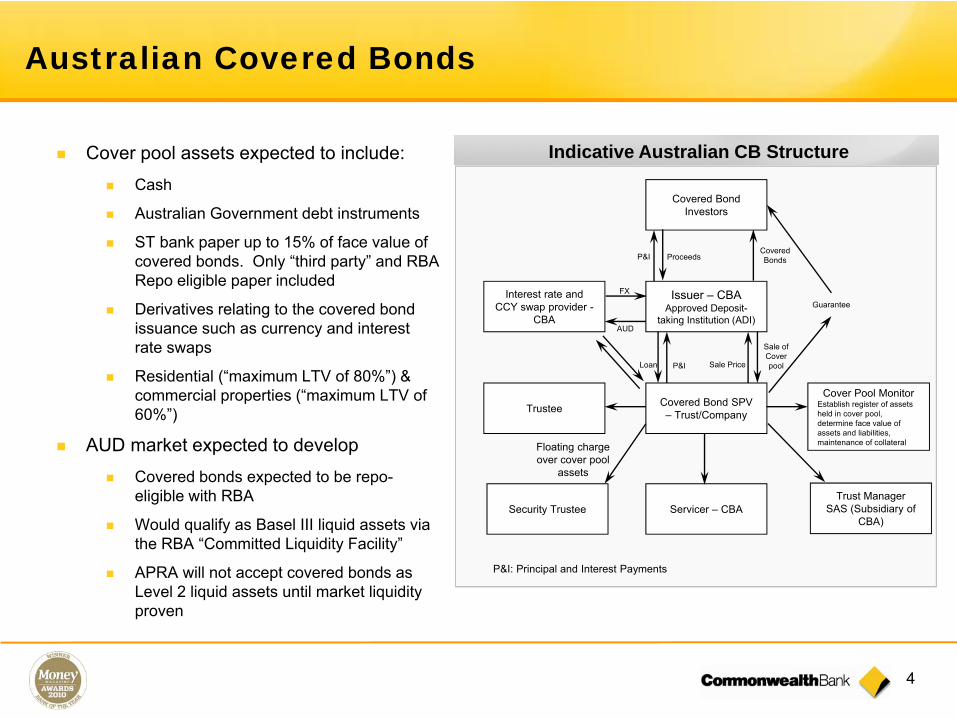
Cover pool assets expected to include:Cash
Australian Government debt instruments
ST bank paper up to 15% of face value of covered bonds. Only “third party” and RBA Repo eligible paper included
Derivatives relating to the covered bond issuance such as currency and interest rate swaps
Residential (“maximum LTV of 80%”) & commercial properties (“maximum LTV of 60%”)
AUD market expected to developCovered bonds expected to be repo-eligible with RBA
Would qualify as Basel III liquid assets via the RBA “Committed Liquidity Facility”
APRA will not accept covered bonds as Level 2 liquid assets until market liquidity proven
Indicative Australian CB Structure
Covered Bond Investors
Issuer – CBAApproved Deposit-
taking Institution (ADI)
Covered Bond SPV – Trust/CompanyTrustee
Cover Pool MonitorEstablish register of assets held in cover pool, determine face value of assets and liabilities, maintenance of collateral
Security Trustee
Interest rate and CCY swap provider -
CBA
Servicer – CBA
ProceedsP&ICovered Bonds
Sale Price
Sale of Cover poolLoan
P&I: Principal and Interest Payments
P&I
AUD
FX
Floating charge over cover pool
assets
Guarantee
Trust ManagerSAS (Subsidiary of
CBA)
5
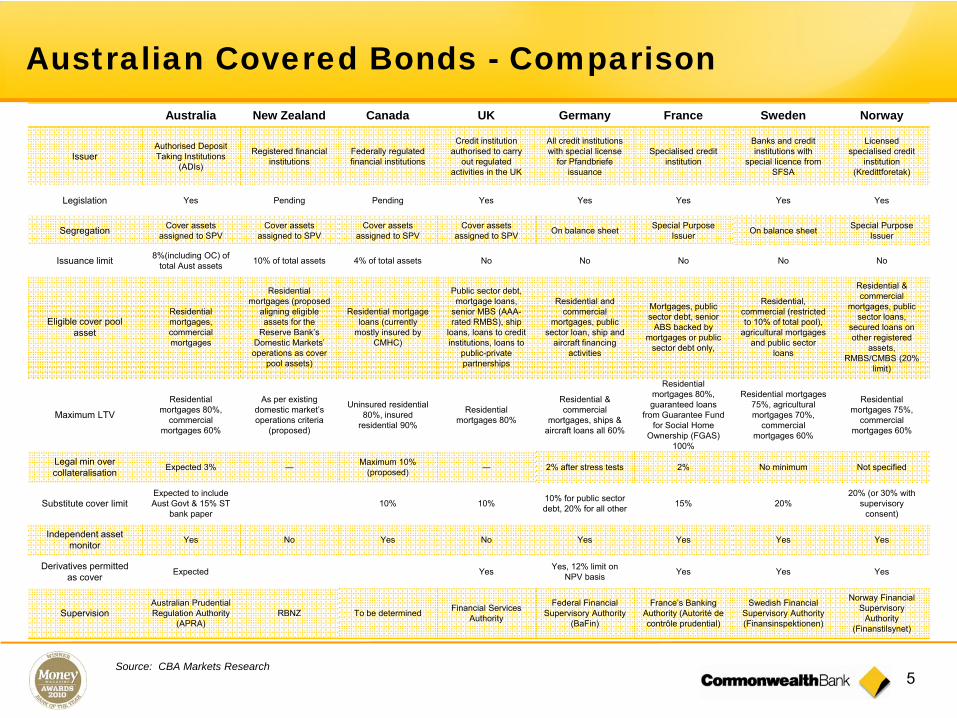
Australian Covered Bonds - ComparisonAustralia New Zealand Canada UK Germany France Sweden Norway
IssuerAuthorised Deposit Taking Institutions
(ADIs)
Registered financial institutions
Federally regulatedfinancial institutions
Credit institutionauthorised to carry
out regulated activities in the UK
All credit institutions with special license
for Pfandbriefe issuance
Specialised credit institution
Banks and credit institutions with
special licence from SFSA
Licensed specialised credit
institution (Kredittforetak)
Legislation Yes Pending Pending Yes Yes Yes Yes Yes
Segregation Cover assets assigned to SPV
Cover assets assigned to SPV
Cover assets assigned to SPV
Cover assets assigned to SPV On balance sheet Special Purpose
Issuer On balance sheet Special Purpose Issuer
Issuance limit 8%(including OC) of total Aust assets 10% of total assets 4% of total assets No No No No No
Eligible cover pool asset
Residential mortgages, commercial mortgages
Residential mortgages (proposed
aligning eligible assets for the
Reserve Bank’s Domestic Markets’ operations as cover
pool assets)
Residential mortgage loans (currently
mostly insured by CMHC)
Public sector debt, mortgage loans,
senior MBS (AAA-rated RMBS), ship
loans, loans to credit institutions, loans to
public-private partnerships
Residential and commercial
mortgages, public sector loan, ship and
aircraft financing activities
Mortgages, public sector debt, senior
ABS backed by mortgages or public
sector debt only,
Residential, commercial (restricted to 10% of total pool),
agricultural mortgages and public sector
loans
Residential & commercial
mortgages, public sector loans,
secured loans on other registered
assets, RMBS/CMBS (20%
limit)
Maximum LTV
Residential mortgages 80%,
commercial mortgages 60%
As per existing domestic market’s operations criteria
(proposed)
Uninsured residential 80%, insured
residential 90%
Residential mortgages 80%
Residential & commercial
mortgages, ships & aircraft loans all 60%
Residential mortgages 80%, guaranteed loans
from Guarantee Fund for Social Home
Ownership (FGAS) 100%
Residential mortgages 75%, agricultural mortgages 70%,
commercial mortgages 60%
Residential mortgages 75%,
commercial mortgages 60%
Legal min over collateralisation Expected 3% ― Maximum 10%
(proposed) ― 2% after stress tests 2% No minimum Not specified
Substitute cover limitExpected to include Aust Govt & 15% ST
bank paper10% 10% 10% for public sector
debt, 20% for all other 15% 20%20% (or 30% with
supervisory consent)
Independent asset monitor Yes No Yes No Yes Yes Yes Yes
Derivatives permitted as cover Expected Yes Yes, 12% limit on
NPV basis Yes Yes Yes
SupervisionAustralian Prudential Regulation Authority
(APRA)RBNZ To be determined Financial Services
Authority
Federal Financial Supervisory Authority
(BaFin)
France’s Banking Authority (Autorité de contrôle prudential)
Swedish Financial Supervisory Authority (Finansinspektionen)
Norway Financial Supervisory
Authority (Finanstilsynet)
Source: CBA Markets Research
6
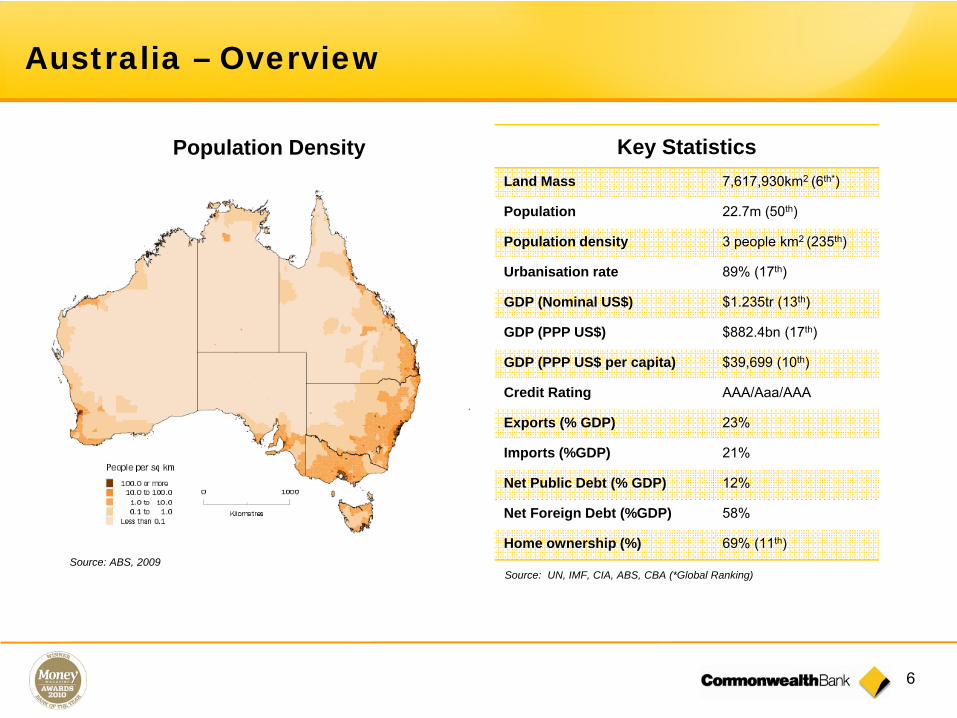
Australia – Overview
Key StatisticsLand Mass 7,617,930km2 (6th*)
Population 22.7m (50th)
Population density 3 people km2 (235th)
Urbanisation rate 89% (17th)
GDP (Nominal US$) $1.235tr (13th)
GDP (PPP US$) $882.4bn (17th)
GDP (PPP US$ per capita) $39,699 (10th)
Credit Rating AAA/Aaa/AAA
Exports (% GDP) 23%
Imports (%GDP) 21%
Net Public Debt (% GDP) 12%
Net Foreign Debt (%GDP) 58%
Home ownership (%) 69% (11th)
Source: UN, IMF, CIA, ABS, CBA (*Global Ranking)
Population Density
Source: ABS, 2009
7
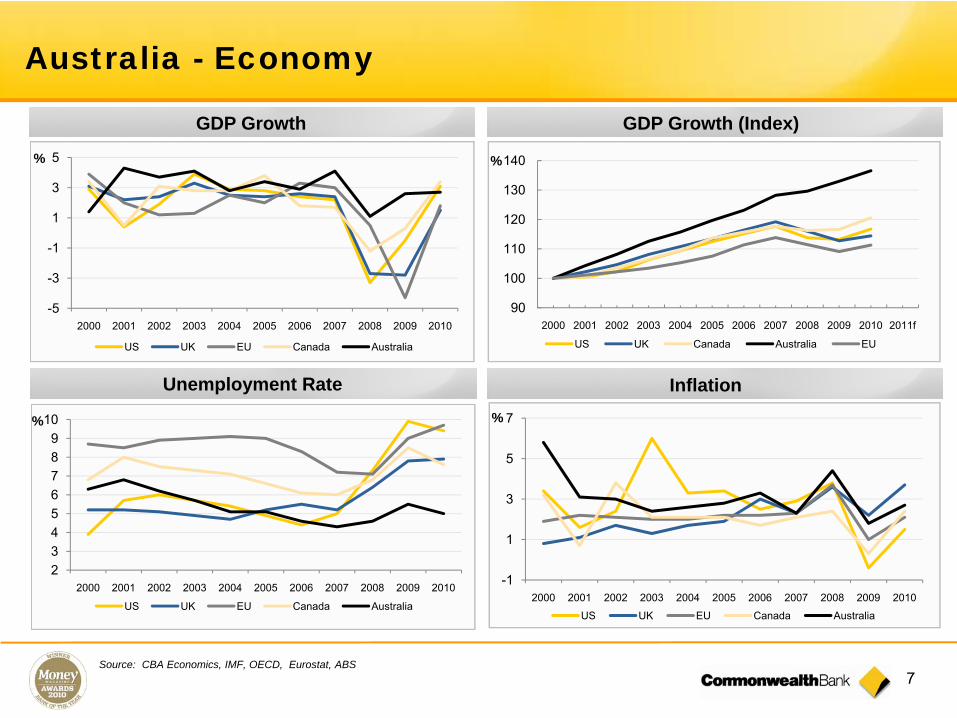
Australia - Economy
GDP Growth
Unemployment Rate Inflation
-5
-3
-1
1
3
5
2000 2001 2002 2003 2004 2005 2006 2007 2008 2009 2010
US UK EU Canada Australia
23456789
10
2000 2001 2002 2003 2004 2005 2006 2007 2008 2009 2010
US UK EU Canada Australia
-1
1
3
5
7
2000 2001 2002 2003 2004 2005 2006 2007 2008 2009 2010
US UK EU Canada Australia
GDP Growth (Index)
90
100
110
120
130
140
2000 2001 2002 2003 2004 2005 2006 2007 2008 2009 2010 2011f
US UK Canada Australia EU
Source: CBA Economics, IMF, OECD, Eurostat, ABS
%
% %
%
8
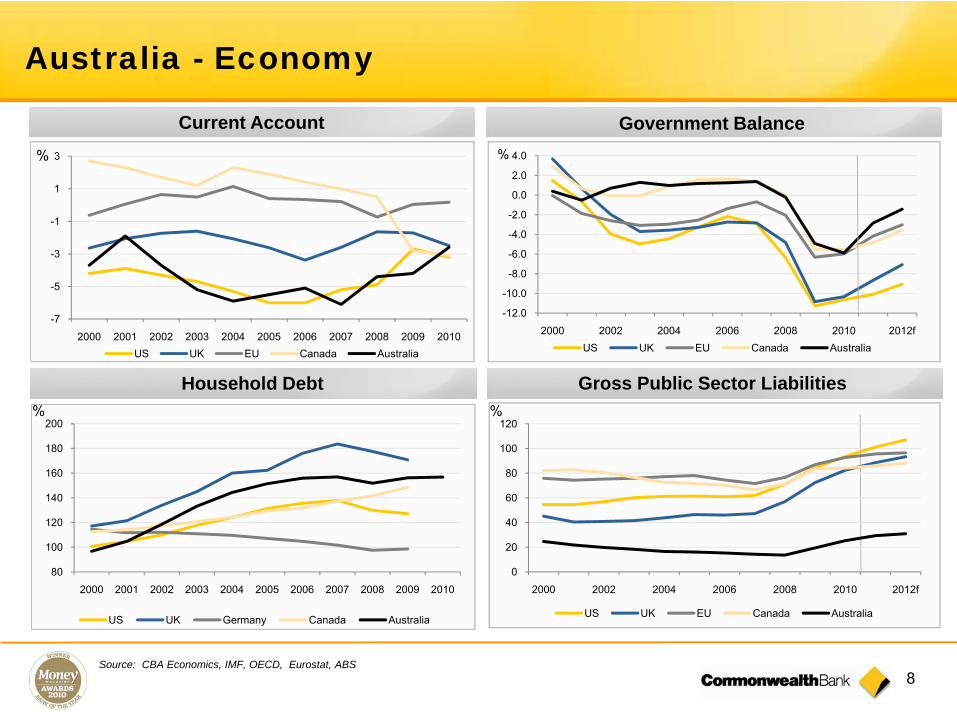
Australia - Economy
Government Balance
Gross Public Sector LiabilitiesHousehold Debt
-12.0
-10.0
-8.0
-6.0
-4.0
-2.0
0.0
2.0
4.0
2000 2002 2004 2006 2008 2010 2012fUS UK EU Canada Australia
%
-7
-5
-3
-1
1
3
2000 2001 2002 2003 2004 2005 2006 2007 2008 2009 2010US UK EU Canada Australia
80
100
120
140
160
180
200
2000 2001 2002 2003 2004 2005 2006 2007 2008 2009 2010
US UK Germany Canada Australia
Current Account
Source: CBA Economics, IMF, OECD, Eurostat, ABS
%
% %
0
20
40
60
80
100
120
2000 2002 2004 2006 2008 2010 2012f
US UK EU Canada Australia
9
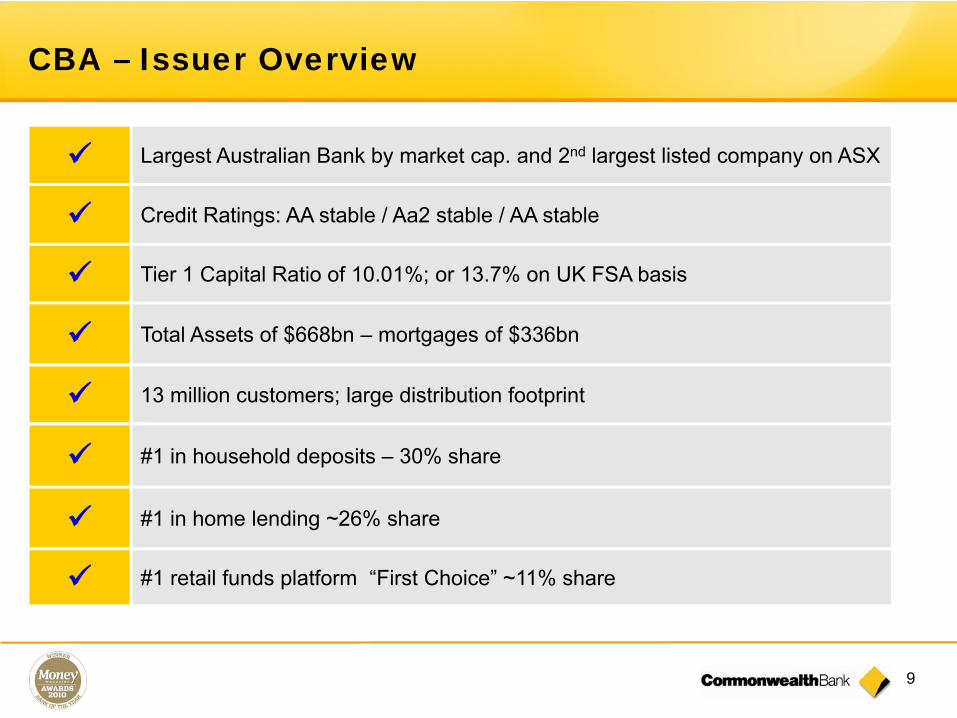
CBA – Issuer Overview
Largest Australian Bank by market cap. and 2nd largest listed company on ASX
Credit Ratings: AA stable / Aa2 stable / AA stable
Tier 1 Capital Ratio of 10.01%; or 13.7% on UK FSA basis
Total Assets of $668bn – mortgages of $336bn
13 million customers; large distribution footprint
#1 in household deposits – 30% share
#1 in home lending ~26% share
#1 retail funds platform “First Choice” ~11% share
10
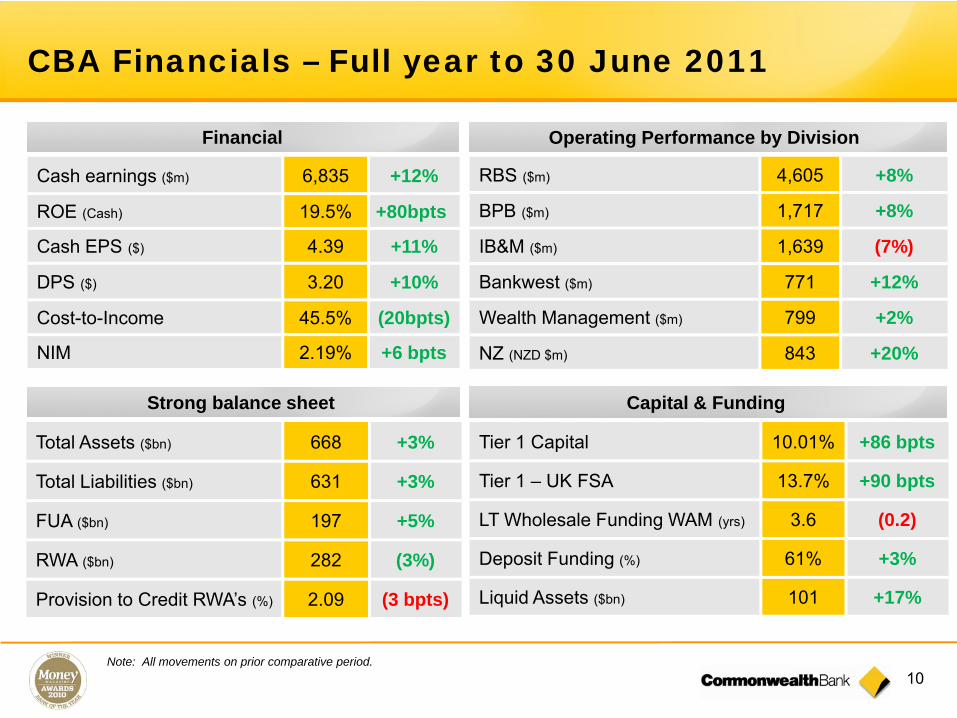
CBA Financials – Full year to 30 June 2011
Note: All movements on prior comparative period.
Cash earnings ($m) 6,835 +12%
ROE (Cash) 19.5% +80bpts
Cash EPS ($) 4.39 +11%
DPS ($) 3.20 +10%
Cost-to-Income 45.5% (20bpts)
NIM 2.19% +6 bpts
RBS ($m) 4,605 +8%
BPB ($m) 1,717 +8%
IB&M ($m) 1,639 (7%)
Bankwest ($m) 771 +12%
Wealth Management ($m) 799 +2%
NZ (NZD $m) 843 +20%
Total Assets ($bn) 668 +3%
Total Liabilities ($bn) 631 +3%
FUA ($bn) 197 +5%
RWA ($bn) 282 (3%)
Provision to Credit RWA’s (%) 2.09 (3 bpts)
Tier 1 Capital 10.01% +86 bpts
Tier 1 – UK FSA 13.7% +90 bpts
LT Wholesale Funding WAM (yrs) 3.6 (0.2)
Deposit Funding (%) 61% +3%
Liquid Assets ($bn) 101 +17%
Financial
Strong balance sheet Capital & Funding
Operating Performance by Division
11
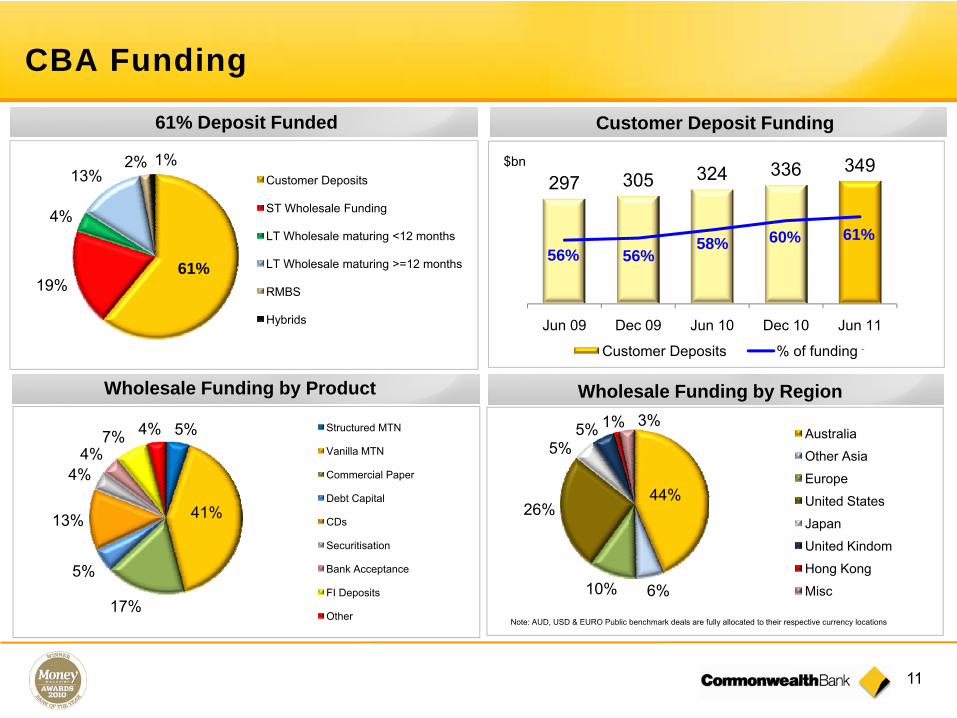
61%19%
4%
13%2% 1%
Customer Deposits
ST Wholesale Funding
LT Wholesale maturing <12 months
LT Wholesale maturing >=12 months
RMBS
Hybrids
CBA Funding
5%
41%
17%
5%
13%
4%4%
7% 4% Structured MTN
Vanilla MTN
Commercial Paper
Debt Capital
CDs
Securitisation
Bank Acceptance
FI Deposits
Other
Wholesale Funding by Product
44%
6%10%
26%
5%5% 1% 3%
Australia
Other Asia
Europe
United States
Japan
United Kindom
Hong Kong
Misc
Note: AUD, USD & EURO Public benchmark deals are fully allocated to their respective currency locations
Wholesale Funding by Region
61% Deposit Funded
$bn
3
297 305 324 336 349
56% 56%58% 60% 61%
Jun 09 Dec 09 Jun 10 Dec 10 Jun 11
Customer Deposits % of funding
Customer Deposit Funding
12
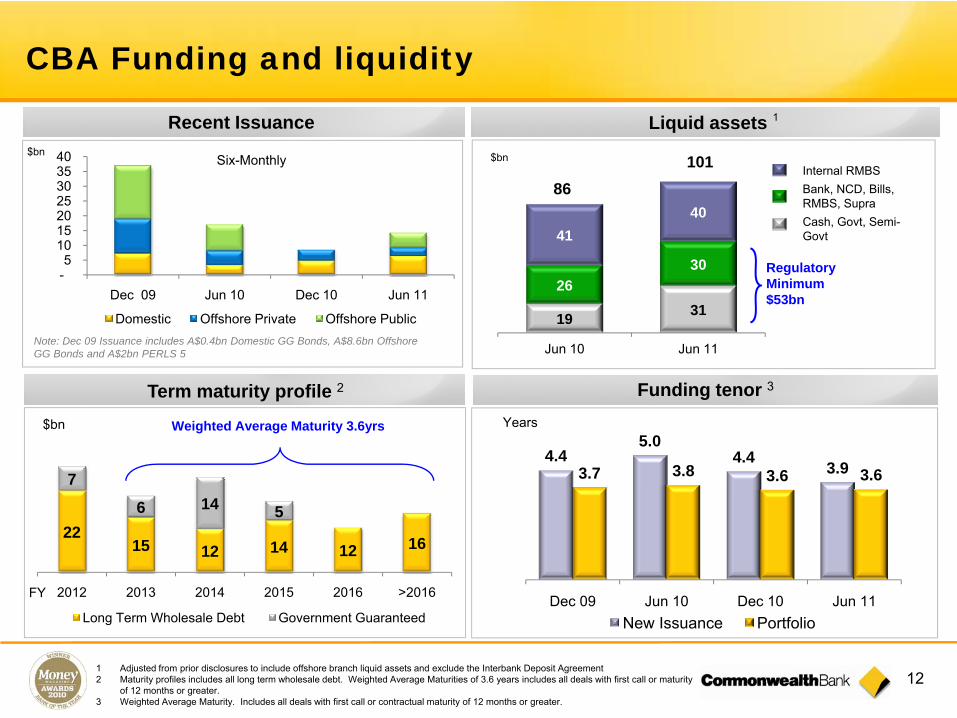
CBA Funding and liquidity
Funding tenor 3
2215 12 14 12 16
7
6 14 5
2012 2013 2014 2015 2016 >2016FY
Long Term Wholesale Debt Government Guaranteed
$bn Weighted Average Maturity 3.6yrs
4.45.0
4.4 3.93.7 3.8 3.6 3.6
Dec 09 Jun 10 Dec 10 Jun 11New Issuance Portfolio
Years
Recent Issuance
-5
10 15 20 25 30 35 40
Dec 09 Jun 10 Dec 10 Jun 11
Domestic Offshore Private Offshore PublicNote: Dec 09 Issuance includes A$0.4bn Domestic GG Bonds, A$8.6bn Offshore GG Bonds and A$2bn PERLS 5
$bnSix-Monthly
Liquid assets
Regulatory Minimum $53bn
19 3126
30
4140
Jun 10 Jun 11
86101$bn
Internal RMBSBank, NCD, Bills, RMBS, SupraCash, Govt, Semi-Govt
1
1 Adjusted from prior disclosures to include offshore branch liquid assets and exclude the Interbank Deposit Agreement2 Maturity profiles includes all long term wholesale debt. Weighted Average Maturities of 3.6 years includes all deals with first call or maturity
of 12 months or greater.3 Weighted Average Maturity. Includes all deals with first call or contractual maturity of 12 months or greater.
Term maturity profile 2
13
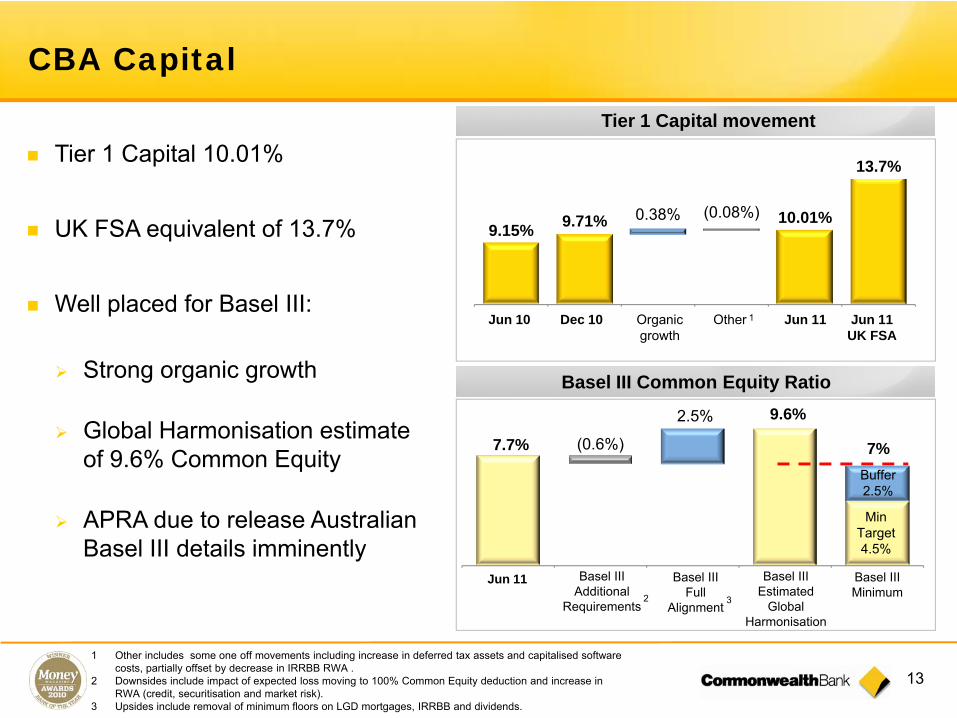
9.15% 9.71% 0.38% (0.08%) 10.01%
13.7%
Tier 1 Capital movement
Customer Deposit FundingBasel III Common Equity Ratio
Dec 10 Organic growth
Tier 1 Capital 10.01%
UK FSA equivalent of 13.7%
Well placed for Basel III:
Strong organic growth
Global Harmonisation estimate of 9.6% Common Equity
APRA due to release Australian Basel III details imminently
7.7% (0.6%)
Jun 11 Basel III Estimated
Global Harmonisation
Basel III Additional
Requirements
Jun 11 Jun 11UK FSA
Other
Min Target 4.5%
Buffer 2.5%
Basel III Minimum
Basel III Full
Alignment
7%
1 Other includes some one off movements including increase in deferred tax assets and capitalised software costs, partially offset by decrease in IRRBB RWA .
2 Downsides include impact of expected loss moving to 100% Common Equity deduction and increase in RWA (credit, securitisation and market risk).
3 Upsides include removal of minimum floors on LGD mortgages, IRRBB and dividends.
9.6%2.5%
2 3
1Jun 10
CBA Capital
14
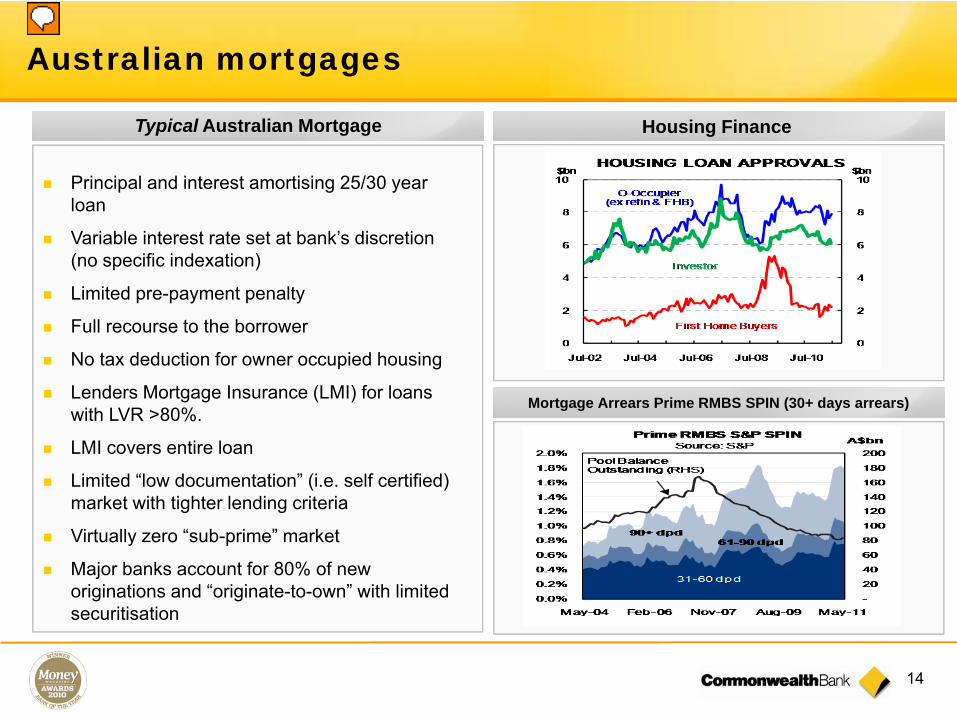
Australian mortgages
Principal and interest amortising 25/30 year loan
Variable interest rate set at bank’s discretion (no specific indexation)
Limited pre-payment penalty
Full recourse to the borrower
No tax deduction for owner occupied housing
Lenders Mortgage Insurance (LMI) for loans with LVR >80%.
LMI covers entire loan
Limited “low documentation” (i.e. self certified) market with tighter lending criteria
Virtually zero “sub-prime” market
Major banks account for 80% of new originations and “originate-to-own” with limited securitisation
Housing Finance
Mortgage Arrears Prime RMBS SPIN (30+ days arrears)
Housing Finance Typical Australian Mortgage
15
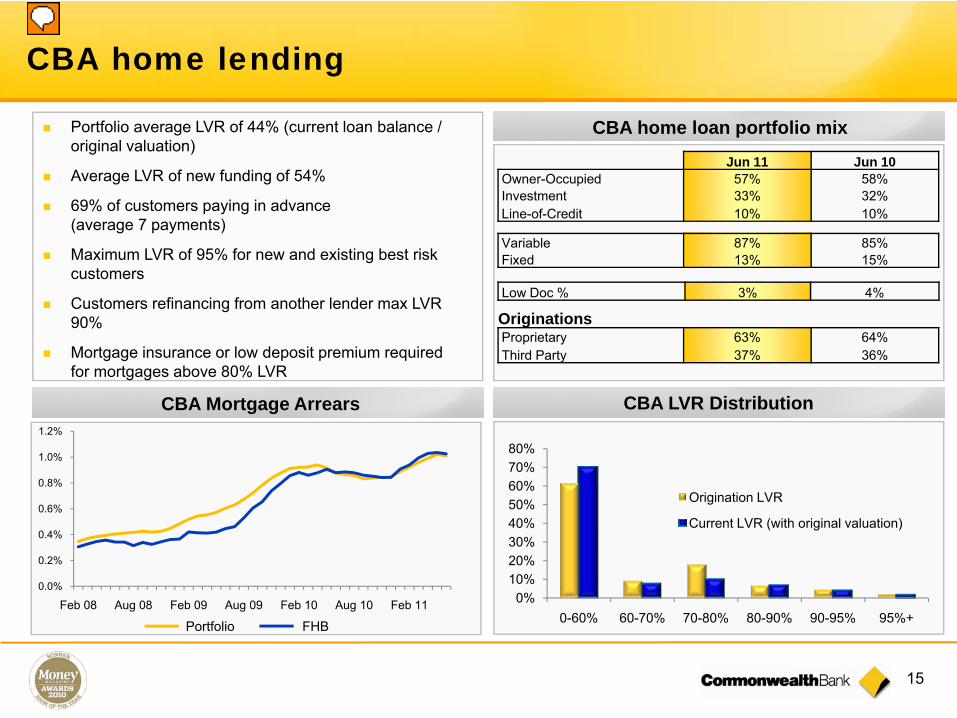
0%10%20%30%40%50%60%70%80%
0-60% 60-70% 70-80% 80-90% 90-95% 95%+
Origination LVR
Current LVR (with original valuation)
OriginationsProprietary 63% 64%Third Party 37% 36%
Low Doc % 3% 4%
Variable 87% 85%Fixed 13% 15%
Jun 11 Jun 10Owner-Occupied 57% 58%Investment 33% 32%Line-of-Credit 10% 10%
CBA home lending
Portfolio average LVR of 44% (current loan balance / original valuation)
Average LVR of new funding of 54%
69% of customers paying in advance (average 7 payments)
Maximum LVR of 95% for new and existing best risk customers
Customers refinancing from another lender max LVR 90%
Mortgage insurance or low deposit premium required for mortgages above 80% LVR
CBA home loan portfolio mix
CBA Mortgage Arrears CBA LVR Distribution
0.0%
0.2%
0.4%
0.6%
0.8%
1.0%
1.2%
Feb 08 Aug 08 Feb 09 Aug 09 Feb 10 Aug 10 Feb 11
FHB Portfolio
16
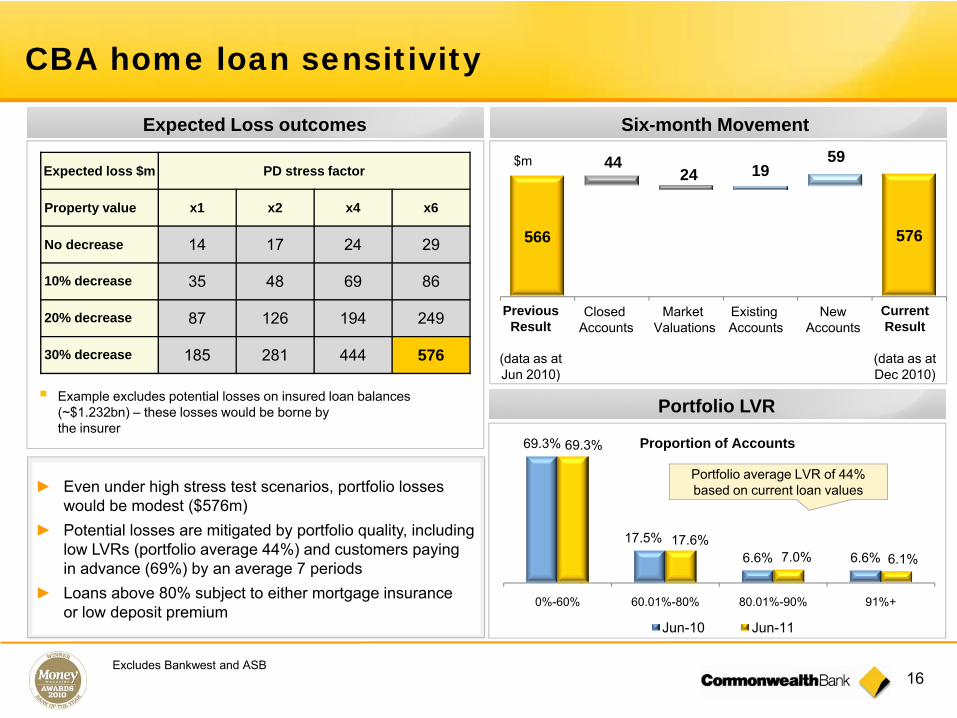
CBA home loan sensitivity
Excludes Bankwest and ASB
► Even under high stress test scenarios, portfolio losses would be modest ($576m)
► Potential losses are mitigated by portfolio quality, including low LVRs (portfolio average 44%) and customers paying in advance (69%) by an average 7 periods
► Loans above 80% subject to either mortgage insurance or low deposit premium
Example excludes potential losses on insured loan balances (~$1.232bn) – these losses would be borne bythe insurer
Expected loss $m PD stress factor
Property value x1 x2 x4 x6
No decrease 14 17 24 29
10% decrease 35 48 69 86
20% decrease 87 126 194 249
30% decrease 185 281 444 576
Previous Result
(data as at Jun 2010)
Closed Accounts
Market Valuations
Existing Accounts
NewAccounts
Current Result
(data as at Dec 2010)
$m
Expected Loss outcomes Six-month Movement
Portfolio LVR
69.3%
17.5%6.6% 6.6%
69.3%
17.6%7.0% 6.1%
0%-60% 60.01%-80% 80.01%-90% 91%+
Jun-10 Jun-11
Proportion of Accounts
Portfolio average LVR of 44% based on current loan values
566 576
4424 19
59
17
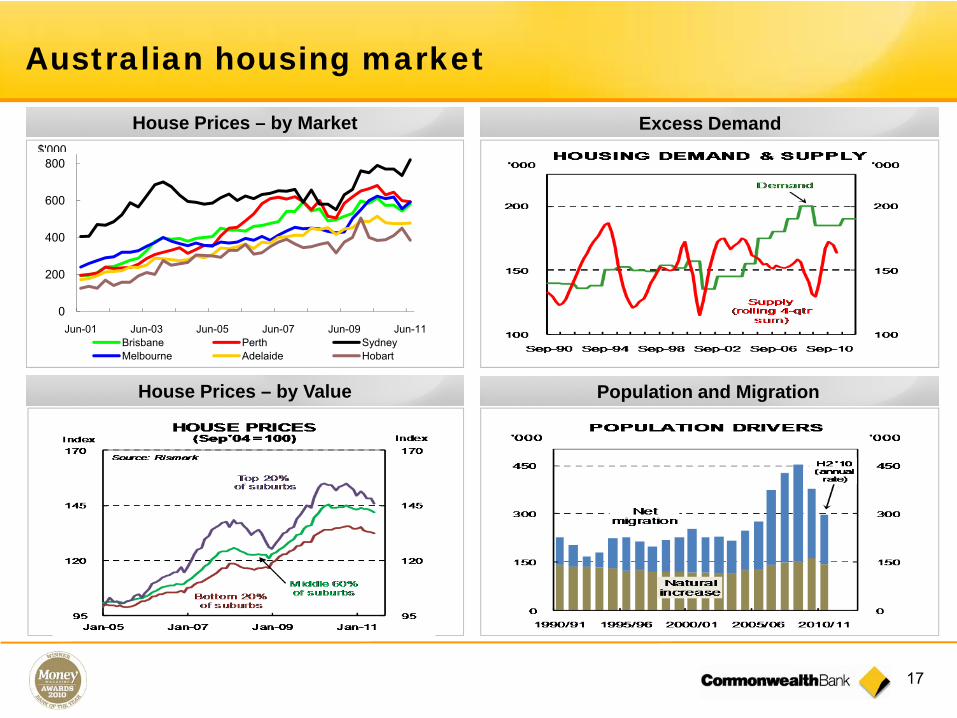
Australian housing market
House Prices – by Market
House Prices – by Value Population and Migration
0
200
400
600
800
Jun-01 Jun-03 Jun-05 Jun-07 Jun-09 Jun-11Brisbane Perth SydneyMelbourne Adelaide Hobart
$'000
Excess Demand
18
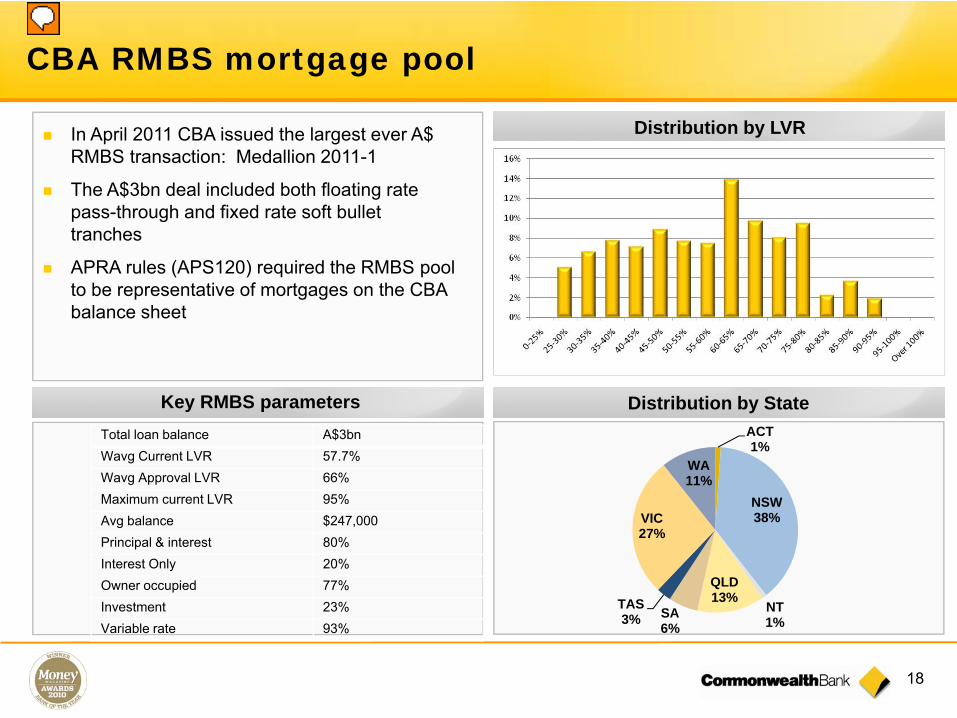
Total loan balance A$3bnWavg Current LVR 57.7%Wavg Approval LVR 66%Maximum current LVR 95%Avg balance $247,000Principal & interest 80%Interest Only 20%Owner occupied 77%Investment 23%Variable rate 93%
CBA RMBS mortgage pool
In April 2011 CBA issued the largest ever A$ RMBS transaction: Medallion 2011-1
The A$3bn deal included both floating rate pass-through and fixed rate soft bullet tranches
APRA rules (APS120) required the RMBS pool to be representative of mortgages on the CBA balance sheet
Distribution by LVR
Key RMBS parameters Distribution by StateACT1%
NSW38%
NT1%
QLD13%
SA6%
TAS3%
VIC27%
WA11%
19
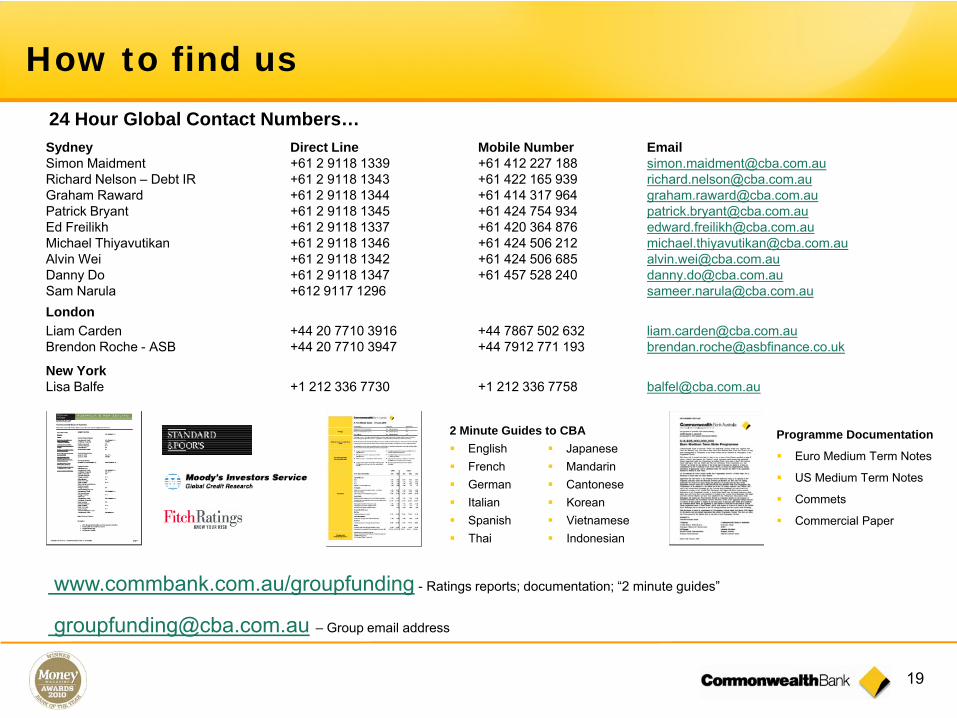
www.commbank.com.au/groupfunding - Ratings reports; documentation; “2 minute guides”
[email protected] – Group email address
Programme Documentation
Euro Medium Term Notes
US Medium Term Notes
Commets
Commercial Paper
2 Minute Guides to CBAEnglishFrenchGermanItalianSpanishThai
JapaneseMandarinCantoneseKoreanVietnameseIndonesian
24 Hour Global Contact Numbers…Sydney Direct Line Mobile Number EmailSimon Maidment +61 2 9118 1339 +61 412 227 188 [email protected] Nelson – Debt IR +61 2 9118 1343 +61 422 165 939 [email protected] Graham Raward +61 2 9118 1344 +61 414 317 964 [email protected] Bryant +61 2 9118 1345 +61 424 754 934 [email protected] Freilikh +61 2 9118 1337 +61 420 364 876 [email protected] Thiyavutikan +61 2 9118 1346 +61 424 506 212 [email protected] Wei +61 2 9118 1342 +61 424 506 685 [email protected] Do +61 2 9118 1347 +61 457 528 240 [email protected] Narula +612 9117 1296 [email protected] Carden +44 20 7710 3916 +44 7867 502 632 [email protected] Roche - ASB +44 20 7710 3947 +44 7912 771 193 [email protected]
New York Lisa Balfe +1 212 336 7730 +1 212 336 7758 [email protected]
How to find us
Commonwealth Bank of Australia ACN 123 123 124
Results PresentationFor the half year ended 31 December 2009
10 February 2010
DETERMINED TO BE BETTER THAN WE’VE EVER BEEN.
September 2011 | COMMONWEALTH BANK OF AUSTRALIA | CAN 123 123 124