results of pm air pollution baseline … site number characteristics site position pm size fraction...
TRANSCRIPT

RESULTS OF PM AIR
POLLUTION BASELINE AND
SOURCE APPORTIONMENT
STUDY OF ULAANBAATAR CITY
OF MONGOLIA
S.Lodoysamba, S.Larssen, D.Shagjjamba, Li Liu, G.Gerelmaa J.Nygaard

Mongolia, Ulaanbaatar
1

• ESTABLISHMENT OF AN AIR QUALITY MONITORING AND HEALTH
IMPACT BASELINE (AMHIB) FROM AIR POLLUTION IN
ULAANBAATAR (UB) CITY, MONGOLIA.
World Bank Contract 7146873, 2008-2009
Projects
• АГААРЫН ЧАНАР БА БОХИРДОЛЫН ЗӨӨГДЛИЙГ СУДЛАХШинжлэх ухаан, технологийн сэдэв, 2006-2008
• АГААРЫН БОХИРДЛЫН ҮҮСГҮҮР, ТЭДНИЙ БОХИРДОЛД ОРУУЛЖБУЙ ХУВИЙГ РМ2,5, РМ10 АРГААР ТОДОРХОЙЛОХ СУДАЛГАА
Шинжлэх ухаан, технологийн сэдэв, 2009-2011
• RCA/ IAEA PROJECT IMPROVED INFORMATION ABOUT URBAN
AIR QUALITY MANAGEMENT,
RAS/7/013, 2004-2007
• CHARACTERIZATION AND SOURCE IDENTIFICATION OF
PARTICULATE AIR POLLUTION IN THE ASIA REGION
RAS/7/015, 2007-2010
2

Sampling Sites
3

Sampling
site numberCharacteristics Site position
PM size
fraction
Height of
sampling head
from the
ground (m)
Remarks
1
Kosa Monitor (Japanese make),
Measures PM10 and PM2.5.
Beta absorption.. Continuous
monitoring. Gives hourly values.
106o54,704
47o55,220
PM10 and
PM2.520
2, 3
GENT Sampler, Schulberger
Model 250, Measures PM10-2.5
and PM2.5. Polycarbonate
(nuclepore) filters.
106o58,311
47o54,811
PM10-2.5
and PM2.51.6;6
Elemental
analysis, Black
carbon
determination
4, 7, 8
Dust Trak-8520, measures
PM2.5 or PM10. Laser light
scattering. Continuous
monitoring; Gives hourly values.
106o54,159
47o54,719PM2.5 3;2;3
5
Rotary Bebicon, Type 35RC-
28SD5 (Japanese make).
Measures PM10,
15 l/min, filter.
106o52,967
47o53,64PM10 3
Replaced by
EcoTech monitor
(beta absorption)
from Nov.2008
6
Partisol FRM-Model 2000,
Measures PM10, 16.7 l/min, filter
(nuclepore).
106o52,167
47o55,582PM10 4
Elemental
analysis, Black
carbon
determination
Used samplers
4

MonthsNAMHEM
(1)
NRC
(2)
Zuun ail
(3)
CLEM
(5)
3 khoroolol
(6)Average
Jun-08 28.9 160.2 154.3 120.0 187.3 130.2
Jul-08 7.2 126.7 112.5 17.6 56.4 64.1
Aug-08 238.0 179.1 27.9 85.4 132.6
Sep-08 8.0 221.4 131.4 38.8 70.4 94.0
Oct-08 37.7 223.1 127.6 79.6 161.2 125.8
Nov-08 128.5 365.8 673.2 112.9 800.8 416.2
Dec-08 277.5 180.2 926.8 61.4 693.5 427.9
Jan-09 173.7 200.1 1850.0 65.8 932.3 644.4
Feb-09 115.4 302.1 1007.3 86.0 463.7 394.9
Mar-09 62.5 205.2 488.6 63.7 358.2 235.6
Apr-09 34.0 316.0 300.2 59.8 272.8 196.5
May-09 32.5 501.2 739.3 33.6 183.1 297.9
Annual
average82.3 253.3 557.5 63.91 355.4 262.5
MonthsNAMHEM
(1)
NRC
(2)
Zuun ail
(3)
6 buudal
(4)
Bayan
hoshuu (7)
Airport
(8)
Avera
ge
Jun-08 16.9 29.0 25.5 84.6 169.3 65.1
Jul-08 1.2 21.7 13.3 12.1
Aug-08 5.7 64.9 48.7 39.7
Sep-08 8.0 18.8 37.9 37.3 47.0 37.6 31.1
Oct-08 38.1 46.3 38.7 281.3 498.3 184.7 181.2
Nov-08 81.4 121.6 330.6 527.3 567.5 406.3 339.1
Dec-08 224.5 106.9 575.5 1205.1 1421.2 892.9 737.7
Jan-09 138.3 121.3 1291.1 858.5 1536.1 514.5 743.3
Feb-09 99.6 141.4 358.1 342.4 971.3 413.3 387.7
Mar-09 45.3 80.1 345.5 179.3 321.0 207.3 196.4
Apr-09 25.2 128.8 119.6 93.9 137.3 91.8 99.4
May-09 24.3 279.3 370.8 41.9 58.9 52.9 138.0
Annual
average59.1 96.7 296.3 365.2 617.6 297.1 288.6
PM10, PM2.5 Concentrations
PM10 PM2.5
5

PM 2.5 Concentration Time Series
6
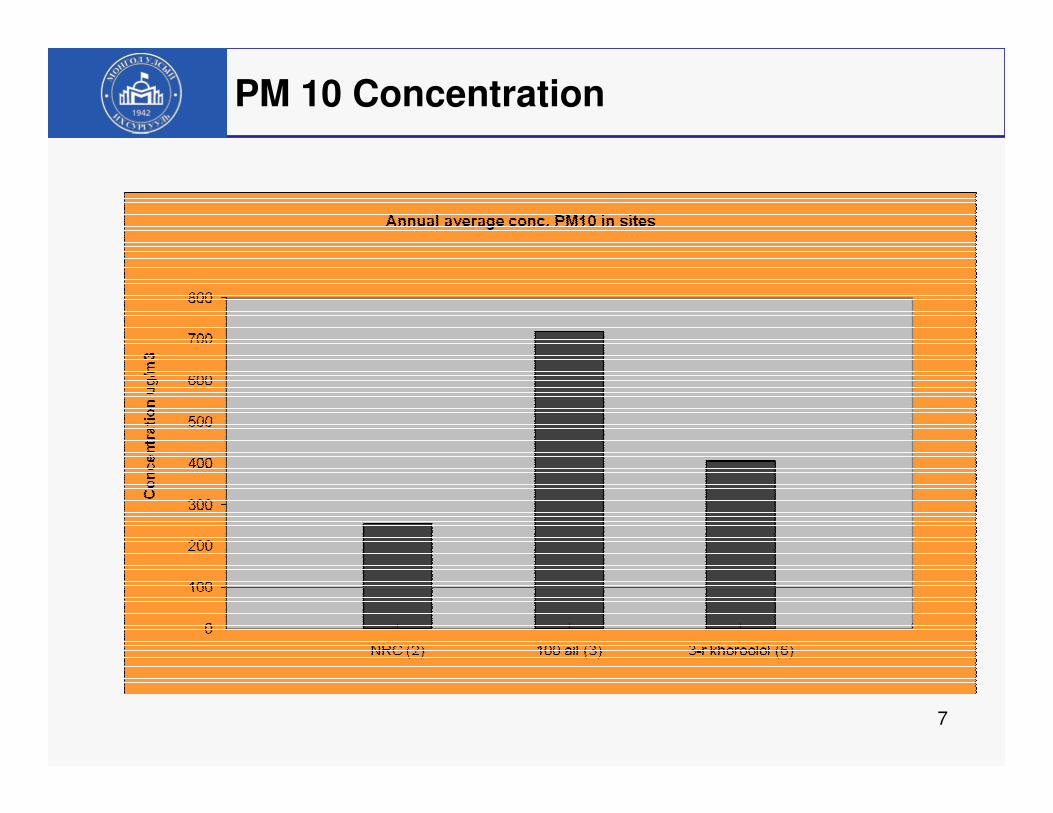
PM 10 Concentration
7

PM 2.5 Concentration
8

PM10 PM2.5
Monthly Average Concentrations
9

Average Concentration Measured
Average Concentration Assessed
AreaРМ10 (µµµµg/m3)
РМ2.5 (µµµµg/m3) Exceedence
Central
part UB300 150 6
Ger area
UB350-900
300-
6207-18
Site No Site name PM2.5 PM10
2 NRC 96.7 253.3
3 Zuun ail 296.3 557.5
4 6 Buudal 365.2 -
6 3 khoroolol - 355.4
7 Bayanhoshuu 617.6 -
8 Airport 297.1 -
Average all
stations
334.6 388.7
Monthly Average Concentrations
10

Gers and Ger Area
Gers in countryside
Ger Area
Mongolian Ger 11

Annual Average Concentrations
350-900
12

Source PM10 SO2
Height of
emissions,
meters
Spatial distribution
Ger
households16,363 7,084 2-3 Throughout ger areas
HOBs 6,480 4,360 10-20Distributed over the ger areas
and along the east-west corridor
CHP 6,290 33,600 100-2503 point sources to the west of UB
centre
Vehicle
exhaust1,161 1,354 1
Throughout the city,
concentrated in central areas
Emissions inventory for combustion
sources (tons/year)
13

Chemical Analysis Set-up
Experimental setup of the New Zealand Institute of
Geosciences and Nuclear Sciences14

45%
34%
10%
11%
Source contribution PM10-2.5 NRC
Soil 1
Soil 2
Combustion
Road dust
3% 5%
91%
1%
Source contribution PM10-2.5 No3
Coal combustion
Motor vehicles+Road dust
Soil
Biomass burning
3%5%
3% 2%
87%
ContributionPM2.5 in site No3(Zuun ail)-a
Motor vehicles+Road dust
Combustion 1
Soil
Biomass burning
Combustion2
Pollution Source Apportionment
15

12%
16%
27%
45%
PM10 in 3 khoroolol
Soil
Biomass burning
Motor vehicles+Road dust
Combustion1
Pollution Source Apportionment PM10
16

Source Apportionment Summary.
17

Daily time Series of PM concentrations(Example TV site, GTZ station)
Working days Weekend
18

� Main pollution sources are:
• PM10- Soil erosion, Combustion, Road dust, Biomass burning,
• PM2.5- Coal combustion, Motor Vehicle+Road dust, Biomass burning, Soil
� Ulaanbaatar is probably the most polluted capital city of the world;
� About 50% of the PM contribution from gers correspond to ignition phase (cold start) and reloading of stoves;
� There is presence of toxic elements: Hg, Ni, V, F, Cl, Br, As in the air;
� Pb in the air is below the standard;
� A health effects study is ongoing, based upon the monitored data and
collected health data
Conclusion
19

Thank You
for Your Attention! 20