results for q3 2017 analyst teleconference$/bbl) ($/bbl) $ / bbl gross margin inventory effect med...
TRANSCRIPT

RESULTS FOR Q32017 ANALYST TELECONFERENCE

02 Operation
03Financials
01Market
01Market
4
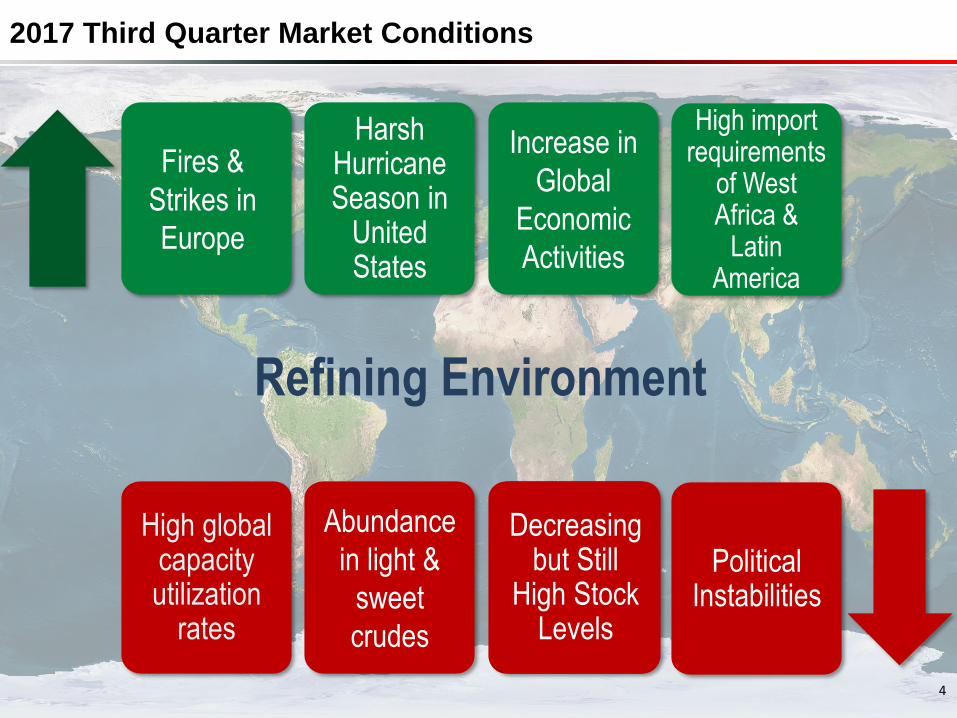
2017 Third Quarter Market Conditions
Fires &
Strikes in
Europe
Harsh Hurricane Season in
United States
High import requirements
of West Africa &
Latin America
Increase in
Global
Economic
Activities
Refining Environment
High global capacity utilization
rates
Abundance
in light &
sweet
crudes
Stock levels were still
high
Political Instabilities
Decreasingbut Still
High StockLevels

Key Highlights from Q3
5
351
188 178
2017 Q3 2016 Q3 2015 Q3
7,7 6,9 6,8
2017 Q3 2016 Q3 2015 Q3
Domestic Sales (Mil. Tons)
Profit before tax (Mil. $)
8,9
5,78,3
2017 Q3 2016 Q3 2015 Q3
Tüpraş Net Margin ($/bbl)
+11,2% +14%All time high
domestic
sales
numbers
+0,6+3,2
87% Increase
in Profit
Before Tax
(Mil. $)
Net Refining
Margin
Above Target
+87% +%97
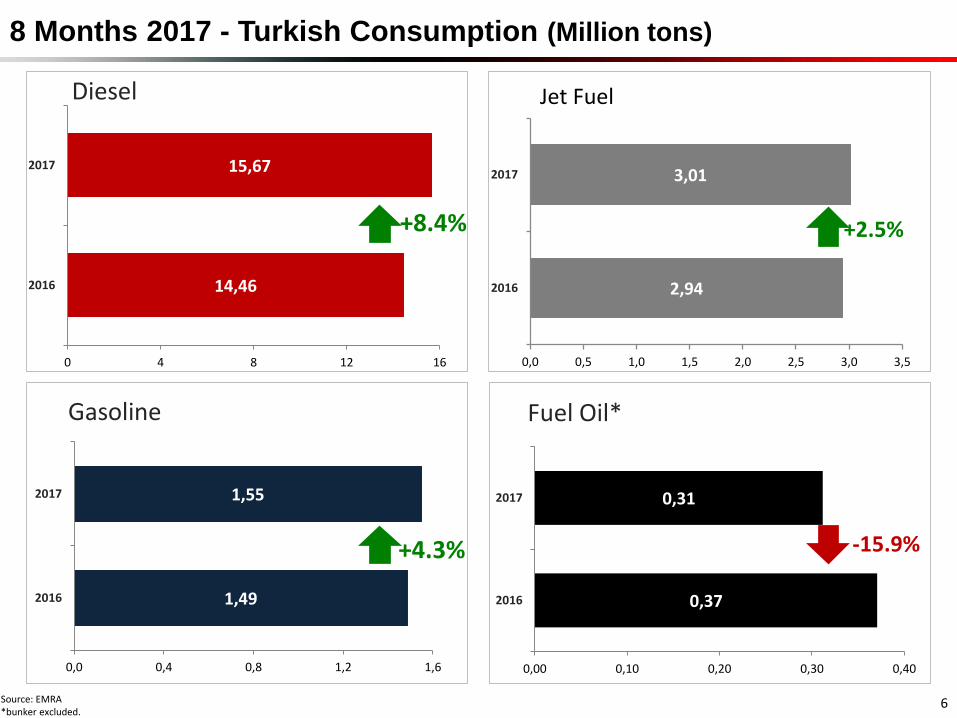
8 Months 2017 - Turkish Consumption (Million tons)
Source: EMRA*bunker excluded.
6
2,94
3,01
0,0 0,5 1,0 1,5 2,0 2,5 3,0 3,5
2016
2017
Jet Fuel
+2.5%
14,46
15,67
0 4 8 12 16
2016
2017
Diesel
1,49
1,55
0,0 0,4 0,8 1,2 1,6
2016
2017
Gasoline
+4.3%
0,37
0,31
0,00 0,10 0,20 0,30 0,40
2016
2017
Fuel Oil*
+8.4%
-15.9%
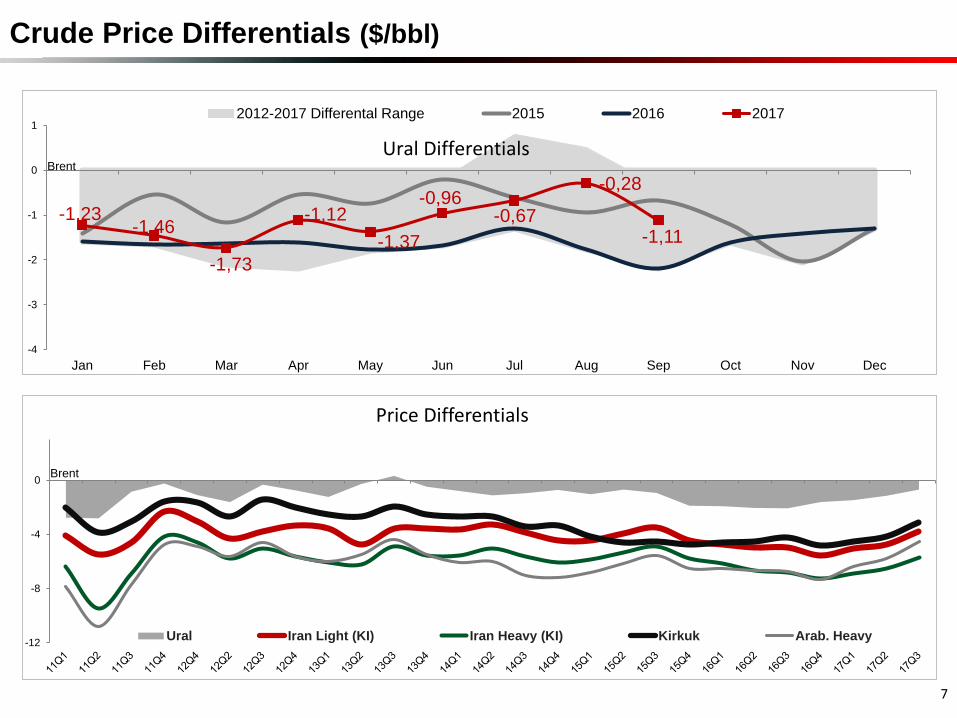
Crude Price Differentials ($/bbl)
7
-12
-8
-4
0
Price Differentials
Ural Iran Light (KI) Iran Heavy (KI) Kirkuk Arab. Heavy
Brent
-1,23 -1,46
-1,73
-1,12
-1,37
-0,96 -0,67
-0,28
-1,11
-4
-3
-2
-1
0
1
Jan Feb Mar Apr May Jun Jul Aug Sep Oct Nov Dec
2012-2017 Differental Range 2015 2016 2017
Ural DifferentialsBrent
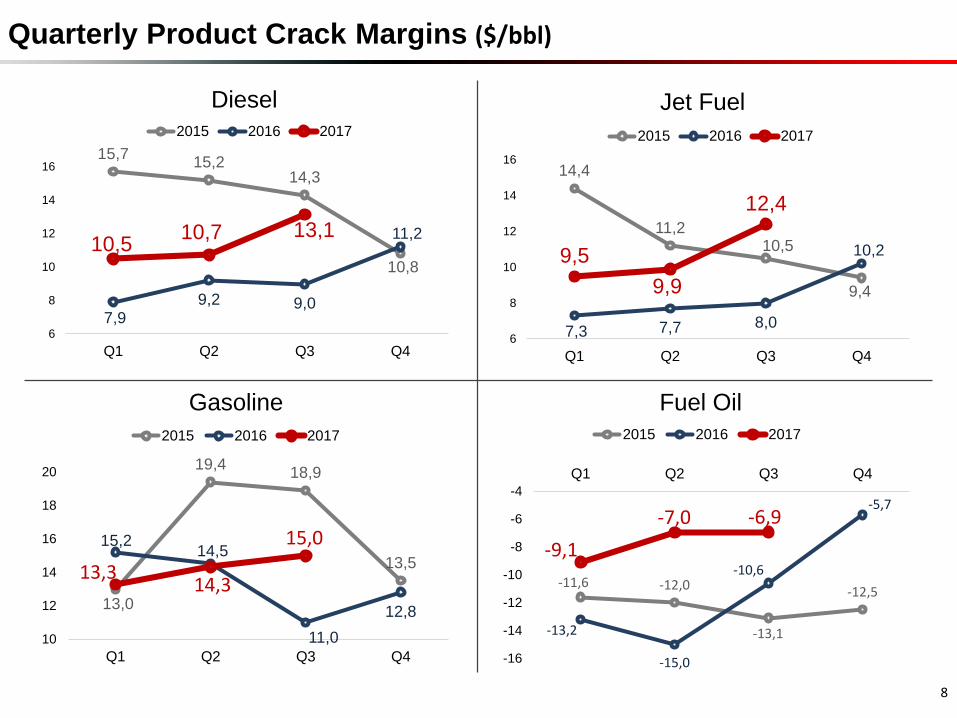
Quarterly Product Crack Margins ($/bbl)
8
14,4
11,210,5
9,4
7,3 7,7 8,0
10,29,5
9,9
12,4
6
8
10
12
14
16
Q1 Q2 Q3 Q4
Jet Fuel
2015 2016 2017
13,0
19,418,9
13,5
15,214,5
11,0
12,8
13,314,3
15,0
10
12
14
16
18
20
Q1 Q2 Q3 Q4
Gasoline
2015 2016 2017
-11,6 -12,0
-13,1
-12,5
-13,2
-15,0
-10,6
-5,7
-9,1
-7,0 -6,9
-16
-14
-12
-10
-8
-6
-4
Q1 Q2 Q3 Q4
Fuel Oil
2015 2016 2017
15,715,2
14,3
10,8
7,99,2 9,0
11,210,5
10,7 13,1
6
8
10
12
14
16
Q1 Q2 Q3 Q4
Diesel
2015 2016 2017
02 Operations
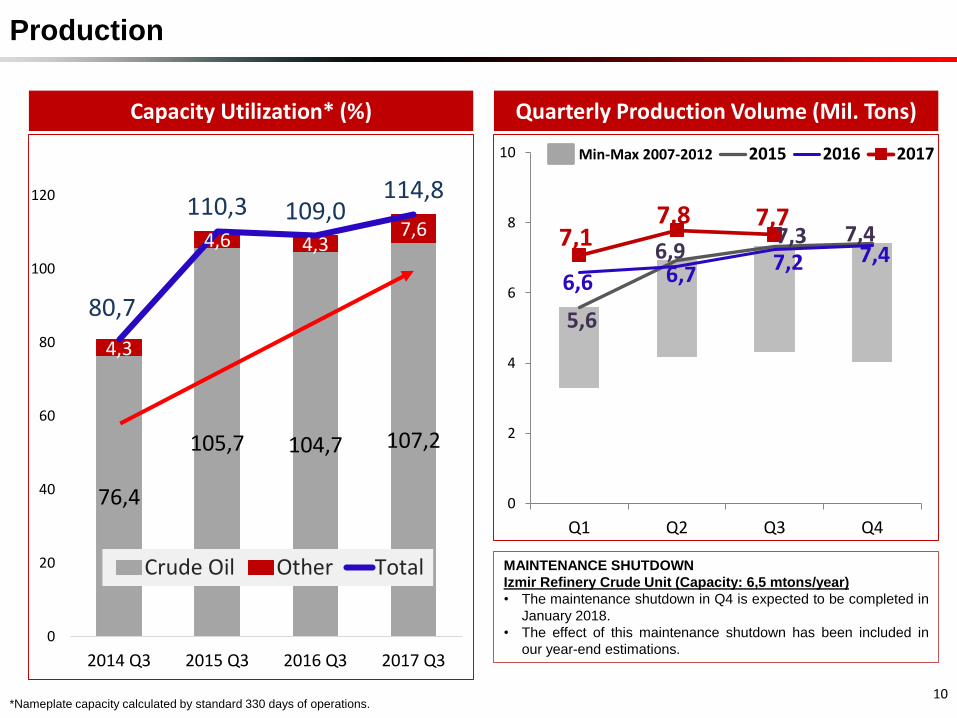
5,6
6,97,3 7,4
6,6 6,77,2 7,4
7,17,8 7,7
0
2
4
6
8
10
Q1 Q2 Q3 Q4
2015 2016 2017
Capacity Utilization* (%)
Production
10*Nameplate capacity calculated by standard 330 days of operations.
76,4
105,7 104,7 107,2
4,3
4,6 4,37,6
80,7
110,3 109,0114,8
0
20
40
60
80
100
120
2014 Q3 2015 Q3 2016 Q3 2017 Q3
Crude Oil Other Total
Quarterly Production Volume (Mil. Tons)
MAINTENANCE SHUTDOWN
Izmir Refinery Crude Unit (Capacity: 6,5 mtons/year)
• The maintenance shutdown in Q4 is expected to be completed in
January 2018.
• The effect of this maintenance shutdown has been included in
our year-end estimations.
Min-Max 2007-2012

0,8 0,9 1,0 0,8 1,0 1,3 1,2 1,1 1,2 1,5 1,3 1,50,9 1,1 1,0
0,2 0,3 0,4 0,3 0,40,6 0,9 0,9 0,8
1,1 1,21,3
0,50,9 0,90,4 0,4
0,50,4
0,50,5 0,6 0,6 0,5
0,6 0,60,7
0,40,5 0,51,5
1,72,3
2,3 1,7
2,22,8 2,8
1,8
2,6 2,93,2
1,7
2,6 2,92,9
3,3
4,1 3,93,5
4,6
5,4 5,4
4,3
5,8 6,06,7
3,6
5,1 5,3
0
2
4
6
8
14 15 16 17 14 15 16 17 14 15 16 17 14 15 16
Domestic sales of selected productsJet Fuel
Bitumen
Gasoline
Diesel
Tüpraş Sales (Million Tons)
11
Q1 Q2 Q3 Q4
3,6 3,95,1 5,0
4,15,4
6,4 6,6
4,9
6,8 6,97,7
4,3
6,2 6,4
1,11,7
1,8 2,3
0,9
1,91,3 1,4
1,5
1,2 1,21,2
1,8
1,7 1,3
4,75,6
6,9 7,2
4,7
7,37,7 8,1
6,4
7,9
6,1
7,9 7,6
0
2
4
6
8
10
14 15 16 17 14 15 16 17 14 15 16 17 14 15 16
Total SalesDomestic
Export 8,9
Q1 Q2 Q3 Q4
All Time High
Domestic
Sales
8,1
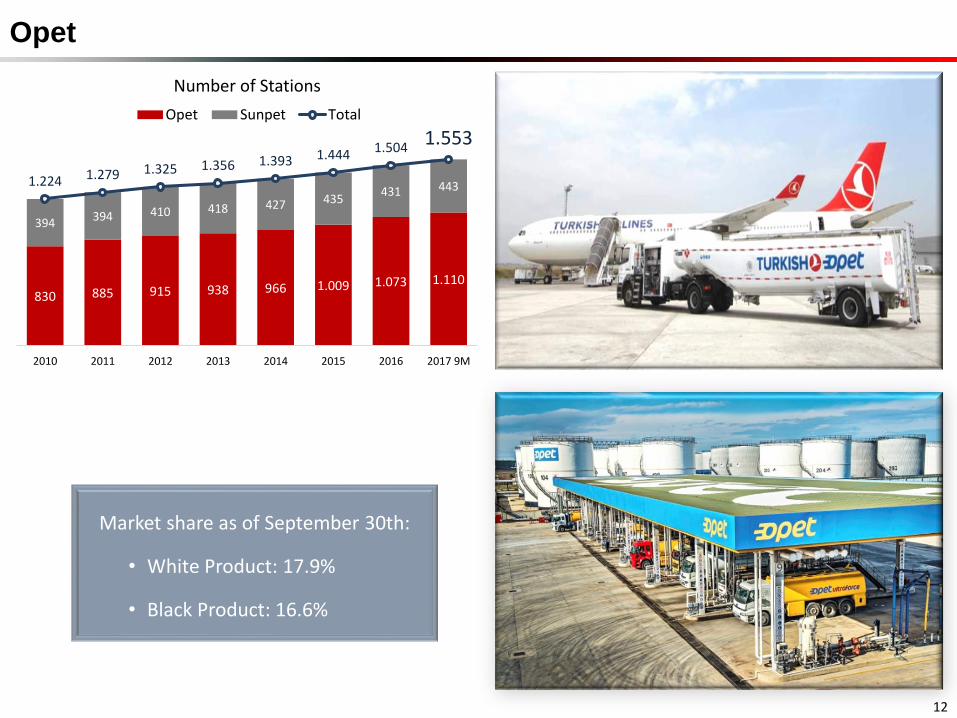
Opet
12
Market share as of September 30th:
• White Product: 17.9%
• Black Product: 16.6%
830 885 915 938 966 1.009 1.073 1.110
394 394 410 418 427 435431 4431.224 1.279 1.325 1.356 1.393 1.444 1.504
1.553
2010 2011 2012 2013 2014 2015 2016 2017 9M
Number of Stations
Opet Sunpet Total
03Financials
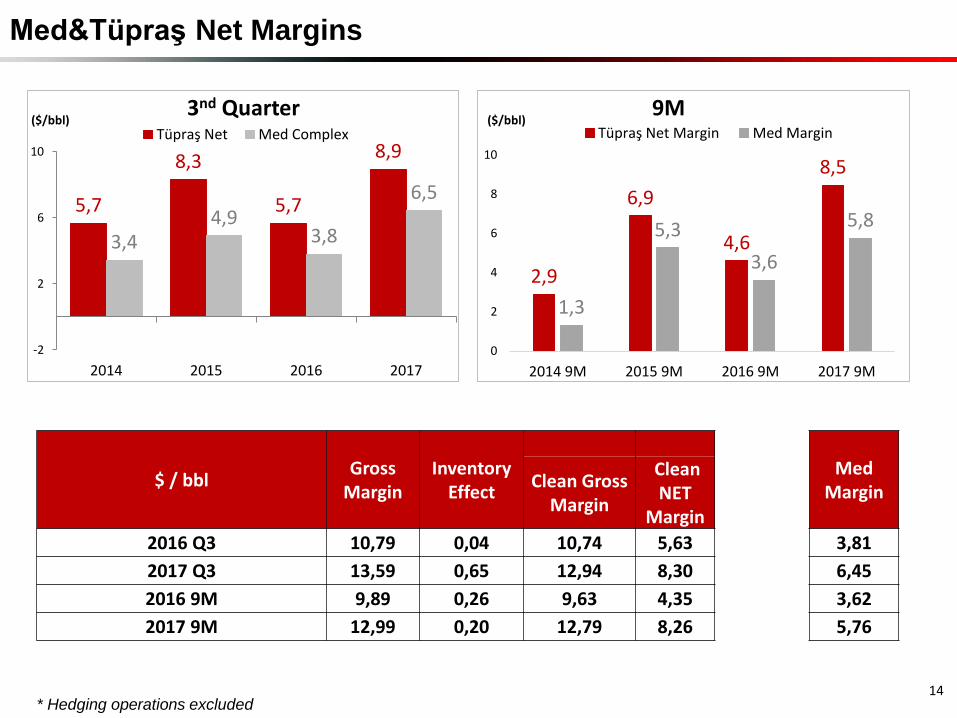
Med&Tüpraş Net Margins
14
5,7
8,3
5,7
8,9
3,44,9
3,8
6,5
-2
2
6
10
2014 2015 2016 2017
3nd QuarterTüpraş Net Med Complex
2,9
6,9
4,6
8,5
1,3
5,3
3,6
5,8
0
2
4
6
8
10
2014 9M 2015 9M 2016 9M 2017 9M
9MTüpraş Net Margin Med Margin
($/bbl)($/bbl)
$ / bblGross
MarginInventory
EffectMed
MarginClean Gross
Margin
Clean NET
Margin
2016 Q3 10,79 0,04 10,74 5,63 3,81
2017 Q3 13,59 0,65 12,94 8,30 6,45
2016 9M 9,89 0,26 9,63 4,35 3,62
2017 9M 12,99 0,20 12,79 8,26 5,76
* Hedging operations excluded
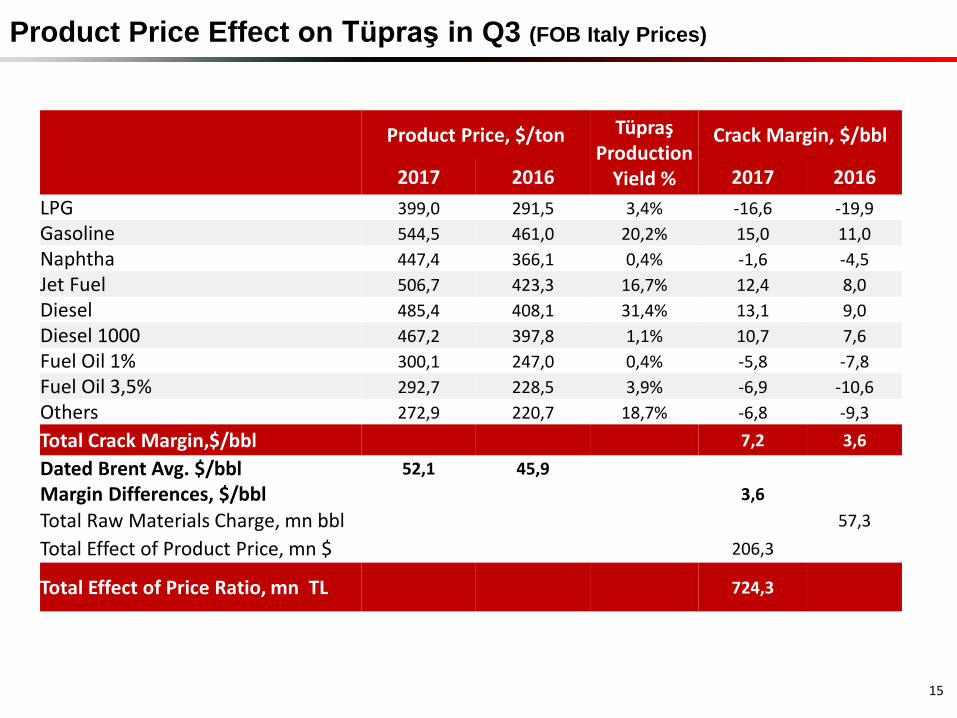
Product Price Effect on Tüpraş in Q3 (FOB Italy Prices)
Product Price, $/ton Tüpraş Production
Yield %
Crack Margin, $/bbl
2017 2016 2017 2016
LPG 399,0 291,5 3,4% -16,6 -19,9
Gasoline 544,5 461,0 20,2% 15,0 11,0
Naphtha 447,4 366,1 0,4% -1,6 -4,5
Jet Fuel 506,7 423,3 16,7% 12,4 8,0
Diesel 485,4 408,1 31,4% 13,1 9,0
Diesel 1000 467,2 397,8 1,1% 10,7 7,6
Fuel Oil 1% 300,1 247,0 0,4% -5,8 -7,8
Fuel Oil 3,5% 292,7 228,5 3,9% -6,9 -10,6
Others 272,9 220,7 18,7% -6,8 -9,3
Total Crack Margin,$/bbl 7,2 3,6
Dated Brent Avg. $/bbl 52,1 45,9
Margin Differences, $/bbl 3,6
Total Raw Materials Charge, mn bbl 57,3
Total Effect of Product Price, mn $ 206,3
Total Effect of Price Ratio, mn TL 724,3
15
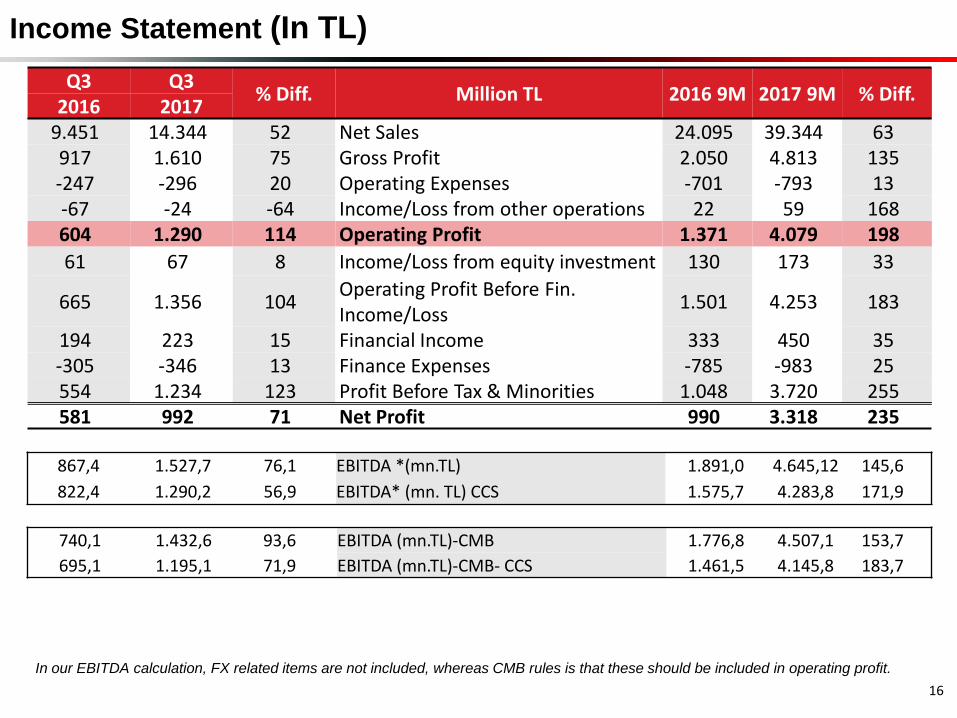
Income Statement (In TL)
Q3 Q3% Diff. Million TL 2016 9M 2017 9M % Diff.
2016 20179.451 14.344 52 Net Sales 24.095 39.344 63917 1.610 75 Gross Profit 2.050 4.813 135-247 -296 20 Operating Expenses -701 -793 13-67 -24 -64 Income/Loss from other operations 22 59 168604 1.290 114 Operating Profit 1.371 4.079 198
61 67 8 Income/Loss from equity investment 130 173 33
665 1.356 104Operating Profit Before Fin. Income/Loss
1.501 4.253 183
194 223 15 Financial Income 333 450 35-305 -346 13 Finance Expenses -785 -983 25554 1.234 123 Profit Before Tax & Minorities 1.048 3.720 255581 992 71 Net Profit 990 3.318 235
In our EBITDA calculation, FX related items are not included, whereas CMB rules is that these should be included in operating profit.
16
867,4 1.527,7 76,1 EBITDA *(mn.TL) 1.891,0 4.645,12 145,6
822,4 1.290,2 56,9 EBITDA* (mn. TL) CCS 1.575,7 4.283,8 171,9
740,1 1.432,6 93,6 EBITDA (mn.TL)-CMB 1.776,8 4.507,1 153,7
695,1 1.195,1 71,9 EBITDA (mn.TL)-CMB- CCS 1.461,5 4.145,8 183,7
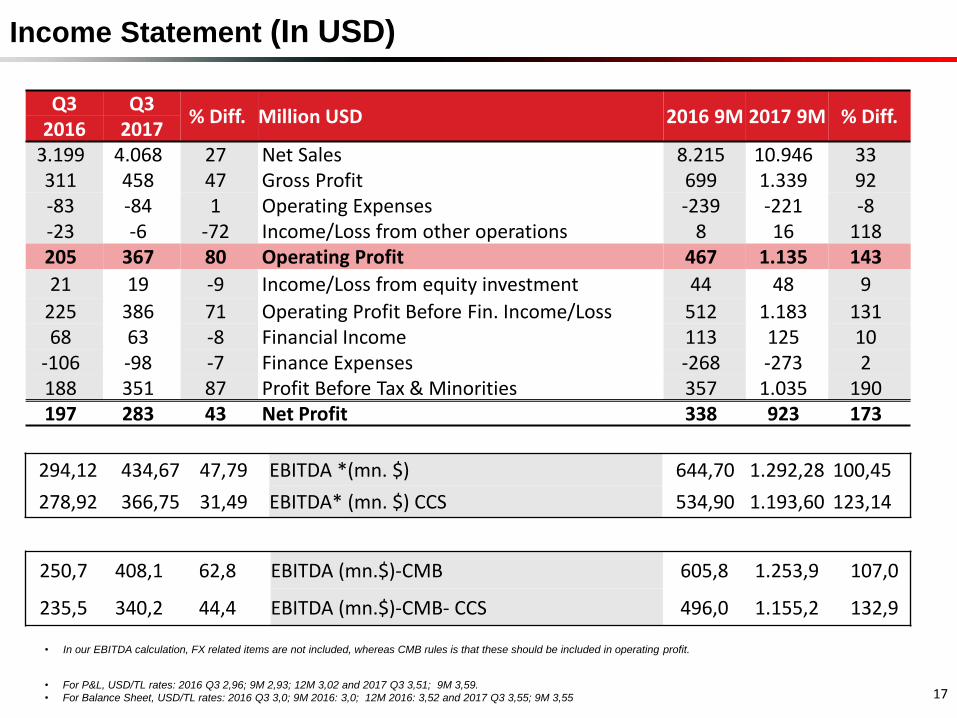
Income Statement (In USD)
Q3 Q3% Diff. Million USD 2016 9M 2017 9M % Diff.
2016 20173.199 4.068 27 Net Sales 8.215 10.946 33311 458 47 Gross Profit 699 1.339 92-83 -84 1 Operating Expenses -239 -221 -8-23 -6 -72 Income/Loss from other operations 8 16 118205 367 80 Operating Profit 467 1.135 143
21 19 -9 Income/Loss from equity investment 44 48 9
225 386 71 Operating Profit Before Fin. Income/Loss 512 1.183 13168 63 -8 Financial Income 113 125 10
-106 -98 -7 Finance Expenses -268 -273 2188 351 87 Profit Before Tax & Minorities 357 1.035 190197 283 43 Net Profit 338 923 173
250,7 408,1 62,8 EBITDA (mn.$)-CMB 605,8 1.253,9 107,0
235,5 340,2 44,4 EBITDA (mn.$)-CMB- CCS 496,0 1.155,2 132,9
• In our EBITDA calculation, FX related items are not included, whereas CMB rules is that these should be included in operating profit.
17• For P&L, USD/TL rates: 2016 Q3 2,96; 9M 2,93; 12M 3,02 and 2017 Q3 3,51; 9M 3,59.
• For Balance Sheet, USD/TL rates: 2016 Q3 3,0; 9M 2016: 3,0; 12M 2016: 3,52 and 2017 Q3 3,55; 9M 3,55
294,12 434,67 47,79 EBITDA *(mn. $) 644,70 1.292,28 100,45
278,92 366,75 31,49 EBITDA* (mn. $) CCS 534,90 1.193,60 123,14
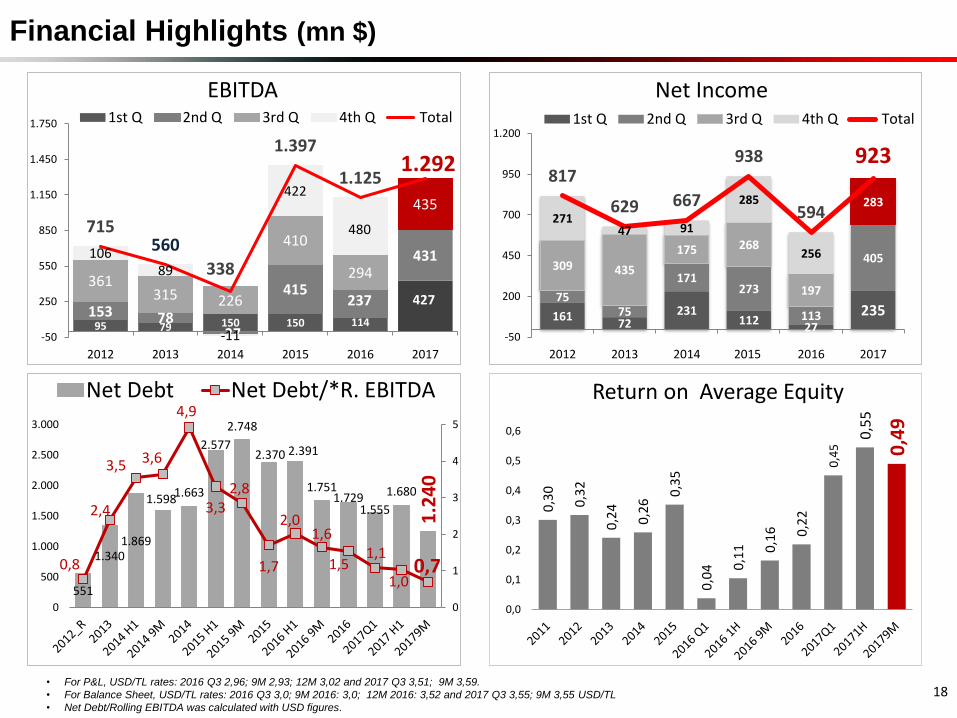
Financial Highlights (mn $)
95 79 150 150 114
427153 78
-27
415237
431
361315 226
410
294
435
10689
-11
422
480715560
338
1.397
1.1251.292
-50
250
550
850
1.150
1.450
1.750
2012 2013 2014 2015 2016 2017
EBITDA1st Q 2nd Q 3rd Q 4th Q Total
16172
231112
27235
7575
171273
113
405309 435
175 268
197
283271
47 91
285
256
817
629 667
938
594
923
-50
200
450
700
950
1.200
2012 2013 2014 2015 2016 2017
Net Income1st Q 2nd Q 3rd Q 4th Q Total
551
1.3401.869
1.5981.663
2.577
2.748
2.370 2.391
1.7511.729
1.555
1.680
1.2
40
0,8
2,4
3,5 3,6
4,9
3,32,8
1,7
2,01,6
1,51,1
1,00,7
0
1
2
3
4
5
0
500
1.000
1.500
2.000
2.500
3.000
Net Debt Net Debt/*R. EBITDA
0,3
0
0,3
2
0,2
4
0,2
6
0,3
5
0,0
4 0,1
1 0,1
6 0,2
2
0,4
5
0,5
5
0,4
9
0,0
0,1
0,2
0,3
0,4
0,5
0,6
Return on Average Equity
18• For P&L, USD/TL rates: 2016 Q3 2,96; 9M 2,93; 12M 3,02 and 2017 Q3 3,51; 9M 3,59.
• For Balance Sheet, USD/TL rates: 2016 Q3 3,0; 9M 2016: 3,0; 12M 2016: 3,52 and 2017 Q3 3,55; 9M 3,55 USD/TL
• Net Debt/Rolling EBITDA was calculated with USD figures.
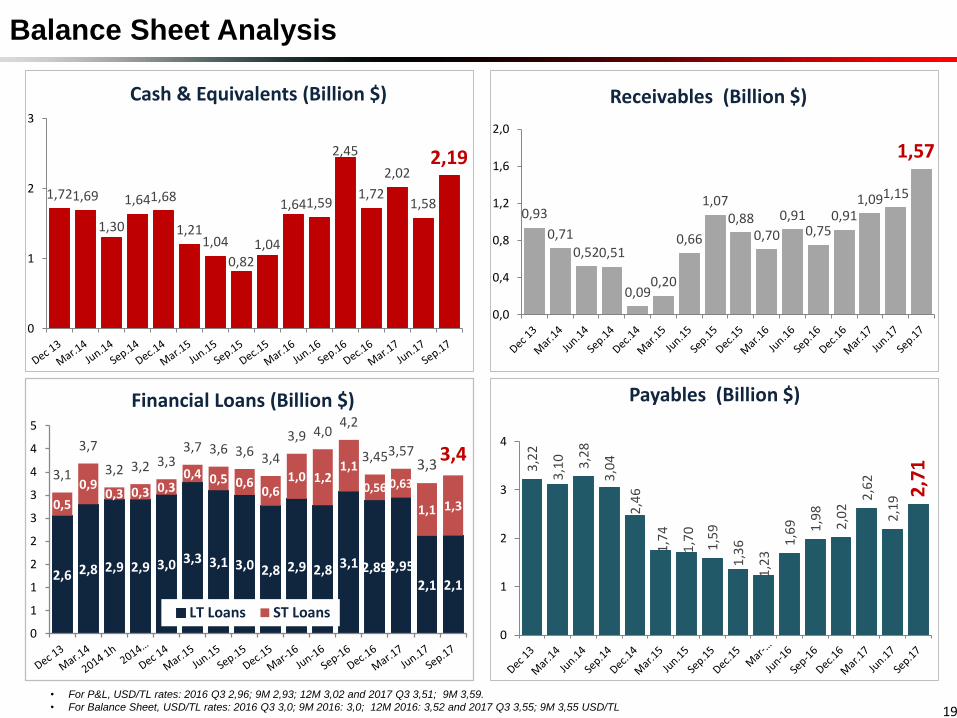
Balance Sheet Analysis
1,721,69
1,30
1,641,68
1,211,04
0,821,04
1,641,59
2,45
1,72
2,02
1,58
2,19
0
1
2
3
Cash & Equivalents (Billion $)
0,93
0,710,520,51
0,090,20
0,66
1,070,88
0,70
0,910,75
0,911,091,15
1,57
0,0
0,4
0,8
1,2
1,6
2,0
Receivables (Billion $)
2,6 2,8 2,9 2,9 3,0 3,3 3,1 3,0 2,8 2,9 2,8 3,1 2,892,95
2,1 2,1
0,5
0,90,3 0,3 0,3
0,4 0,5 0,60,6
1,0 1,21,1
0,56 0,63
1,1 1,3
3,1
3,7
3,2 3,2 3,33,7 3,6 3,6 3,4
3,9 4,04,2
3,453,573,3
3,4
0
1
1
2
2
3
3
4
4
5
Financial Loans (Billion $)
LT Loans ST Loans
3,2
2
3,1
0 3,2
8
3,0
4
2,4
6
1,7
4
1,7
0
1,5
9
1,3
6
1,2
3
1,6
9 1,9
8
2,0
2
2,6
2
2,1
9 2,7
1
0
1
2
3
4
Payables (Billion $)
19• For P&L, USD/TL rates: 2016 Q3 2,96; 9M 2,93; 12M 3,02 and 2017 Q3 3,51; 9M 3,59.
• For Balance Sheet, USD/TL rates: 2016 Q3 3,0; 9M 2016: 3,0; 12M 2016: 3,52 and 2017 Q3 3,55; 9M 3,55 USD/TL
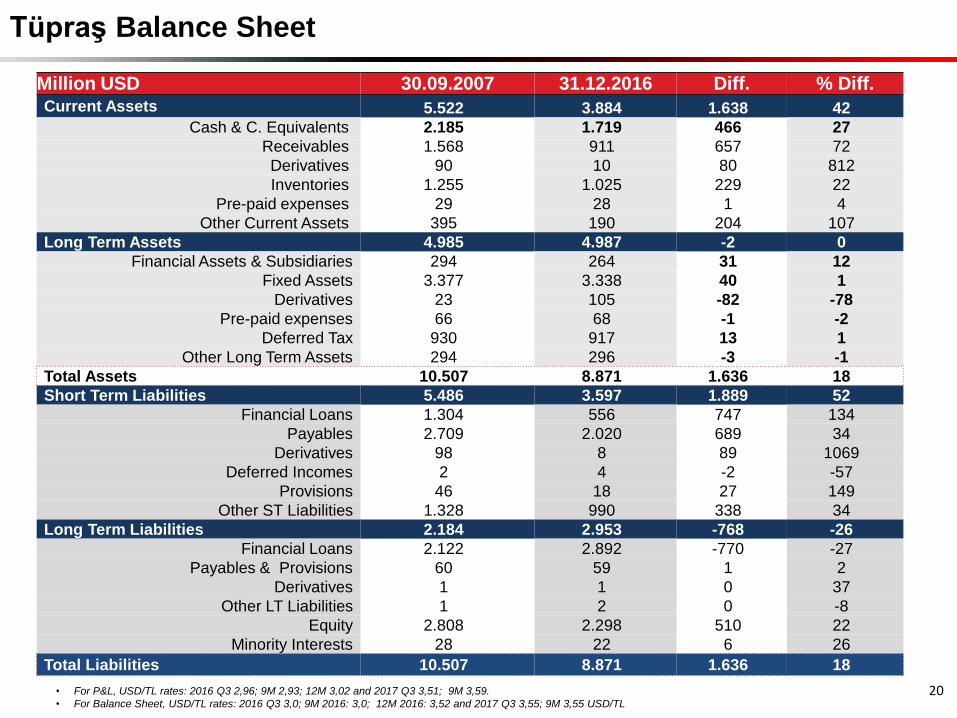
Tüpraş Balance Sheet
20• For P&L, USD/TL rates: 2016 Q3 2,96; 9M 2,93; 12M 3,02 and 2017 Q3 3,51; 9M 3,59.
• For Balance Sheet, USD/TL rates: 2016 Q3 3,0; 9M 2016: 3,0; 12M 2016: 3,52 and 2017 Q3 3,55; 9M 3,55 USD/TL
Million USD 30.09.2007 31.12.2016 Diff. % Diff.Current Assets 5.522 3.884 1.638 42
Cash & C. Equivalents 2.185 1.719 466 27
Receivables 1.568 911 657 72
Derivatives 90 10 80 812
Inventories 1.255 1.025 229 22
Pre-paid expenses 29 28 1 4
Other Current Assets 395 190 204 107
Long Term Assets 4.985 4.987 -2 0
Financial Assets & Subsidiaries 294 264 31 12
Fixed Assets 3.377 3.338 40 1
Derivatives 23 105 -82 -78
Pre-paid expenses 66 68 -1 -2
Deferred Tax 930 917 13 1
Other Long Term Assets 294 296 -3 -1
Total Assets 10.507 8.871 1.636 18
Short Term Liabilities 5.486 3.597 1.889 52
Financial Loans 1.304 556 747 134
Payables 2.709 2.020 689 34
Derivatives 98 8 89 1069
Deferred Incomes 2 4 -2 -57
Provisions 46 18 27 149
Other ST Liabilities 1.328 990 338 34
Long Term Liabilities 2.184 2.953 -768 -26
Financial Loans 2.122 2.892 -770 -27
Payables & Provisions 60 59 1 2
Derivatives 1 1 0 37
Other LT Liabilities 1 2 0 -8
Equity 2.808 2.298 510 22
Minority Interests 28 22 6 26
Total Liabilities 10.507 8.871 1.636 18
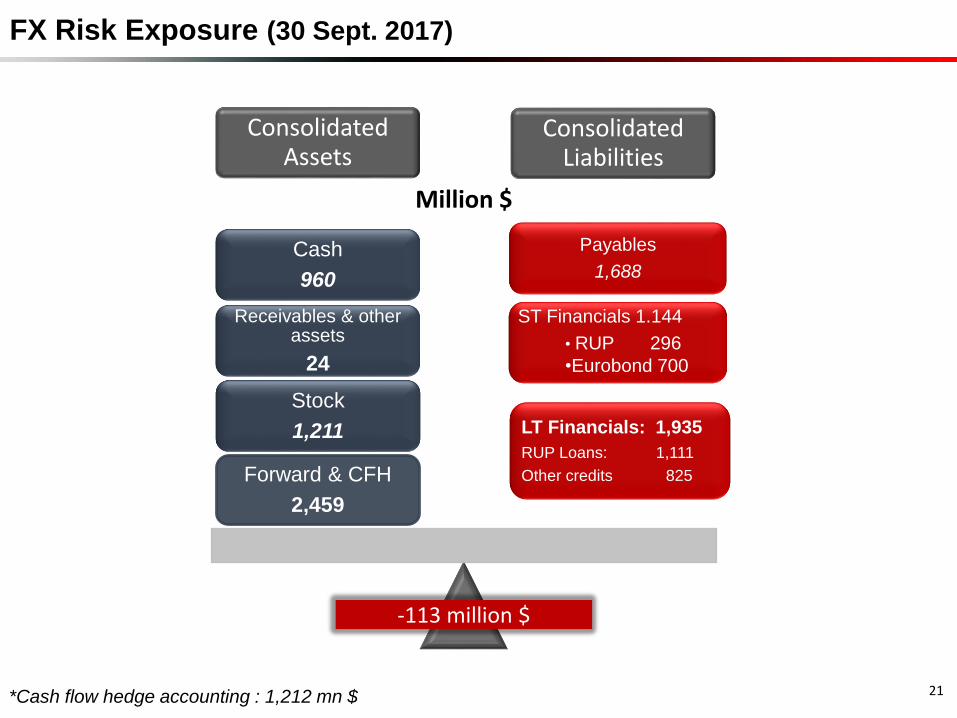
FX Risk Exposure (30 Sept. 2017)
*Cash flow hedge accounting : 1,212 mn $
Consolidated Assets
Consolidated Liabilities
LT Financials: 1,935
RUP Loans: 1,111
Other credits 825
ST Financials 1.144
• RUP 296
•Eurobond 700
Payables
1,688
Forward & CFH
2,459
Stock
1,211
Receivables & other assets
24
Cash
960
Million $
-113 million $
21
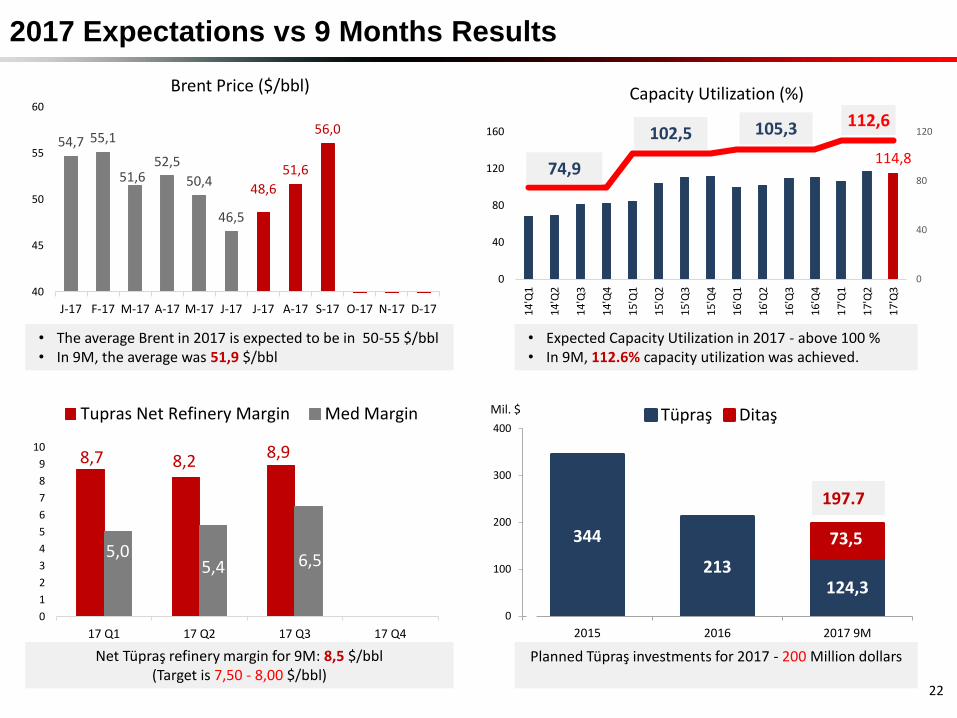
8,7 8,2 8,9
5,05,4 6,5
0
1
2
3
4
5
6
7
8
9
10
17 Q1 17 Q2 17 Q3 17 Q4
Tupras Net Refinery Margin Med Margin
2017 Expectations vs 9 Months Results
54,7 55,1
51,652,5
50,4
46,5
48,6
51,6
56,0
40
45
50
55
60
J-17 F-17 M-17 A-17 M-17 J-17 J-17 A-17 S-17 O-17 N-17 D-17
Brent Price ($/bbl)
114,8
0
40
80
120
0
40
80
120
160
14
'Q1
14
'Q2
14
'Q3
14
'Q4
15
'Q1
15
'Q2
15
'Q3
15
'Q4
16
'Q1
16
'Q2
16
'Q3
16
'Q4
17
'Q1
17
'Q2
17
'Q3
Capacity Utilization (%)
• The average Brent in 2017 is expected to be in 50-55 $/bbl• In 9M, the average was 51,9 $/bbl
• Expected Capacity Utilization in 2017 - above 100 %• In 9M, 112.6% capacity utilization was achieved.
Net Tüpraş refinery margin for 9M: 8,5 $/bbl(Target is 7,50 - 8,00 $/bbl)
344
213124,3
73,5
0
100
200
300
400
2015 2016 2017 9M
Tüpraş Ditaş
Planned Tüpraş investments for 2017 - 200 Million dollars
74,9
102,5 105,3 112,6
197.7
Mil. $
22
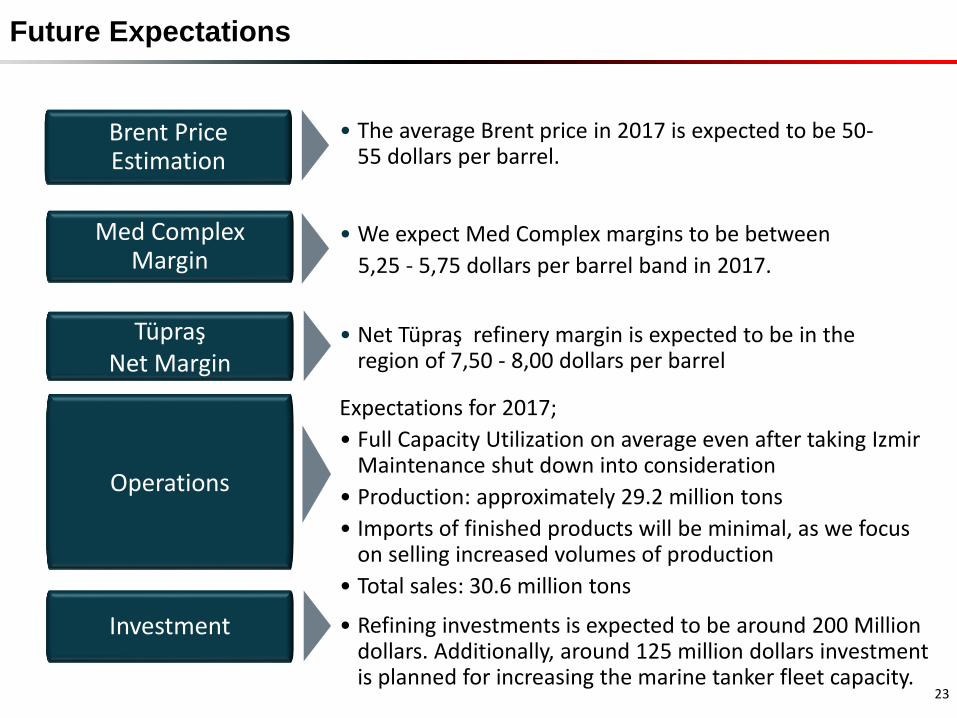
Future Expectations
Brent Price Estimation
• The average Brent price in 2017 is expected to be 50-55 dollars per barrel.
Med Complex Margin
• We expect Med Complex margins to be between
5,25 - 5,75 dollars per barrel band in 2017.
Tüpraş Net Margin
• Net Tüpraş refinery margin is expected to be in the region of 7,50 - 8,00 dollars per barrel
Operations
Expectations for 2017;
• Full Capacity Utilization on average even after taking IzmirMaintenance shut down into consideration
• Production: approximately 29.2 million tons
• Imports of finished products will be minimal, as we focus on selling increased volumes of production
• Total sales: 30.6 million tons
Investment • Refining investments is expected to be around 200 Million dollars. Additionally, around 125 million dollars investment is planned for increasing the marine tanker fleet capacity.
23
Disclaimer
This presentation contains forward-looking statements that reflect the Company
management’s current views with respect to certain future events. Although it is
believed that the expectations reflected in these statements are reasonable, they may
be affected by a variety of variables and changes in underlying assumptions that could
cause actual results to differ materially.
Neither Tüpraş nor any of its directors, managers or employees nor any other person
shall have any liability whatsoever for any loss arising from use of this presentation.
24
Extras
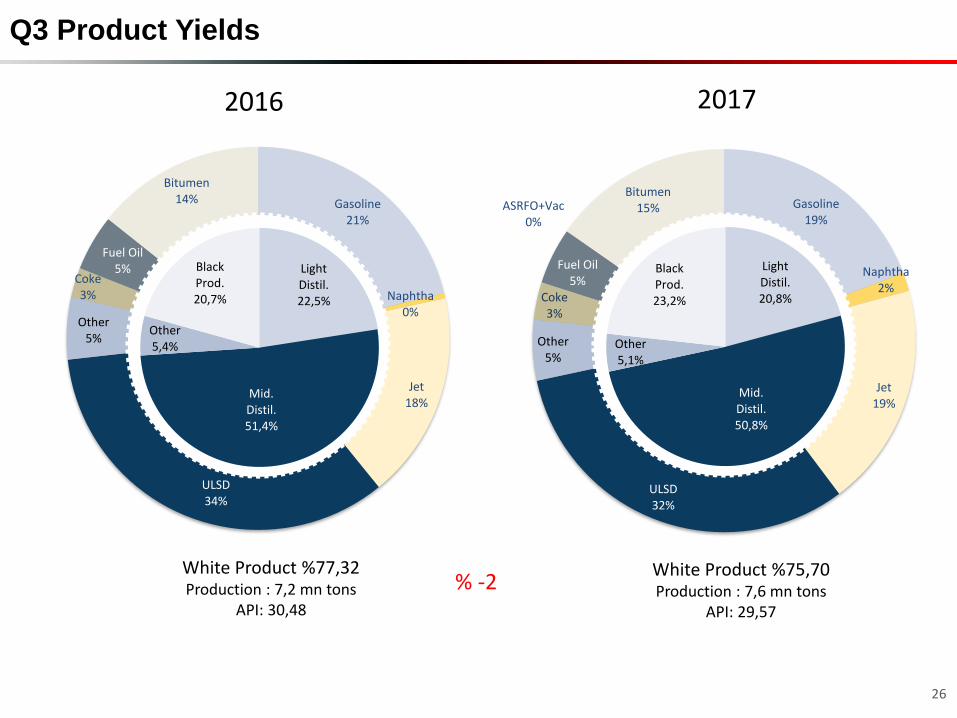
Gasoline19%
Naphtha2%
Jet19%
ULSD32%
Other5%
Coke3%
Fuel Oil5%
ASRFO+Vac0%
Bitumen15%Gasoline
21%
Naphtha0%
Jet18%
ULSD34%
Other5%
Coke3%
Fuel Oil5%
Bitumen14%
Q3 Product Yields
26
Light Distil.22,5%
Mid. Distil.51,4%
Other 5,4%
Black Prod.20,7%
White Product %75,70Production : 7,6 mn tons
API: 29,57
White Product %77,32Production : 7,2 mn tons
API: 30,48
% -2
20172016
Light Distil.20,8%
Mid. Distil.50,8%
Other 5,1%
Black Prod.23,2%
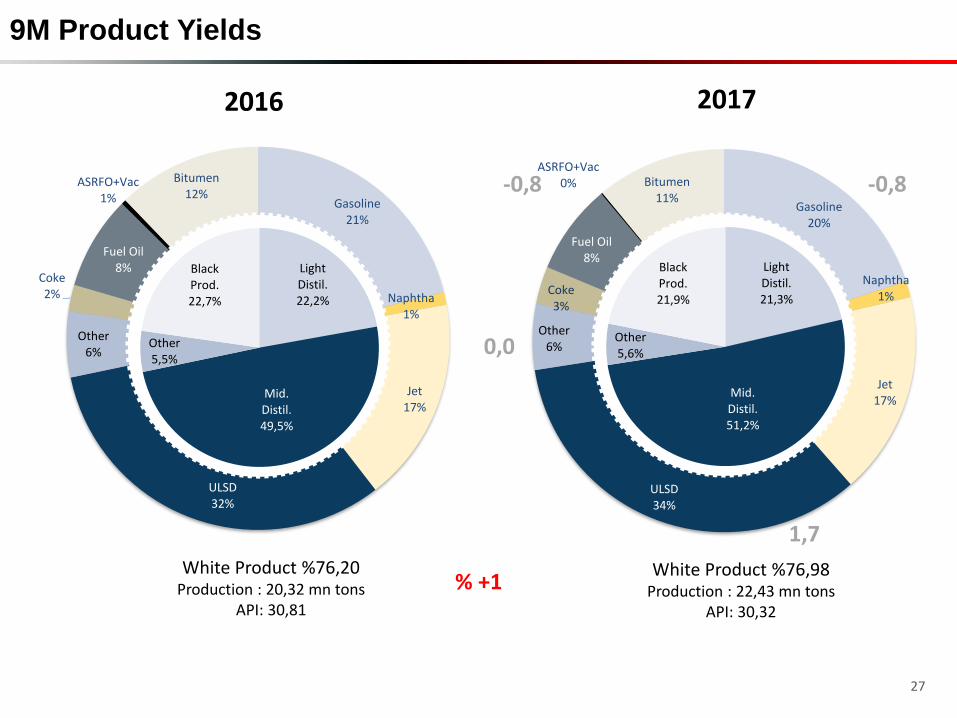
Gasoline20%
Naphtha1%
Jet17%
ULSD34%
Other6%
Coke3%
Fuel Oil8%
ASRFO+Vac0% Bitumen
11%Gasoline21%
Naphtha1%
Jet17%
ULSD32%
Other6%
Coke2%
Fuel Oil8%
ASRFO+Vac1%
Bitumen12%
9M Product Yields
27
Light Distil.22,2%
Mid. Distil.49,5%
Other 5,5%
Black Prod.22,7%
White Product %76,98Production : 22,43 mn tons
API: 30,32
White Product %76,20Production : 20,32 mn tons
API: 30,81
% +1
20172016
1,7
0,0
Light Distil.21,3%
Mid. Distil.51,2%
Other 5,6%
Black Prod.21,9%
-0,8 -0,8
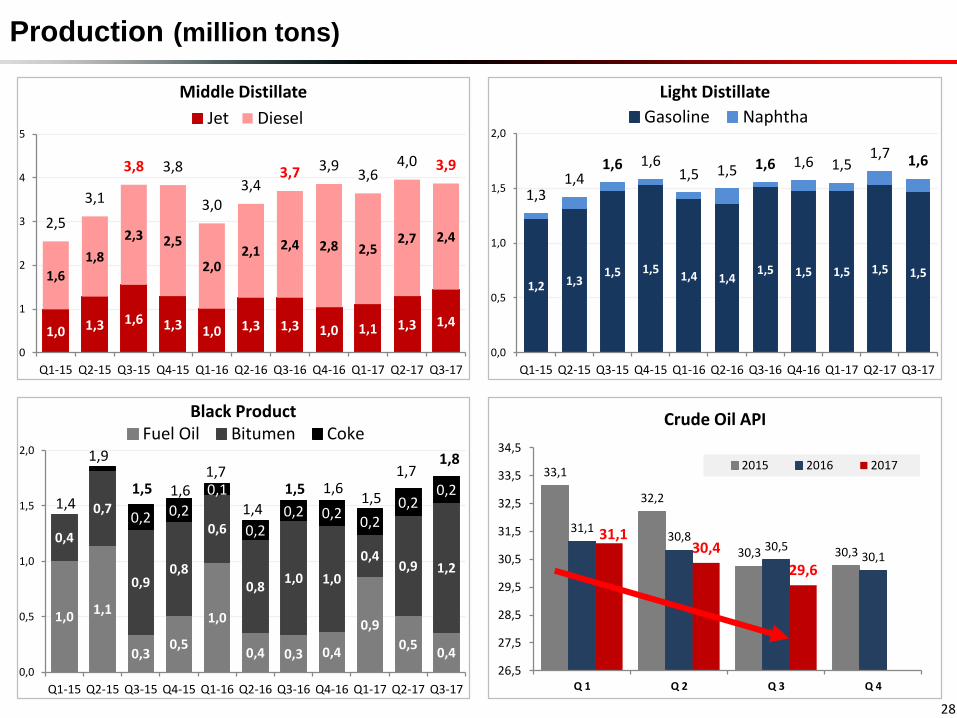
Production (million tons)
1,0 1,3 1,6 1,3 1,0 1,3 1,3 1,0 1,1 1,3 1,4
1,6
1,8
2,3 2,5
2,02,1 2,4 2,8 2,5
2,7 2,42,5
3,1
3,8 3,8
3,03,4
3,7 3,93,6
4,0 3,9
0
1
2
3
4
5
Q1-15 Q2-15 Q3-15 Q4-15 Q1-16 Q2-16 Q3-16 Q4-16 Q1-17 Q2-17 Q3-17
Middle Distillate
Jet Diesel
1,01,1
0,30,5
1,0
0,4 0,3 0,4
0,9
0,50,4
0,4
0,7
0,90,8
0,6
0,81,0 1,0
0,40,9 1,2
0,2 0,2
0,1
0,20,2 0,2
0,20,2
0,21,4
1,9
1,5 1,61,7
1,4
1,5 1,61,5
1,71,8
0,0
0,5
1,0
1,5
2,0
Q1-15 Q2-15 Q3-15 Q4-15 Q1-16 Q2-16 Q3-16 Q4-16 Q1-17 Q2-17 Q3-17
Black ProductFuel Oil Bitumen Coke
33,1
32,2
30,3 30,3
31,130,8
30,530,1
31,130,4
29,6
26,5
27,5
28,5
29,5
30,5
31,5
32,5
33,5
34,5
Q 1 Q 2 Q 3 Q 4
Crude Oil API
2015 2016 2017
28
1,2 1,31,5 1,5
1,4 1,41,5 1,5 1,5 1,5 1,5
1,31,4
1,6 1,61,5 1,5 1,6 1,6 1,5
1,7 1,6
0,0
0,5
1,0
1,5
2,0
Q1-15 Q2-15 Q3-15 Q4-15 Q1-16 Q2-16 Q3-16 Q4-16 Q1-17 Q2-17 Q3-17
Light Distillate
Gasoline Naphtha
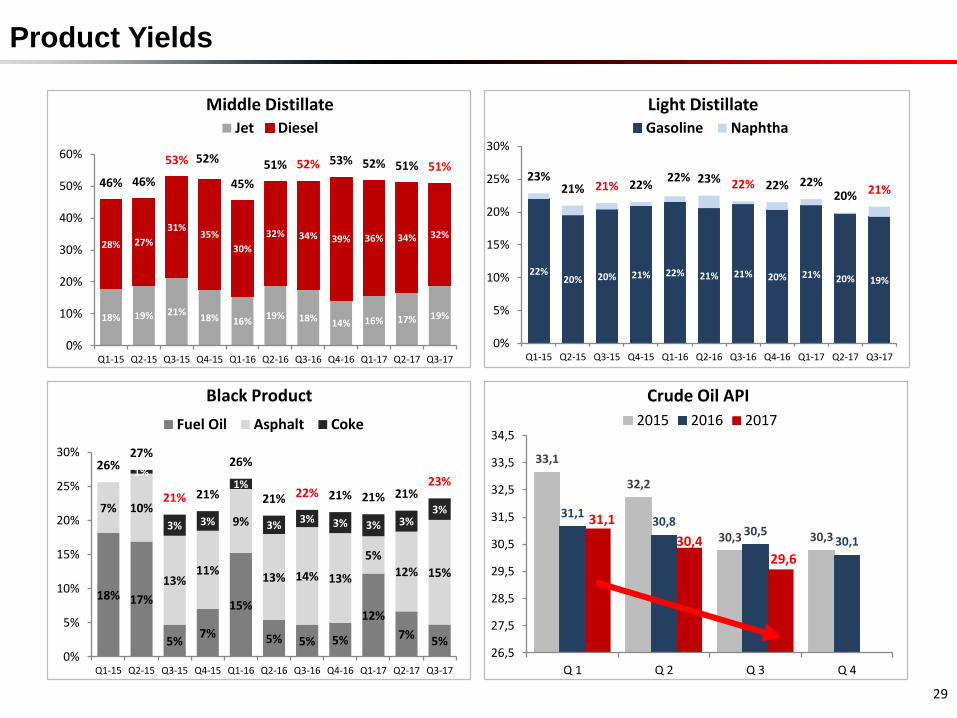
Product Yields
18% 19% 21%18% 16%
19% 18% 14% 16% 17% 19%
28% 27%
31%35%
30%
32% 34% 39% 36% 34% 32%
46% 46%
53% 52%
45%
51% 52% 53% 52% 51% 51%
0%
10%
20%
30%
40%
50%
60%
Q1-15 Q2-15 Q3-15 Q4-15 Q1-16 Q2-16 Q3-16 Q4-16 Q1-17 Q2-17 Q3-17
Middle DistillateJet Diesel
22%20% 20% 21% 22% 21% 21% 20% 21% 20% 19%
23%21% 21% 22%
22% 23% 22% 22% 22%20% 21%
0%
5%
10%
15%
20%
25%
30%
Q1-15 Q2-15 Q3-15 Q4-15 Q1-16 Q2-16 Q3-16 Q4-16 Q1-17 Q2-17 Q3-17
Light DistillateGasoline Naphtha
18% 17%
5%7%
15%
5% 5% 5%
12%
7% 5%
7% 10%
13%11%
9%
13% 14% 13%
5%
12% 15%
1%
3% 3%
1%
3%3% 3% 3% 3%
3%
26%27%
21% 21%
26%
21% 22% 21% 21% 21%23%
0%
5%
10%
15%
20%
25%
30%
Q1-15 Q2-15 Q3-15 Q4-15 Q1-16 Q2-16 Q3-16 Q4-16 Q1-17 Q2-17 Q3-17
Black Product
Fuel Oil Asphalt Coke
33,1
32,2
30,3 30,3
31,130,8
30,530,1
31,1
30,429,6
26,5
27,5
28,5
29,5
30,5
31,5
32,5
33,5
34,5
Q 1 Q 2 Q 3 Q 4
Crude Oil API
2015 2016 2017
29
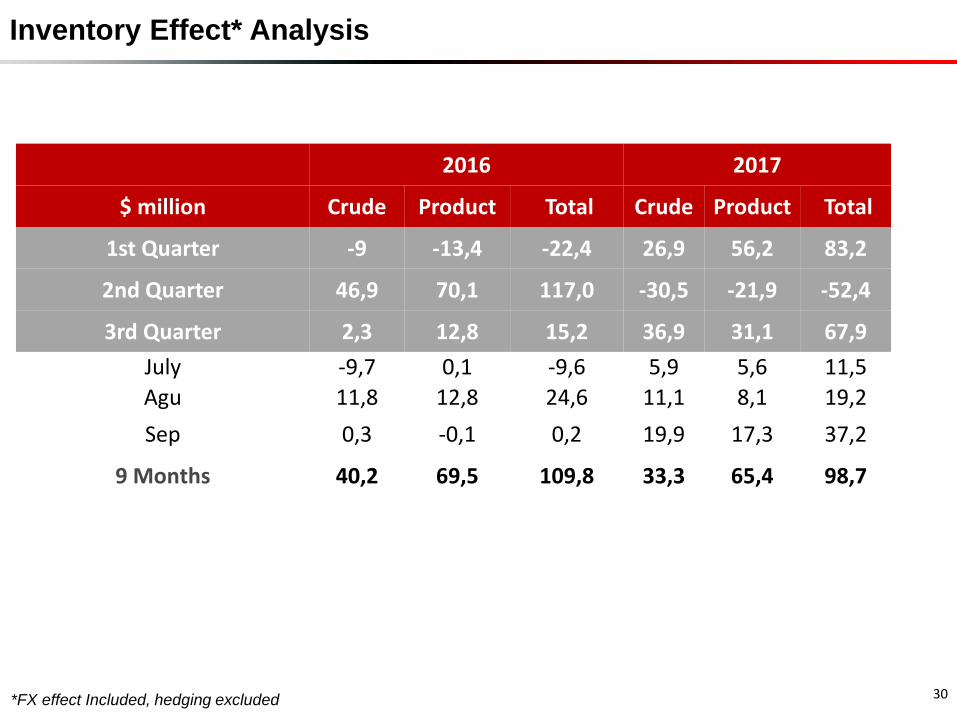
Inventory Effect* Analysis
*FX effect Included, hedging excluded 30
2016 2017
$ million Crude Product Total Crude Product Total
1st Quarter -9 -13,4 -22,4 26,9 56,2 83,2
2nd Quarter 46,9 70,1 117,0 -30,5 -21,9 -52,4
3rd Quarter 2,3 12,8 15,2 36,9 31,1 67,9
July -9,7 0,1 -9,6 5,9 5,6 11,5
Agu 11,8 12,8 24,6 11,1 8,1 19,2
Sep 0,3 -0,1 0,2 19,9 17,3 37,2
9 Months 40,2 69,5 109,8 33,3 65,4 98,7
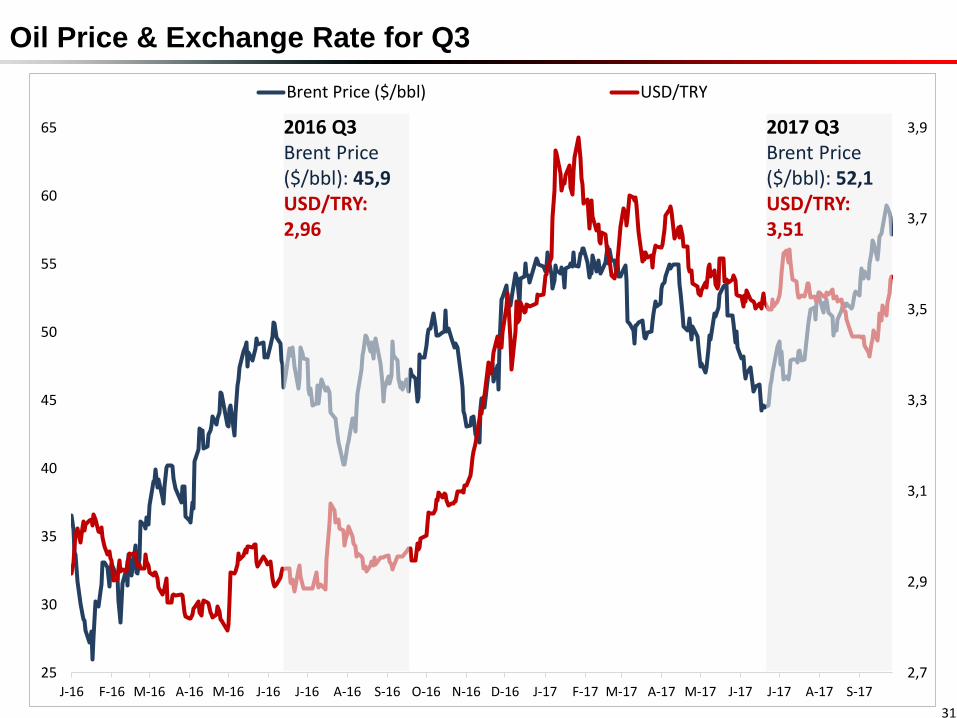
Oil Price & Exchange Rate for Q3
31
2,7
2,9
3,1
3,3
3,5
3,7
3,9
25
30
35
40
45
50
55
60
65
J-16 F-16 M-16 A-16 M-16 J-16 J-16 A-16 S-16 O-16 N-16 D-16 J-17 F-17 M-17 A-17 M-17 J-17 J-17 A-17 S-17
Brent Price ($/bbl) USD/TRY
2016 Q3Brent Price($/bbl): 45,9USD/TRY: 2,96
2017 Q3Brent Price($/bbl): 52,1USD/TRY: 3,51
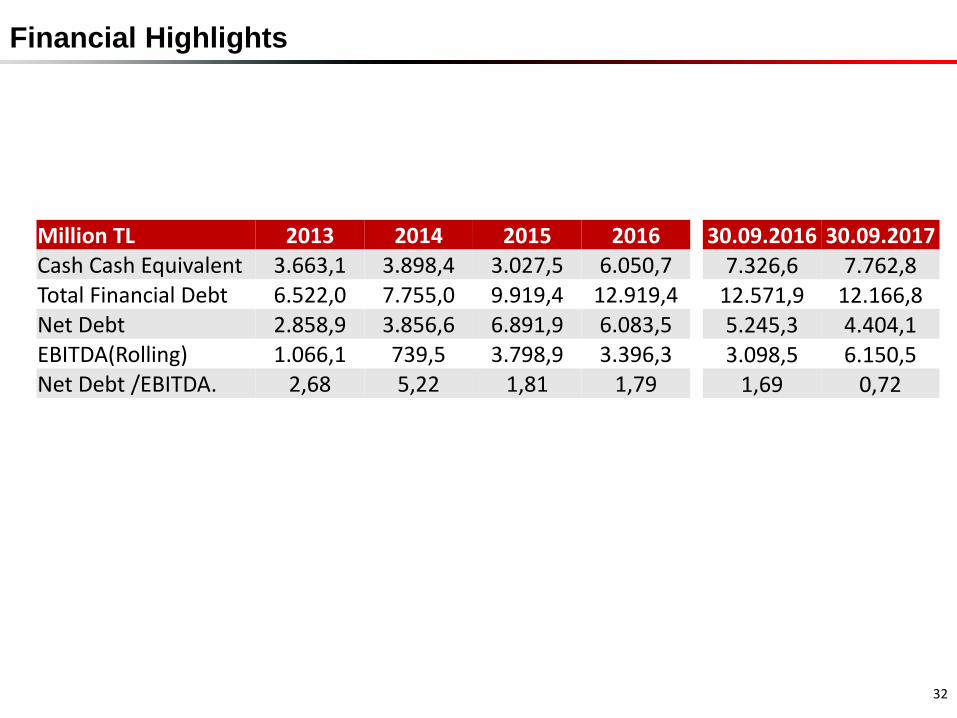
Financial Highlights
32
Million TL 2013 2014 2015 2016 30.09.2016 30.09.2017Cash Cash Equivalent 3.663,1 3.898,4 3.027,5 6.050,7 7.326,6 7.762,8Total Financial Debt 6.522,0 7.755,0 9.919,4 12.919,4 12.571,9 12.166,8Net Debt 2.858,9 3.856,6 6.891,9 6.083,5 5.245,3 4.404,1EBITDA(Rolling) 1.066,1 739,5 3.798,9 3.396,3 3.098,5 6.150,5Net Debt /EBITDA. 2,68 5,22 1,81 1,79 1,69 0,72
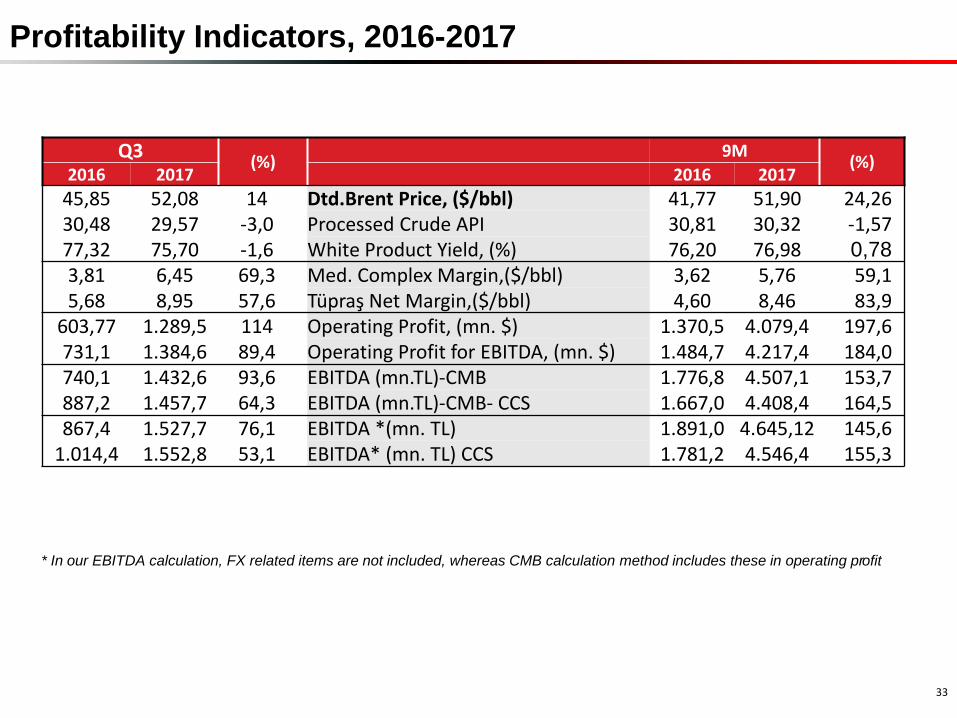
Profitability Indicators, 2016-2017
* In our EBITDA calculation, FX related items are not included, whereas CMB calculation method includes these in operating profit
33
Q3(%)
9M(%)
2016 2017 2016 2017
45,85 52,08 14 Dtd.Brent Price, ($/bbl) 41,77 51,90 24,2630,48 29,57 -3,0 Processed Crude API 30,81 30,32 -1,5777,32 75,70 -1,6 White Product Yield, (%) 76,20 76,98 0,78
3,81 6,45 69,3 Med. Complex Margin,($/bbl) 3,62 5,76 59,15,68 8,95 57,6 Tüpraş Net Margin,($/bbl) 4,60 8,46 83,9
603,77 1.289,5 114 Operating Profit, (mn. $) 1.370,5 4.079,4 197,6731,1 1.384,6 89,4 Operating Profit for EBITDA, (mn. $) 1.484,7 4.217,4 184,0740,1 1.432,6 93,6 EBITDA (mn.TL)-CMB 1.776,8 4.507,1 153,7887,2 1.457,7 64,3 EBITDA (mn.TL)-CMB- CCS 1.667,0 4.408,4 164,5867,4 1.527,7 76,1 EBITDA *(mn. TL) 1.891,0 4.645,12 145,6
1.014,4 1.552,8 53,1 EBITDA* (mn. TL) CCS 1.781,2 4.546,4 155,3
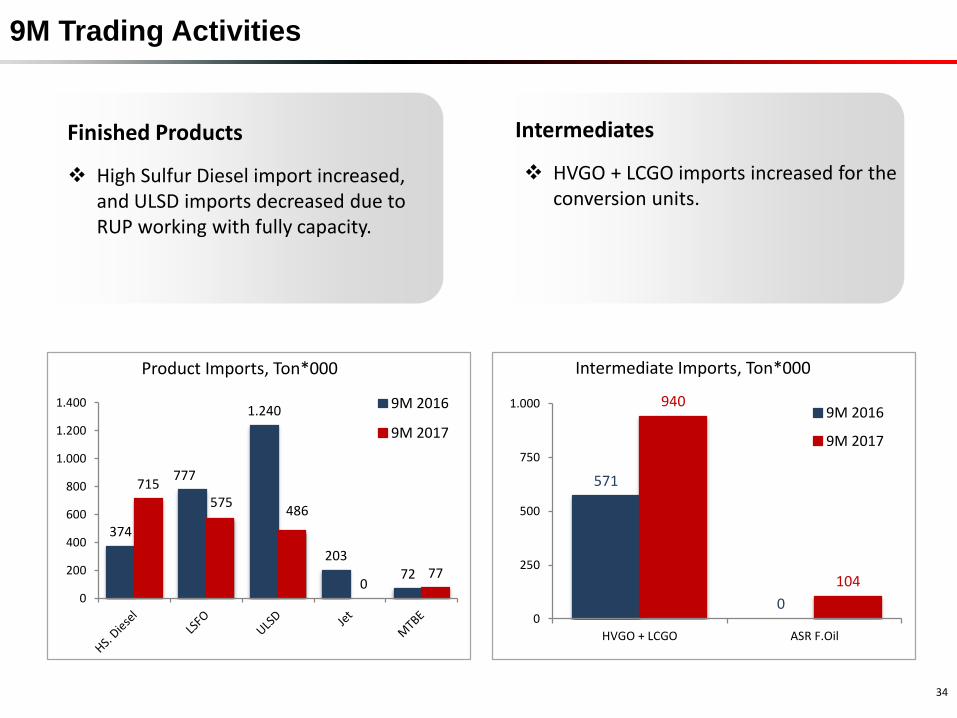
9M Trading Activities
374
777
1.240
20372
715575
486
077
0
200
400
600
800
1.000
1.200
1.400
Product Imports, Ton*000
9M 2016
9M 2017
571
0
940
104
0
250
500
750
1.000
HVGO + LCGO ASR F.Oil
Intermediate Imports, Ton*000
9M 2016
9M 2017
Finished Products
High Sulfur Diesel import increased, and ULSD imports decreased due to RUP working with fully capacity.
Intermediates
HVGO + LCGO imports increased for the conversion units.
34