resources commission - forests, lands, natural … · resources commission ... entire? for rhe use...
TRANSCRIPT
RESOURCES COMMISSION Background Papers - Volume 6
Preliminary Assessment of Forest Related Tourism Values - Woodbay Consulting Group Limited
Adventure Travel and Land Use -Pacific North Consulting
The views e.rpressed in independent reporrs prepored for rhe foresr Resources Commission ore rhose of rhe ourhors ond nor necessuri/v rhose ofrhe Commission. They ore published in rheir entire? for rhe use ond inreresr of rhe public os background studies 10 the April 1991 Reporr of rhe Commission 10 rhe Minisrer of Foresrs.
British Columbia Forest Resource Commission
Preliminary Assessment of
Forestry Related Tourism Values
December 1989
1.0
2.0
3.0
4.0
5.0
6.0
7.0
8.0
9.0
10.0
AN EVALUATION OF TOURISM AND RECREATION IN RELATION TO
FOREST LAND
TABLE OF CONTENTS
INTRODUCTION . . . . . . . . . . . . . . . . . . . . . . . . . . . . . . . . . . . . . . 1
TOURISM INDUSTRY BENCHMARKS . . . . . . . . . . . . . . . . . . . . . . . 1
APPROACH AND METHODOLOGY . . . . . . . . . . . . . . . . . . . . . . . . 2
CONSIDERATIONS . ... . . . . . . . . . . . . . . . . . . . . . . . . . . . . . . . . . . 3
FOREST RECREATION LAND MANAGEMENT . . . . . . . . . . . . . . . . . 6
IDENTIFIABLE BENCHMARKS . . . . . . . . . . . . . . . . . . . . . . . . . . . . 8 6.1 Tourism Industry Benchmarks - Rovincial 8 6.2 Out of Province Visitors 8 6.3 Tourism Industry Benchmarks - By Region 9
ECONOMIC INDICATORS . . . . . . . . . . . . . . . . . . . . . . . . . . . . . . . 10
8.1 Ratios FORESTRY RELATED TOURISM . . . . . . . . . . . . . . . . . . . . . . . . . . . 12
12 8.2 F u m Volumes 13
DATA DEFICIENCIES . . . . . . . . . . . . . . . . . . . . . . . . . . . . . . . . . . . 14
IMPLICATIONS . . . . . . . . . . . . . . . . . . . . . . . . . . . . . . . . . . . . . . . 16
APPENDIX D - 1 :
List of References 17
AN EVALUATION OF TOURISM AND RECREATION IN RELATION TO
FOREST LAND
1.0 INTRODUCTION
The task of measuring the economic impact of tourism and recreation related to forest land requires a careful assessment of available data. identification of information gaps and development of the appropriate manix of value indicators. The reference material rrquircd for establishing the value of forestry is available and sufficiently accurate to develop economic impact statements.
Tourism and m a t i o n material consists mostly of raw data without a legacy of consistent values for economic analysis purposes. These values can be established through a system of data =view, appropriate factoring and experienced assumptions. The first step in this process is to establish Tourism Industry Benchmarks.
The purpose of the assessment is to conduct a preliminary review of current data, identify data deficiencies and develop the best estimates at this stage of the value of forestry related tourism and m a t i o n . No new source data has been created for the purpose of this review.
2.0 TOURISM INDUSTRY BENCHMARKS
Statistics on tourism in British Columbia are primarily gathered by user s w e y s of non- resident and resident visitors travelling within the Province. This information does not provide regional or area spxific values in terms of the volumes of the travelling and vacationing public or the value of their expenditures. These values must be established in order to accurately determine when visitors go and what they do in the Rovince. These basic reference levels are refemd to as Benchmarks.
Tourism industry benchmarks, when assembled and analyzed provide the best possible value of tourism based on the number of visitors, their length of stay, expenditures, navel characteristics and many other factors including traffic flows, seasonabilty and additional data such as attendance at major atnactions and changing navel pnfexcnces. This information is assembled to include resident as well as non-resident visitors and resident day trippen (excursionists).
Without the benchmarks it is not possible to determine the number of tourists going to certain areas at different times of the year.
Once the benchmarks are established the figures can be ve&led and retined as new data becomes available. The benchmarks can be projected to indicate future volumes and mnds and used for economic analysis to determine value added, employment, taxation yields, linkages and multiplier effects.
- 1 - I
I
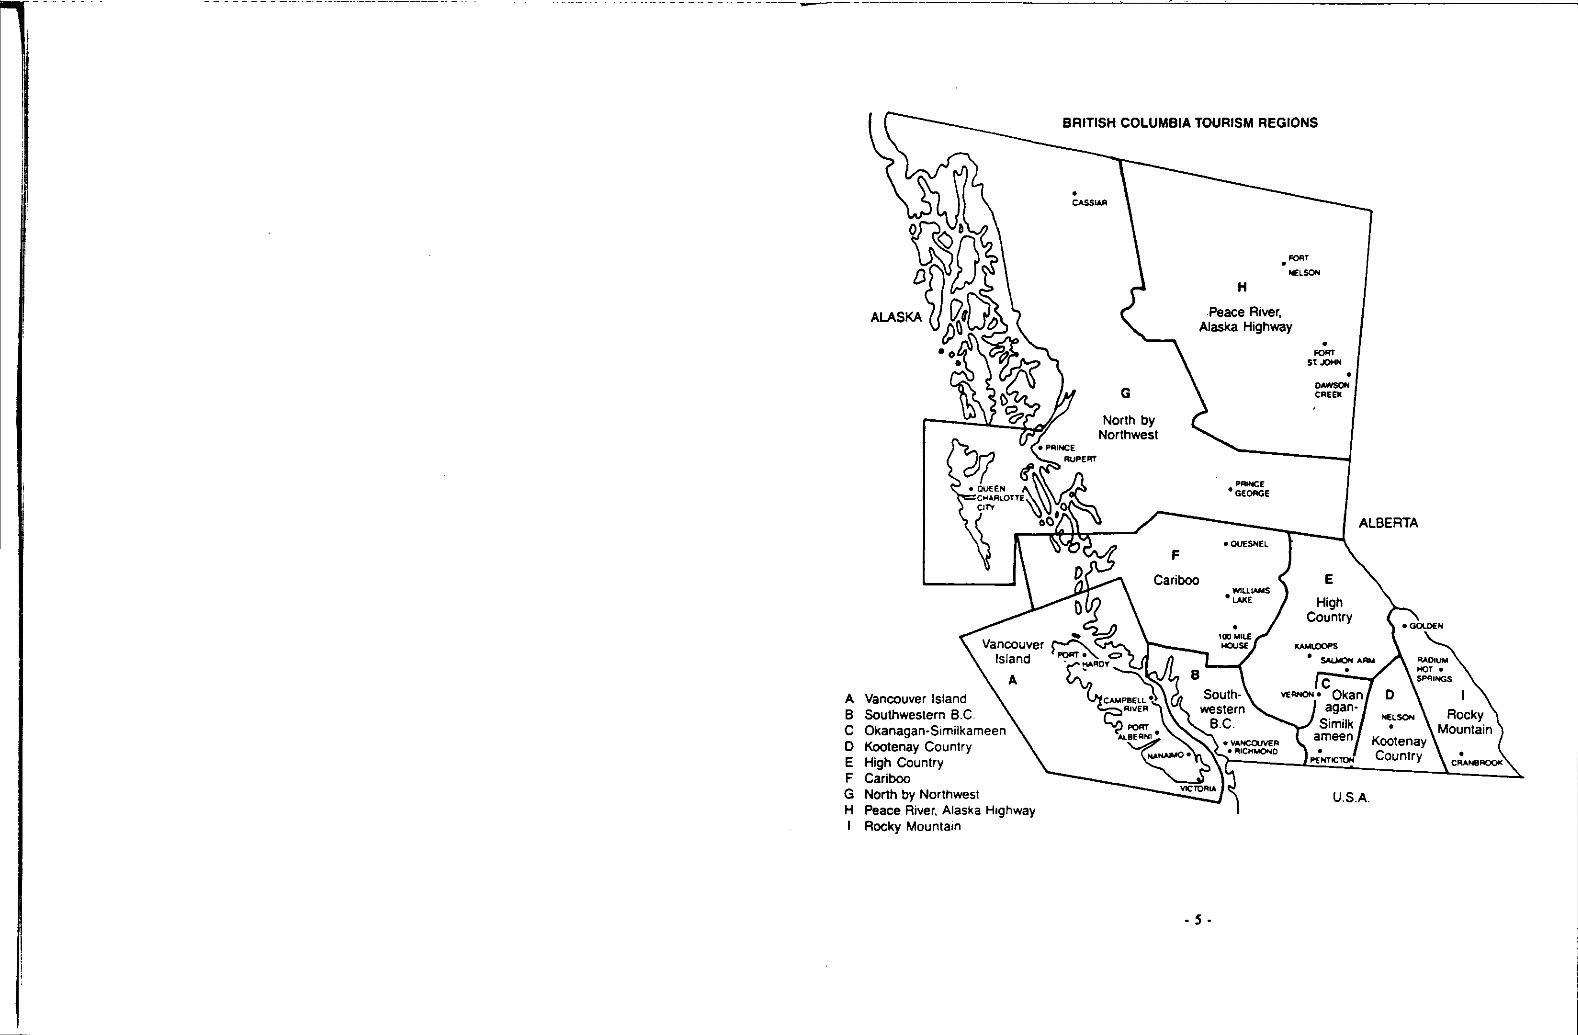
A Vancouver Island B Southwestern B.C.
D Kootenay Country E High Country F C a r i b G North by Northwest H Peace River, Alaska Highway I Rocky Mountam
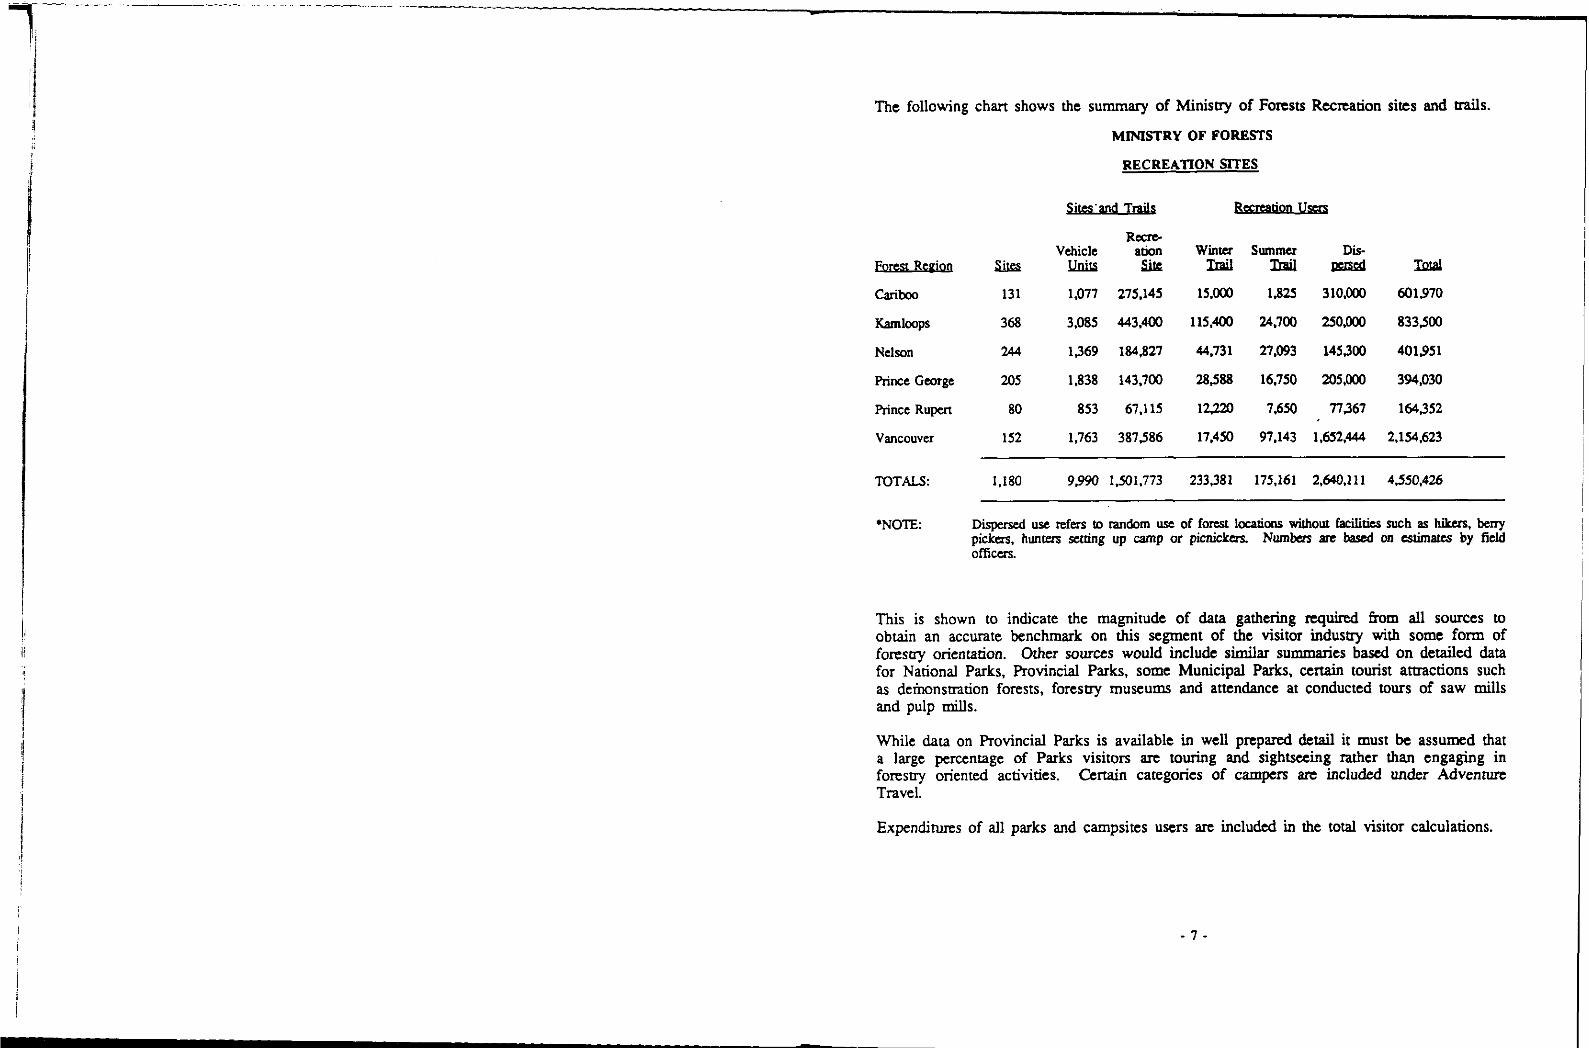
The following chart shows the summary of Minisay of Forests Recxeation sites and trails.
MINISTRY OF FORESTS
RECREATION SITES
. . &g and Tra&
RCCrc- Vehicle
m llnirr etion si&
131 1.077 275.145
368 3.085 443.400
244 1369 184,827
205 1.838 143.700
80 853 61,115
152 1.763 387,586
Winter Summu Dis- Trail T r a i l r m d Tptal
I5.ooO 1.825 310.000 601970
115,400 24,700 250,000 833,500
44.731 27.093 145300 401951
28,588 16,750 205,ooO 394,030
12320 7650 77367 164352
17,450 97.143 1.652.444 2,154,623 ~~
1.180 9990 1.501.773 233.381 175.161 2.640.111 4.550.426
Disperwd use refers to random usc of forest locatiw without facilities such as hikers. berry pickas. hunters setting up camp or picnickers. Numbas arc based on wimatcs by field O f f i c a S .
This is shown to indicate the magnitude of data gathering required from all sources to obtain an accurate benchmark on this segment of the visitor industry with some form of forestry orientation. Other sources would include similar summaries based on detailed data for National Parks, Provincial Parks, some Municipal Park, certain tourist amactions such as dcinonsuation forests, forestry museums and attendance at conducted fours of saw mills and pulp mil ls .
While data on Provincial Parks is available in well prepared detail it must be assumed that
forestry oriented activities. Certain categories of campers an included under Advennut a large percentage of Parks visitors are touring and sightseeing rather than engaging in
Travel.
Expendims of all parks and campsites users arc included in the total visitor calculations.
- 7 -
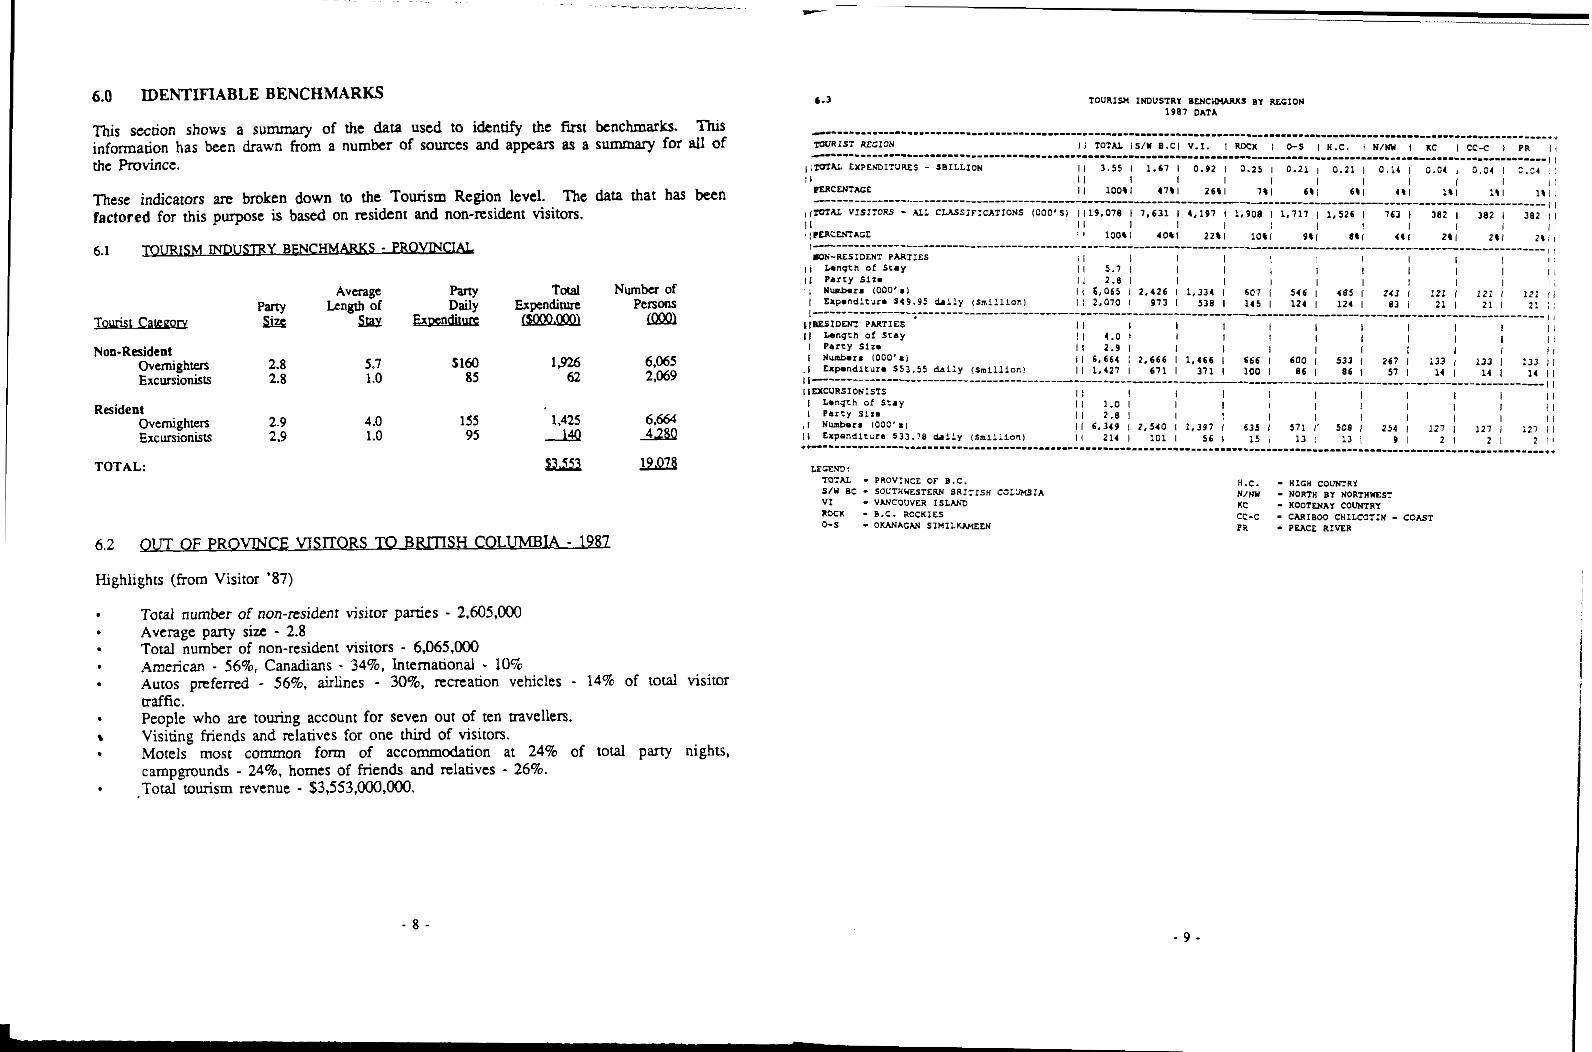
I 6.0 IDENTIFIABLE BENCHMARKS
This section shows a summary of the data used to idenhfy the first benchmarks. l h s information has been drawn from a number of sources and appears as a s u m m a r y for all of the Provinct.
These indicators are broken down to the Tourism Region level. The data that has been factored for this purpose is based on resident and non-resident visitors.
6.1 m m -
Non-Resident Overnighten 2.8 5.7 5160 1926 6,065 Excursionists 2.8 1.0 85 62 2,069
Resident Overnighten 2.9 4 .O 155 1.425 6.664 Excursionists 2.9 1 .o 95 3 A2.N
TOTAL: Lib22 m
6.2 2 7 0 IA - Highlights (from Visitor '87)
Total number of non-resident visitor parties - 2,605,000 Average pany size - 2.8 Total number of non-resident visitors - 6,065,000 American - 56%, Canadians . 34%. International - 10% Autos preferred - 56%, airlines - 30%, recreation vehicles - 14% of total visitor traffic.
* People who are touring account for seven out of ten uavellers. Visiting fnends and relatives for one third of visitors. Motels most common form of accommodation at 24% of total party nights, campgrounds - 2470, homes of friends and relatives - 26%.
.Total tourism revenue - $3,553.000,000.
b-3
"".""""""""""""""""""""""""""""""."""""""""""""""""""""""""""""*~ W R I S T RTCION I I TOTAL I S / * a.cI V.I. I ROCK I 0-5 I H . C . I NINV I KC I cc-c I PR I , """"""""""__________________I_""""""""""""""""""""""""""""...""""""""""""~~ 1
I1 3.55 I 1.67 I 0.92 I 0.25 I 0.21 I 0.21 I 0.14 I 0.04 I 3.04 I : . ? k 1 1 1 I I 10041 4111 2611
I I I I I I I I I 1 1 71 I 61 I 61 I 4 1 1 I* I 1% I 141 I
, I T O S U V I S I I O R S - ALL C W S I F I U I I O N S 1000'51 1119,078 I 7,631 I 4,197 I 1,908 I 1,117 I 1.526 I 163 I 382 I 382 I 382 1 1 / I
1 1 I ~PERCENIAGE
I 1 1 8 10041 4011 2211 1011 941 E11 4 4 1
I I I I I I I I I ' 8
21 I 24 I 2 4 i ,
I IWAL EXPENDITURES - SBILLIOH :I
PTRCDiTACE
I""__"""""""""""""""""""""""""""""""""""""""""""~.""""""""""""""
.ON-RESIDENT PARTIES l i I I I I I I I I I I , 1 ,
U n g c h of S t a y I I 5.7 I 11 Pllcy SIZ. 1 1 2.8 I
I I 1 I I I I I I 1
; Numb.r. 1000's) I I I I I I I I 8 1
I 1 C.065 I 2,426 I 1,334 I 607 I 546 I 485 i 243 I I21 1 121 1 1Zi 1 1 1 Elp.ndltuI. 5 4 9 . 9 5 dally (SmIlllonl 1 1 2,070 I 913 I 538 I 145 I 124 I 124 I 83 I 21 I 21 I 2: I :
/ , [IESIDENI PhRTICS I1 I I
! I 4.0 1 I I I I I I I I 1 1 I I I I I I I I1
I 1 2.9 I I I I I I I I i : I I / 6,664 I 2,666 I 1.466 I 666 I 600 I 533 i 267 I 133 i 133 I I33 l i
.I EXP"d1tY I . 553 .55 da1:y (Smllllonl 1 1 1,427 I 611 I 311 I 100 I 86 I 86 I 51 I 14 I I4 I 14 I1
IIEXCURSIOHISTS I I I I I I I1
I1 1.0 I I I I I I I I 1
I I I I I I I / I I1 2 . 8 I
,I N u m h r s IO00'.1 i I I I I I I I I1
I/ Expsndlcure 533.78 d a l l y (Sm1:llonI **""""""""""""""""""""""""""""""""""""""""""""""""""""""""."""""",. 1 ' 214 I 101 I 5 6 1 1 5 1 1 3 1 1 3 1 9 1 2 1 2 1 2 ! I
[ I Lmlrth Of s t a y I P.ICY SlZ. I N h r s 1000'.1
1 L e n g t h of s t a y I Party 511.
I I 6.349 i 2,S40 I 1,397 I 635 I 571 I' s3a I 2s1 I 127 I 127 1 121 I I
LEGEND : TOTAL - PROVINCE OF B.C. S/Y BC - s o u T n m s T E m BRITISH COLLMBIA VI - VUiCOUVER I S M D ROCK - B.C. ROCKIES 0-5 - O K A N A G U S I U I L K U E E N
H.C. - HIGH C O W R Y N / W - NORTH BY NORTHWEST
CC-C - CARIB00 CHILCOTIN - COAST KC - KOOTLNAY C O W R Y
PR - PEACE RIVER
- 9 -
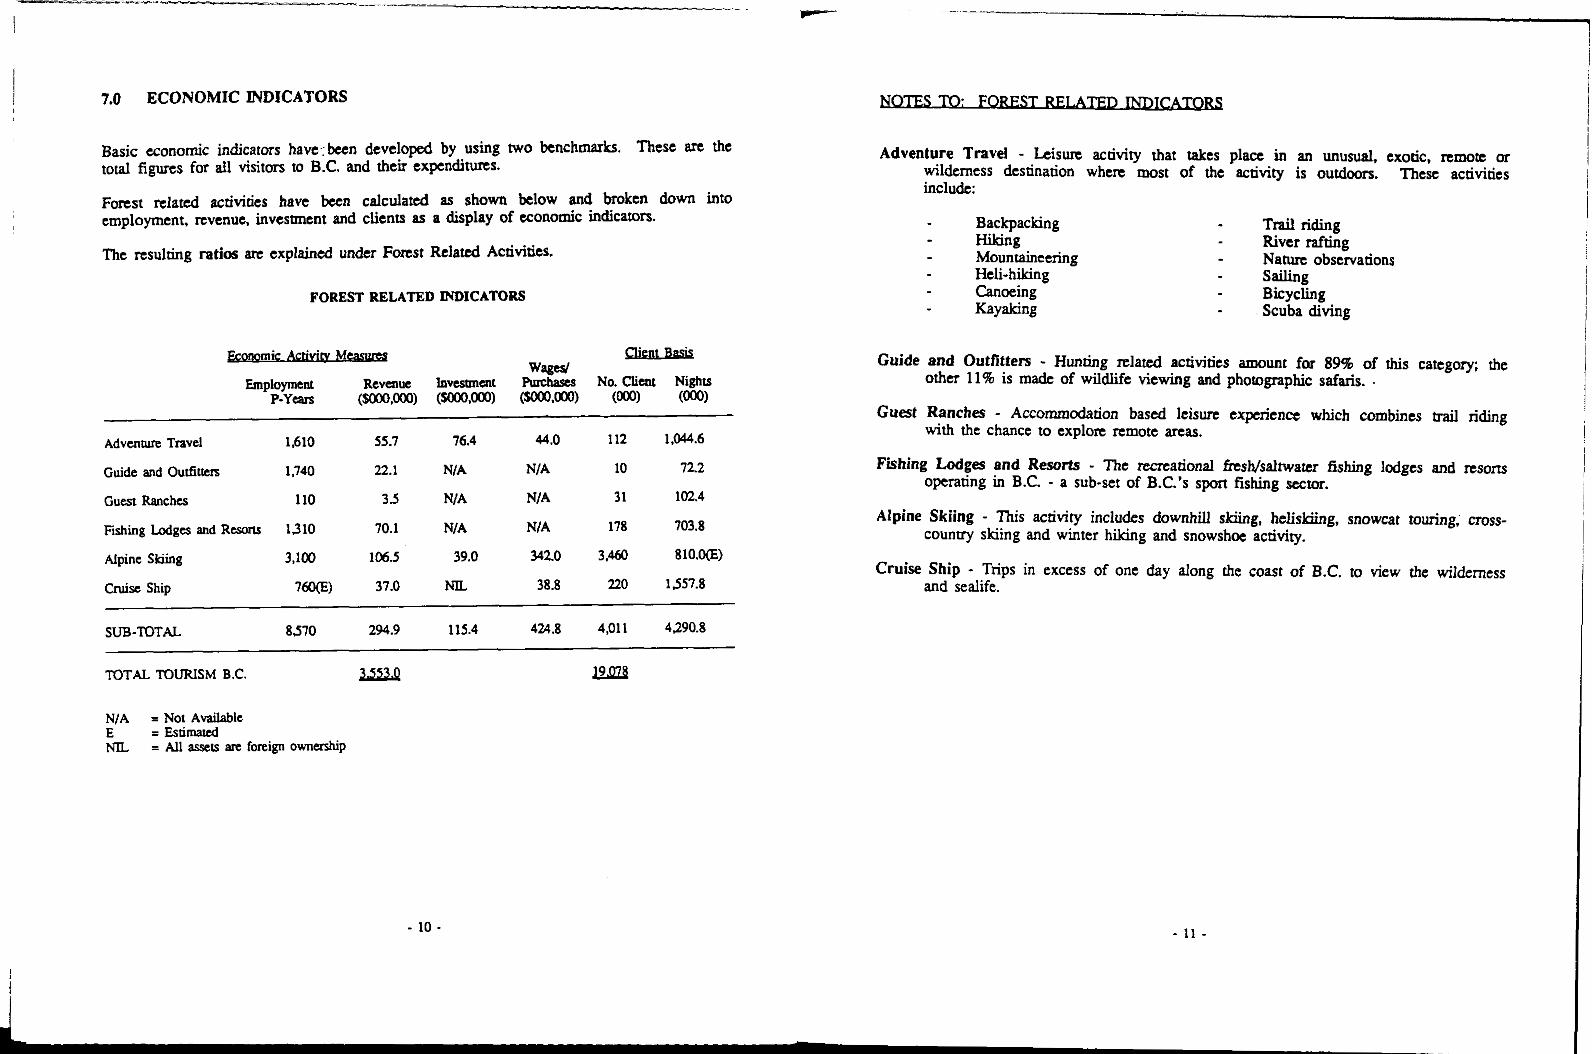
7.0 ECONOMIC INDICATORS
Basic economic indicators have.:been developed by using two benchmarks. These arc the total figures for all visitors to B.C. and their expenditures.
Forest related activities have been calculated as shown below and broken down into employment, revenue, investment and clients as a display of economic indicators.
The resulting ratios an explained under Forest Related Activities.
FOREST' RELATED INDICATORS
. . &momlc Am- W % d
Employment ~evenue hvcstmcnt Pudases No. Clian Nights P-Years (so0o.m) (so0o.m) (so0o.m) ( o w (m)
Adventure Travel 1.610 55.7 76.4 44.0
Guide and Outfittw 1,740 22.1 NIA NIA 10
Guest Ranches 110 3 5 NIA NIA 31
Fishing Lodges and Rtsonr, 1310 70.1 NIA NIA 178
Alpine Skiing 3,100 106.5 39.0 342.0 3.460 810.o(E)
Cruise Ship 7 W ) 37.0 NIL 38.8 220
112 1,044.6
72.2
102.4
703.8
1557.8
SUB-TOTAL 8370 294.9 115.4 424.8 4,011 4290.8
TOTAL TOURISM B.C. L5.m Em3
- 10 -
Adventure Travel - Leisure activity that takes place in an unusual. exotic, remote or wilderness destination where most of the activity is outdoors. These activities includc
Backpacking - Hiking - Mountaineering - Heli-hiking - Canoeing - Kayaking
- Trail riding River rafting - Nature observations
- sailing - Bicycling - Scuba diving
Guide and Outfitters - Hunting related activities amount for 89% of this category; the other 11% is made of wildlife viewing and photographic safaris. .
Guest Ranches - Accommodation based leisun experience which combines trail riding with the chance to explore remote arcas.
Fishing Lodges and Resorts - The recnational hsNsaltwatcr fishing lodges and resons operating in B.C. - a sub-set of B.C.'s sport fishing sector.
Alpine Skiing - This activity includes downhill skiing, heliskiing, snowcat touring; cross- country skiing and winter hiking and snowshoe activity.
Cruise Ship - Trips in excess of one day along the coast of B.C. to view the wilderness and sealife.
- 11 -
i 8.0 FORESTRY RELATED.:TOURISM 8.2 FUTURE VOLUMES
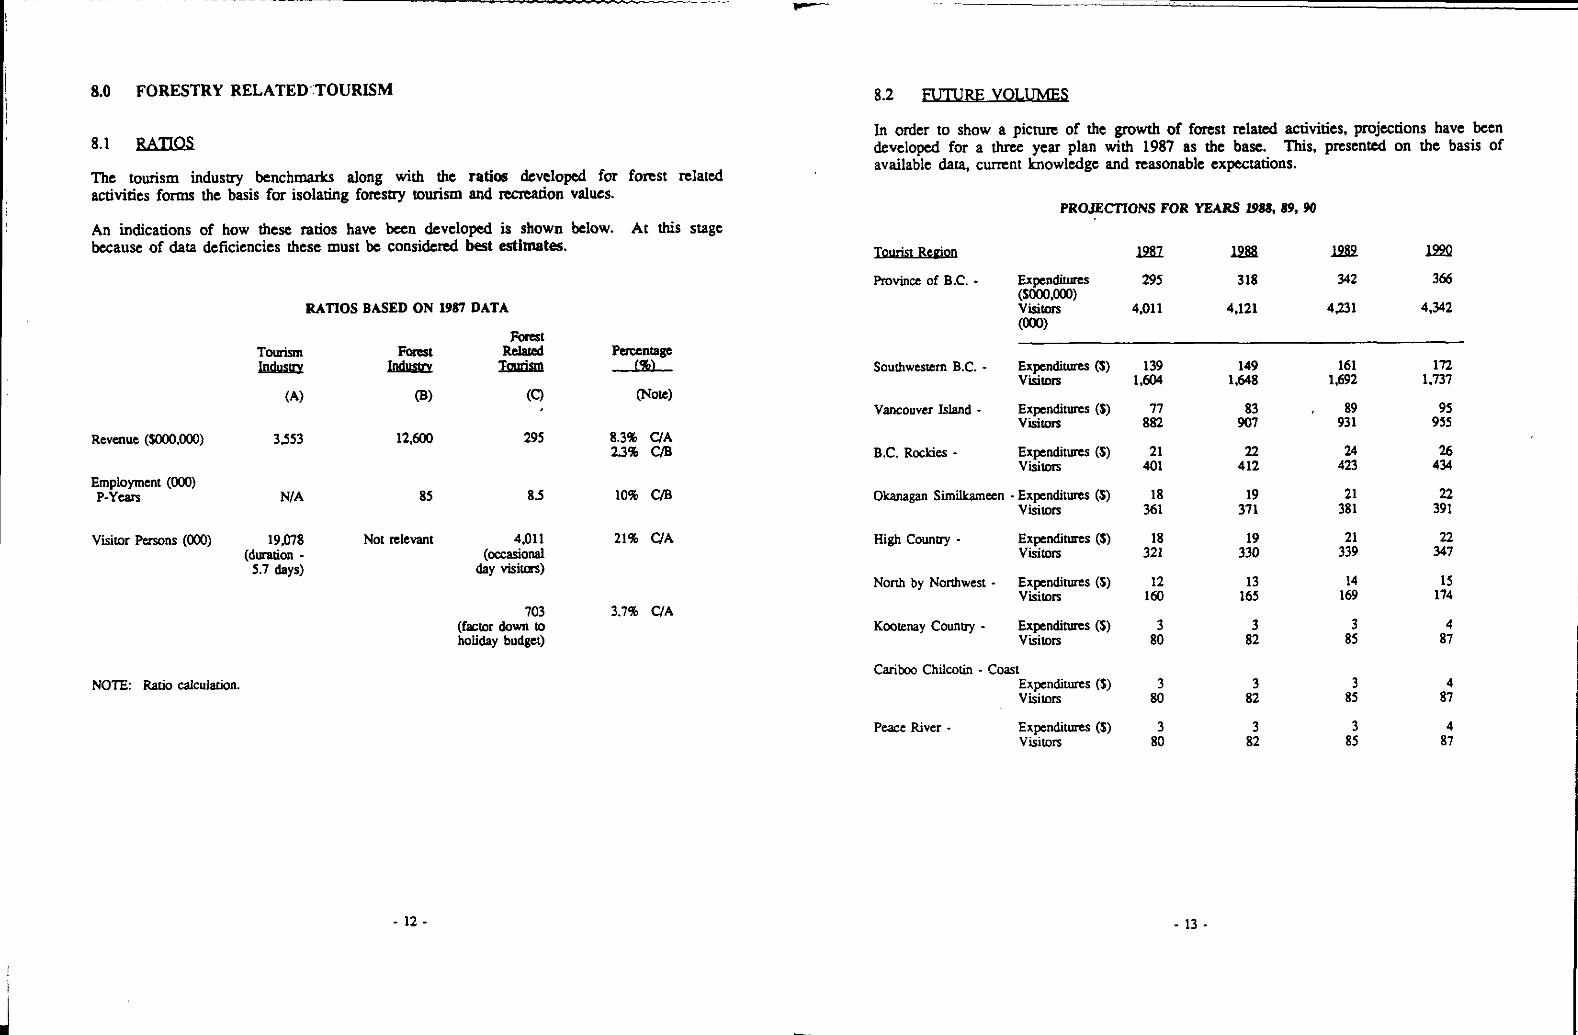
8.1 RAnOS The tourism industry benchmarks along with the ratios developed for foxest related activities forms the basis for isolating forestry tourism and reatation values.
An indications of how these ratios have been developed is shown below. At this stage because of data deficiencies these must be considered best estimates.
Revenue (so00,OOO) 3553 12,600 295
Employment (OOO) P-Ycan NIA 85 8 5
Visitor Pasons (OOO) 19fJ78 Not relevant 4,011 (OCCaFiOnal
day visitors) (duration -
5.7 days)
(factor down to 703
holiday budget)
NOT!? Ratio dcularion.
8.3% U A 23% C/B
10% CB
21% CIA
3.7% U A
In order to show a picture of the growth of f a s t related activities. projections have been developed for a three year plan with 1987 as the base. This, presented on the basis of available data, c a n t knowledge and reasonable expectations.
PROJECTIONS FOR YEARS W88,89,90
Rovin~e of B.C. - Expendiuues ( S O O O , ~ '
295
vim (OOo)
"_, 4.011
318
4.121
366
4.342
Southwestern B.C. - Expenditures (S) 139 149 161 172 Visitors 1.604 1,648 1.692 1.737
vancouvw Island - Expcnditures (S) 77 Visiton 862
B.C. Rockies - Expenditures (S) 21 ViSiUXS 401
83 907
, 89 931
412 22
423 24
955 9s
434 26
Okanagan Sirnilkameen - Expcnditures (S) 18 19 21 22 Visitors 361 37 1 38 1 391
High counay - Expenditures (S) 18 19 21 22 Visitors 321 330 339 347
Nonh by Nonhwest - Expenditures (5) 12 Visitors 160 165
13 169 14
174 15
KW~CMY Country - Expenditures ($1 3 3 3 4 Visitors 80 82 85 87
Carib00 Chilcotin - Coast Expenditures (S) 3 3 3 4 Visitors 80 82 85 87
Peace River . Expenditures (a) 3 Visitors 80 82
3 85 3
87 4
- 12 . - 13 -

. Year-to-date September 1989. Room rentals up by 11% over previous years.
. Year-to-year estimated population expansion in B.C. will increase over 1986 Census Source: Cennal Stau Bureau.
year as follows: 1987 1.24% 1988 2.01% 1989 2.41% 1990 2.25%
Inflation for 1989 and 1990 is pndicted to be 4.9% and 5.2% respectively. Average expendim per day per person was $23 in 1979. In 1987 (8 years) that expenditure rose to $50 - 117% increase or 15% per year, simple interest. . Visitor volume from 1979 to 1987 increased 22% or 2.75% per year.
1. The question of boundaries is fundamental to the availability of useful data Most tourism and recreation data is collected according to the nine tourism regions while foresay data is collected by 46 forest dismcts and summarized to six forest regions.
It is imperative that these boundaries be rationalized before procteding with in-depth economic comparisons between tourism and forest related activities.
2. In this review it was not possible to develop the third benchmark. This is the measurement of the capacity of the province and regions to accommodate the estimated number of visitors. Capacity refers to a l l services, facilities and accommodation such as hotels, motels, camping parks, recreation sites and any other private or public operations catering to visitors. The sources of information were found to be inadequate at this stage to develop a reliable benchmark.
3. The Vancouver Island Tourism Monitor is prepared by the Geography D e p m e n t at the University of Victoria for the Tourism Association of Vancouver Island. It is a comprehensive raw database of visitor characteristics obtained through a dinct questionnaire process. The data is broken down to the level of the seven regional dsnicts which make up the Vancouver Island Tourist Region.
This type of survey should be completed for the other tourism regions as one tool for obtaining a more accurate estimate of the economic values of tourism in B.C. All such surveys should include questions that will provide better information on rhe
* forestry tourism and recreation segment.
~
I 4. The Ministry of Forests has a comprehensive computerized forest land inventory. As explained in this repon the forest inventory is based on standard land classification. Consideration should be given on how best to integrate into this system the requirements for forestry related tourism data as well as the existing data on recreation land.
5. Data consistency is a problem with most tourism data. Some examples are as follows:
- Terminology between Ministries is inconsistent when referring to tourism
- Data reporting periods have different time frames in most of the reference
- The t e r n of reference for studies hded by one Ministry are not consistent
matters.
data and can range anywhere from 1984 to 1989.
between studies. As an example a study on the Cruise Ship Industry in B.C. presents employment and capital expenditures which must be assumed to accrue to other counwies because of the fmign ownership of the vessels.
6. The B.C. Resident Travel Attitude and Motivation Study - refemd to as the B.C. Resident Travel Survey for 1985 does not include expenditurcs. For this repon, some assumptions were made to allow economic analysis. The 1989 study has been completed but is not yet available. Data consistency of this document cannot be checked at this time.
- 14 - - 15 .
10.0 IMPLICATIONS
The findings in this study represent a preliminary assessment of tourism and m a t i o n based on those visitors activities that arc assumed to have a relationship to the f m s t resource. From this exercise the values of tourism expenditures and employment have been identified and can be compared to forestry values. This represents the first step in process that should be refvied when bettcr data is developed
If this process continues, decisions would be required on a number of items, some of which may have policy implications, as follows:
. An arbiuary identification of the categories of forestry oriented visitors was developed as the basis for this repon It is important that these categories and others be defined and a decision made on what is and is not forestry tourism This definition quires consensus between Minisuies and with tourism organizations . representing the industry.
The implication of conflicting boundaries represents a constraint to the development of consistent data to accurately compare values.
It is important that the right data is available and that arrangements ~ z t made to collect this data in depth (or to an appropriate depth to support official statements on the subject).
The public costs of tourism and recreation have not been a d d ~ = s s e d in the form of support costs and subsidies. No formulas have been developed in this report because of time and costs involved.
The capital cost of tourism infnsnuctuc may be considerable if public parks and highways are considered on a pro rata basis. As an example the Highway 99 improvements to Whistler and the infrasa~cture for the town cenm were direct public costs in suppon of this major tourism complex.
Appendix D-1 List of References
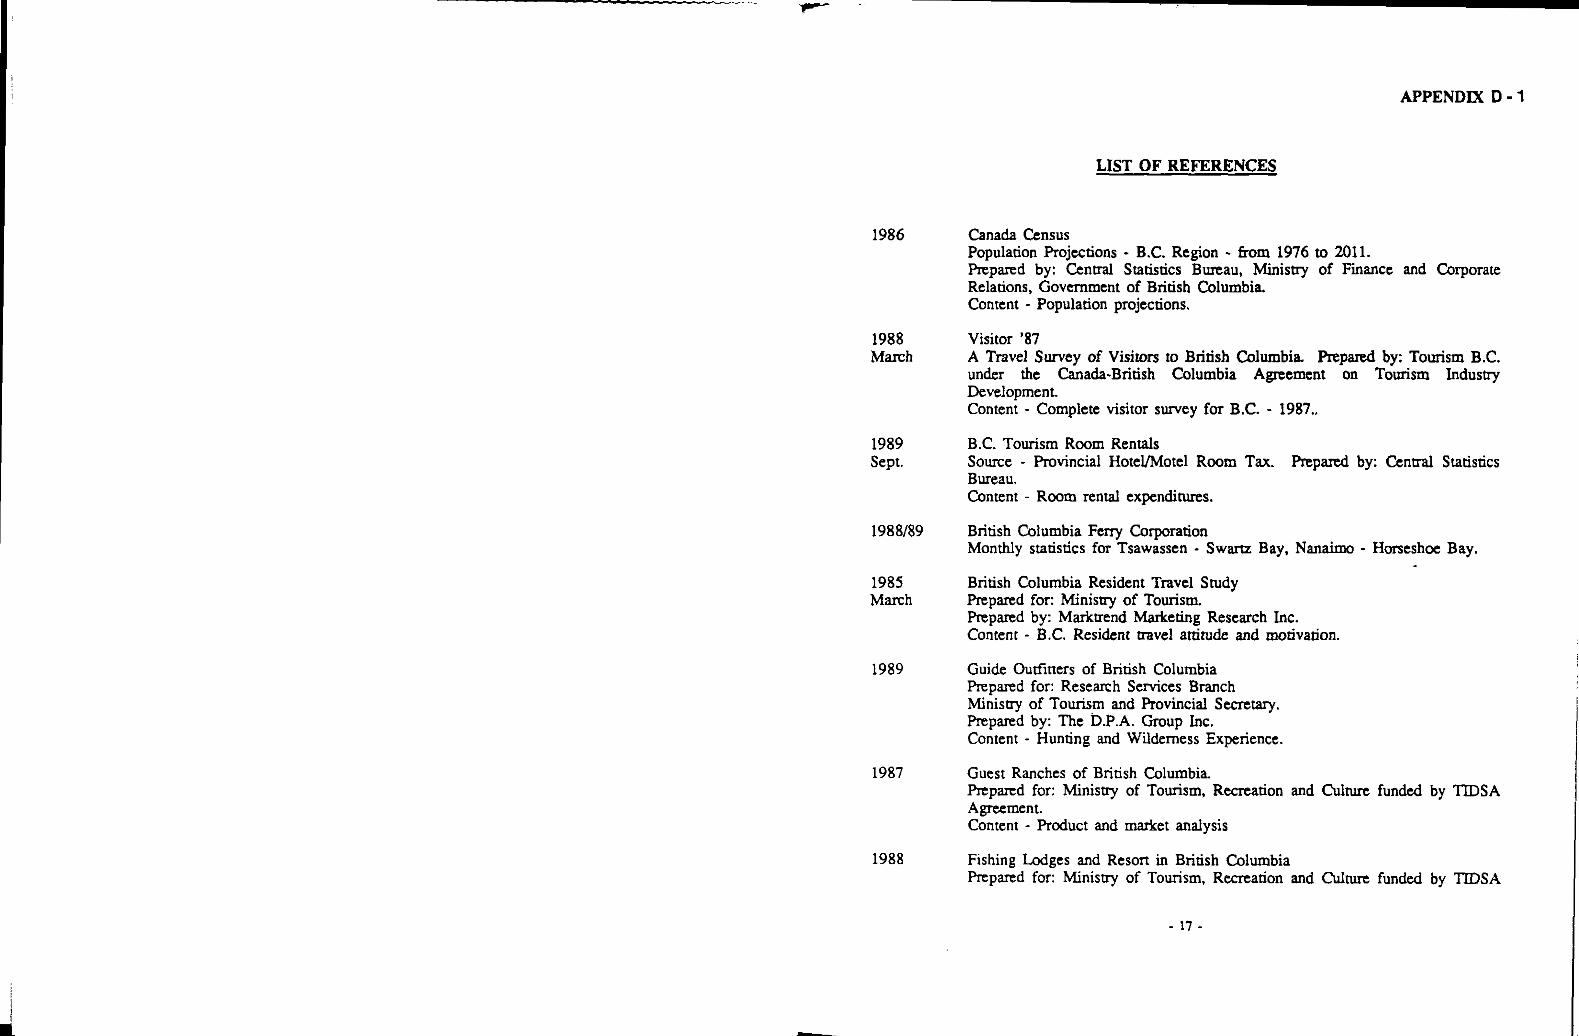
LIST OF REFERENCES
1986
1988 March
Canada Census Population Projections - B.C. Region - horn 1976 to 2011. Prepared by: Central Statistics Bureau, Ministry of Finance and Corporate Relations, Government of British Columbia. Content - Population projections,
Visitor '87 A Travel Survey of Visitors to British Columbia Repared by: Tourism B.C. under the Canada-British Columbia Agreement on Tourism Industry Development. Content - Complete visitor survey for B.C. - 1987..
1989 B.C. Tourism Room Rentals Sept. Source - Provincial HoteVMotel Room Tax. F ' r e p d by: Central Statistics
Bureau. Content - Room rental expenditures.
1988/89 British Columbia Feny Corporation Monthly statistics for Tsawassen - Swam Bay, Nanaimo - Horseshoe Bay.
1985 British Columbia Resident Travel Study March Prepared for: Ministry of Tourism.
Prepared by: Marktrend Marketing Research Inc. Content - B.C. Resident travel attitude and motivation.
1989 Guide Outfmers of British Columbia Prepared for: Research Services Branch
Prepared by: The D.P.A. Group Inc. Ministry of Tourism and Provincial Secretary.
Content - Hunting and Wilderness Experience.
1987
1988
Guest Ranches of British Columbia Prepared for: Ministry of Tourism, Recreation and Culture funded by TIDSA Agreement. Content - Product and market analysis
Fishing Lodges and Resort in British Columbia Prepared for: Ministry of Tourism, Recreation and Culture funded by TDSA
- 17 -
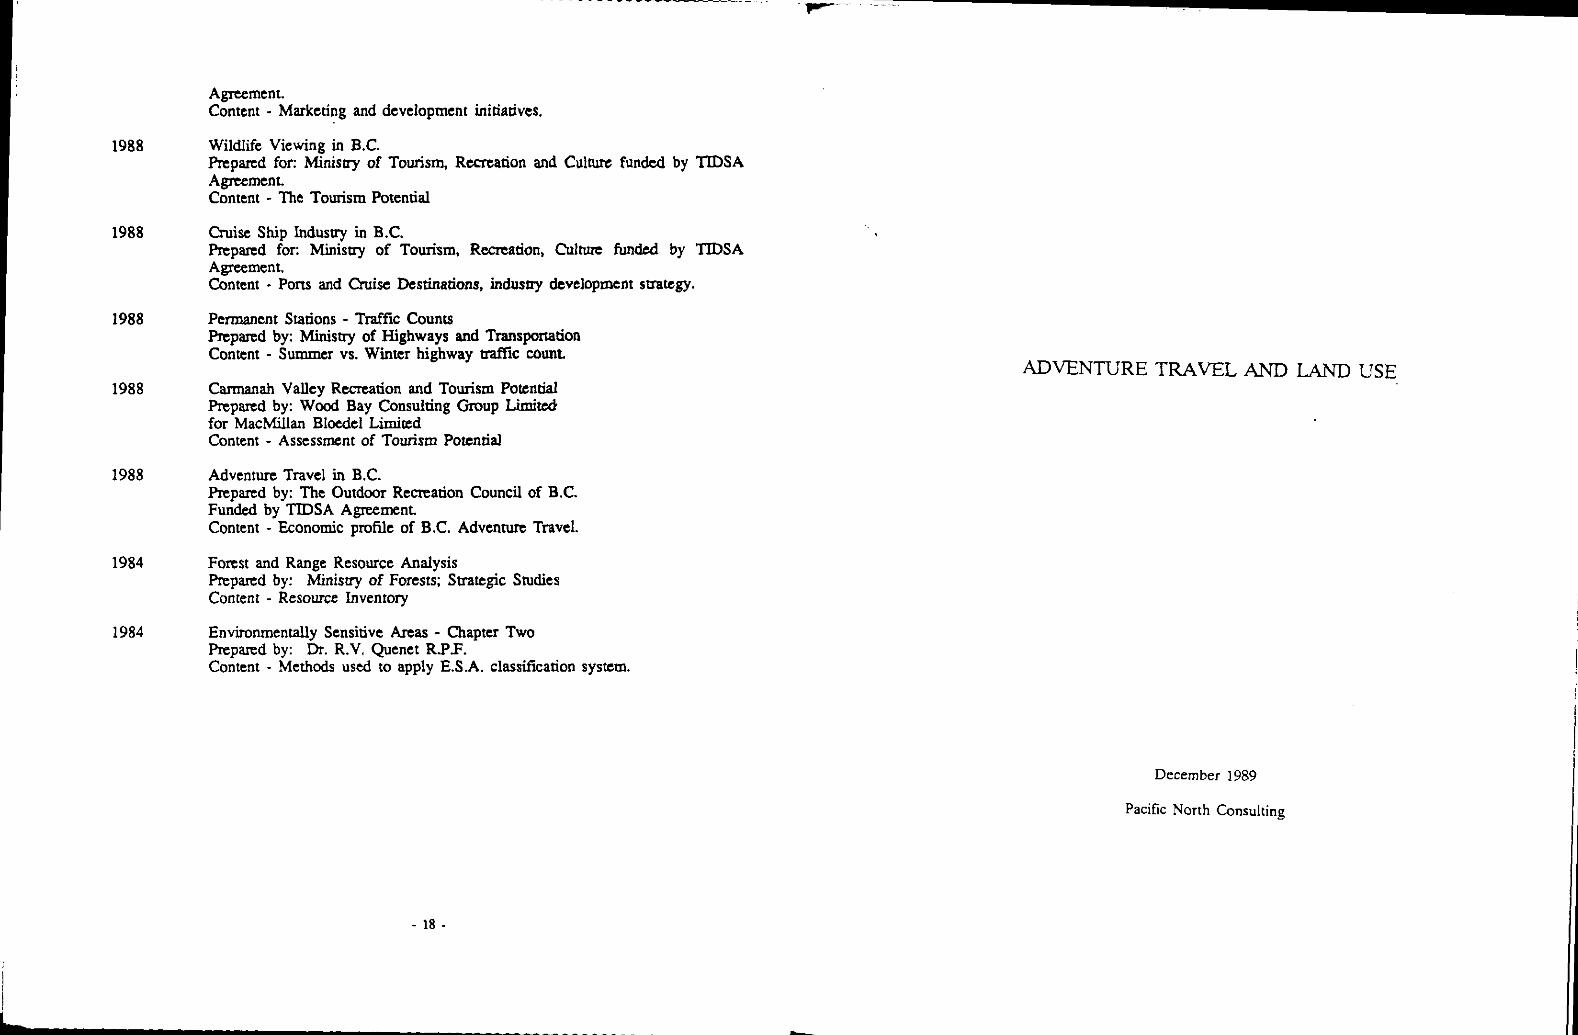
Agreement. Content - Marketing and development initiatives.
1988 Wildlife Viewing in B.C. Prepared for: Ministry of Tourism, Rccrcation and C u l m fun& by TIDSA Agreement. Content - The Tourism Potential
1988 (3ruise Ship Industry in B.C. Prepared for: Mmisuy of Tourism, Rmation, Cultme funded by TIDSA Agreement. Content - Pons and Cruise Destinations, indusuy development s t r a t e g y .
1988 Permanent Stations - Traffic Counts Rpared by: Ministry of Highways and Transportation Content - Summer vs. Winter highway aaffic count
1988 Carmanah Valley Rccreation and Tourism Potential Prepared by: Wood Bay Consulting Group Limiwd for MacMillan BIoedel Limited Content - Assessment of Tourism Potential
1988 Adventure Travel in B.C. Prepared by: The Outdoor Recreation Council of B.C. Funded by TIDSA Agreement. Content - Economic profile of B.C. Adventure Travel.
1984 Forest and Range Resource Analysis Prepared by: Ministry of Forests; Strategic Studies Content - Resource Inventory
1984 Environmentally Sensitive Arcas - Chapter Two Prepared by: Dr. R.V. Quenet RSE. Content - Methods used to apply E.S.A. classificarion system.
ADVENTURE TRAVEL A N D LAND USE
December 1989
Pacific North Consulting
- 18 -