residential building envelope heat gain and cooling energy requirements
TRANSCRIPT
Residential building envelope heat gain and cooling
energy requirements
Joseph C. Lam*, C.L. Tsang, Danny H.W. Li, S.O. Cheung
Building Energy Research Group, Department of Building and Construction, City University of Hong Kong,
Tat Chee Avenue, Kowloon, Hong Kong, China
Received 1 December 2003
Abstract
We present the energy use situation in Hong Kong from 1979 to 2001. The primary energy requirement (PER)
nearly tripled during the 23-year period, rising from 195,405 TJ to 572,684 TJ. Most of the PER was used for
electricity generation, and the electricity use in residential buildings rose from 7556 TJ (2099 GWh) to 32,799 TJ
(9111 GWh), an increase of 334%. Air-conditioning accounted for about 40% of the total residential sector
electricity consumption. A total of 144 buildings completed in the month of June during 1992–2001 were
surveyed. Energy performance of the building envelopes was investigated in terms of the overall thermal transfer
value (OTTV). To develop the appropriated parameters used in OTTV calculation, long-term measured weather
data such as ambient temperature (1960–2001), horizontal global solar radiation (1992–2001) and global solar
radiation on vertical surfaces (1996–2001) were examined. The OTTV found varied from 27 to 44 W/m2 with a
mean value of 37.7 W/m2. Building energy simulation technique using DOE-2.1E was employed to determine the
cooling requirements and hence electricity use for building envelope designs with different OTTVs. It was found
that cooling loads and electricity use could be expressed in terms of a simple two-parameter linear regression
equation involving OTTV.
q 2004 Elsevier Ltd. All rights reserved.
1. Introduction
Buildings, energy and the environment are key issues facing the building fraternity worldwide. In the
Hong Kong SAR, there is a growing concern about energy use in buildings and its likely adverse effect
on the environment. Hong Kong has no indigenous fuels of her own and has to rely on imported fossil
fuels such as coal, natural gas and oil products. With economic growth, especially during the 1980s and
Energy 30 (2005) 933–951
www.elsevier.com/locate/energy0360-5442/$ - see front matter q 2004 Elsevier Ltd. All rights reserved.
doi:10.1016/j.energy.2004.07.001
* Corresponding author. Tel.: C852-2788-7606; fax: C852-2788-7612.
E-mail address: [email protected] (J.C. Lam).
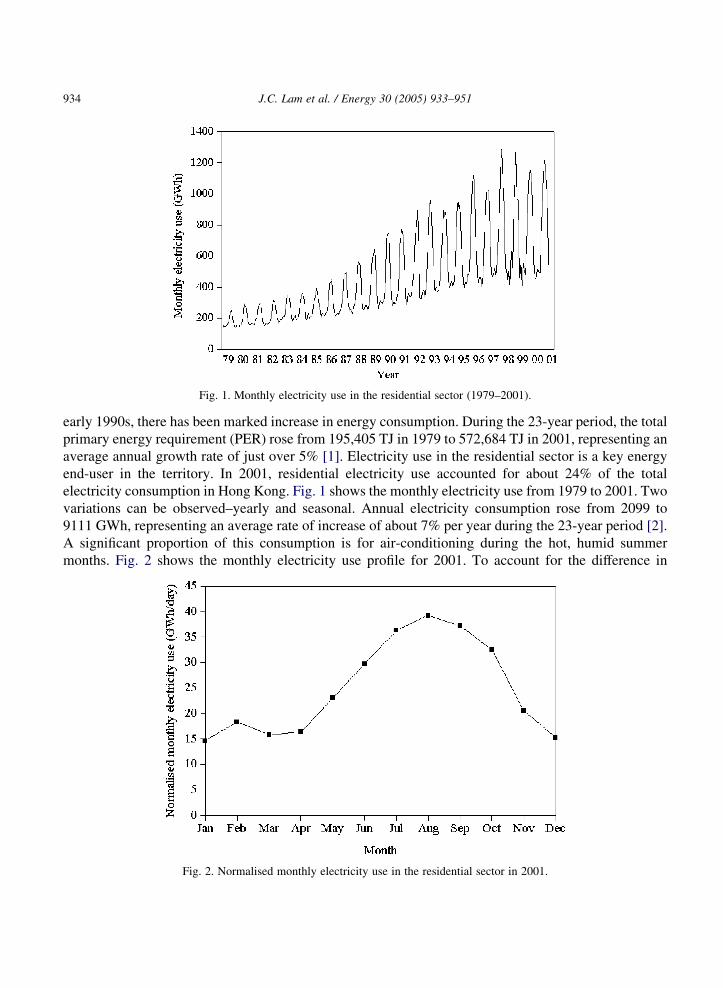
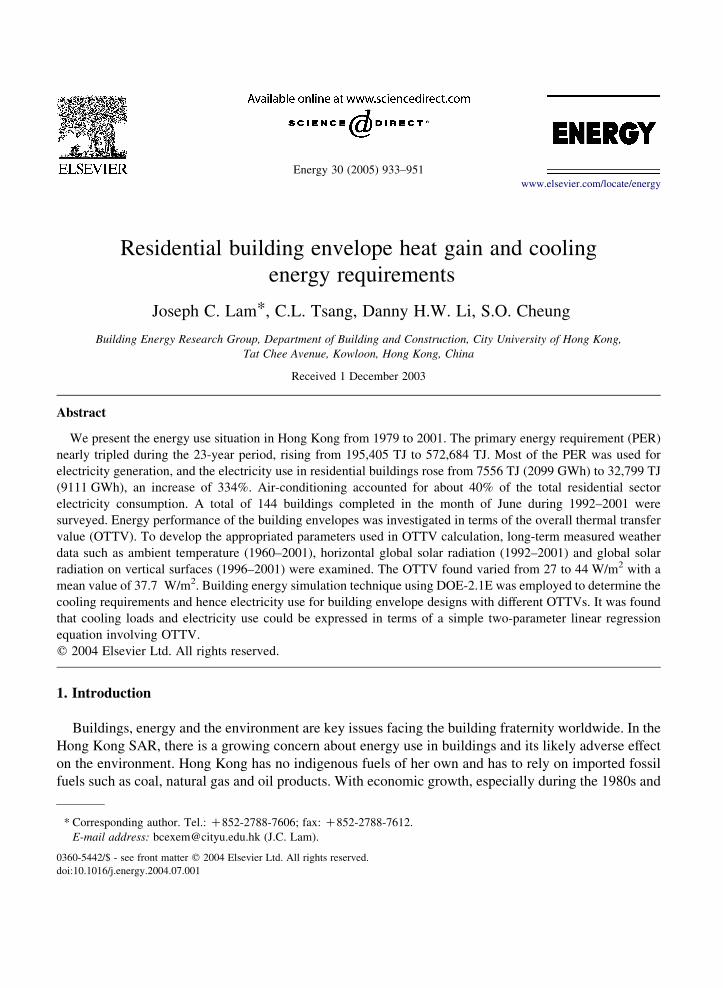
Fig. 1. Monthly electricity use in the residential sector (1979–2001).
J.C. Lam et al. / Energy 30 (2005) 933–951934
early 1990s, there has been marked increase in energy consumption. During the 23-year period, the total
primary energy requirement (PER) rose from 195,405 TJ in 1979 to 572,684 TJ in 2001, representing an
average annual growth rate of just over 5% [1]. Electricity use in the residential sector is a key energy
end-user in the territory. In 2001, residential electricity use accounted for about 24% of the total
electricity consumption in Hong Kong. Fig. 1 shows the monthly electricity use from 1979 to 2001. Two
variations can be observed–yearly and seasonal. Annual electricity consumption rose from 2099 to
9111 GWh, representing an average rate of increase of about 7% per year during the 23-year period [2].
A significant proportion of this consumption is for air-conditioning during the hot, humid summer
months. Fig. 2 shows the monthly electricity use profile for 2001. To account for the difference in
Fig. 2. Normalised monthly electricity use in the residential sector in 2001.
J.C. Lam et al. / Energy 30 (2005) 933–951 935
the number of days in a calendar month, the monthly electricity use in the entire residential sector was
normalised (i.e. divided by the number of days in that month). It can be seen that electricity use rose
markedly from May to October, due mainly to air-conditioning demands during the hot, humid summer
period. Previous work on energy use and user behaviour indicated that occupants did tend to operate
their room-type air-conditioners in residential buildings during the 6-month cooling period from May to
October [3]. Electricity consumption during the other months could be considered as the base-load (i.e.
electricity use other than air-conditioning). With this assumption, electricity use for air-conditioning in
the residential sector during the 23-year period were determined based on the monthly electricity use
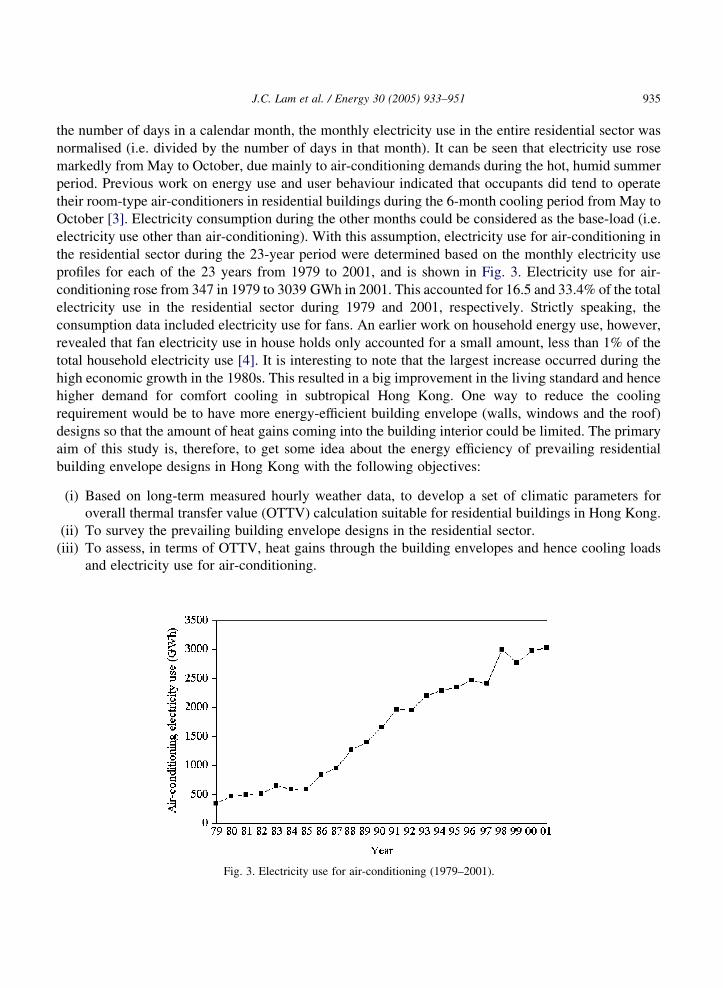
profiles for each of the 23 years from 1979 to 2001, and is shown in Fig. 3. Electricity use for air-
conditioning rose from 347 in 1979 to 3039 GWh in 2001. This accounted for 16.5 and 33.4% of the total
electricity use in the residential sector during 1979 and 2001, respectively. Strictly speaking, the
consumption data included electricity use for fans. An earlier work on household energy use, however,
revealed that fan electricity use in house holds only accounted for a small amount, less than 1% of the
total household electricity use [4]. It is interesting to note that the largest increase occurred during the
high economic growth in the 1980s. This resulted in a big improvement in the living standard and hence
higher demand for comfort cooling in subtropical Hong Kong. One way to reduce the cooling
requirement would be to have more energy-efficient building envelope (walls, windows and the roof)
designs so that the amount of heat gains coming into the building interior could be limited. The primary
aim of this study is, therefore, to get some idea about the energy efficiency of prevailing residential
building envelope designs in Hong Kong with the following objectives:
(i)
Based on long-term measured hourly weather data, to develop a set of climatic parameters foroverall thermal transfer value (OTTV) calculation suitable for residential buildings in Hong Kong.
(ii)
To survey the prevailing building envelope designs in the residential sector.(iii)
To assess, in terms of OTTV, heat gains through the building envelopes and hence cooling loadsand electricity use for air-conditioning.
Fig. 3. Electricity use for air-conditioning (1979–2001).
J.C. Lam et al. / Energy 30 (2005) 933–951936
2. Building envelope heat gains and OTTV concept
Broadly speaking, there are three types of heat gain coming through the building envelope, namely
wall conduction, window conduction and solar heat through the windows. In subtropical Hong Kong,
solar heat gain is the dominant component in the total building envelope heat gain determination and
hence cooling requirement consideration. In order to compare the relative energy efficiency of different
building envelop designs, a certain heat gain index based on the actual building envelope design and the
prevailing weather conditions in terms of long-term measured ambient temperature and solar radiation
should be developed. One such index was first developed by the ASHRAE for new building design
through the use of the overall thermal transfer value (OTTV) [5]. OTTV is basically a measure of heat
transfer from outside to the indoor environment through the external envelope of a building. Three
components of heat gain are considered—conduction through opaque surface, conduction through glass
and solar radiation through glass. It is an index of the overall thermal performance of a building
envelope: smaller the OTTV, less the energy use for cooling. The usual practice is to have two separate
OTTVs—one for external walls (including windows) and the other for the roof (including skylights, if
any). A brief description of the basic concept is as follows.
2.1. OTTV equation for the walls
As walls at different orientations receive different amounts of solar radiation, the general procedure is
to calculate the OTTVs of individual walls with the same orientation and construction first. The OTTV
of the whole exterior wall is then given by the weighted average of these values. Thus
OTTVi Z ðQw CQg CQsÞ=Ai
Z ½ðAw !Uw !TDeqÞC ðAf !Uf !DTÞC ðAf !SC!SFÞ�=Ai (1)
where, OTTVi is the OTTV of walls with same orientation and construction (W/m2); Qw, heat
conduction through the opaque walls (W); Qg, heat conduction through the windows (W); Qs, solar
radiation through the windows (W); Aw, area of the opaque walls (m2); Uw, U-value of the opaque walls
(W/m2K); TDeq, equivalent temperature difference (K); Af, area of fenestration (m2); Uf, U-value of
fenestration (the windows) (W/m2K); DT, temperature difference between exterior and interior design
conditions (K); SC, shading coefficient of fenestration; SF, solar factor for that orientation (W/m2); Ai,
gross area of the walls (m2)ZAwCAf and
OTTVwall Z
PðOTTVi !AiÞ
Atw
(2)
where, OTTVwall is the OTTV of the whole exterior wall (W/m2) and AtwZS(Ai)Ztotal gross exterior
wall area (m2).
Alternatively, Eq. (1) can be expressed in terms of window-to-wall ratio, WWR. Thus
OTTVi Z ð1 KWWRÞ!TDeq !Uw CWWR!DT!Uf CWWR!SC!SF (3)
where, WWR is the ratio of window area to gross wall areaZAf/Ai.
J.C. Lam et al. / Energy 30 (2005) 933–951 937
2.2. OTTV equation for the roof
The approach and equations for calculating roof OTTV are similar to those for the walls. Calculation
for the roof is often much simpler because roof does not usually contain large amount of glazing (except
skylights over an atrium). Heat gain through the roof is generally small compared with external walls for
two reasons. First, because of the dense population with limited land recourses, most residential
buildings in Hong Kong are high-rise (20 storeys or more), roof area is, therefore, small compared with
the external wall area. Second, most roofs have 40–50 mm thermal insulation (with a U-value of less
than 0.64 W/m2K) and with no skylight. Hence, there in no solar heat gain through the roof and the heat
conduction tends to be small. For simplicity, therefore, only wall OTTV has been analysed in this study.
3. Determination of the OTTV parameters
The three parameters in Eq. (3), namely equivalent temperature difference (TDeq), indoor/outdoor
temperature difference (DT) and solar factor (SF) are average values related to the outdoor ambient
temperature and the solar radiation. Their values depend on the prevailing weather conditions and the
period over which the measured temperature and solar radiation data are averaged. TDeq also depends on
the surface finishes. A darker surface would absorb more solar heat and hence a larger equivalent
temperature difference. Since the cooling season runs from May to October, only data measured during
this period were considered and the climatic variables were averaged over this 6-month period.
3.1. Average temperature difference between the indoor and outdoor (DT)
Long-term (1960–2001) measured hourly ambient temperature data were obtained from the Hong
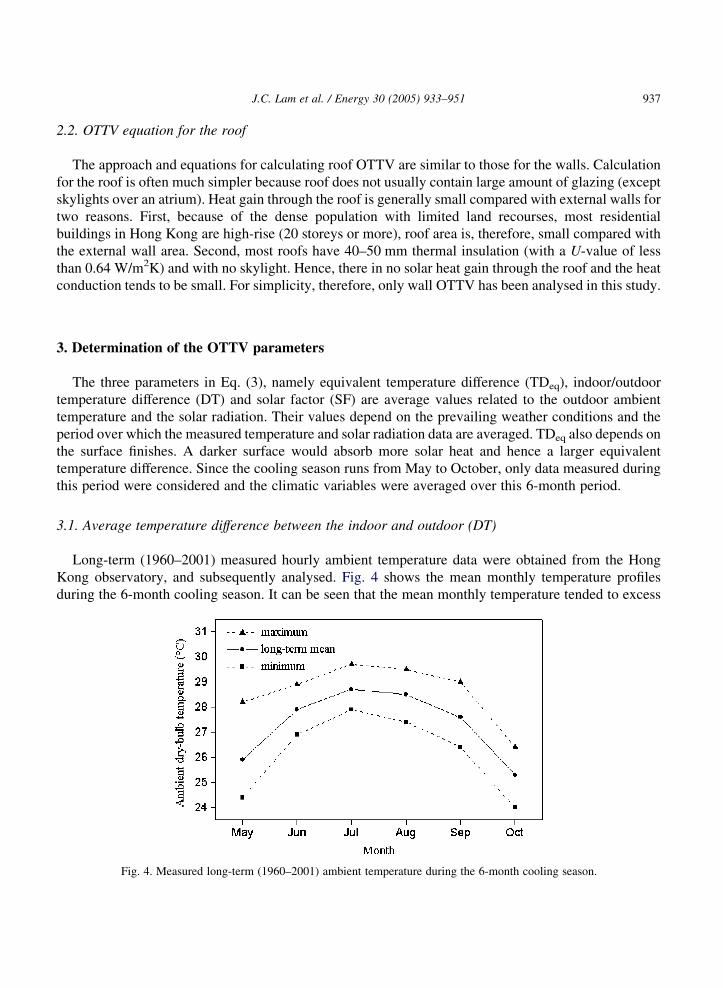
Kong observatory, and subsequently analysed. Fig. 4 shows the mean monthly temperature profiles
during the 6-month cooling season. It can be seen that the mean monthly temperature tended to excess
Fig. 4. Measured long-term (1960–2001) ambient temperature during the 6-month cooling season.
J.C. Lam et al. / Energy 30 (2005) 933–951938
25 8C from May to October. It is reasonable to assume that 25 8C is the threshold of cooling requirement
in residential premises in subtropical Hong Kong. Based on these long-term hourly temperature data, the
average mean temperature was found to be 27.3 8C. An earlier survey of the indoor thermal conditions in
households revealed that, with air-conditioning, the indoor temperature ranged from 21 to 23.5 8C [6]. A
mean indoor temperature of 22.3 8C was assumed for this study, and the difference between mean
outdoor and mean indoor temperature is, therefore, 5 8C.
3.2. Solar factor (SF)
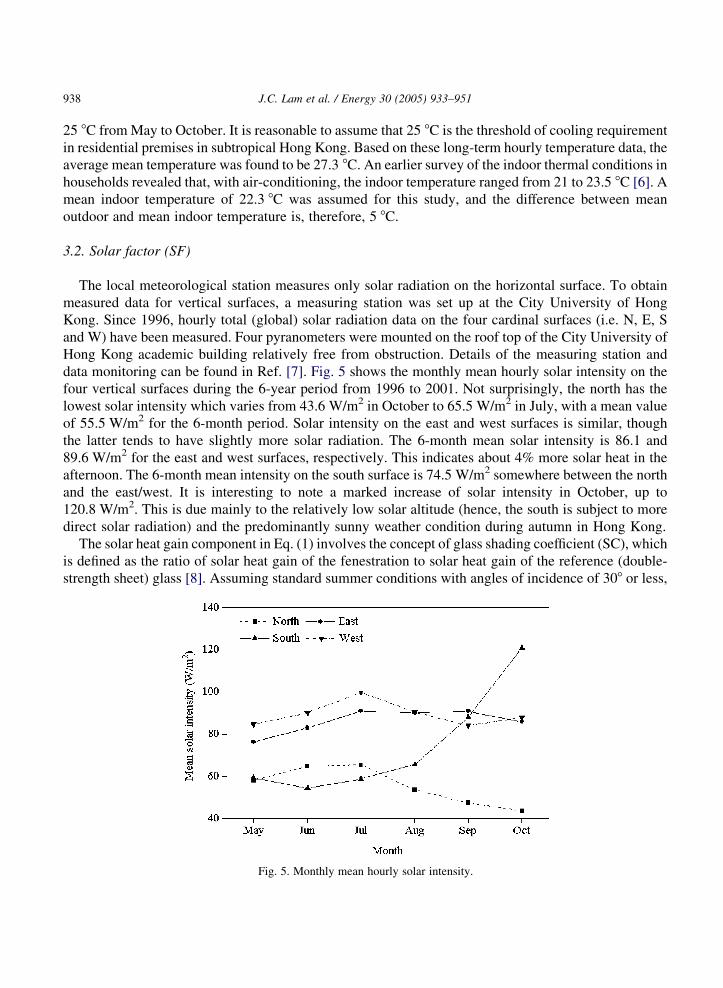
The local meteorological station measures only solar radiation on the horizontal surface. To obtain
measured data for vertical surfaces, a measuring station was set up at the City University of Hong
Kong. Since 1996, hourly total (global) solar radiation data on the four cardinal surfaces (i.e. N, E, S
and W) have been measured. Four pyranometers were mounted on the roof top of the City University of
Hong Kong academic building relatively free from obstruction. Details of the measuring station and
data monitoring can be found in Ref. [7]. Fig. 5 shows the monthly mean hourly solar intensity on the
four vertical surfaces during the 6-year period from 1996 to 2001. Not surprisingly, the north has the
lowest solar intensity which varies from 43.6 W/m2 in October to 65.5 W/m2 in July, with a mean value
of 55.5 W/m2 for the 6-month period. Solar intensity on the east and west surfaces is similar, though
the latter tends to have slightly more solar radiation. The 6-month mean solar intensity is 86.1 and
89.6 W/m2 for the east and west surfaces, respectively. This indicates about 4% more solar heat in the
afternoon. The 6-month mean intensity on the south surface is 74.5 W/m2 somewhere between the north
and the east/west. It is interesting to note a marked increase of solar intensity in October, up to
120.8 W/m2. This is due mainly to the relatively low solar altitude (hence, the south is subject to more
direct solar radiation) and the predominantly sunny weather condition during autumn in Hong Kong.
The solar heat gain component in Eq. (1) involves the concept of glass shading coefficient (SC), which
is defined as the ratio of solar heat gain of the fenestration to solar heat gain of the reference (double-
strength sheet) glass [8]. Assuming standard summer conditions with angles of incidence of 308 or less,
Fig. 5. Monthly mean hourly solar intensity.
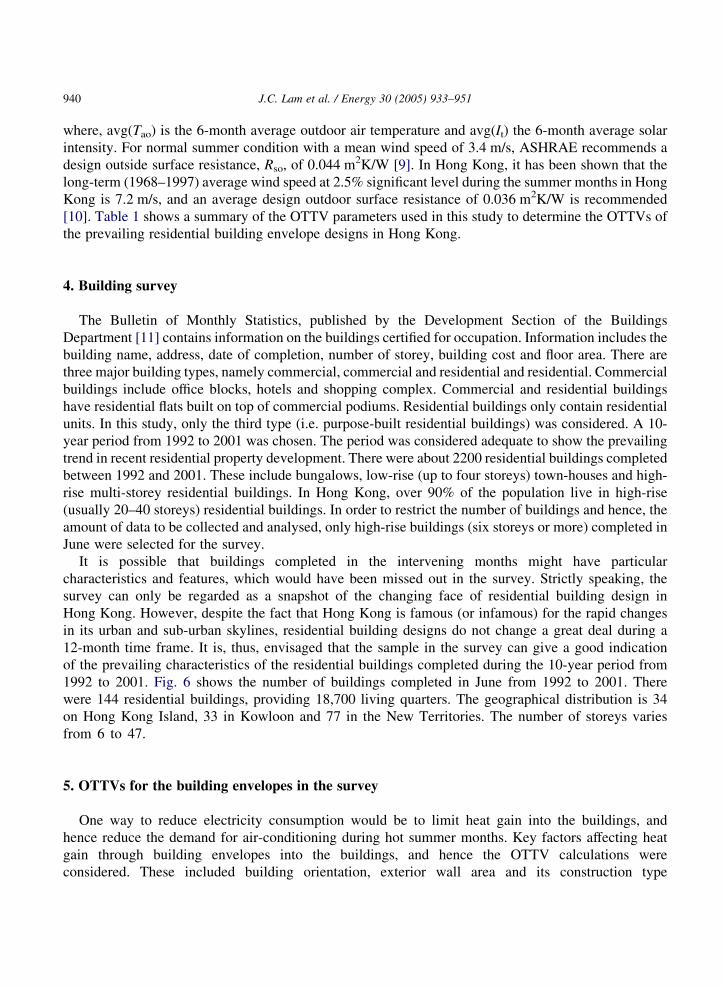
Table 1
Summary of OTTV parameters
North East South West
SF (W/m2) 48.3 74.9 64.8 78.0
TDeq (8C) aZ0.5 5.9 6.3 6.2 6.4
aZ0.8 6.4 7.2 6.9 7.3
aZ0.9 6.6 7.4 7.1 7.5
DT (8C) 5
J.C. Lam et al. / Energy 30 (2005) 933–951 939
SF is equal to 0.87 times the incident solar intensity. For incident angle greater than 308, solar heat
transmittance will be less than 87%. This is considered acceptable because solar irradiance is relatively
small when incident angle is greater than 308. Besides, OTTV is only an index showing the comparative
energy performance of different building envelope designs. Table 1 shows the solar factors for the four
principal orientations. Data for the other orientations were determined by linear interpolation between
these measured values.
3.3. Equivalent temperature difference (TDeq)
Equivalent temperature difference considers both the conduction heat gain due to the temperature
difference between the indoor and the outdoor environment and the effect of solar radiation on opaque
surfaces (e.g. external walls). TDeq is determined as follows
Q0w Z Uw !Aw !ðTeo KTaiÞ (4)
where, Q 0w is the overall heat transfer through opaque wall at a particular time (W); Teo, sol-air
temperature (8C) and Tai, indoor temperature (8C), and
Teo Z Tao C ½a!Rso !It K3!Rso !Il� (5)
where, Tao is the outdoor ambient temperature (8C); a, absorption coefficient of the opaque wall surface;
Rso, outside surface resistance (m2K/W); It, solar intensity falling on the surface (W/m2); 3, emissivity of
the opaque wall surface; and Il, net long-wave radiation (W/m2). The first term within the square
brackets accounts for the solar heat gain effect on the opaque surface and the second term indicates
radiative heat transfer from the surface. The computation of long-wave radiation, which is usually small
compared with solar radiation, is rather complex. Since OTTV is an index for comparative analysis of
building envelope energy efficiency, for simplicity long-wave radiation is assumed to be negligible. For
vertical surfaces, this would probably be the case, as the long-wave radiation gain from the ground tends
to balance out the long-wave radiation loss to the sky. For horizontal surfaces, there is a net radiative
heat loss to the sky and a 3.5–4.0 8C correction is generally recommended [9]. Combining Eqs. (4) and
(5), we have:
Q0w Z Uw !Aw !ðTao C ½a!Rso !It�KTaiÞ (6)
Averaging Eq. (6) over the 6-month cooling season, and comparing it with Eq. (1), the equivalent
temperature difference is given by
TDeq Z avgðTaoÞKTai C ½a!Rso !avgðItÞ� Z DT C ½a!Rso !avgðItÞ� (7)
J.C. Lam et al. / Energy 30 (2005) 933–951940
where, avg(Tao) is the 6-month average outdoor air temperature and avg(It) the 6-month average solar
intensity. For normal summer condition with a mean wind speed of 3.4 m/s, ASHRAE recommends a
design outside surface resistance, Rso, of 0.044 m2K/W [9]. In Hong Kong, it has been shown that the
long-term (1968–1997) average wind speed at 2.5% significant level during the summer months in Hong
Kong is 7.2 m/s, and an average design outdoor surface resistance of 0.036 m2K/W is recommended
[10]. Table 1 shows a summary of the OTTV parameters used in this study to determine the OTTVs of
the prevailing residential building envelope designs in Hong Kong.
4. Building survey
The Bulletin of Monthly Statistics, published by the Development Section of the Buildings
Department [11] contains information on the buildings certified for occupation. Information includes the
building name, address, date of completion, number of storey, building cost and floor area. There are
three major building types, namely commercial, commercial and residential and residential. Commercial
buildings include office blocks, hotels and shopping complex. Commercial and residential buildings
have residential flats built on top of commercial podiums. Residential buildings only contain residential
units. In this study, only the third type (i.e. purpose-built residential buildings) was considered. A 10-
year period from 1992 to 2001 was chosen. The period was considered adequate to show the prevailing
trend in recent residential property development. There were about 2200 residential buildings completed
between 1992 and 2001. These include bungalows, low-rise (up to four storeys) town-houses and high-
rise multi-storey residential buildings. In Hong Kong, over 90% of the population live in high-rise
(usually 20–40 storeys) residential buildings. In order to restrict the number of buildings and hence, the
amount of data to be collected and analysed, only high-rise buildings (six storeys or more) completed in
June were selected for the survey.
It is possible that buildings completed in the intervening months might have particular
characteristics and features, which would have been missed out in the survey. Strictly speaking, the
survey can only be regarded as a snapshot of the changing face of residential building design in
Hong Kong. However, despite the fact that Hong Kong is famous (or infamous) for the rapid changes
in its urban and sub-urban skylines, residential building designs do not change a great deal during a
12-month time frame. It is, thus, envisaged that the sample in the survey can give a good indication
of the prevailing characteristics of the residential buildings completed during the 10-year period from
1992 to 2001. Fig. 6 shows the number of buildings completed in June from 1992 to 2001. There
were 144 residential buildings, providing 18,700 living quarters. The geographical distribution is 34
on Hong Kong Island, 33 in Kowloon and 77 in the New Territories. The number of storeys varies
from 6 to 47.
5. OTTVs for the building envelopes in the survey
One way to reduce electricity consumption would be to limit heat gain into the buildings, and
hence reduce the demand for air-conditioning during hot summer months. Key factors affecting heat
gain through building envelopes into the buildings, and hence the OTTV calculations were
considered. These included building orientation, exterior wall area and its construction type
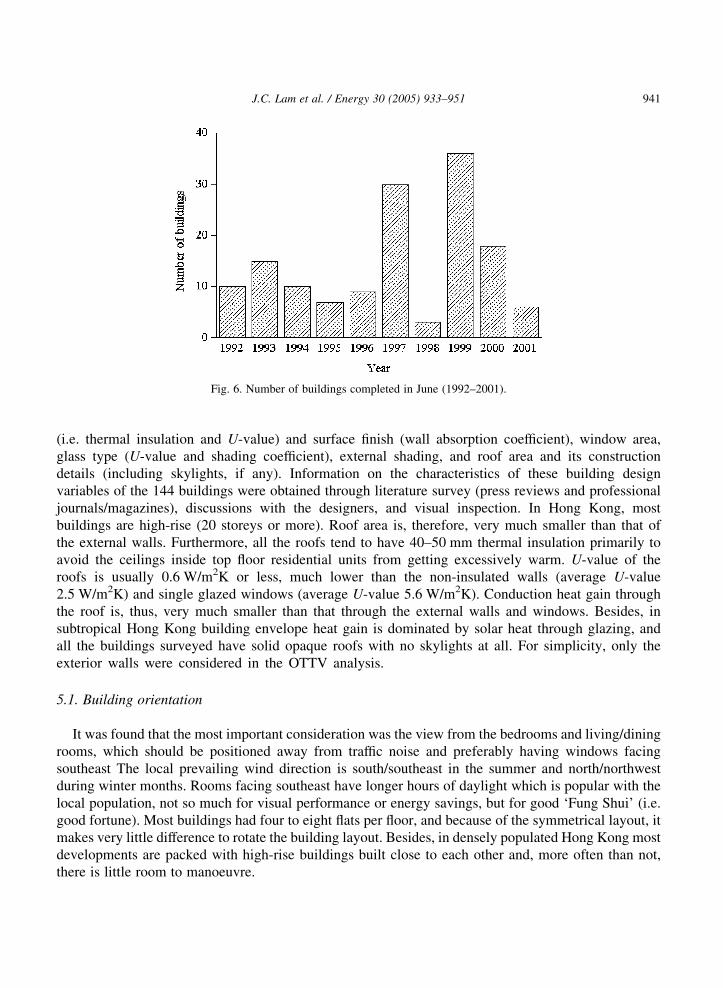
Fig. 6. Number of buildings completed in June (1992–2001).
J.C. Lam et al. / Energy 30 (2005) 933–951 941
(i.e. thermal insulation and U-value) and surface finish (wall absorption coefficient), window area,
glass type (U-value and shading coefficient), external shading, and roof area and its construction
details (including skylights, if any). Information on the characteristics of these building design
variables of the 144 buildings were obtained through literature survey (press reviews and professional
journals/magazines), discussions with the designers, and visual inspection. In Hong Kong, most
buildings are high-rise (20 storeys or more). Roof area is, therefore, very much smaller than that of
the external walls. Furthermore, all the roofs tend to have 40–50 mm thermal insulation primarily to
avoid the ceilings inside top floor residential units from getting excessively warm. U-value of the
roofs is usually 0.6 W/m2K or less, much lower than the non-insulated walls (average U-value
2.5 W/m2K) and single glazed windows (average U-value 5.6 W/m2K). Conduction heat gain through
the roof is, thus, very much smaller than that through the external walls and windows. Besides, in
subtropical Hong Kong building envelope heat gain is dominated by solar heat through glazing, and
all the buildings surveyed have solid opaque roofs with no skylights at all. For simplicity, only the
exterior walls were considered in the OTTV analysis.
5.1. Building orientation
It was found that the most important consideration was the view from the bedrooms and living/dining
rooms, which should be positioned away from traffic noise and preferably having windows facing
southeast The local prevailing wind direction is south/southeast in the summer and north/northwest
during winter months. Rooms facing southeast have longer hours of daylight which is popular with the
local population, not so much for visual performance or energy savings, but for good ‘Fung Shui’ (i.e.
good fortune). Most buildings had four to eight flats per floor, and because of the symmetrical layout, it
makes very little difference to rotate the building layout. Besides, in densely populated Hong Kong most
developments are packed with high-rise buildings built close to each other and, more often than not,
there is little room to manoeuvre.
J.C. Lam et al. / Energy 30 (2005) 933–951942
5.2. Wall construction
All 144 buildings surveyed were of reinforced concrete structure. External walls usually had 125–
250 mm thick concrete, mostly with mosaic/ceramic tiles applied to cement render and without any
thermal insulation. U-value ranged typically from 2.2 to 2.9 W/m2K, depending on the thickness of
concrete and the type of surface finish. There were two main reasons for the absence of wall insulation.
Firstly, heat loss was not critical because of the short and mild winter in sub-tropical Hong Kong.
Secondly, most of the heat gain into a building was solar heat through windows during the hot summer
months.
5.3. Window area
Window area was represented by the window-to-wall ratio (WWR), defined as the ratio of the total
area of windows to the overall gross external walls area (including windows). Only areas surrounding
air-conditioned spaces (i.e. living/dining rooms and bedrooms) were considered. The WWR ranged from
20 to 40%. The majority of buildings (about 90%) had WWRs between 25 and 35%. The mean WWR of
the sampled buildings was 29%. Buildings with WWRs less than 25% were found in the older and more
densely populated area where buildings were closely developed to each other with windows on the
shorter facades. Larger luxury flats usually had bigger windows with WWR greater than 35%, and
located in more up-market area.
5.4. Glass type
All 144 buildings studied had single glazing. Double glazing is seldom used in Hong Kong, and is
usually installed for acoustic consideration rather than thermal performance. Two types of glass were
found, namely clear and tinted. The thickness is usually 5–6 mm. Clear glass accounted for 38% of the
sample (i.e. 55 buildings). This percentage is much smaller than the 75% found in an earlier study on
buildings completed during 1985–1992 [12]. There seemed to be an increase in the use of tinted glass,
especially in middle- and up-market residential development over the years. Similar to window area,
there was geographical difference. Larger and more up-market residential units tended to use tinted glass
more often.
5.5. External shading
Shading devices identified from the survey were overhangs and side-fins. Only 26 buildings had
shading devices. There was a downward trend in having shading devices in recent years. This was
mainly due to the introduction of projecting windows as a way to increase usable space without affecting
the plot ratio.
5.6. Colour of external surface finish
The colour of the external surface finish in the survey could be classified into two groups—light and
medium. A total of 77 buildings had light colour surface finish and the remaining 67 medium. Although,
J.C. Lam et al. / Energy 30 (2005) 933–951 943
buildings in more fashionable residential area tended to have medium colour surface finish, there was no
clear pattern observed. The choice of colour depended very much on the architects and the clients.
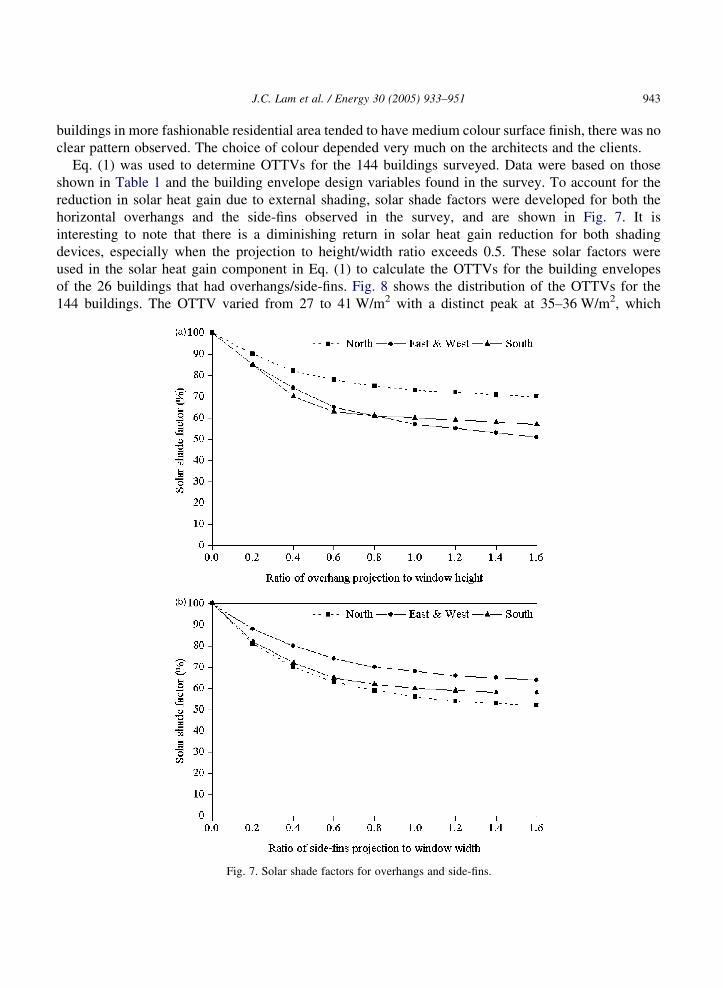
Eq. (1) was used to determine OTTVs for the 144 buildings surveyed. Data were based on those
shown in Table 1 and the building envelope design variables found in the survey. To account for the
reduction in solar heat gain due to external shading, solar shade factors were developed for both the
horizontal overhangs and the side-fins observed in the survey, and are shown in Fig. 7. It is
interesting to note that there is a diminishing return in solar heat gain reduction for both shading
devices, especially when the projection to height/width ratio exceeds 0.5. These solar factors were
used in the solar heat gain component in Eq. (1) to calculate the OTTVs for the building envelopes
of the 26 buildings that had overhangs/side-fins. Fig. 8 shows the distribution of the OTTVs for the
144 buildings. The OTTV varied from 27 to 41 W/m2 with a distinct peak at 35–36 W/m2, which
Fig. 7. Solar shade factors for overhangs and side-fins.
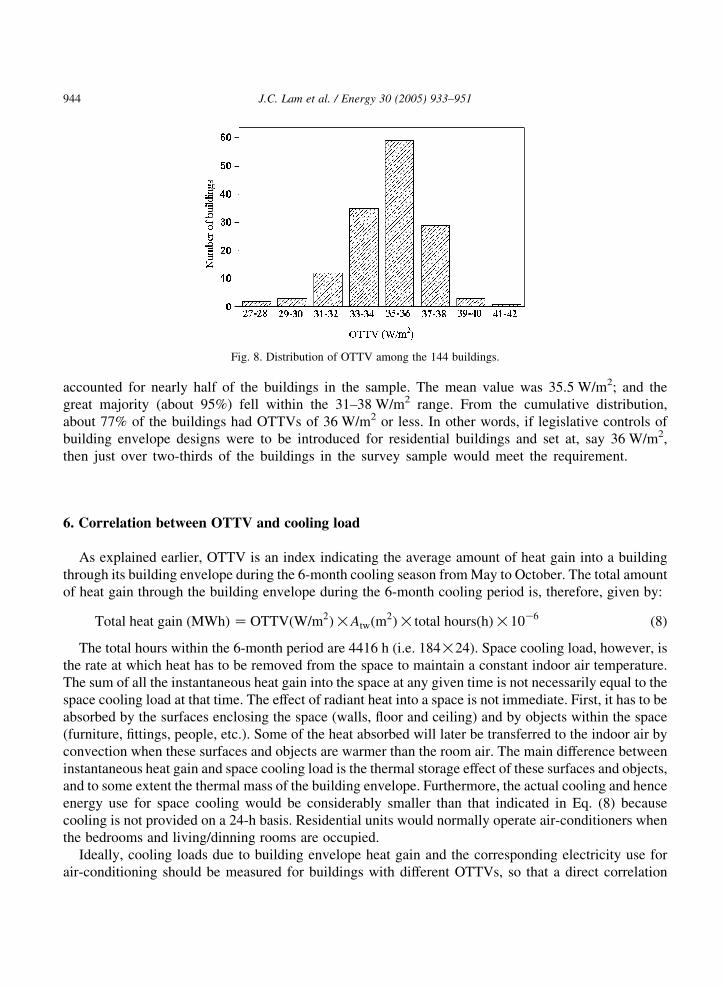
Fig. 8. Distribution of OTTV among the 144 buildings.
J.C. Lam et al. / Energy 30 (2005) 933–951944
accounted for nearly half of the buildings in the sample. The mean value was 35.5 W/m2; and the
great majority (about 95%) fell within the 31–38 W/m2 range. From the cumulative distribution,
about 77% of the buildings had OTTVs of 36 W/m2 or less. In other words, if legislative controls of
building envelope designs were to be introduced for residential buildings and set at, say 36 W/m2,
then just over two-thirds of the buildings in the survey sample would meet the requirement.
6. Correlation between OTTV and cooling load
As explained earlier, OTTV is an index indicating the average amount of heat gain into a building
through its building envelope during the 6-month cooling season from May to October. The total amount
of heat gain through the building envelope during the 6-month cooling period is, therefore, given by:
Total heat gain ðMWhÞ Z OTTVðW=m2Þ!Atwðm2Þ!total hoursðhÞ!10K6 (8)
The total hours within the 6-month period are 4416 h (i.e. 184!24). Space cooling load, however, is
the rate at which heat has to be removed from the space to maintain a constant indoor air temperature.
The sum of all the instantaneous heat gain into the space at any given time is not necessarily equal to the
space cooling load at that time. The effect of radiant heat into a space is not immediate. First, it has to be
absorbed by the surfaces enclosing the space (walls, floor and ceiling) and by objects within the space
(furniture, fittings, people, etc.). Some of the heat absorbed will later be transferred to the indoor air by
convection when these surfaces and objects are warmer than the room air. The main difference between
instantaneous heat gain and space cooling load is the thermal storage effect of these surfaces and objects,
and to some extent the thermal mass of the building envelope. Furthermore, the actual cooling and hence
energy use for space cooling would be considerably smaller than that indicated in Eq. (8) because
cooling is not provided on a 24-h basis. Residential units would normally operate air-conditioners when
the bedrooms and living/dinning rooms are occupied.
Ideally, cooling loads due to building envelope heat gain and the corresponding electricity use for
air-conditioning should be measured for buildings with different OTTVs, so that a direct correlation
J.C. Lam et al. / Energy 30 (2005) 933–951 945
could be established. This, however, is not practicable without too many interruptions in a real life
situation. An alternative would be to have a number of existing buildings, which are identical in all
aspects (e.g. internal load density, operating schedules, etc.) except the building envelope designs (i.e.
different OTTVs). Then, a two-parameter regression analysis of electricity consumption data against the
corresponding OTTVs would give a correlation between electricity use for air-conditioning due to
building envelope heat gain and the OTTV. Obviously, it is not possible to have such building samples.
Computational approach is, therefore, often used instead. For commercial buildings with central air-
conditioning plants and fixed operating hours, the original OTTV concept has been extended to deal with
cooling loads due to heat gains through building envelopes. Turiel et al. [13] and Chou and Lee [14]
correlated OTTVs with cooling loads using computer simulation technique for office buildings in
tropical climates. More recently, similar approach was used to assess the building envelope cooling load
and corresponding electricity use in the commercial sector in subtropical Hong Kong [15]. To estimate
the proportion of the air-conditioning load that was due to heat gain through the building envelopes and
to investigate whether there is any direct correlation between OTTV of the residential building envelope
and cooling load, this technique was extended to residential buildings. The DOE-2.1E building energy
simulation program [16] was used to investigate the thermal and energy performance of a generic
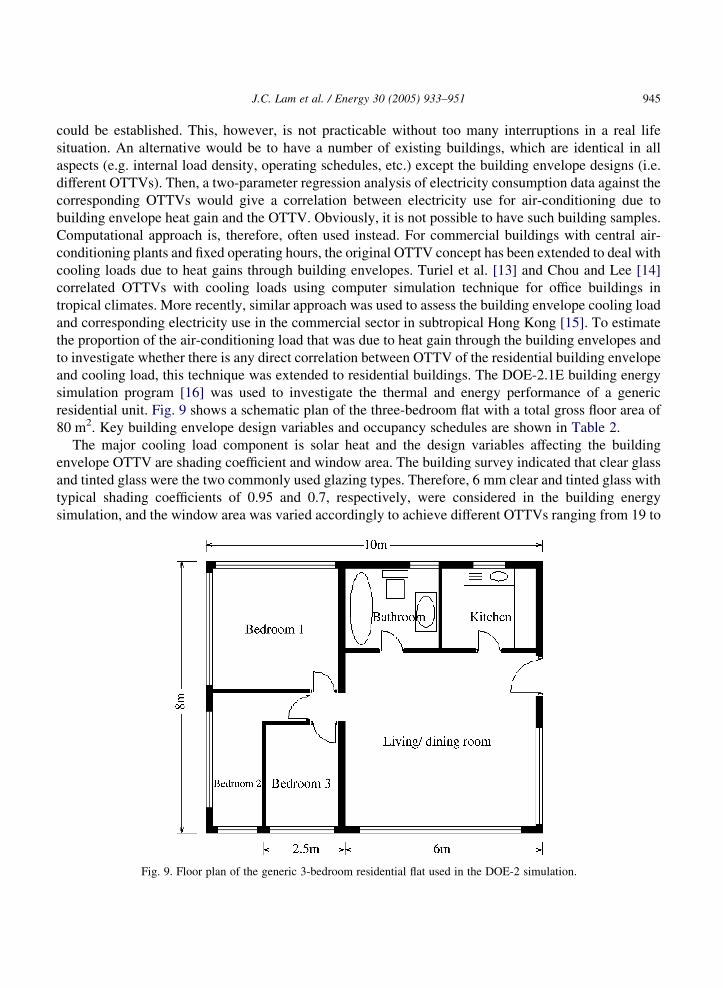
residential unit. Fig. 9 shows a schematic plan of the three-bedroom flat with a total gross floor area of
80 m2. Key building envelope design variables and occupancy schedules are shown in Table 2.
The major cooling load component is solar heat and the design variables affecting the building
envelope OTTV are shading coefficient and window area. The building survey indicated that clear glass
and tinted glass were the two commonly used glazing types. Therefore, 6 mm clear and tinted glass with
typical shading coefficients of 0.95 and 0.7, respectively, were considered in the building energy
simulation, and the window area was varied accordingly to achieve different OTTVs ranging from 19 to
Fig. 9. Floor plan of the generic 3-bedroom residential flat used in the DOE-2 simulation.

Table 2
Summary of key design variables and schedules
Materials U-Value (W/m2K)
External walls 125–150 mm reinforced concrete with ceramic tile finish (external
surface absorption coefficientZ0.5, 0.8 and 0.9)
2.1–2.9
Windows 6 mm clear glass (shading coefficientZ0.95) 5.6
6 mm tinted glass (shading coefficientZ0.7) (window-to-wall ratioZ4–56%)
Roof Reinforced concrete with 40 mm insulation (extruded polystyrene
foam)
0.64
Indoor condition 22.3 8C
Occupancy schedule
Living room Bedrooms
Mon–Fri 6 pm–11 pm 11 pm–7 am
Sat 2 pm–11 pm 11 pm–7 am
Sun 9 am–12 noon 11 pm–9 am
Lighting load 60 W for bedrooms 2 and 3, 120 W for bedroom 1, 200 W for living/
dining room
Lighting schedule Corresponds to occupancy except bedrooms, where a nominal lighting
load of 10% was applied
Equipment load
(TV/VCR, PC)
118 W for bedrooms, 150 W for living/dining room
Equipment schedule Corresponds to occupancy except bedrooms, where a nominal
equipment load of 10% was applied
Air-conditioning
schedule
Corresponds to occupancy
Infiltration 0.6 air changes per hour
Period of cooling
analysis
6-month (May–October)
J.C. Lam et al. / Energy 30 (2005) 933–951946
65 W/m2. Ten different WWRs were investigated. Other design variables affecting the OTTV and
cooling load are the external walls and their surface finishes. Five different external wall U-values were
considered (2.1–2.9 W/m2K, interval of 0.2 W/m2K). The corresponding wall thickness varied from 125
to 250 mm. With a typical density of 2400 kg/m3 for reinforced concrete commonly used for residential
buildings in Hong Kong, the mass of the external walls ranged from 300 to 600 kg/m2. Thermal mass is
generally not considered a key design parameter because the daily diurnal temperature is small (less than
5 8C) during the hot summer months in subtropical Hong Kong [17]. Three external surface finishes with
typical absorption coefficients of 0.5, 0.8 and 0.9 were also considered. Strictly speaking, a total of 300
simulation runs (10 WWRs, two glass types, five U-values and three absorption coefficients) would be
required to account for all possible combinations. Earlier works on commercial building envelopes had
shown that the dominant factor was solar heat gain in tropical and subtropical climates [14,15]. In order
to keep the simulation manageable, a total of 36 simulation runs were conducted (20 for WWR and glass
type combinations, 10 for U-value with mean WWR and glass type, and six for surface absorption
coefficients with mean WWR and glass type). The DOE-2 computer program performed hour-by-hour
computations of the cooling loads and the corresponding energy requirements. The hourly weather
database used for the energy simulation was the typical meteorological year compiled for Hong
Kong, which represented the prevailing weather conditions in terms of the climatic influence on thermal
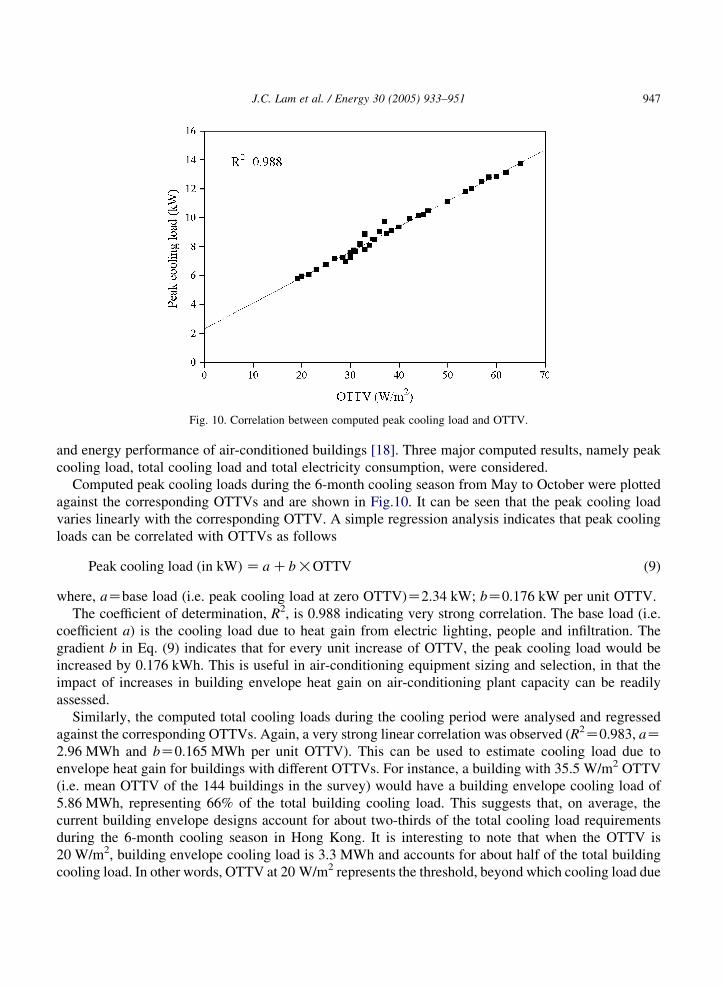
Fig. 10. Correlation between computed peak cooling load and OTTV.
J.C. Lam et al. / Energy 30 (2005) 933–951 947
and energy performance of air-conditioned buildings [18]. Three major computed results, namely peak
cooling load, total cooling load and total electricity consumption, were considered.
Computed peak cooling loads during the 6-month cooling season from May to October were plotted
against the corresponding OTTVs and are shown in Fig.10. It can be seen that the peak cooling load
varies linearly with the corresponding OTTV. A simple regression analysis indicates that peak cooling
loads can be correlated with OTTVs as follows
Peak cooling load ðin kWÞ Z a Cb!OTTV (9)
where, aZbase load (i.e. peak cooling load at zero OTTV)Z2.34 kW; bZ0.176 kW per unit OTTV.
The coefficient of determination, R2, is 0.988 indicating very strong correlation. The base load (i.e.
coefficient a) is the cooling load due to heat gain from electric lighting, people and infiltration. The
gradient b in Eq. (9) indicates that for every unit increase of OTTV, the peak cooling load would be
increased by 0.176 kWh. This is useful in air-conditioning equipment sizing and selection, in that the
impact of increases in building envelope heat gain on air-conditioning plant capacity can be readily
assessed.
Similarly, the computed total cooling loads during the cooling period were analysed and regressed
against the corresponding OTTVs. Again, a very strong linear correlation was observed (R2Z0.983, aZ2.96 MWh and bZ0.165 MWh per unit OTTV). This can be used to estimate cooling load due to
envelope heat gain for buildings with different OTTVs. For instance, a building with 35.5 W/m2 OTTV
(i.e. mean OTTV of the 144 buildings in the survey) would have a building envelope cooling load of
5.86 MWh, representing 66% of the total building cooling load. This suggests that, on average, the
current building envelope designs account for about two-thirds of the total cooling load requirements
during the 6-month cooling season in Hong Kong. It is interesting to note that when the OTTV is
20 W/m2, building envelope cooling load is 3.3 MWh and accounts for about half of the total building
cooling load. In other words, OTTV at 20 W/m2 represents the threshold, beyond which cooling load due
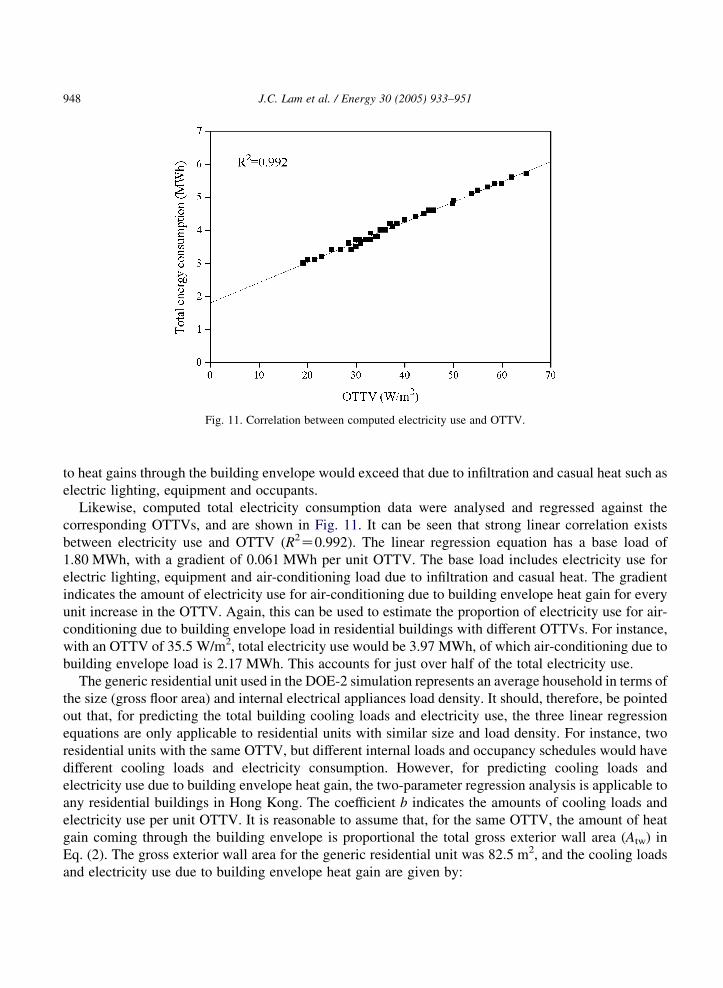
Fig. 11. Correlation between computed electricity use and OTTV.
J.C. Lam et al. / Energy 30 (2005) 933–951948
to heat gains through the building envelope would exceed that due to infiltration and casual heat such as
electric lighting, equipment and occupants.
Likewise, computed total electricity consumption data were analysed and regressed against the
corresponding OTTVs, and are shown in Fig. 11. It can be seen that strong linear correlation exists
between electricity use and OTTV (R2Z0.992). The linear regression equation has a base load of
1.80 MWh, with a gradient of 0.061 MWh per unit OTTV. The base load includes electricity use for
electric lighting, equipment and air-conditioning load due to infiltration and casual heat. The gradient
indicates the amount of electricity use for air-conditioning due to building envelope heat gain for every
unit increase in the OTTV. Again, this can be used to estimate the proportion of electricity use for air-
conditioning due to building envelope load in residential buildings with different OTTVs. For instance,
with an OTTV of 35.5 W/m2, total electricity use would be 3.97 MWh, of which air-conditioning due to
building envelope load is 2.17 MWh. This accounts for just over half of the total electricity use.
The generic residential unit used in the DOE-2 simulation represents an average household in terms of
the size (gross floor area) and internal electrical appliances load density. It should, therefore, be pointed
out that, for predicting the total building cooling loads and electricity use, the three linear regression
equations are only applicable to residential units with similar size and load density. For instance, two
residential units with the same OTTV, but different internal loads and occupancy schedules would have
different cooling loads and electricity consumption. However, for predicting cooling loads and
electricity use due to building envelope heat gain, the two-parameter regression analysis is applicable to
any residential buildings in Hong Kong. The coefficient b indicates the amounts of cooling loads and
electricity use per unit OTTV. It is reasonable to assume that, for the same OTTV, the amount of heat
gain coming through the building envelope is proportional the total gross exterior wall area (Atw) in
Eq. (2). The gross exterior wall area for the generic residential unit was 82.5 m2, and the cooling loads
and electricity use due to building envelope heat gain are given by:
J.C. Lam et al. / Energy 30 (2005) 933–951 949
Peak cooling loadðkWÞ Z 0:176!Atw=82:5 (10)
Cooling load ðduring May–OctÞðMWhÞ Z 0:165!Atw=82:5 (11)
Electricity Useðduring May–OctÞðMWhÞ Z 0:061!Atw=82:5 (12)
7. Discussion and conclusions
The primary aim of the present work is to assess, in terms of OTTV, energy efficiency of the
prevailing residential building envelope designs in subtropical Hong Kong. A simple method to estimate
cooling loads and energy use for air-conditioning due to the heat gain through building envelopes was
developed, which would enable architects and engineers to quickly compare the relative energy
efficiency of different building envelope designs. This is particularly useful in the initial conceptual
design stage when different building schemes are being considered. In general, internal shading devices
are not taken into account in the OTTV formulation because architects and engineers do not consider
internal shading devices, which are usually left to the occupants to decide. However, it would be
interesting to have some indications of the likely impacts that internal shading devices might have on the
cooling loads and electricity use. To this end, one particular simulation was conducted based on the same
generic residential unit with an OTTV of 35.5 W/m2, which is the mean value found in the building
survey. Key building design variables are the same as those shown in Table 2 (mean values were
assumed wherever appropriate). Venetian blinds were used in the DOE-2 simulation and assumed to be
closed whenever the windows were exposed to direct solar radiation. The computed peak cooling load,
total cooling load (May–October) and corresponding electricity were 7.32 kWh, 7.63 and 3.53 MWh,
respectively, representing reductions of 15, 14 and 11% when compared with the case without internal
shading.
Likewise, since the regression analysis was based on computer energy simulation, it would be helpful
to have some idea about the simulation accuracy by comparing some of the computation results with
measured data. A detailed comparison, however, would itself be a major study. In real life domestic
situation, it is impracticable, if not impossible, to obtain experimental data on cooling loads without
adversely affecting the daily routine of the occupants because of the experimental process and
instrumentation involved. For electricity consumption data, portable power analysers and energy meters
can be used without too much disruption [4]. In order to compare like for like of the energy used data,
detailed records of the occupants’ daily routines during the entire cooling season (i.e. May–October)
would be required. For instance, occupancy schedules (the times people are at home) and user behaviour
(when do they switched on/off lighting, air-conditioners and other electrical appliances), etc. These data
are required for the DOE-2 computer energy simulation. It would be difficult to find people who would
have the time and are willing to do this, not to mention the concern about privacy. Nevertheless, an order
of magnitude comparison would still be useful. In this study, a residential flat with size and internal
density similar to the generic unit and had kept records (monthly electricity bills) of the electricity use
during the cooling season in 2003 was selected from the building survey sample. Besides, the household
had not brought or replaced any major electrical appliances. The total electricity use during the 6-month
period was 5.32 MWh. Refrigerator, washing machine and other miscellaneous electrical appliances that
were not considered in the DOE-2 simulation were identified and their power ratings and operating
J.C. Lam et al. / Energy 30 (2005) 933–951950
patterns obtained. Based on the power ratings and operating patterns, electricity use for these appliances
was estimated to be 0.85 MWh. The measured electricity consumption was, therefore, 4.47 MWh. Since,
the actual consumption was in 2003, a special hourly weather database for 2003 was generated for the
DOE-2 simulation, and the computed electricity use was 3.97 MWh, about 11% lower than the metered
value.
There has been substantial growth in energy use in Hong Kong, especially electricity consumption for
air-conditioning in the residential sector during the hot, humid summer months. Based on long-term
measured hourly weather data, a set of climatic parameters were derived for the OTTV calculation of
residential building envelope designs. A total of 144 residential buildings completed during a 10-year
period from 1992 to 2001 were surveyed, and the corresponding OTTVs determined. It was found the
OTTVs varied from 27 to 41 W/m2 with a mean value of 35.5 W/m2. Computer energy simulation
technique was used to investigate the thermal and energy performance of a generic residential unit.
Simple regression analysis was conducted to correlate the computed cooling loads and electricity
consumption data with the corresponding OTTVs. It was found that the peak cooling load (in kW), total
cooling load (in MWh) during the 6-month cooling period and electricity consumption (in MWh) could
be expressed in terms of simple two-parameter linear regression equations. For every unit increase in the
OTTV, the peak cooling load, total cooling load (during the 6-month cooling season from May to
October) and the corresponding electricity consumption would be raised by 2.1 W, 2.0 and 0.74 kWh per
unit area of the total exterior wall area, respectively. These regression equations could be used to
estimate the cooling loads and corresponding energy use for residential buildings with different OTTVs.
On average, the prevailing building envelope designs identified in the building survey accounted for
about two-thirds of the total cooling load requirements during the 6-month cooling season in Hong
Kong, and cooling load due to heat gain through the building envelope was twice as much as that due to
infiltration and casual heat such as electric lighting, equipment and occupants. Although, the work was
conducted for subtropical Hong Kong, the methodology could be applied to other cities with similar
climates and building developments. Considering the rapid economic growth and building development
in mainland China, especially in the south, this work would be of great interest to researchers and
building designers concerned with building energy efficiency and the environment.
One obvious question is what OTTV would be considered appropriate for the residential building
envelope designs in Hong Kong. This would involve many issues, technical as well as financial. A
balance has to be struck between energy efficiency, cost and freedom in architectural designs. For
instance, on a life-cycle basis, would additional thermal insulation or external shading devices result in
financial and environmental cost savings? Would legislative controls of building envelope designs in the
residential sector affect the current architectural designs and construction practices? More work is
required.
Acknowledgements
The work described in this paper was supported by a grant from City University of Hong Kong
(Project No. 7001409). The authors would like to thank the student assistants for their help with the
building survey and data collection.
J.C. Lam et al. / Energy 30 (2005) 933–951 951
References
[1] Census and Statistics Department. Hong Kong energy statistics (1979–2001). 19/F, Wanchai Tower, 12 Harbour Road,
Wan Chai, Hong Kong, China; 2002.
[2] Census and Statistics Department. Hong Kong monthly digest of statistics (1979–2001). 19/F, Wanchai Tower, 12
Harbour Road, Wan Chai, Hong Kong, China (monthly publications).
[3] Lam JC. A survey of electricity consumption and user behaviour in some government staff quarters. Build Res Inf 1993;
21(2):109–16.
[4] Lam JC. An analysis of residential sector energy use in Hong Kong. Energy 1996;21(1):1–8.
[5] American Society of Heating Refrigerating and Air Conditioning Engineers. Energy conservation in new building design,
ASHRAE Standard 90A-1980. Atlanta, GA: ASHRAE; 1980.
[6] Lam JC, Li DHW. Household energy use and comfort cooling in Hong Kong. Int J Housing Sci 2000;24(2):195–203.
[7] Li DHW, Lam JC. Measurements of solar radiation and illuminance on vertical surfaces and daylighting implications.
Renew Energy 2000;20(4):389–404.
[8] American Society of Heating Refrigerating and Air Conditioning Engineers. ASHRAE handbook 1985 fundamentals.
Atlanta, GA: ASHRAE; 1993. Chapter 27.
[9] American Society of Heating Refrigerating and Air Conditioning Engineers. ASHRAE Handbook 1985 Fundamentals.
Atlanta, GA: ASHRAE; 1993. Chapter 23.
[10] Lam JC, Lun IYF, Li DHW. Long-term wind speed statistics and implications for outside surface thermal resistance.
Archit Sci Rev 2000;43(2):95–100.
[11] Buildings Department. Monthly digest (1992–2001). 12/F, Pioneer Centre, 750 Nathan Road, Kowloon, Hong Kong,
China (monthly publications).
[12] Lam JC. A survey of existing residential buildings and envelope designs in Hong Kong. Int J Housing Sci 1994;18(2):
113–24.
[13] Turiel I, Curtis R, Levine MD. Analysis of energy conservation standards for Singapore office buildings. Energy 1985;
10(1):95–107.
[14] Chou SK, Lee YK. A simplified overall thermal transfer value equation for building envelopes. Energy 1988;13(8):
657–70.
[15] Lam JC. Building envelope loads and commercial sector electricity use in Hong Kong. Energy 1995;20(3):189–94.
[16] Lawrence Berkeley National Laboratory. DOE2 supplement version 2.1E, report no. LBL-34947. Berkeley, CA:
Lawrence Berkeley National Laboratory, University of California; 1993.
[17] Li DHW, Lam JC. An analysis of climatic variables and design implications. Archit Sci Rev 1999;42(1):15–25.
[18] Lam JC, Hui SCM, Chan ALS. A statistical approach to the development of a typical meteorological year for Hong Kong.
Archit Sci Rev 1996;39(4):201–9.