reservoir management under water injection a …€¦ · ppt file · web view · 2005-10-27keep...
TRANSCRIPT

Reservoir ManagementReservoir ManagementUnder Water InjectionUnder Water Injection
A Worldwide PerspectiveA Worldwide Perspective
Dr. William M. CobbDallas, Texas
2nd National Meeting on Secondary and Assisted Oil RecoverySeptember 8–9, 2005Malargue, Argentina
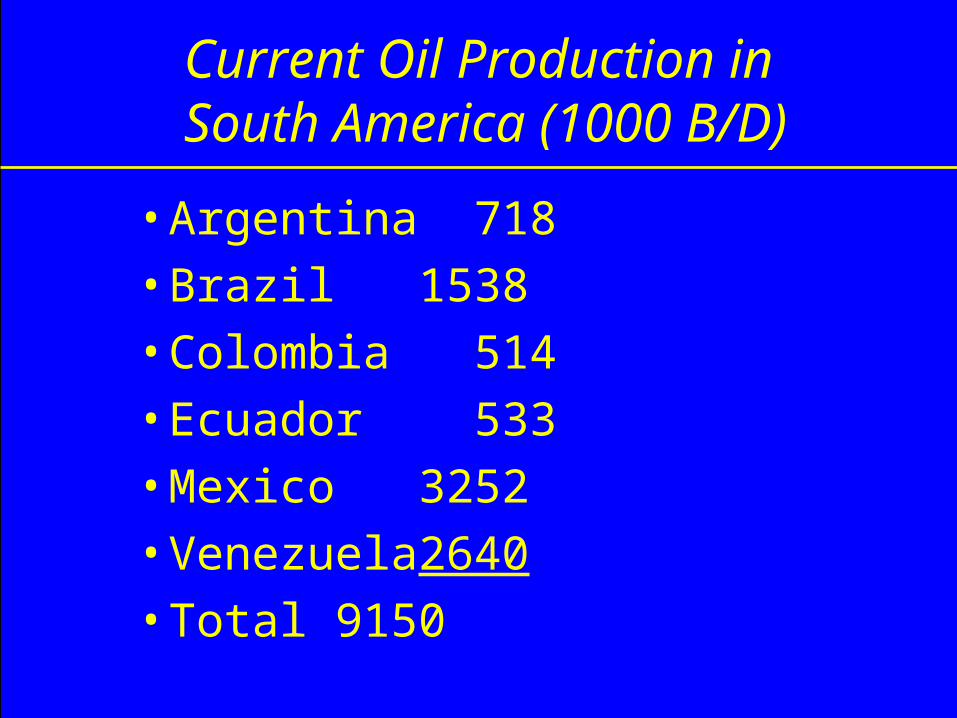
Current Oil Production in South America (1000 B/D)
• Argentina 718• Brazil 1538• Colombia 514• Ecuador 533• Mexico 3252• Venezuela 2640• Total 9150
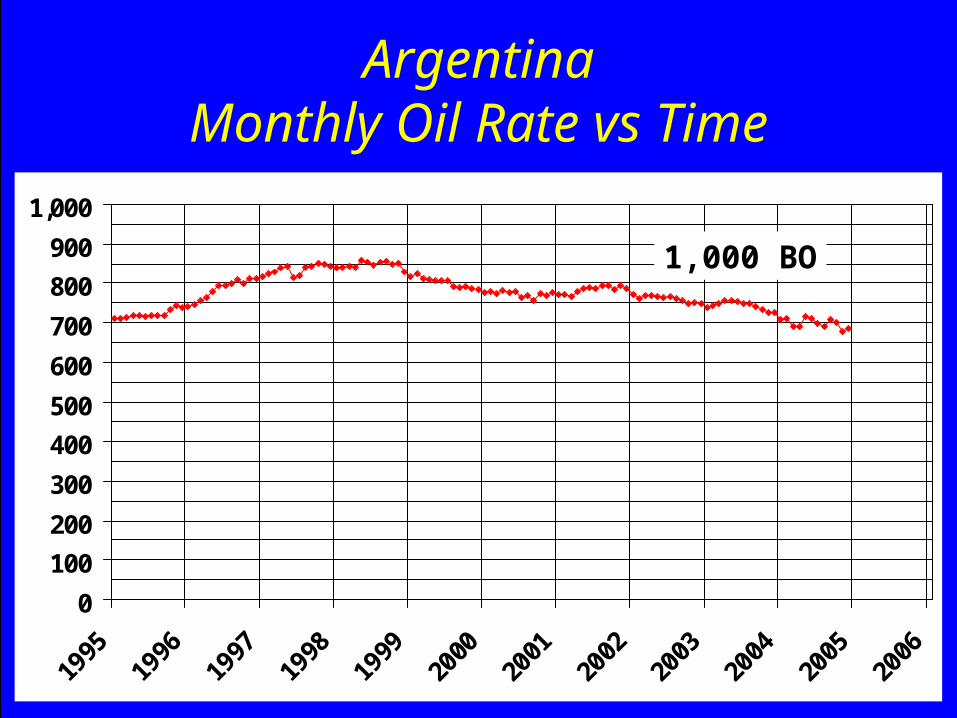
ArgentinaMonthly Oil Rate vs Time
0100200300400500600700800900
1,000
1,000 BO
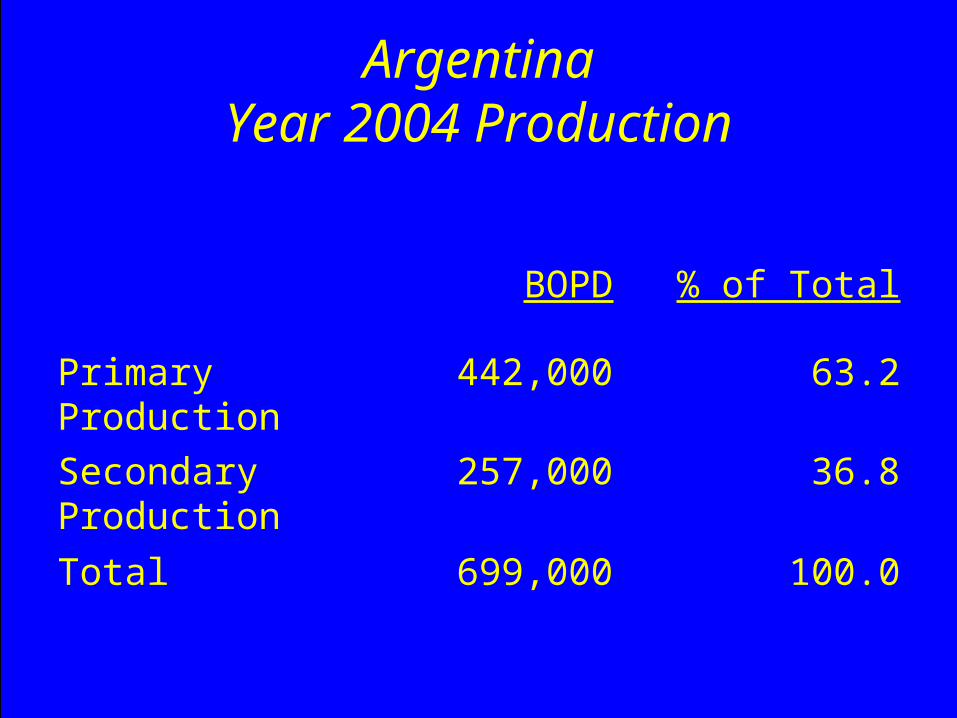
ArgentinaYear 2004 Production
BOPD % of Total
Primary Production
442,000 63.2
Secondary Production
257,000 36.8
Total 699,000 100.0
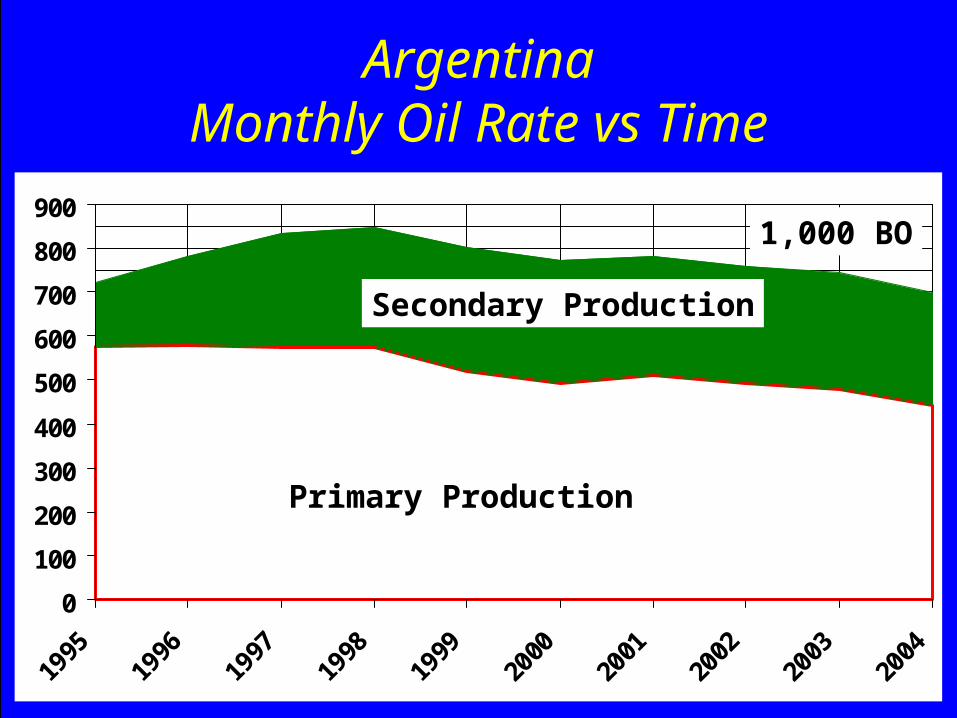
ArgentinaMonthly Oil Rate vs Time
0100200300400500600700800900
1,000 BO
Primary Production
Secondary Production
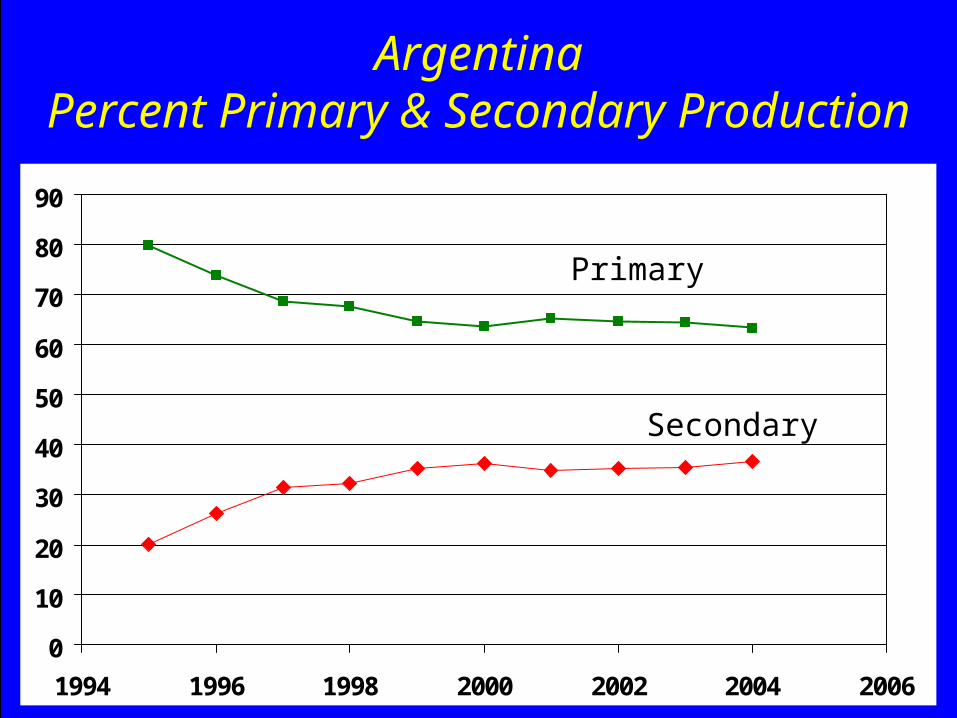
ArgentinaPercent Primary & Secondary Production
0
10
20
30
40
50
60
70
80
90
1994 1996 1998 2000 2002 2004 2006
Primary
Secondary
.
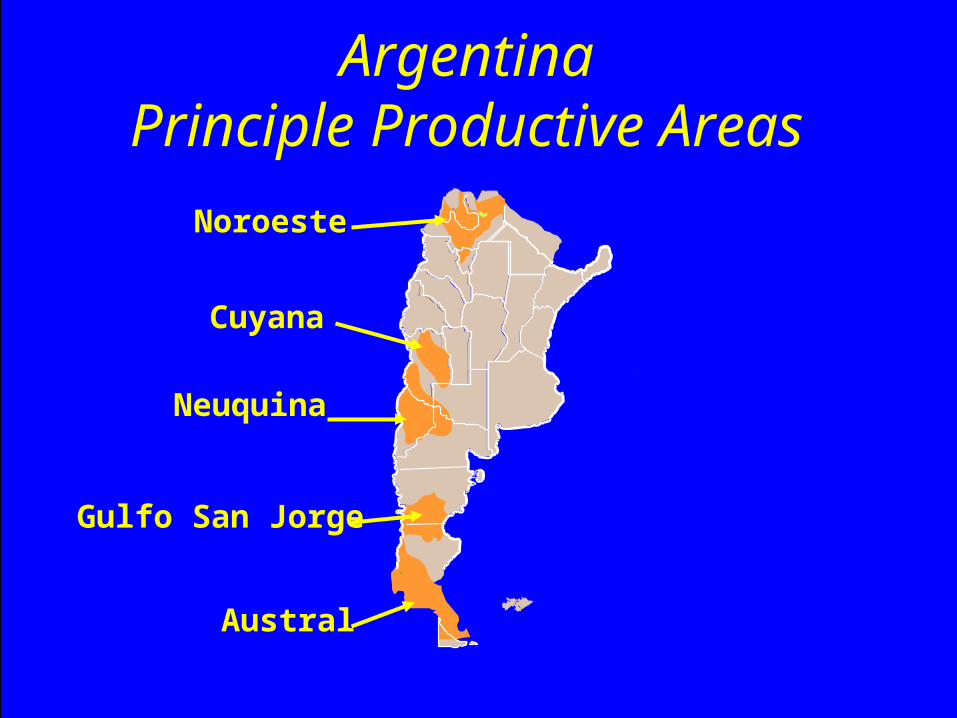
ArgentinaPrinciple Productive Areas
Noroeste
Cuyana
Neuquina
Gulfo San Jorge
Austral
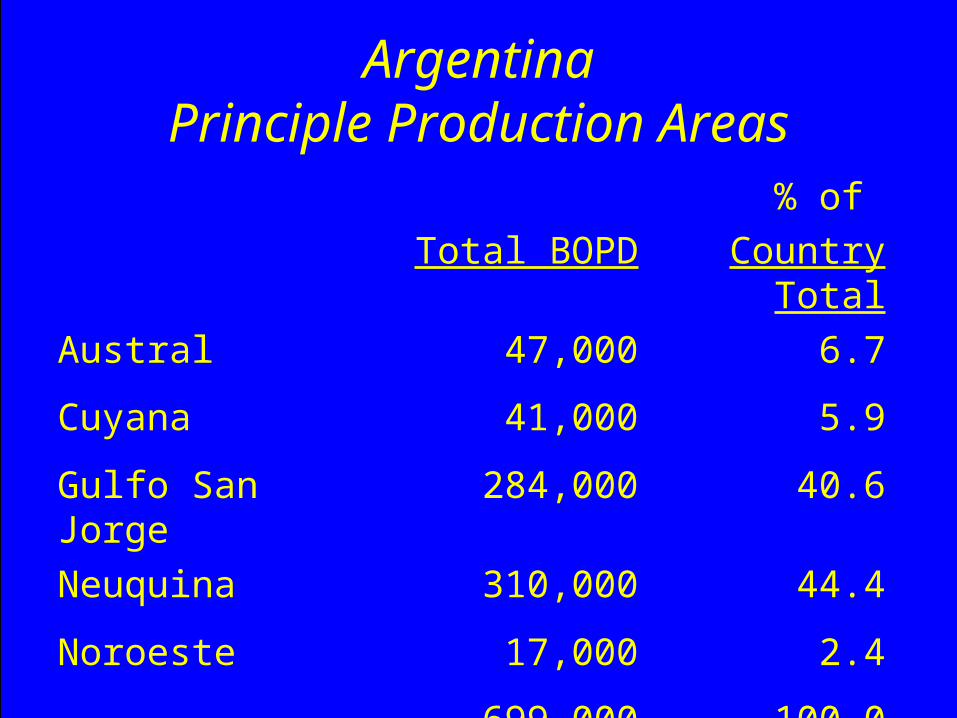
ArgentinaPrinciple Production Areas
Total BOPD% of
Country TotalAustral 47,000 6.7
Cuyana 41,000 5.9
Gulfo San Jorge 284,000 40.6
Neuquina 310,000 44.4
Noroeste 17,000 2.4
699,000 100.0
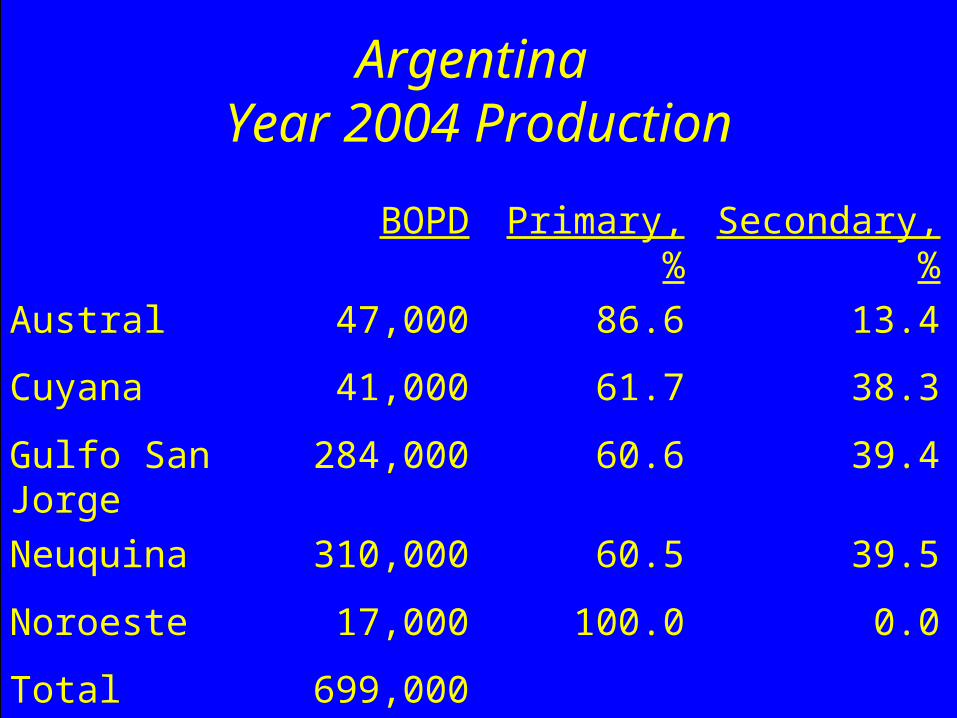
Argentina Year 2004 Production
BOPD Primary, % Secondary, %
Austral 47,000 86.6 13.4
Cuyana 41,000 61.7 38.3
Gulfo San Jorge 284,000 60.6 39.4
Neuquina 310,000 60.5 39.5
Noroeste 17,000 100.0 0.0
Total 699,000
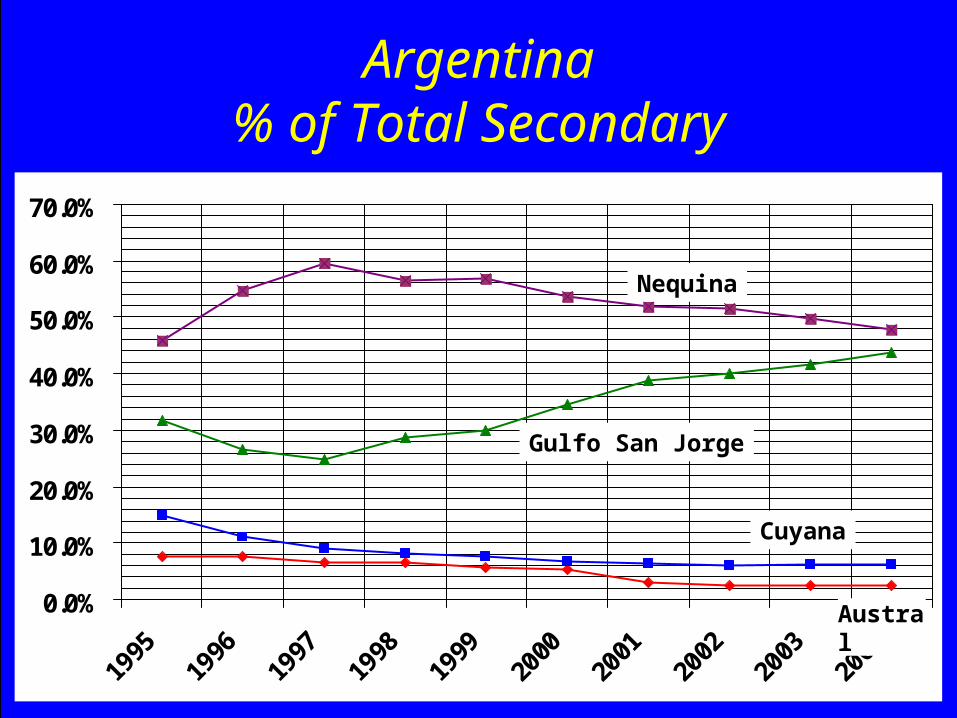
Argentina% of Total Secondary
0.0%
10.0%
20.0%
30.0%
40.0%
50.0%
60.0%
70.0%
Nequina
Gulfo San Jorge
Cuyana
Austral
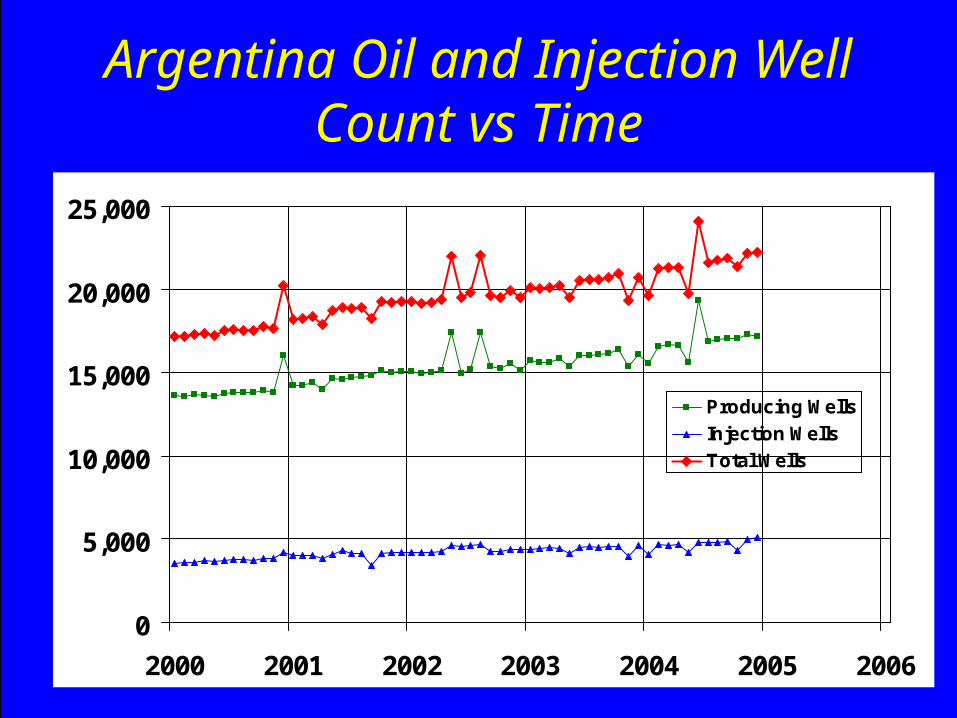
Argentina Oil and Injection Well Count vs Time
0
5,000
10,000
15,000
20,000
25,000
2000 2001 2002 2003 2004 2005 2006
Producing WellsInjection WellsTotal Wells
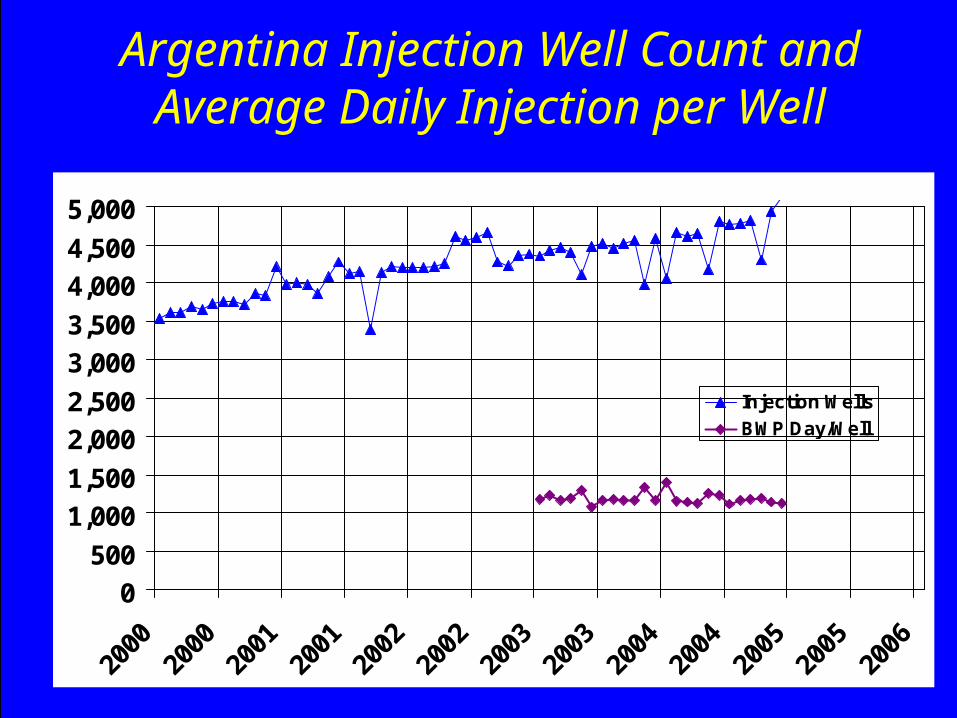
Argentina Injection Well Count and Average Daily Injection per Well
0500
1,0001,5002,0002,5003,0003,5004,0004,5005,000
Injection WellsBWP Day/Well
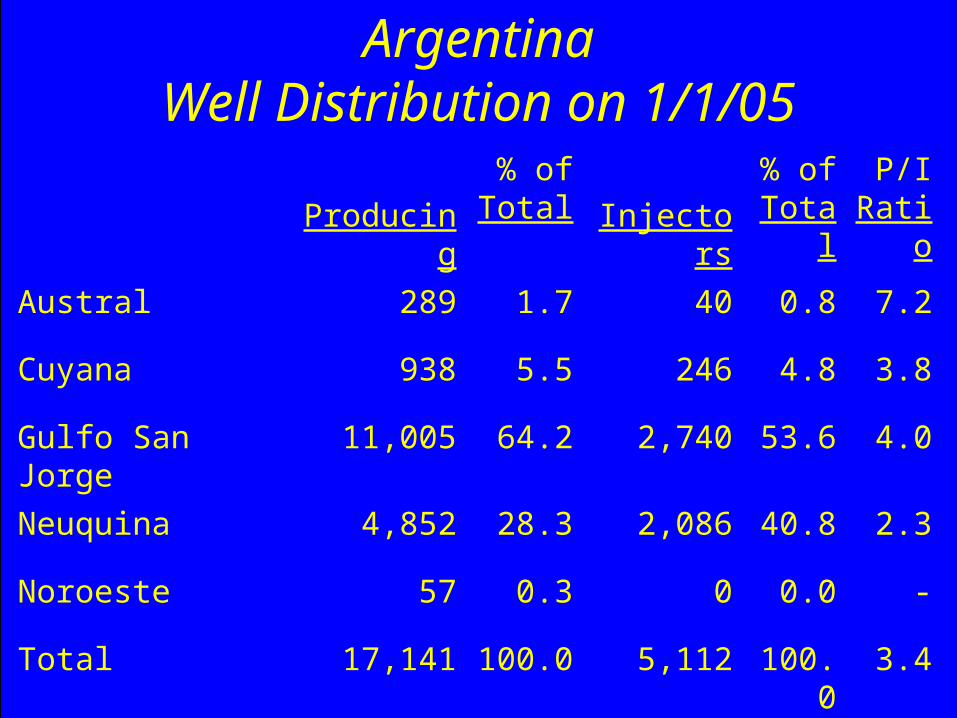
ArgentinaWell Distribution on 1/1/05
Producing% of Total Injectors
% of Total
P/I Ratio
Austral 289 1.7 40 0.8 7.2
Cuyana 938 5.5 246 4.8 3.8
Gulfo San Jorge 11,005 64.2 2,740 53.6 4.0
Neuquina 4,852 28.3 2,086 40.8 2.3
Noroeste 57 0.3 0 0.0 -
Total 17,141 100.0 5,112 100.0 3.4
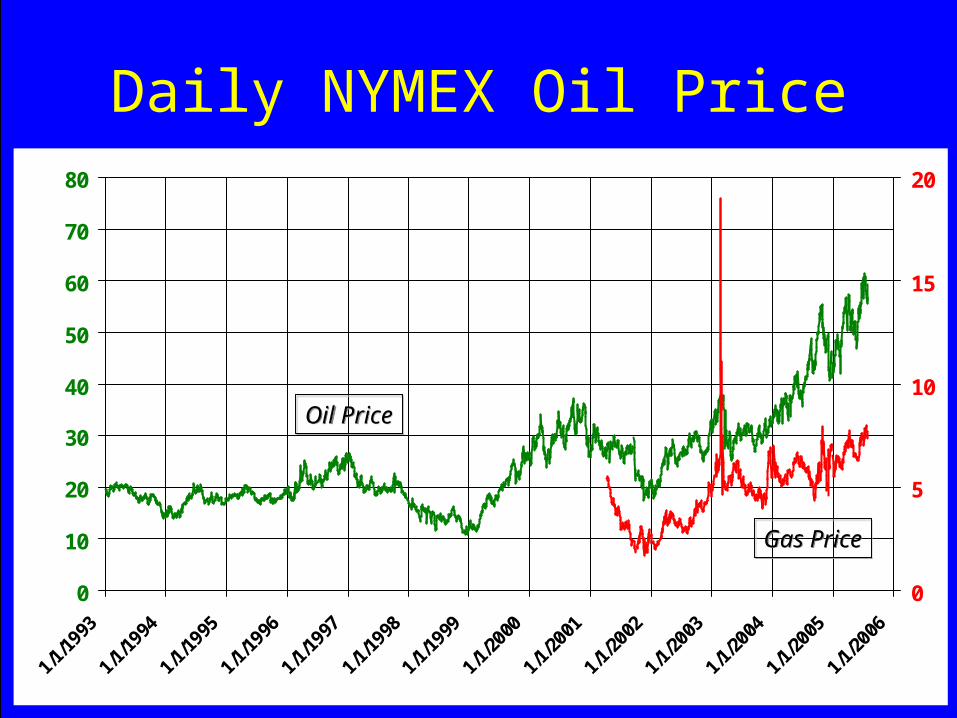
Daily NYMEX Oil Price
0
10
20
30
40
50
60
70
80
0
5
10
15
20
Oil Price
Gas Price

Common Denominators for Common Denominators for Management of Waterfloods on Management of Waterfloods on
a Worldwide Basisa Worldwide Basis
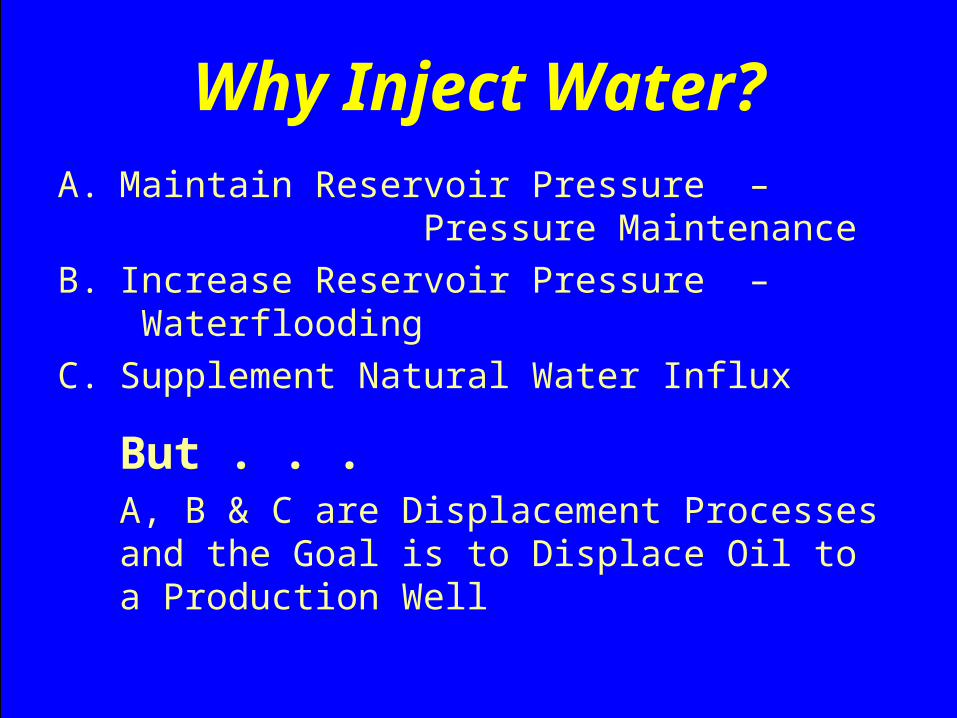
Why Inject Water?A. Maintain Reservoir Pressure –
Pressure MaintenanceB. Increase Reservoir Pressure –
WaterfloodingC. Supplement Natural Water Influx
But . . .A, B & C are Displacement Processes and the Goal is to Displace Oil to a Production Well
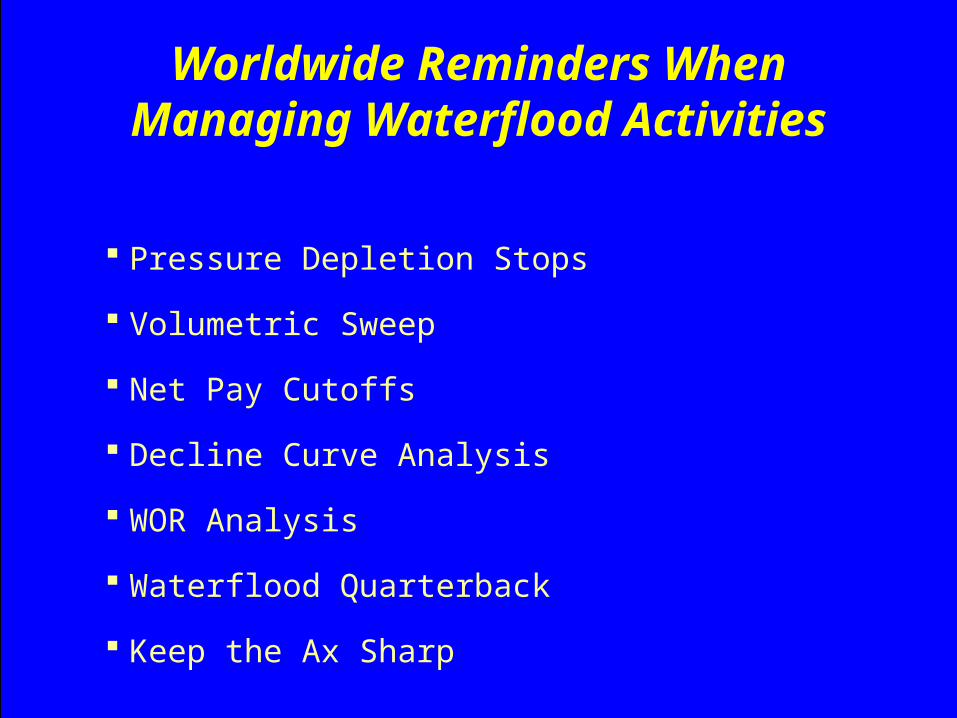
Pressure Depletion Stops
Volumetric Sweep
Net Pay Cutoffs
Decline Curve Analysis
WOR Analysis
Waterflood Quarterback
Keep the Ax Sharp
Worldwide Reminders When Managing Waterflood Activities
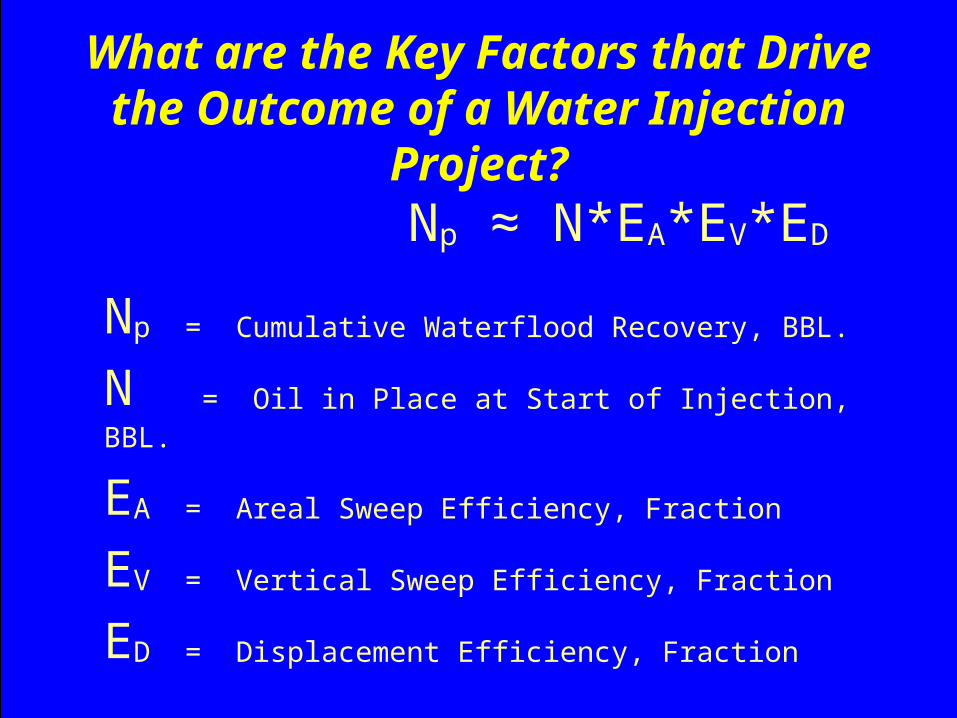
What are the Key Factors that Drive the Outcome of a Water Injection Project?
Np = Cumulative Waterflood Recovery, BBL.
N = Oil in Place at Start of Injection, BBL.
EA = Areal Sweep Efficiency, Fraction
EV = Vertical Sweep Efficiency, Fraction
ED = Displacement Efficiency, Fraction
Np ≈ N*EA*EV*ED
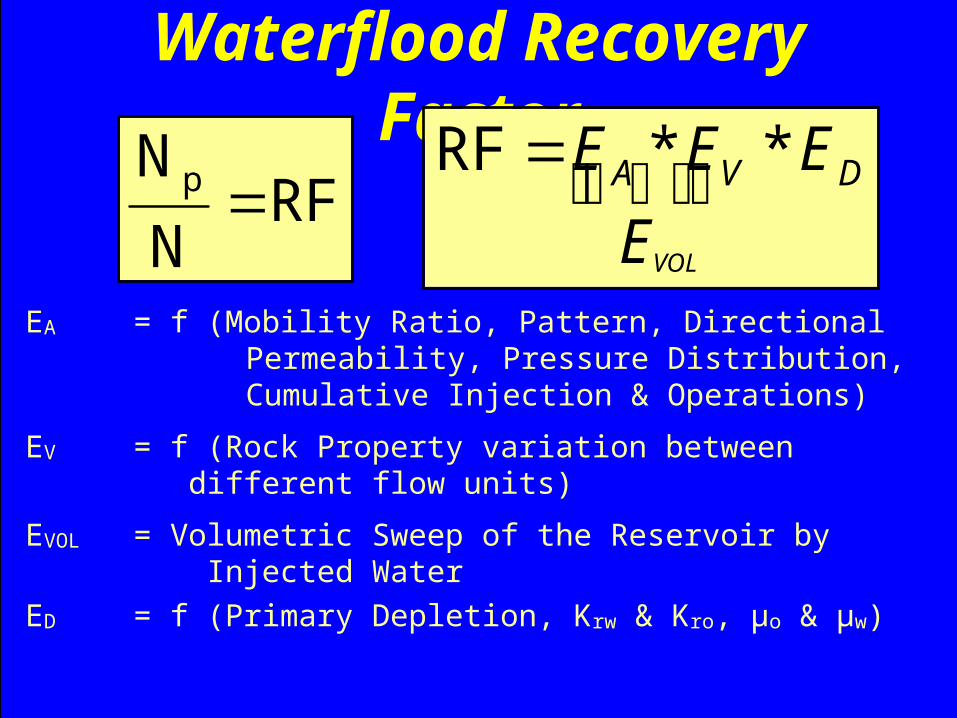
Waterflood Recovery Factor
EA = f (Mobility Ratio, Pattern, Directional Permeability, Pressure Distribution, Cumulative Injection & Operations)
EV = f (Rock Property variation between different flow units)
EVOL = Volumetric Sweep of the Reservoir by Injected Water
ED = f (Primary Depletion, Krw & Kro, μo & μw)
RF NNp DVA E
EEE
VOL
**RF
Traditional Waterflood Volumetric Sweep Efficiency Calculation
Uses Net Cumulative Water Injected (Wi-Wp) Does not Account for Injection losses out of
zone Does not Account for Natural Water Influx
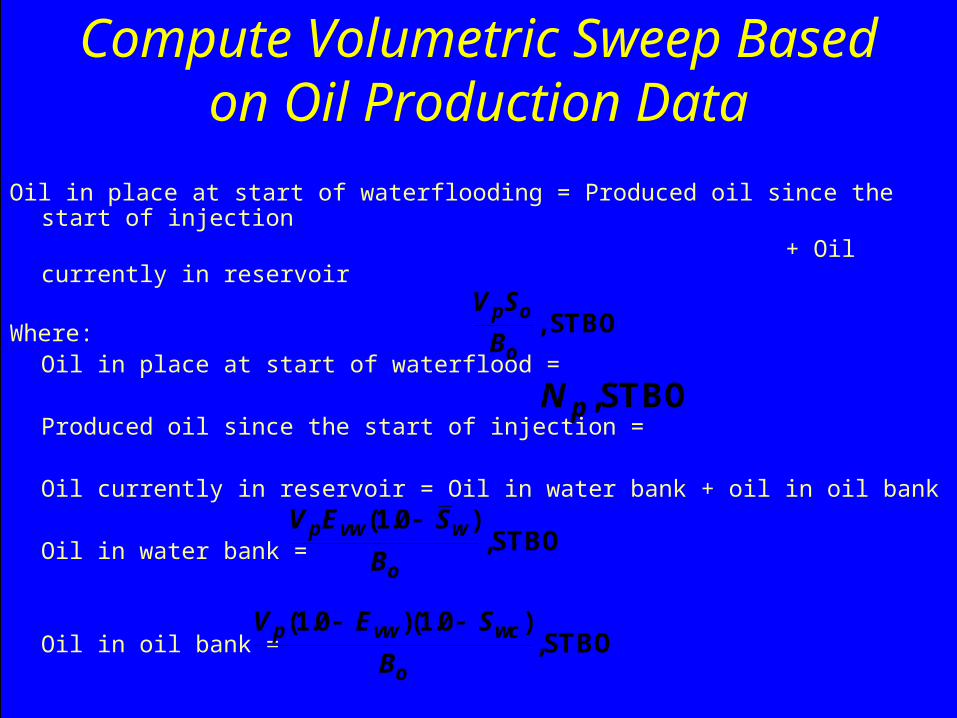
Compute Volumetric Sweep Based on Oil Production Data
Oil in place at start of waterflooding = Produced oil since the start of injection + Oil currently in reservoir
Where:Oil in place at start of waterflood =
Produced oil since the start of injection =
Oil currently in reservoir = Oil in water bank + oil in oil bank
Oil in water bank =
Oil in oil bank =
, STBOp o
o
V SB
,STBOpN
(1.0 ),STBOp vw w
o
V E SB
(1.0 )(1.0 ),STBOp vw wc
o
V E SB
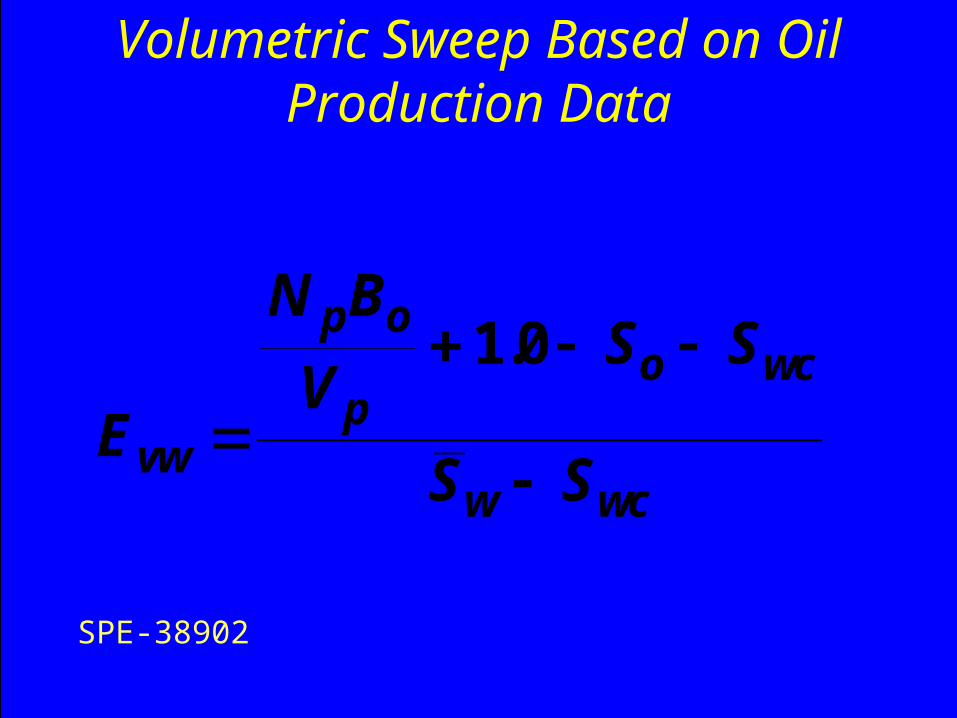
1.0p oo wc
pvw
w wc
N BS S
VE
S S
Volumetric Sweep Based on Oil Production Data
SPE-38902
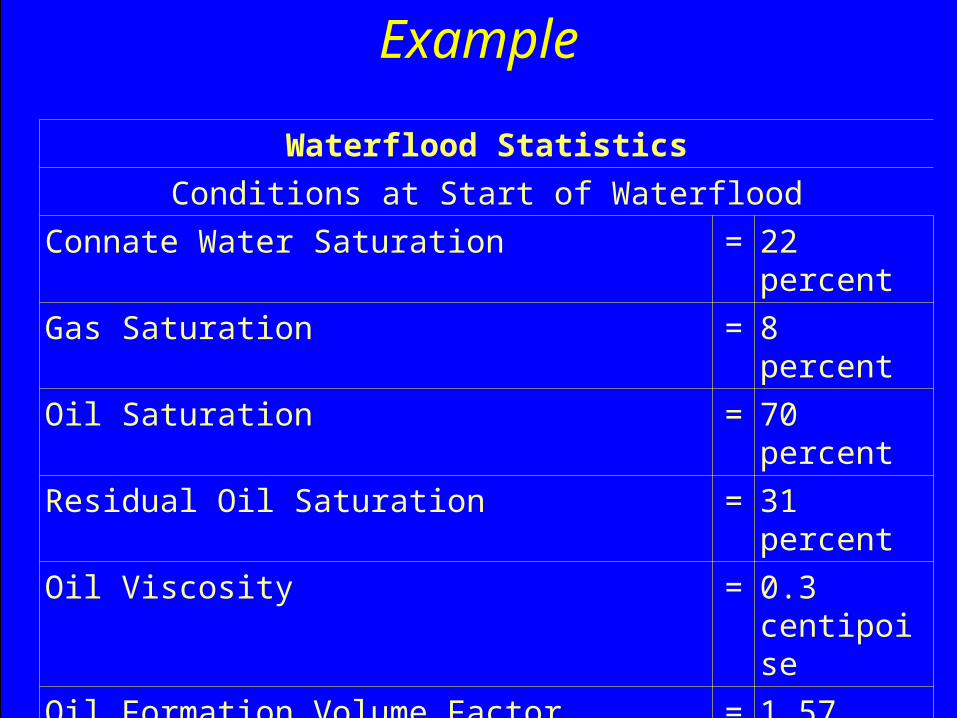
Example
Waterflood StatisticsConditions at Start of Waterflood
Connate Water Saturation = 22 percentGas Saturation = 8 percentOil Saturation = 70 percentResidual Oil Saturation = 31 percentOil Viscosity = 0.3
centipoiseOil Formation Volume Factor = 1.57
RB/STB
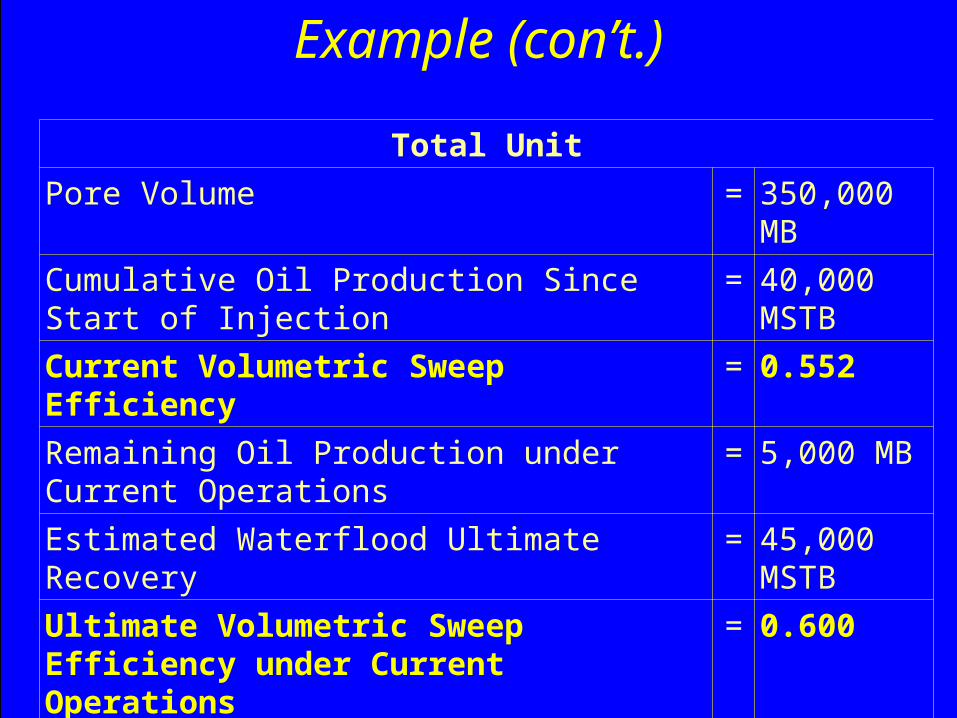
Example (con’t.)
Total UnitPore Volume = 350,000
MBCumulative Oil Production Since Start of Injection
= 40,000 MSTB
Current Volumetric Sweep Efficiency = 0.552Remaining Oil Production under Current Operations
= 5,000 MB
Estimated Waterflood Ultimate Recovery = 45,000 MSTB
Ultimate Volumetric Sweep Efficiency under Current Operations
= 0.600
0.2
0.4
0.6
0.8
1
0 10 20 30 40 50 60 70 80
Production Since Start of Waterflood, Np, MMSTB
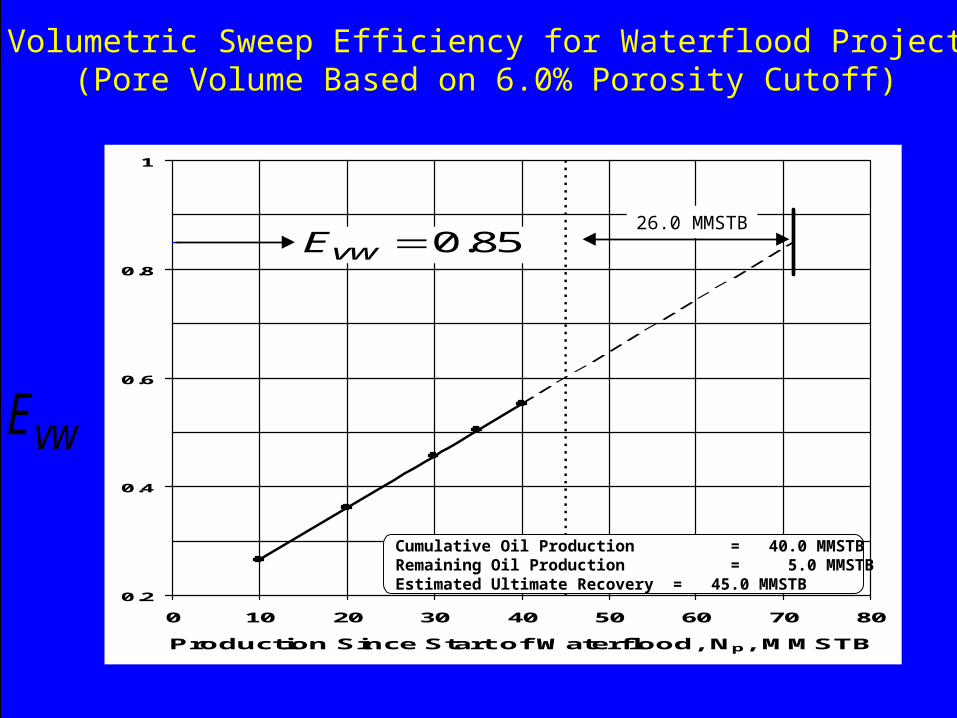
Cumulative Oil Production = 40.0 MMSTBRemaining Oil Production = 5.0 MMSTBEstimated Ultimate Recovery = 45.0 MMSTB
26.0 MMSTB0.85vwE
Volumetric Sweep Efficiency for Waterflood Project(Pore Volume Based on 6.0% Porosity Cutoff)
vwE
0.2
0.4
0.6
0.8
1
0 10 20 30 40 50 60 70 80
Production Since Start of Waterflood, Np, MMSTB
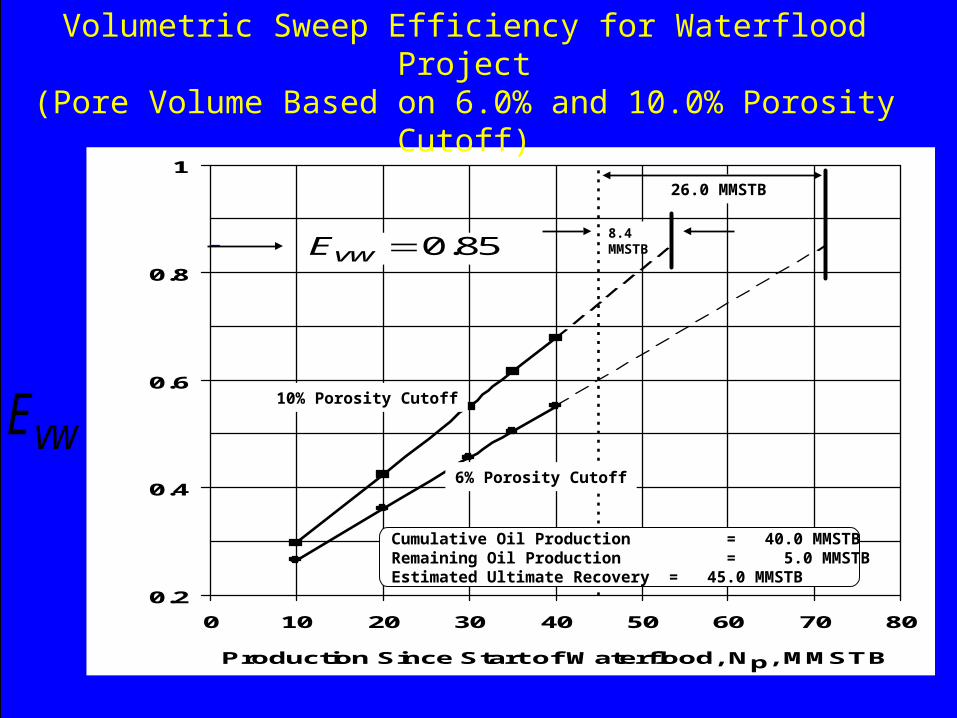
Cumulative Oil Production = 40.0 MMSTBRemaining Oil Production = 5.0 MMSTBEstimated Ultimate Recovery = 45.0 MMSTB
26.0 MMSTB
0.85vwE 8.4MMSTB
10% Porosity Cutoff
6% Porosity Cutoff
Volumetric Sweep Efficiency for Waterflood Project(Pore Volume Based on 6.0% and 10.0% Porosity Cutoff)
vwE
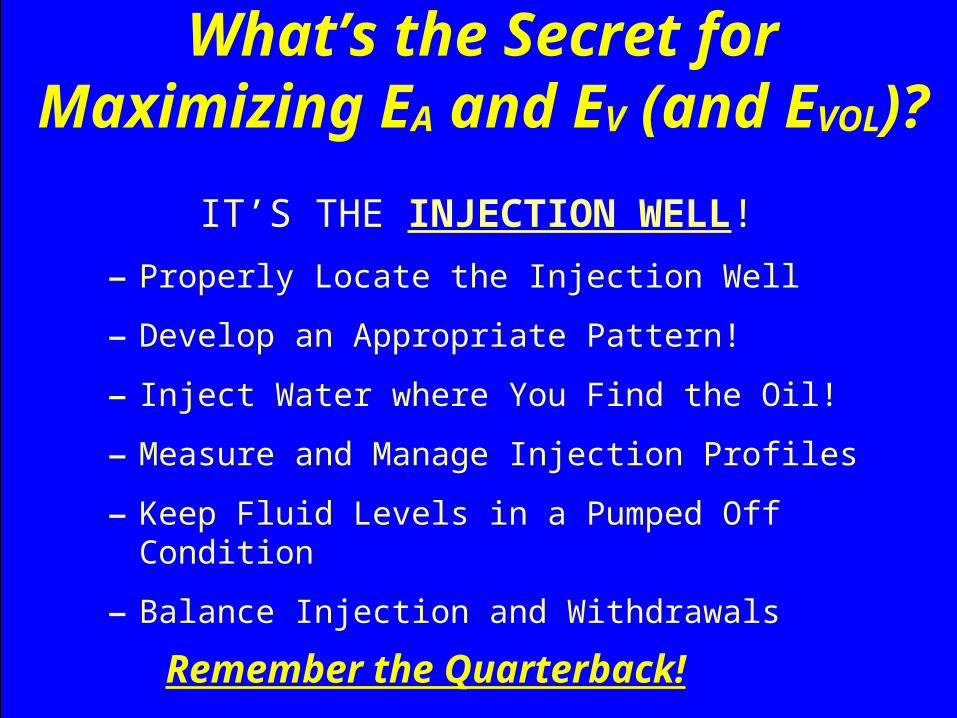
What’s the Secret forMaximizing EA and EV (and EVOL)?
IT’S THE INJECTION WELL!– Properly Locate the Injection Well
– Develop an Appropriate Pattern!
– Inject Water where You Find the Oil!
– Measure and Manage Injection Profiles
– Keep Fluid Levels in a Pumped Off Condition
– Balance Injection and Withdrawals
Remember the Quarterback!

SHIFTING GEARS
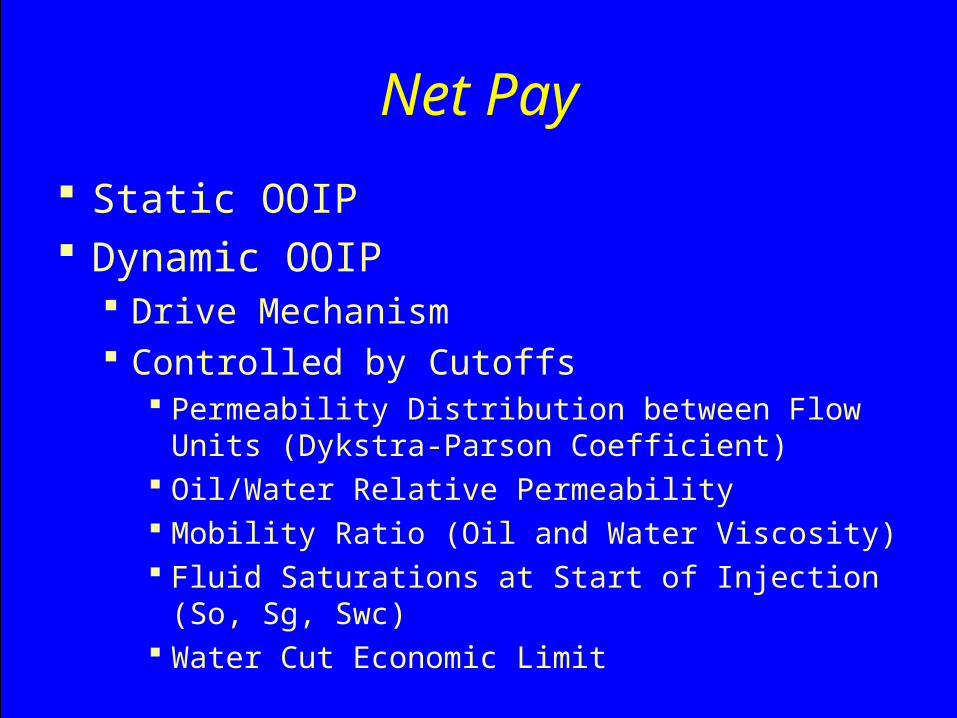
Net Pay Static OOIP Dynamic OOIP
Drive Mechanism Controlled by Cutoffs
Permeability Distribution between Flow Units (Dykstra-Parson Coefficient)
Oil/Water Relative Permeability Mobility Ratio (Oil and Water Viscosity) Fluid Saturations at Start of Injection (So, Sg, Swc) Water Cut Economic Limit
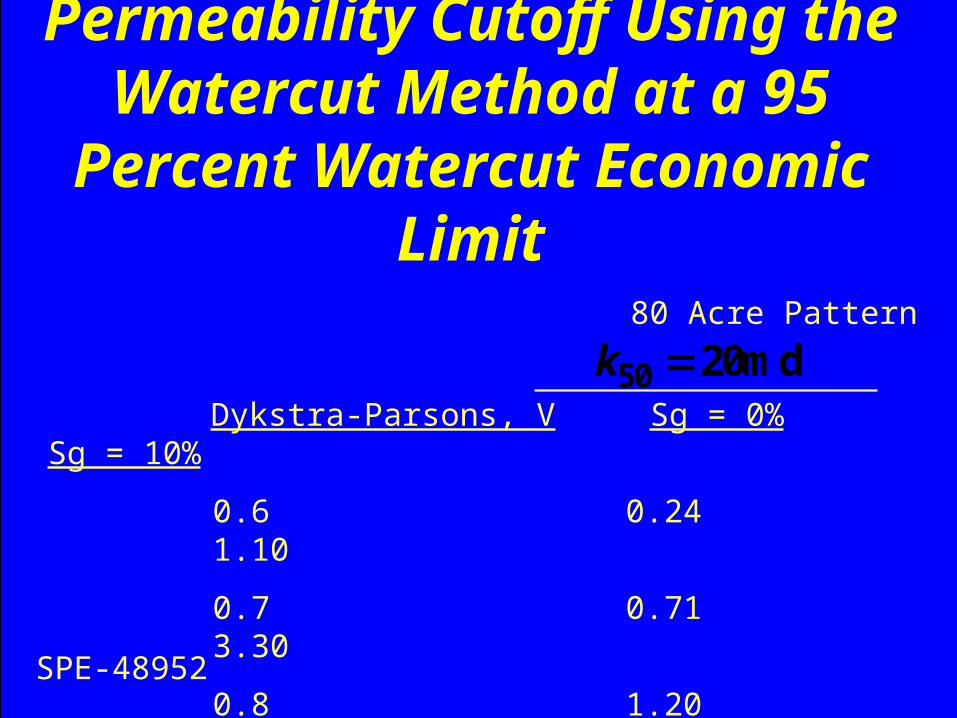
Permeability Cutoff Using the Watercut Method at a 95 Percent
Watercut Economic Limit
80 Acre Pattern
Dykstra-Parsons, V Sg = 0% Sg = 10%
0.6 0.24 1.10
0.7 0.71 3.30
0.8 1.20 5.60
50 20mdk
SPE-48952

CHANGINGHORSES
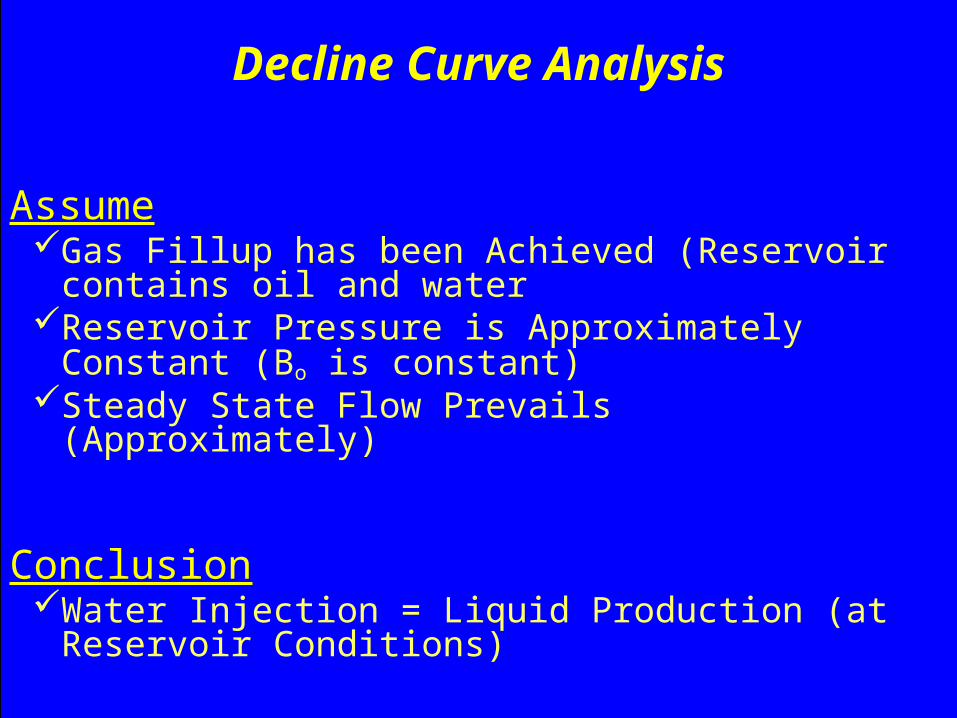
AssumeGas Fillup has been Achieved (Reservoir contains oil
and waterReservoir Pressure is Approximately Constant (Bo is
constant)Steady State Flow Prevails (Approximately)
ConclusionWater Injection = Liquid Production (at Reservoir
Conditions)
Decline Curve Analysis
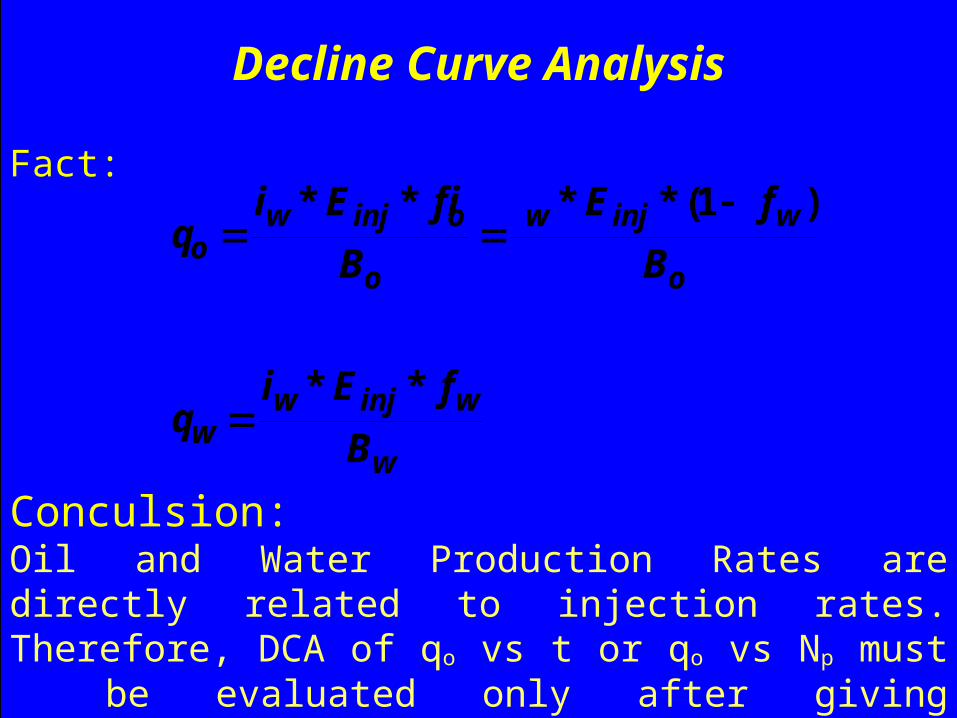
Decline Curve Analysis
* * * * (1 )
* *
w inj o w inj wo
o o
w inj ww
w
i E f i E fq
B B
i E fq
B
Fact:
Conculsion:Oil and Water Production Rates are directly related to injection rates. Therefore, DCA of qo vs t or qo vs Np must be evaluated only after giving consideration to historical and projected water injection rates.
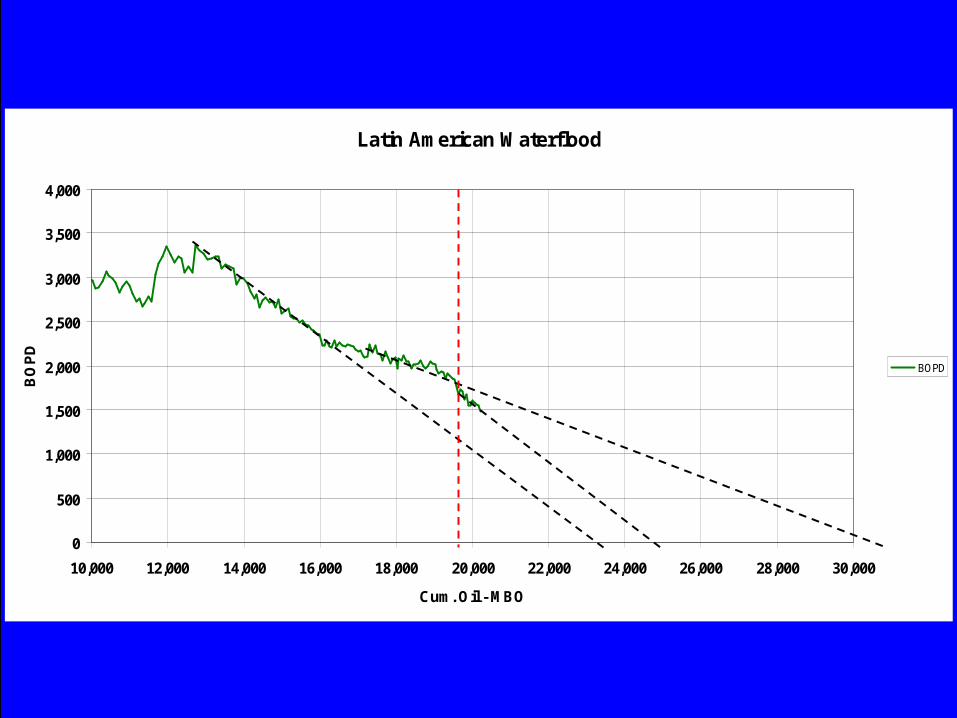
Latin American Waterflood
0
500
1,000
1,500
2,000
2,500
3,000
3,500
4,000
10,000 12,000 14,000 16,000 18,000 20,000 22,000 24,000 26,000 28,000 30,000
Cum. Oil - MBO
BO
PD BOPD
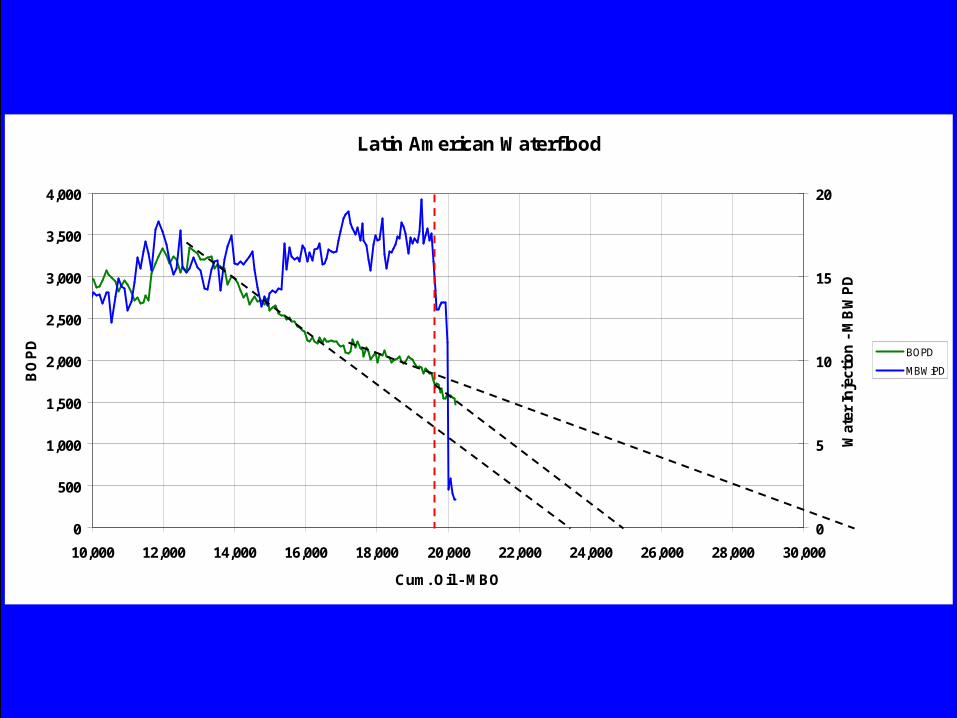
Latin American Waterflood
0
500
1,000
1,500
2,000
2,500
3,000
3,500
4,000
10,000 12,000 14,000 16,000 18,000 20,000 22,000 24,000 26,000 28,000 30,000
Cum. Oil - MBO
BO
PD
0
5
10
15
20
Wat
er In
ject
ion
- MB
WPD
BOPD
MBWiPD
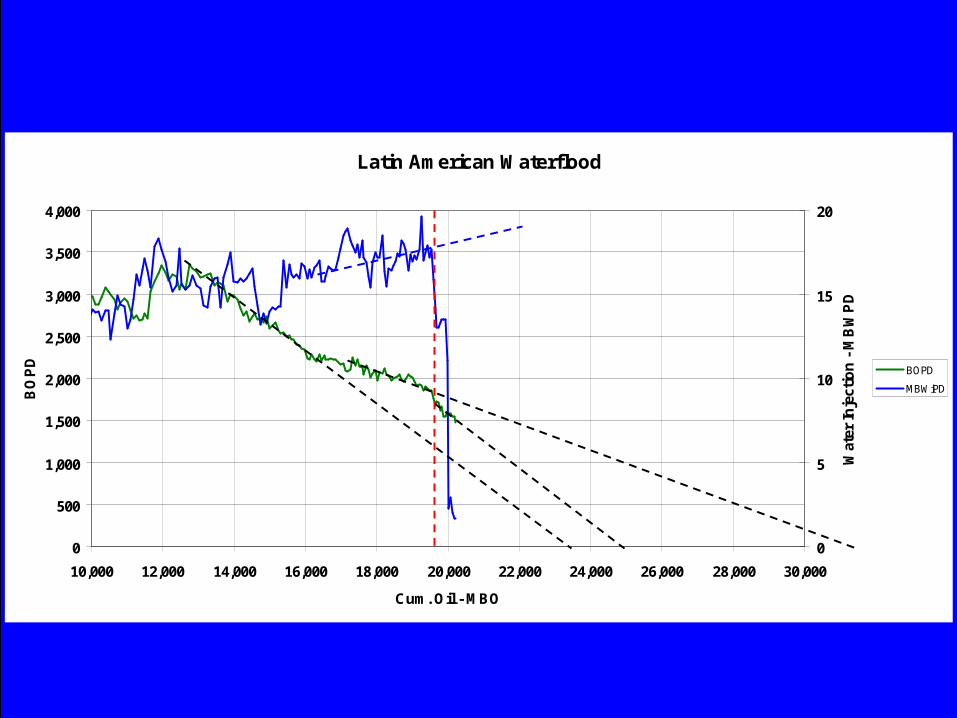
Latin American Waterflood
0
500
1,000
1,500
2,000
2,500
3,000
3,500
4,000
10,000 12,000 14,000 16,000 18,000 20,000 22,000 24,000 26,000 28,000 30,000
Cum. Oil - MBO
BO
PD
0
5
10
15
20
Wat
er In
ject
ion
- MB
WPD
BOPD
MBWiPD
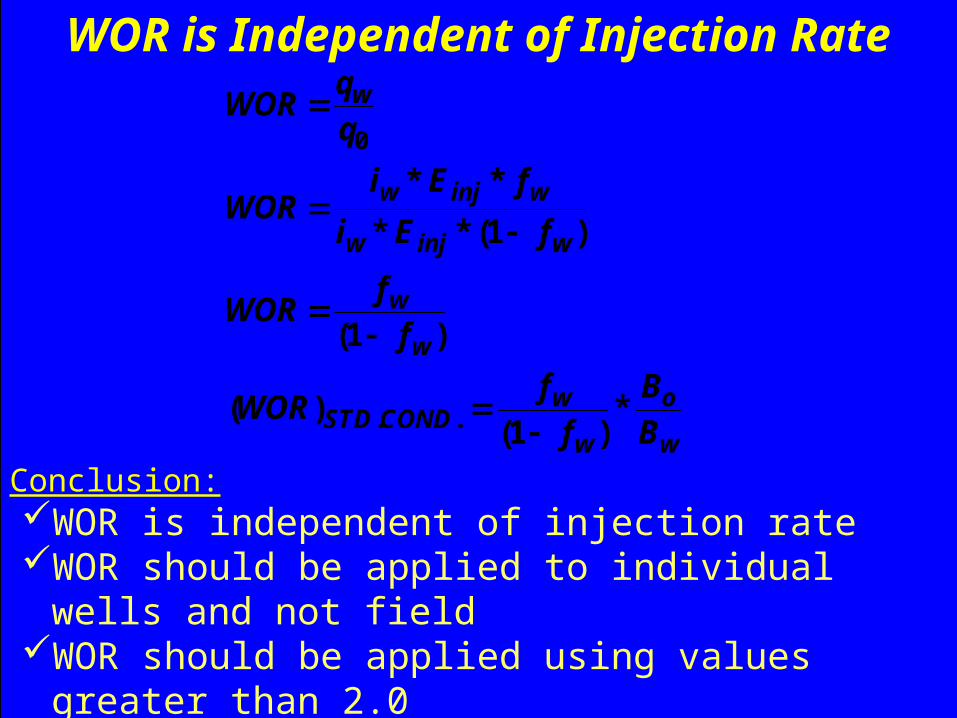
WOR is Independent of Injection Rate
0
. .
* ** * (1 )
(1 )
( ) *(1 )
w
w inj w
w inj w
w
w
w oSTD COND
w w
qWOR
qi E f
WORi E f
fWOR
ff B
WORf B
Conclusion:WOR is independent of injection rateWOR should be applied to individual wells and not
fieldWOR should be applied using values greater than 2.0
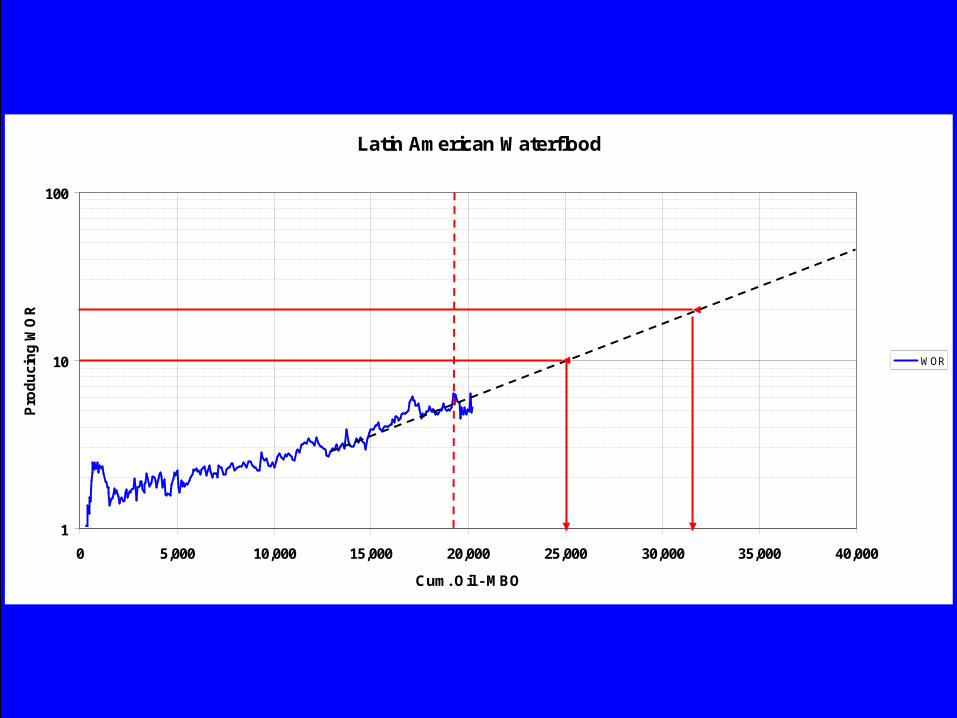
Latin American Waterflood
1
10
100
0 5,000 10,000 15,000 20,000 25,000 30,000 35,000 40,000
Cum. Oil - MBO
Prod
ucin
g W
OR
WOR

Keep Life SimpleKeep Life Simple
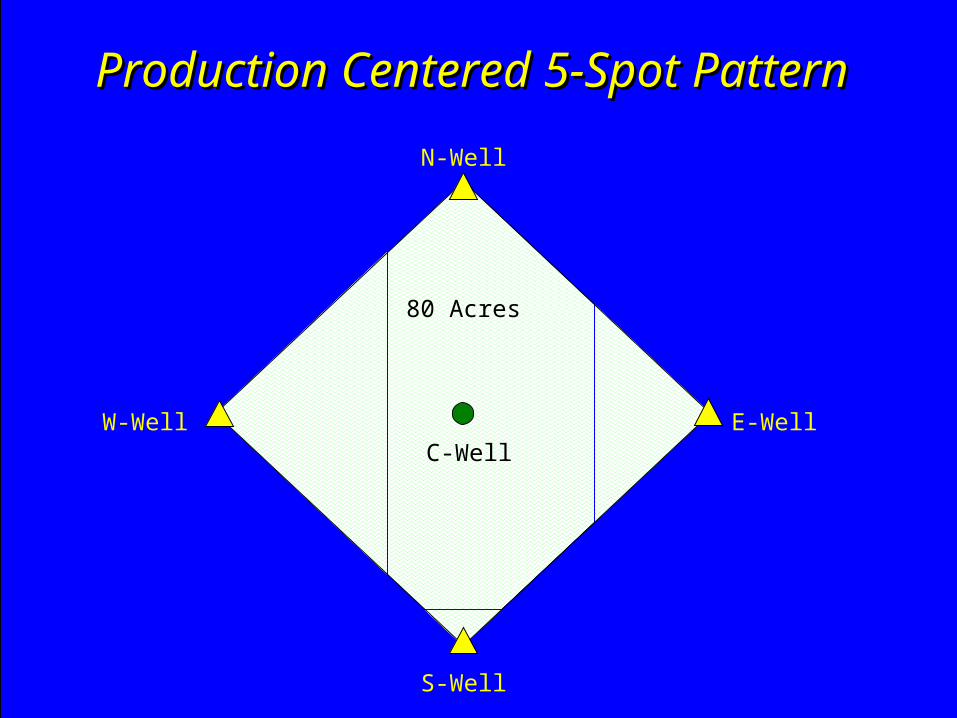
Production Centered 5-Spot PatternProduction Centered 5-Spot Pattern
N-Well
C-WellW-Well
S-Well
E-Well
80 Acres
0.0
1.0
2.0
3.0
4.0
5.0
6.0
7.0
8.0
1982 1984 1986 1988 1990 1992 1994 1996 1998 2000 2002 2004
MB
BL/
MO
NTH
0
4000
8000
12000
16000
20000
24000
28000
32000
GO
R, SC
F/BO
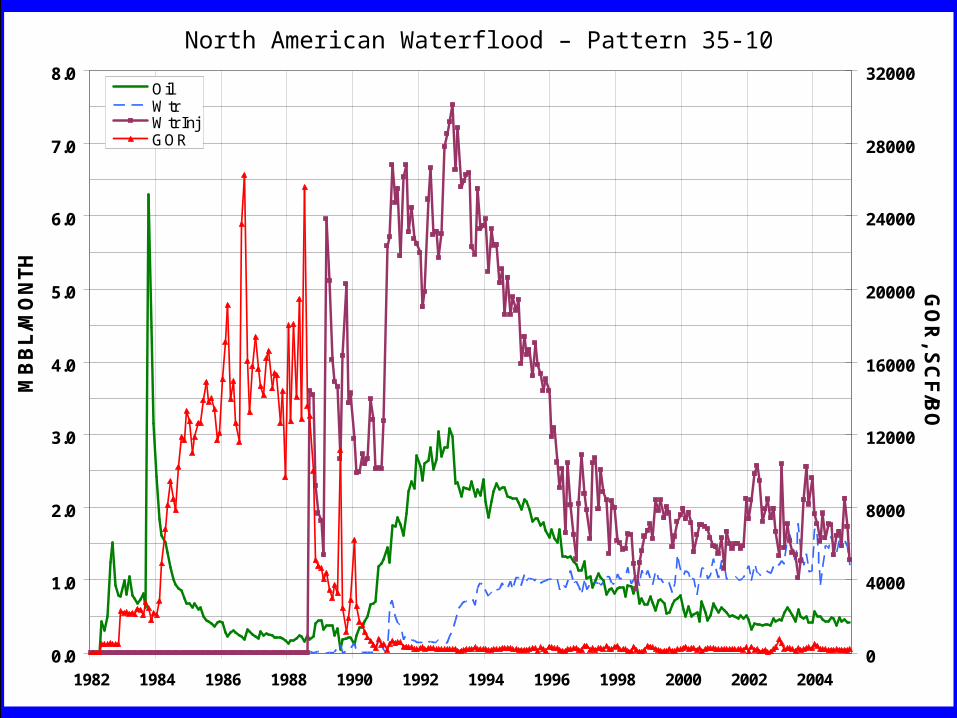
OilWtrWtr InjGOR
MONUMENT BUTTE UNIT-MB FED 10-35 - ProductionNorth American Waterflood – Pattern 35-10
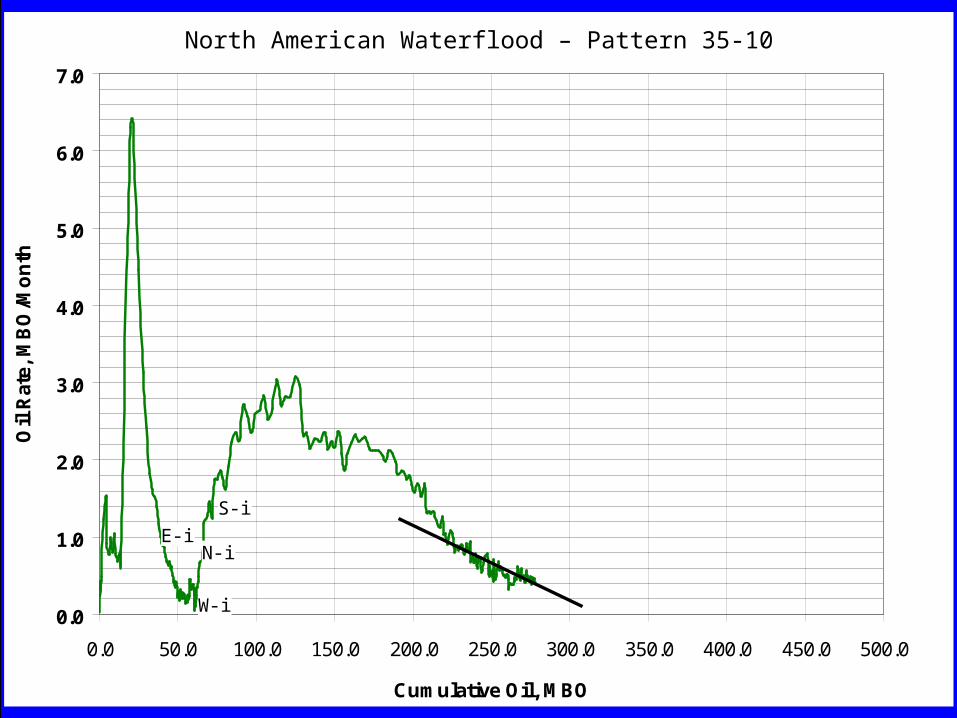
0.0
1.0
2.0
3.0
4.0
5.0
6.0
7.0
0.0 50.0 100.0 150.0 200.0 250.0 300.0 350.0 400.0 450.0 500.0
Cumulative Oil, MBO
Oil
Rate
, MB
O/M
onth
MONUMENT BUTTE UNIT-MB FED 10-35 - Oil Rate vs. Cumulative OilNorth American Waterflood – Pattern 35-10
E-i
W-i
S-i
N-i
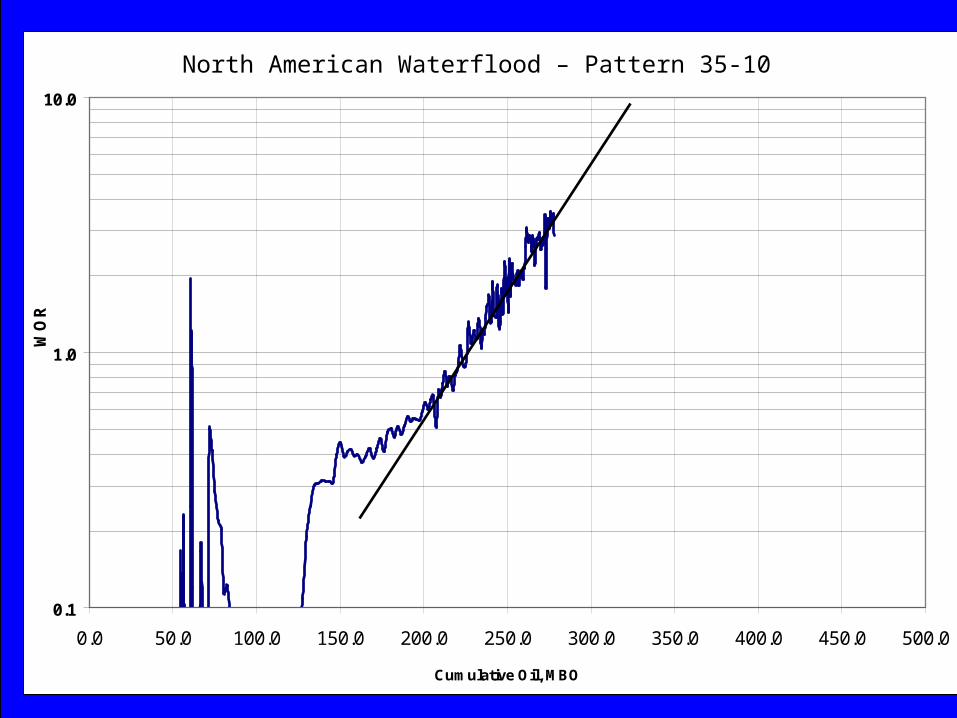
0.1
1.0
10.0
0.0 50.0 100.0 150.0 200.0 250.0 300.0 350.0 400.0 450.0 500.0
Cumulative Oil, MBO
WO
RMONUMENT BUTTE UNIT-MB FED 10-35 - WOR vs Cumulative Oil North American Waterflood – Pattern 35-10
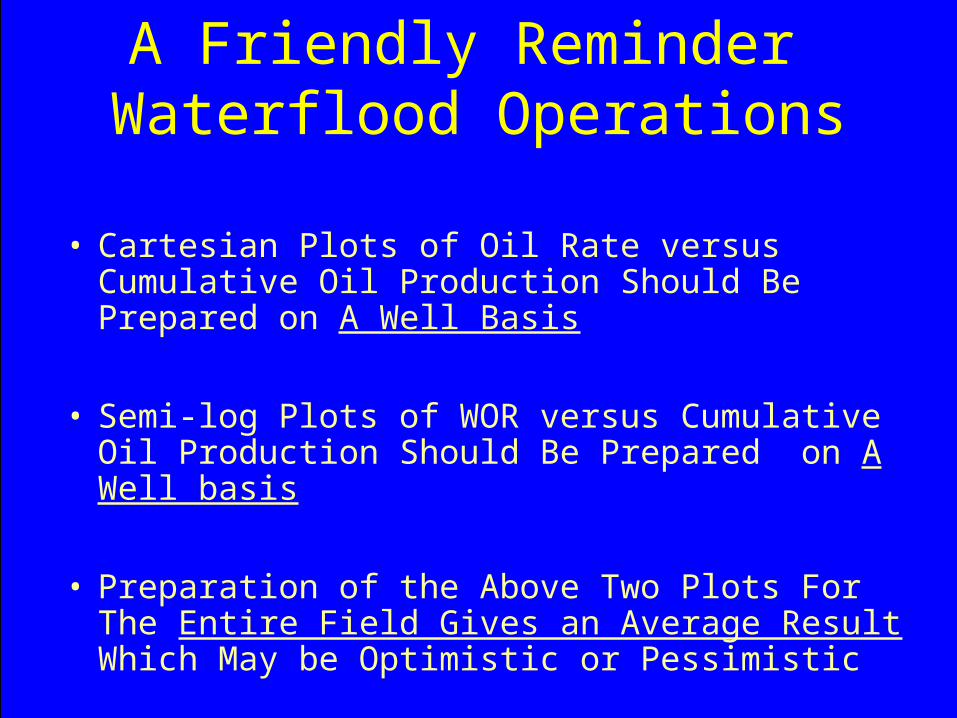
A Friendly Reminder Waterflood Operations
• Cartesian Plots of Oil Rate versus Cumulative Oil Production Should Be Prepared on A Well Basis
• Semi-log Plots of WOR versus Cumulative Oil Production Should Be Prepared on A Well basis
• Preparation of the Above Two Plots For The Entire Field Gives an Average Result Which May be Optimistic or Pessimistic

Have there been Recent Developments in Waterflooding Technology??
•NO !
& YES ! ? ? ? ?
BUT . . .• Improved application of old principles
leads to better recovery
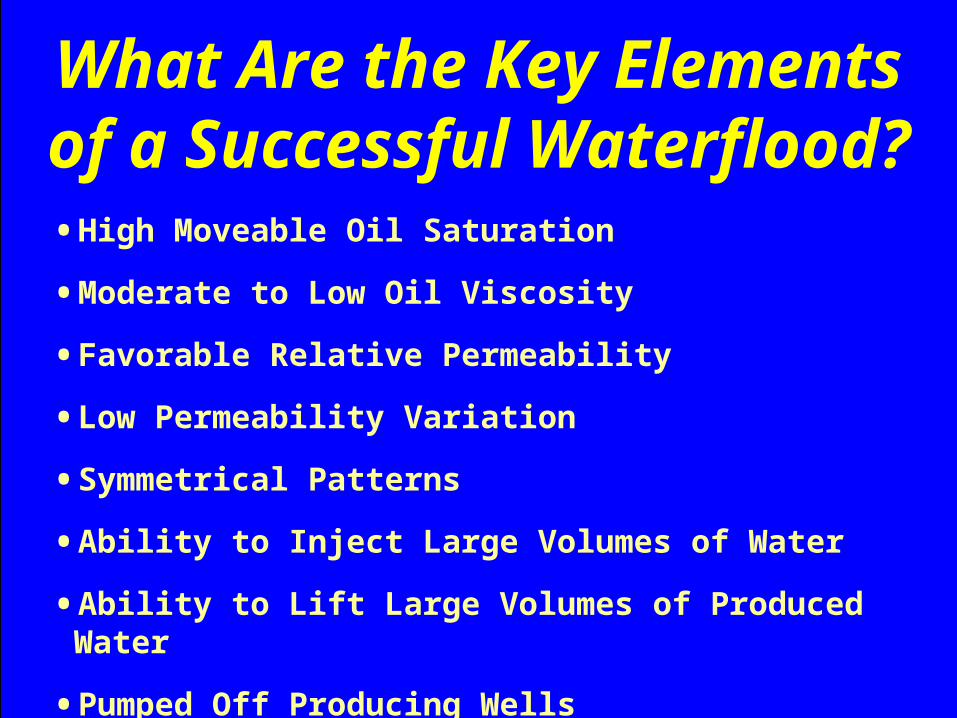
What Are the Key Elementsof a Successful Waterflood?
• High Moveable Oil Saturation
• Moderate to Low Oil Viscosity
• Favorable Relative Permeability
• Low Permeability Variation
• Symmetrical Patterns
• Ability to Inject Large Volumes of Water
• Ability to Lift Large Volumes of Produced Water
• Pumped Off Producing Wells
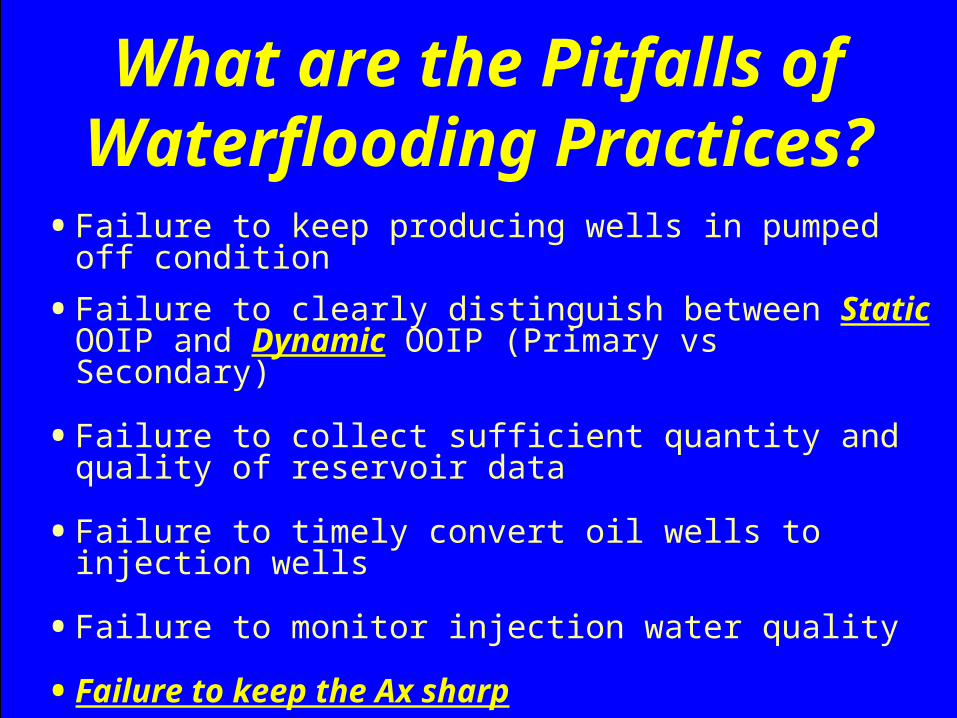
What are the Pitfalls ofWaterflooding Practices?
• Failure to keep producing wells in pumped off condition
• Failure to clearly distinguish between Static OOIP and Dynamic OOIP (Primary vs Secondary)
• Failure to collect sufficient quantity and quality of reservoir data
• Failure to timely convert oil wells to injection wells
• Failure to monitor injection water quality
• Failure to keep the Ax sharp

Summary ofNew Waterflood Paradigms
• Remember the Quarterback (The Injector)
• Keep the End in Mind (Maximize Volumetric Sweep)
• Keep the Ax Sharp (SPE meetings, SPE-TIGS, and SPE.org
provide great opportunities to sharpen the mind!)

Pretty Please with Sugar!Pretty Please with Sugar!
Keep Life SimpleKeep Life Simple
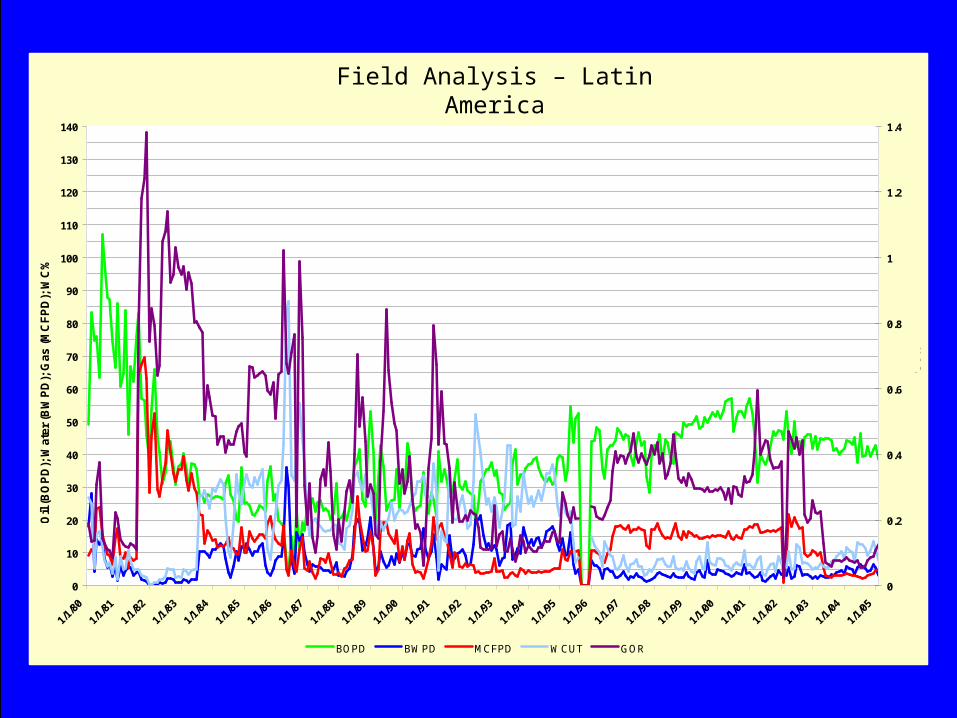
One Well Field - Latin America
0
10
20
30
40
50
60
70
80
90
100
110
120
130
140
1/1/80
1/1/81
1/1/82
1/1/83
1/1/84
1/1/85
1/1/86
1/1/87
1/1/88
1/1/89
1/1/90
1/1/91
1/1/92
1/1/93
1/1/94
1/1/95
1/1/96
1/1/97
1/1/98
1/1/99
1/1/00
1/1/01
1/1/02
1/1/03
1/1/04
1/1/05
0
0.2
0.4
0.6
0.8
1
1.2
1.4
BOPD BWPD MCFPD WCUT GOR
Oil
(BO
PD);
Wat
er (B
WPD
); G
as (M
CFP
D);
WC
%
GO
R
Field Analysis – Latin America
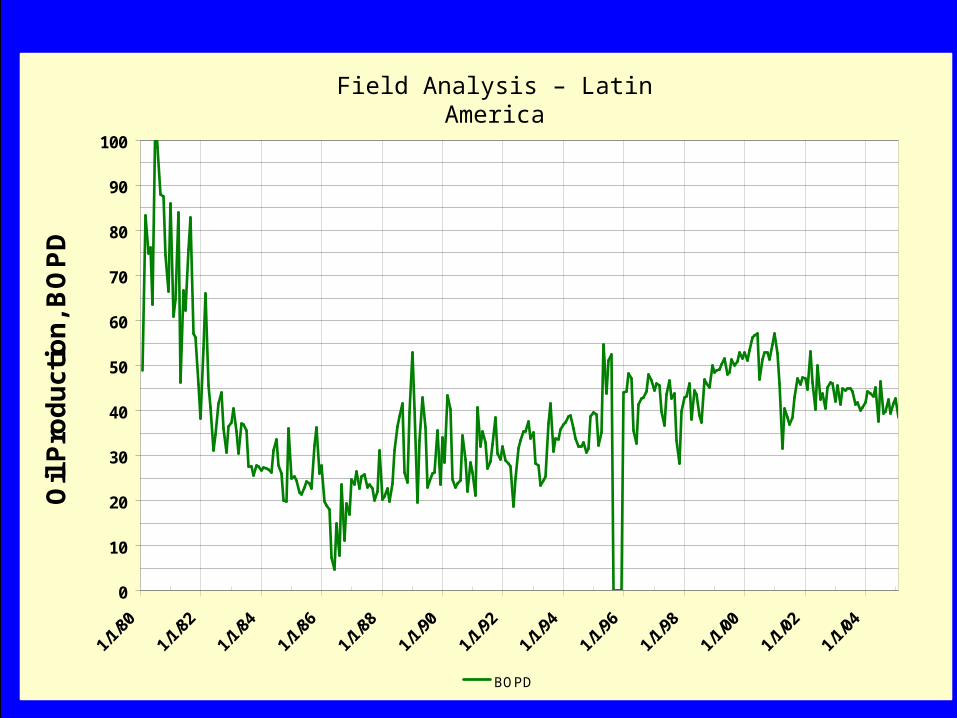
One Well Field - Latin America
0
10
20
30
40
50
60
70
80
90
100
Oil
Prod
uctio
n, B
OPD
BOPD
Field Analysis – Latin America
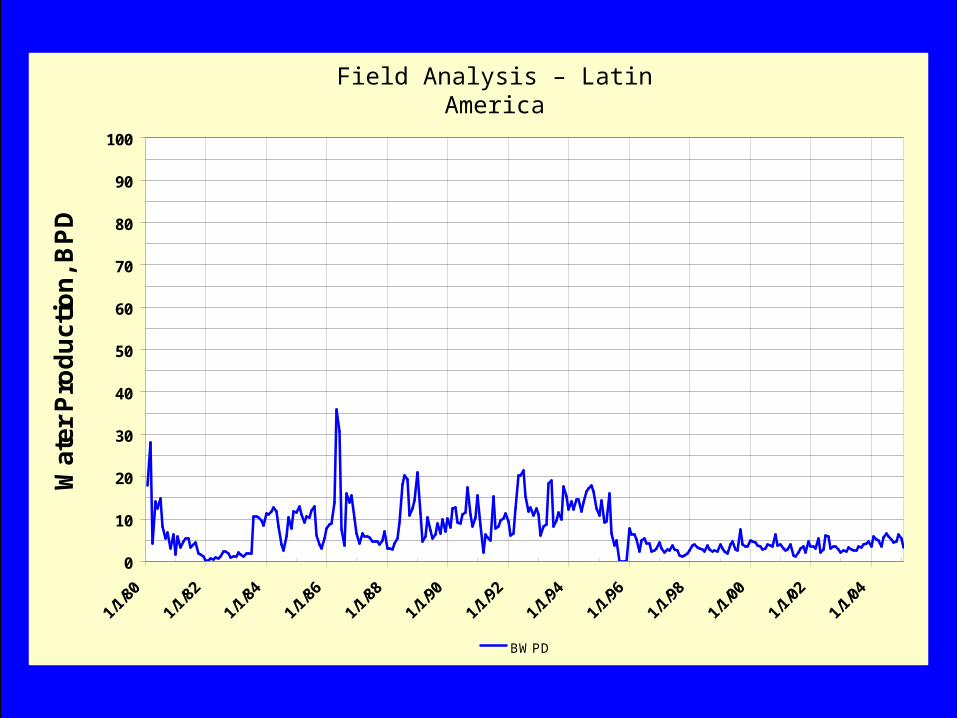
One Well Field - Latin America
0
10
20
30
40
50
60
70
80
90
100
1/1/80
1/1/82
1/1/84
1/1/86
1/1/88
1/1/90
1/1/92
1/1/94
1/1/96
1/1/98
1/1/00
1/1/02
1/1/04
Wat
er P
rodu
ctio
n, B
PD
BWPD
Field Analysis – Latin America
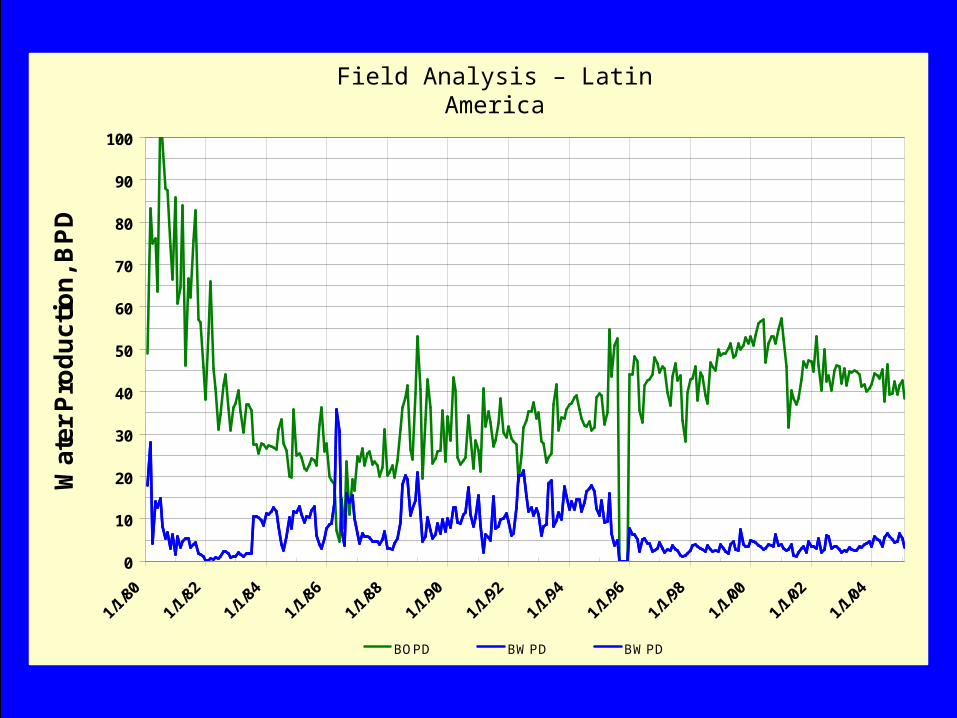
One Well Field - Latin America
0
10
20
30
40
50
60
70
80
90
100
1/1/80
1/1/82
1/1/84
1/1/86
1/1/88
1/1/90
1/1/92
1/1/94
1/1/96
1/1/98
1/1/00
1/1/02
1/1/04
Wat
er P
rodu
ctio
n, B
PD
BOPD BWPD BWPD
Field Analysis – Latin America
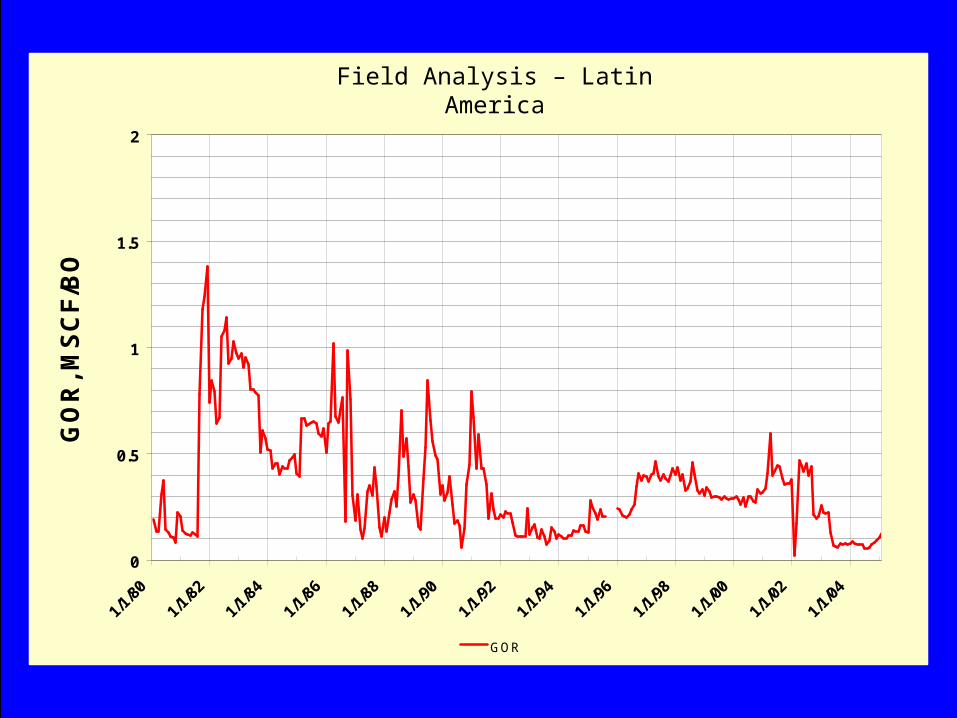
One Well Field - Latin America
0
0.5
1
1.5
2
1/1/80
1/1/82
1/1/84
1/1/86
1/1/88
1/1/90
1/1/92
1/1/94
1/1/96
1/1/98
1/1/00
1/1/02
1/1/04
GO
R, M
SCF/
BO
GOR
Field Analysis – Latin America
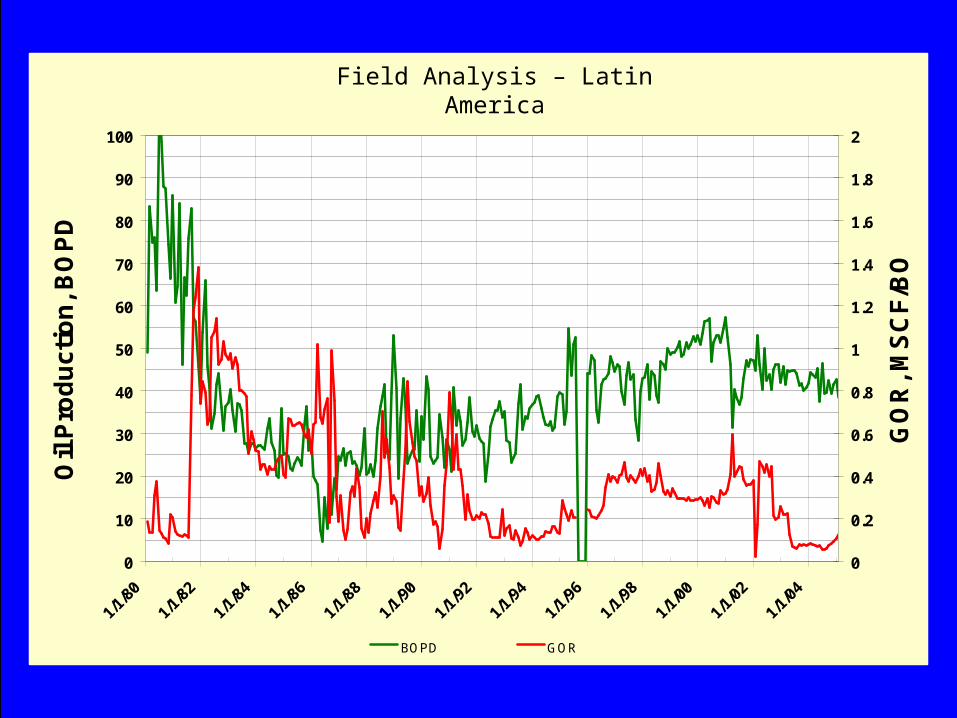
One Well Field - Latin America
0
10
20
30
40
50
60
70
80
90
100
1/1/80
1/1/82
1/1/84
1/1/86
1/1/88
1/1/90
1/1/92
1/1/94
1/1/96
1/1/98
1/1/00
1/1/02
1/1/04
Oil
Prod
uctio
n, B
OPD
0
0.2
0.4
0.6
0.8
1
1.2
1.4
1.6
1.8
2
GO
R, M
SCF/
BO
BOPD GOR
Field Analysis – Latin America
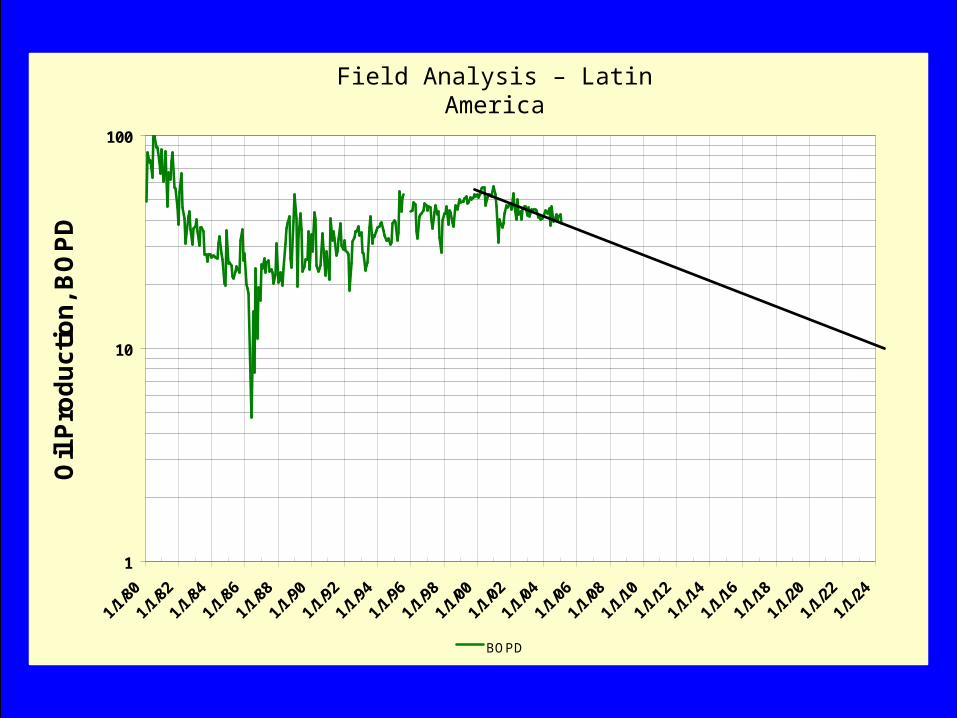
One Well Field - Latin America
1
10
100
1/1/80
1/1/82
1/1/84
1/1/86
1/1/88
1/1/90
1/1/92
1/1/94
1/1/96
1/1/98
1/1/00
1/1/02
1/1/04
1/1/06
1/1/08
1/1/10
1/1/12
1/1/14
1/1/16
1/1/18
1/1/20
1/1/22
1/1/24
Oil
Prod
uctio
n, B
OPD
BOPD
Field Analysis – Latin America
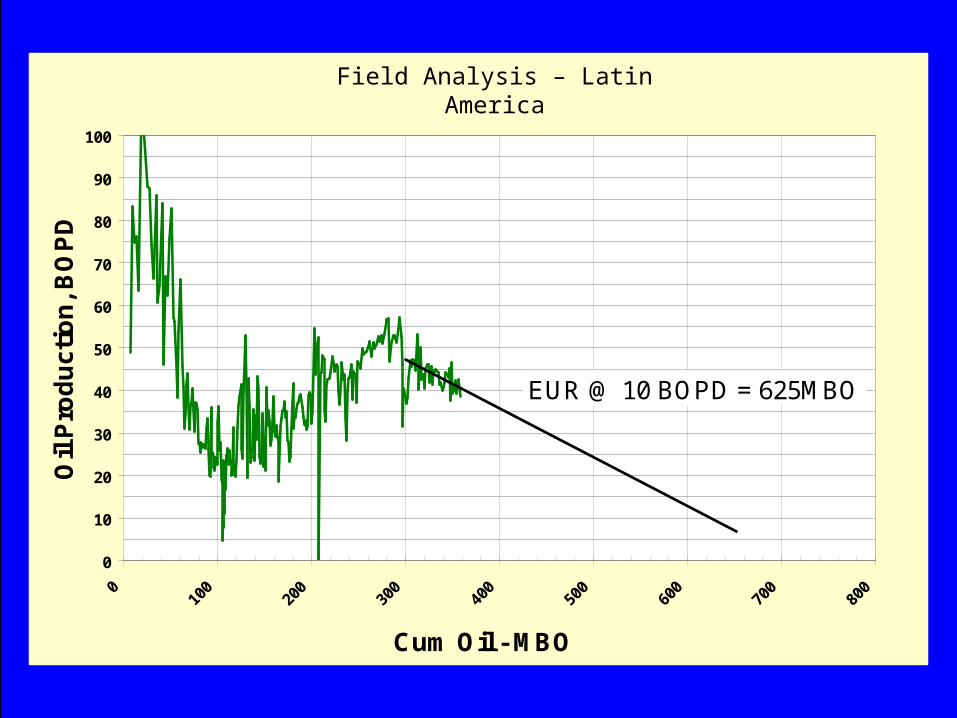
One Well Field - Latin America
0
10
20
30
40
50
60
70
80
90
100
010
020
030
040
050
060
070
080
0
Cum Oil - MBO
Oil
Prod
uctio
n, B
OPD
EUR @ 10 BOPD = 625MBO
Field Analysis – Latin America
Reservoir ManagementReservoir ManagementUnder Water InjectionUnder Water Injection
A Worldwide PerspectiveA Worldwide Perspective
Dr. William M. CobbDallas, Texas
2nd National Meeting on Secondary and Assisted Oil RecoverySeptember 8–9, 2005Malargue, Argentina