research proposal methods and procedures. objectives recognize component subheadings under methods...
TRANSCRIPT

Research ProposalResearch ProposalMethods and Methods and ProceduresProcedures

OBJECTIVESOBJECTIVES Recognize component subheadings under Recognize component subheadings under
Methods and Procedures section.Methods and Procedures section.
Identify characteristics of subheadings in Identify characteristics of subheadings in Methods and Procedures section.Methods and Procedures section.
Be able to write a Methods and Procedures Be able to write a Methods and Procedures section for research proposal.section for research proposal.

Introduction Introduction
Four Questions Should be Addressed:Four Questions Should be Addressed: 1.1. Who will participate in the study?Who will participate in the study? 2. What types of materials will be 2. What types of materials will be
needed?needed? 3.3. What data will be collected?What data will be collected? 4.4. What will participants do?What will participants do?

ParticipantsParticipants
How will they be selected?How will they be selected? volunteers? paid?volunteers? paid? random selection?random selection? From where will participants come?From where will participants come? geographic region?geographic region? institutional affiliationinstitutional affiliation

Participants (continued)Participants (continued)
Demographic characteristics:Demographic characteristics: Approximations in terms of:Approximations in terms of: age/age rangesage/age ranges gendergender ethnicityethnicity Other information for replicationOther information for replication
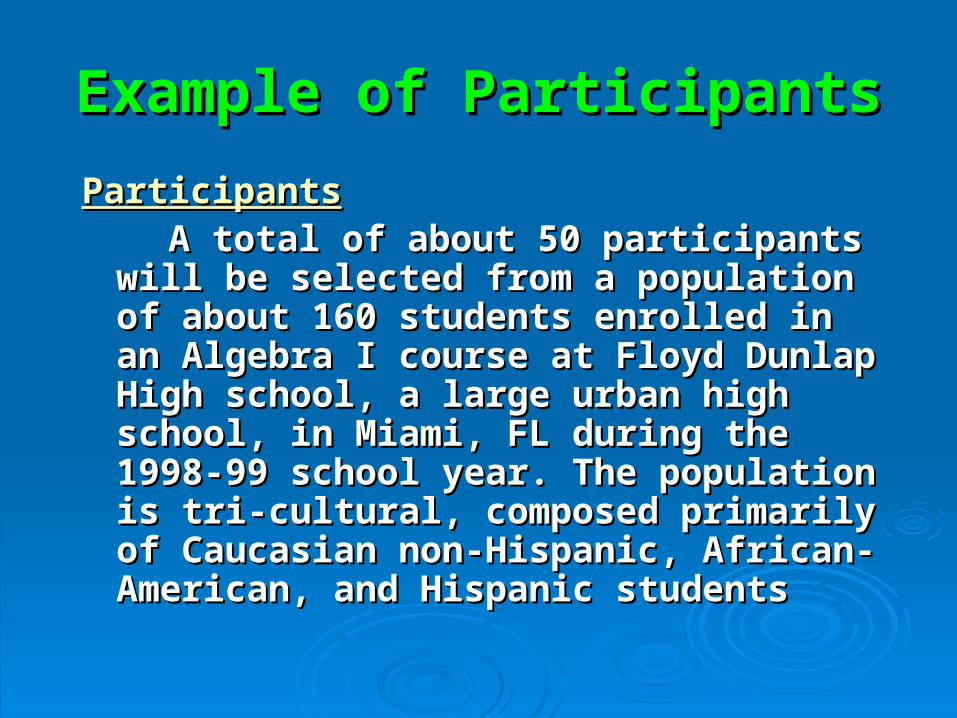
Example of ParticipantsExample of Participants
ParticipantsParticipants A total of about 50 participants will be A total of about 50 participants will be
selected from a population of about 160 selected from a population of about 160 students enrolled in an Algebra I course at students enrolled in an Algebra I course at Floyd Dunlap High school, a large urban Floyd Dunlap High school, a large urban high school, in Miami, FL during the 1998-high school, in Miami, FL during the 1998-99 school year. The population is tri-99 school year. The population is tri-cultural, composed primarily of Caucasian cultural, composed primarily of Caucasian non-Hispanic, African-American, and non-Hispanic, African-American, and Hispanic studentsHispanic students

from a variety of Latin American from a variety of Latin American backgrounds. Moreover, 100% of backgrounds. Moreover, 100% of students at this school are enrolled students at this school are enrolled in the free or reduced price lunch in the free or reduced price lunch program. Participants, comprised program. Participants, comprised of approximately 54% female and of approximately 54% female and approximately 46% male, will be approximately 46% male, will be selected randomly through use of selected randomly through use of a random numbers table (Ary, a random numbers table (Ary, Jacobs, & Razavieh, 1996).Jacobs, & Razavieh, 1996).
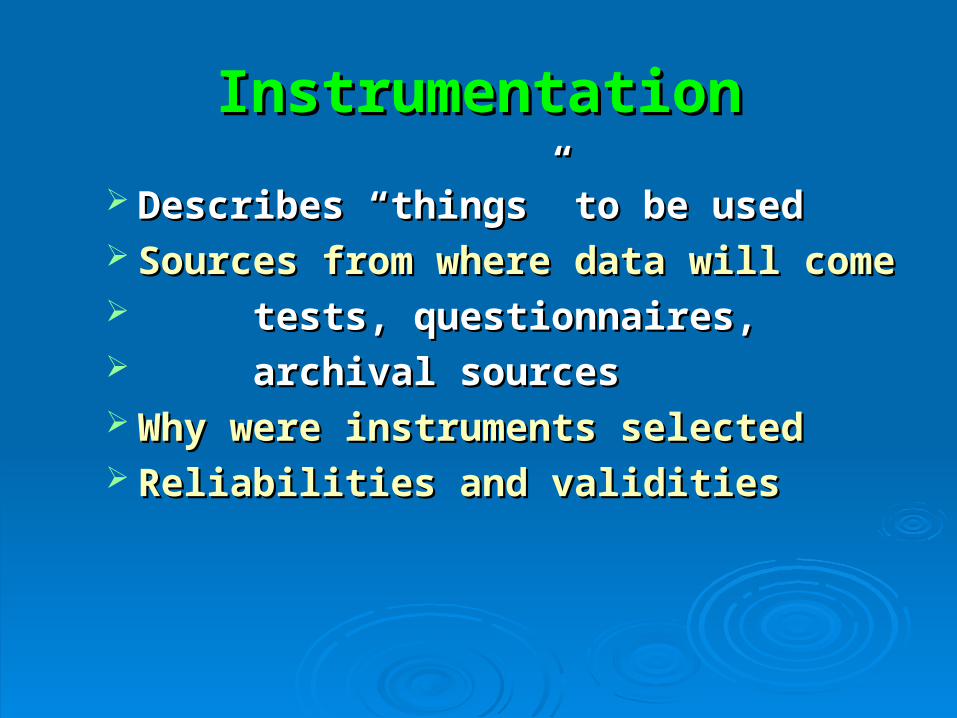
InstrumentationInstrumentation
Describes “things” to be usedDescribes “things” to be used Sources from where data will comeSources from where data will come tests, questionnaires,tests, questionnaires, archival sourcesarchival sources Why were instruments selectedWhy were instruments selected Reliabilities and validitiesReliabilities and validities
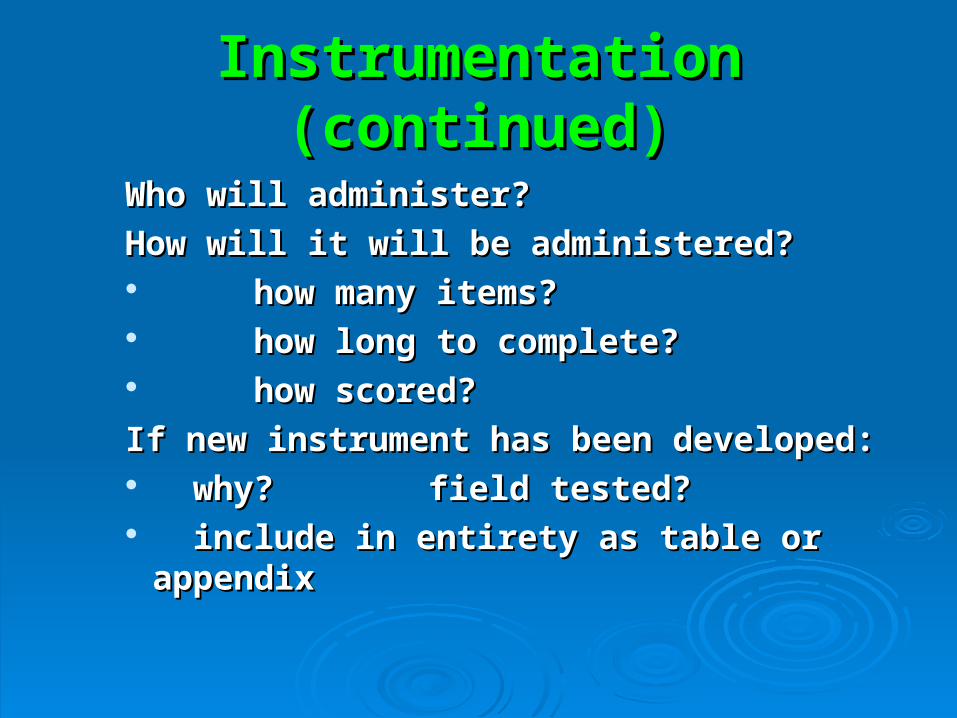
Instrumentation (continued)Instrumentation (continued)
Who will administer?Who will administer?
How will it will be administered?How will it will be administered? how many items?how many items? how long to complete?how long to complete? how scored?how scored?
If new instrument has been developed:If new instrument has been developed: why?why? field tested? field tested? include in entirety as table or appendixinclude in entirety as table or appendix

Example of InstrumentationExample of Instrumentation
InstrumentationInstrumentation
The Stanford Achievement Test The Stanford Achievement Test (SAT): Arithmetic Test (level 7.0 - 9.9) (SAT): Arithmetic Test (level 7.0 - 9.9) will be utilized as the data gathering will be utilized as the data gathering instrument. Split-half reliability instrument. Split-half reliability coefficients are reported to range coefficients are reported to range from .86 to .93 (Davies, 1994) and from .86 to .93 (Davies, 1994) and reviewers (Locus, 1995; Smythe,reviewers (Locus, 1995; Smythe,

1994) are in agreement concerning 1994) are in agreement concerning its high content validity. The SAT its high content validity. The SAT Arithmetic test, comprised of 45 Arithmetic test, comprised of 45 multiple-choice items, requires multiple-choice items, requires students approximately 35 minutes students approximately 35 minutes to complete. Taken via paper-and-to complete. Taken via paper-and-pencil, students respond to pencil, students respond to questions on a Scantron that is questions on a Scantron that is computer scored by the SAT computer scored by the SAT publishing company.publishing company.

ProceduresProcedures
What will the researchers and the participants What will the researchers and the participants do? When? In what order will the activities do? When? In what order will the activities be conducted?be conducted?
If an intervention or treatment occurs, If an intervention or treatment occurs, describe in detail the nature of the program.describe in detail the nature of the program.
Write in a cookbook manner; Step-by-step Write in a cookbook manner; Step-by-step processprocess
Error made by students in writing a Error made by students in writing a procedures section is insufficient detail for procedures section is insufficient detail for replication.replication.

Example of ProceduresExample of Procedures
ProceduresProcedures
In the fall of 1999, prior to the In the fall of 1999, prior to the assignment of students to classes, a assignment of students to classes, a list of all students scheduled to list of all students scheduled to enroll in General Math I in the fall enroll in General Math I in the fall (approximately 150 students) will be(approximately 150 students) will be

obtained from the principal of the obtained from the principal of the school. Using this list, 60 students will school. Using this list, 60 students will be randomly selected through use of a be randomly selected through use of a random numbers table (Ary et al., 1996) random numbers table (Ary et al., 1996) to participate in the study. These 60 to participate in the study. These 60 students will then bestudents will then be

randomly assigned to one of two randomly assigned to one of two General Math I classes, one class General Math I classes, one class to receive programmed instruction to receive programmed instruction and one class to receive lecture-and one class to receive lecture-discussion instruction. The discussion instruction. The random assignment to class type random assignment to class type will also be performed through the will also be performed through the use of a random numbers table.use of a random numbers table.

The programmed instruction class The programmed instruction class will utilize a computer program titled will utilize a computer program titled Herculette, published by the Herculette, published by the Programmers Institute of Programmers Institute of Technology School (1996), and used Technology School (1996), and used on IBM or IBM compatible on IBM or IBM compatible computers with a Pentium 686 computers with a Pentium 686 processor. In this program,processor. In this program,

students are required to exhibit students are required to exhibit mastery learning on each lesson mastery learning on each lesson prior to making a transition to prior to making a transition to the next higher lesson in the the next higher lesson in the math sequence. The lecture-math sequence. The lecture-discussion classroom teacher discussion classroom teacher will present the same math will present the same math concepts used in the Herculetteconcepts used in the Herculette
program but through a lecture format program but through a lecture format instead of through use of a computer. instead of through use of a computer. Discussion will occur between the Discussion will occur between the teacher and students when students teacher and students when students ask questions about math concepts.ask questions about math concepts.
Data AnalysisData Analysis
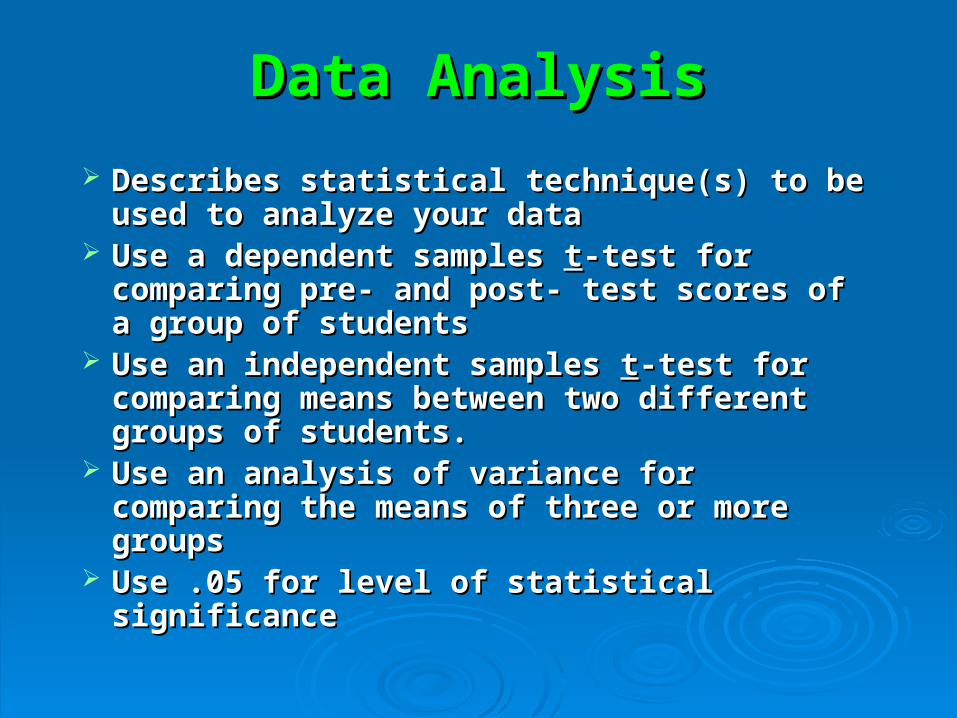
Describes statistical technique(s) to be Describes statistical technique(s) to be used to analyze your dataused to analyze your data
Use a dependent samples Use a dependent samples tt-test for -test for comparing pre- and post- test scores of a comparing pre- and post- test scores of a group of studentsgroup of students
Use an independent samples Use an independent samples tt-test for -test for comparing means between two different comparing means between two different groups of students.groups of students.
Use an analysis of variance for comparing Use an analysis of variance for comparing the means of three or more groupsthe means of three or more groups
Use .05 for level of statistical significanceUse .05 for level of statistical significance

Example of Data AnalysisExample of Data Analysis
Data AnalysisData Analysis
To address the extent to which To address the extent to which mean differences will be present in mean differences will be present in reading between students enrolled in reading between students enrolled in block scheduled schools and those block scheduled schools and those students enrolled in non-block students enrolled in non-block scheduled schools, an independent scheduled schools, an independent samples samples tt-test will be used.-test will be used.

Should the independent samples t-Should the independent samples t-test provide a statistically test provide a statistically significant result at the .05 level or significant result at the .05 level or below, then the null hypothesis will below, then the null hypothesis will be rejected. That is, the be rejected. That is, the assumption of no difference in assumption of no difference in reading between block and non-reading between block and non-block schools will be rejected.block schools will be rejected.
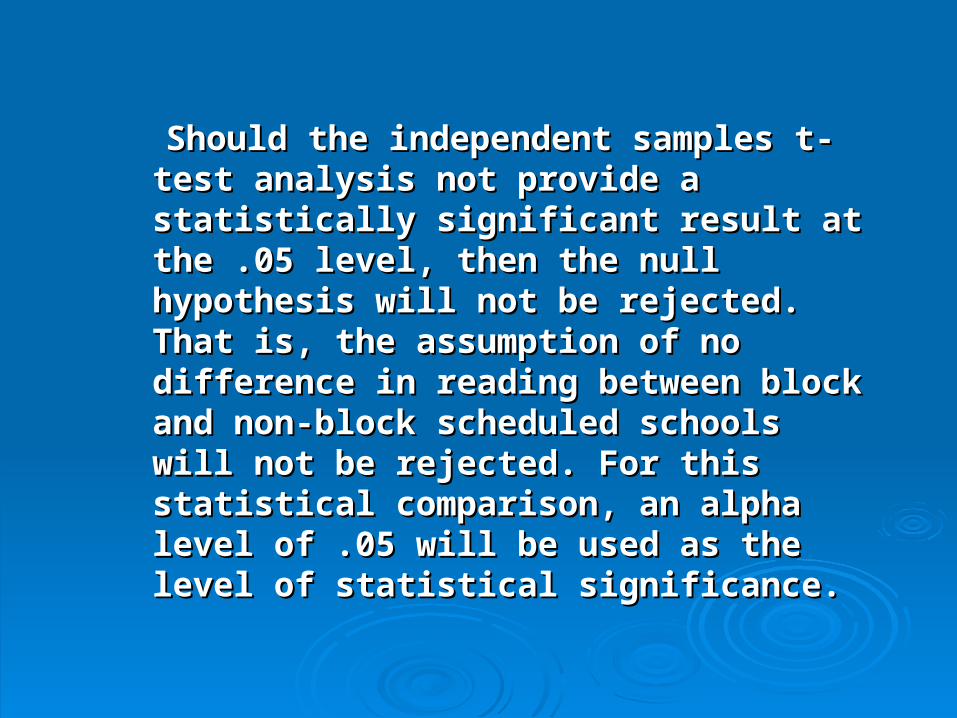
Should the independent samples t-test Should the independent samples t-test analysis not provide a statistically analysis not provide a statistically significant result at the .05 level, then significant result at the .05 level, then the null hypothesis will not be rejected. the null hypothesis will not be rejected. That is, the assumption of no difference That is, the assumption of no difference in reading between block and non-block in reading between block and non-block scheduled schools will not be rejected. scheduled schools will not be rejected. For this statistical comparison, an alpha For this statistical comparison, an alpha level of .05 will be used as the level of level of .05 will be used as the level of statistical significance.statistical significance.

Example of Methods and Example of Methods and Procedures sectionProcedures section
ParticipantsParticipants Participants will be approximately 100 Participants will be approximately 100
certified school personnel in South Georgia. certified school personnel in South Georgia. Of this sample, about 20% will be male and Of this sample, about 20% will be male and about 80% will be female. Approximately 75% about 80% will be female. Approximately 75% of the sample will be regular education of the sample will be regular education teachers and approximately 25% will be teachers and approximately 25% will be special education teachers. Experience of special education teachers. Experience of teachers will range from about 1 to about teachers will range from about 1 to about

15 years in education. About 33% 15 years in education. About 33% of teachers will be working in of teachers will be working in elementary schools, about 33% of elementary schools, about 33% of teachers will be working in middle teachers will be working in middle schools, and about 33% of schools, and about 33% of teachers will be working in high teachers will be working in high schools. schools.
Methods and Procedures Methods and Procedures (continued)(continued)
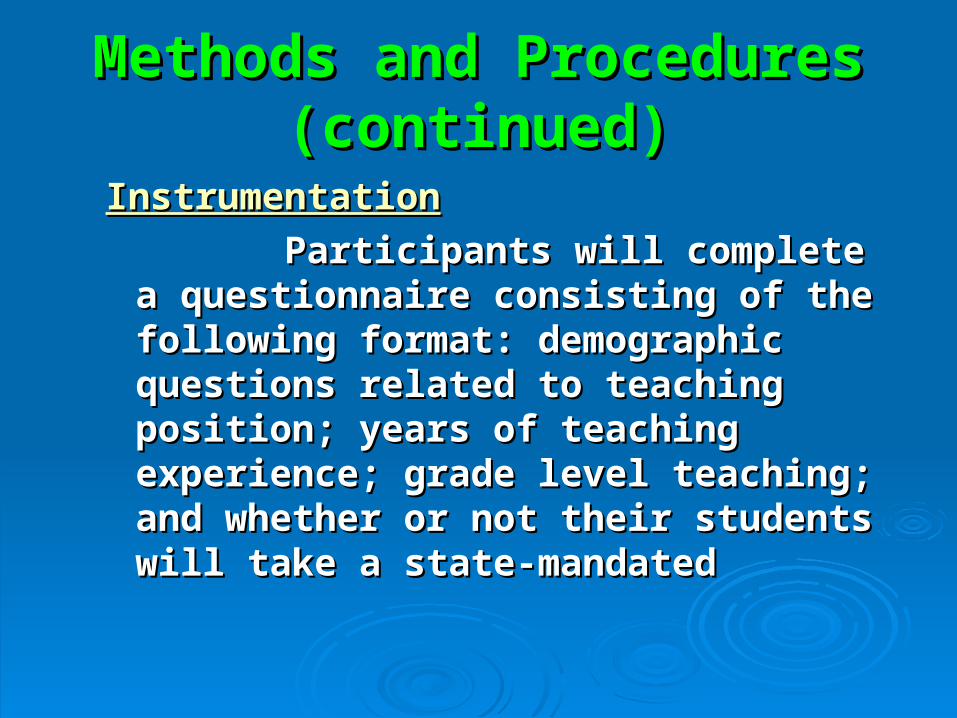
InstrumentationInstrumentation
Participants will complete a Participants will complete a questionnaire consisting of the following questionnaire consisting of the following format: demographic questions related to format: demographic questions related to teaching position; years of teaching teaching position; years of teaching experience; grade level teaching; and experience; grade level teaching; and whether or not their students will take a whether or not their students will take a state-mandatedstate-mandated

minimum competency test. These minimum competency test. These demographic items will be followed demographic items will be followed by 27 attitude statements about by 27 attitude statements about standardized achievement tests to standardized achievement tests to which participants will respond which participants will respond using a 5-point Likert format using a 5-point Likert format ranging from Strongly Agree to ranging from Strongly Agree to Strongly Disagree. Strongly Disagree. A total score on A total score on the attitude items will be obtained by the attitude items will be obtained by adding item responses for each.adding item responses for each.
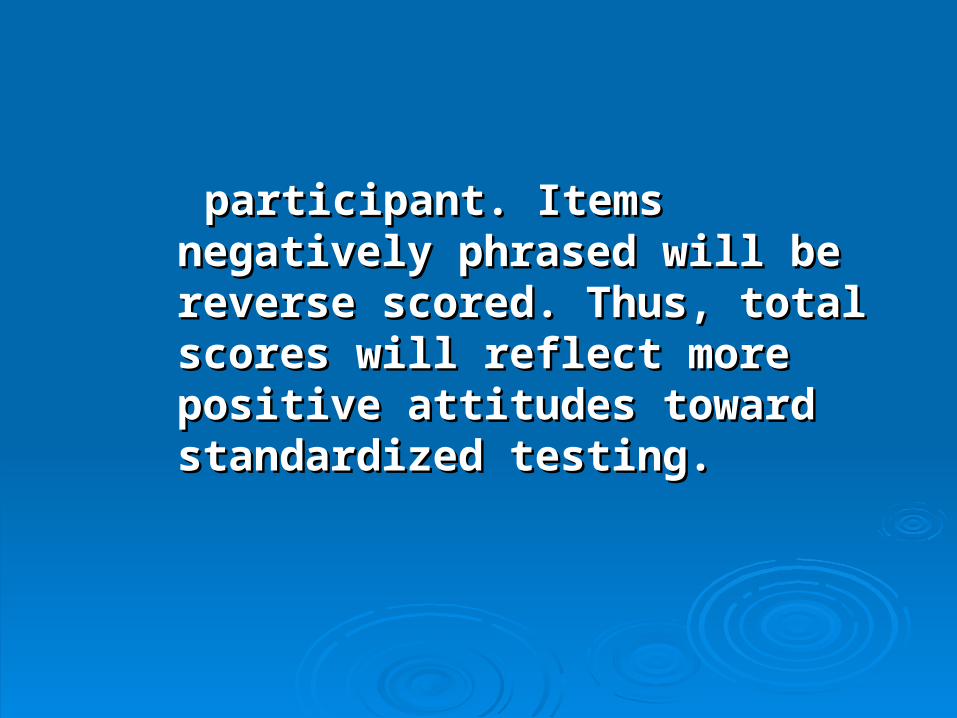
participant. Items negatively participant. Items negatively phrased will be reverse scored. phrased will be reverse scored. Thus, total scores will reflect more Thus, total scores will reflect more positive attitudes toward positive attitudes toward standardized testing.standardized testing.

ProceduresProcedures
In the fall of 1997, all teachers at In the fall of 1997, all teachers at the Lowndes County High School the Lowndes County High School will be asked at a routine faculty will be asked at a routine faculty meeting, through a one page memo meeting, through a one page memo handed out by the school principal, if handed out by the school principal, if they would be willing to participate inthey would be willing to participate in

this study. At the end of the faculty this study. At the end of the faculty meeting, those teachers who decide to meeting, those teachers who decide to participate will be handed a copy of the participate will be handed a copy of the questionnaire, a computer scoring questionnaire, a computer scoring form, and a #2 pencil. Those teachers form, and a #2 pencil. Those teachers who decide not towho decide not to

participate will leave at the end of the participate will leave at the end of the faculty meeting.faculty meeting.
Following completion of the Following completion of the questionnaire, the senior researcher questionnaire, the senior researcher will collect the questionnaire, will collect the questionnaire, computer scoring form, and #2 computer scoring form, and #2 pencil when the teachers exit the pencil when the teachers exit the room. Once all materials have beenroom. Once all materials have been

collected, approximately 30 minutes collected, approximately 30 minutes after the end of the faculty meeting, after the end of the faculty meeting, the junior researcher will take the the junior researcher will take the questionnaires and pencils back to questionnaires and pencils back to the junior researcher’s university the junior researcher’s university office. The computer scoring form office. The computer scoring form will be taken to the university will be taken to the university computer center to be recorded onto computer center to be recorded onto a 3 1/4 IBM formatted disk.a 3 1/4 IBM formatted disk.

Data AnalysisData Analysis
Questionnaire data, to be Questionnaire data, to be analyzed via frequencies, will be analyzed via frequencies, will be reported in terms of percent of reported in terms of percent of educators who express agreement or educators who express agreement or disagreement with each disagreement with each questionnaire item. questionnaire item.

Following the calculation of a total score on the Following the calculation of a total score on the survey, an analysis of variance will be conducted survey, an analysis of variance will be conducted to determine whether mean differences are to determine whether mean differences are present in attitudes among elementary, middle, present in attitudes among elementary, middle, and secondary school teachers. Then, an and secondary school teachers. Then, an independent samples independent samples tt-test will be performed to -test will be performed to determine whether mean differences in attitudes determine whether mean differences in attitudes are present between male and female teachers. are present between male and female teachers. The level of statistical significance for statistical The level of statistical significance for statistical comparisons will be set at .05.comparisons will be set at .05.