research project: habitat selection patterns of cheetahs ... · research project: habitat selection...
TRANSCRIPT
Research project:
Habitat selection patterns of Cheetahs Acinonyx jubatus in
the Serengeti, Tanzania
Femke Broekhuis
This research project is submitted in part fulfilment of the requirements for the MSc Wild
Animal Biology of the Institute of Zoology and the Royal Veterinary College
August 2007
Table of Contents
Acknowledgements............................................................................................................. 3
Literature Review: Habitat selection patterns of Cheetahs Acinonyx jubatus in the Serengeti, Tanzania
Introduction......................................................................................................................... 4 Habitat and factors determining distribution ...................................................................... 5
Habitat ............................................................................................................................ 5 Distribution and habitat selection................................................................................... 6
Spatial analysis ................................................................................................................... 7 Generalised Linear Models (GLM)................................................................................ 7 Environmental Niche Factor Analysis (ENFA) ............................................................. 8 GLM vs ENFA............................................................................................................... 8
Cheetah Acinonyx jubatus................................................................................................... 9 Background information ................................................................................................ 9 Cheetah habitat selection.............................................................................................. 10
Prey ........................................................................................................................... 11 Predation and competition ........................................................................................ 12 Home-ranges and territories...................................................................................... 13 Previous research ...................................................................................................... 14
Discussion......................................................................................................................... 14 Conclusion ........................................................................................................................ 16 References......................................................................................................................... 17
Scientific Paper:
Habitat selection patterns of Cheetahs Acinonyx jubatus in the Serengeti, Tanzania
Summary........................................................................................................................... 21 Introduction....................................................................................................................... 22 Methods ............................................................................................................................ 24
Data collection ............................................................................................................. 24 Study area and cheetah data...................................................................................... 24 Habitat data ............................................................................................................... 25
Statistics ....................................................................................................................... 27 Univariate approach .................................................................................................. 27 Multivariate approach ............................................................................................... 28
Results............................................................................................................................... 29 Univariate approach .................................................................................................... 29 Multivariate approach ................................................................................................. 30
General habitat selection patterns ............................................................................. 30 Evolution of habitat selection patterns over time ..................................................... 32
1
Discussion......................................................................................................................... 34
General habitat selection patterns ............................................................................... 34 Evolution of habitat selection patterns over time ........................................................ 37
Conclusion ........................................................................................................................ 38 Acknowledgements........................................................................................................... 39 References......................................................................................................................... 40 Appendix I ........................................................................................................................ 43
2
Acknowledgements
I would like to thank both Nathalie Pettorelli and Sarah Durant for allowing me the
opportunity to carry out this MSc project, for their ideas and suggestions and sparing
their precious time to guide and help me. I would also like to thank Rob Deaville for
providing me with some of the software that was needed for the project, Antonio di
Gregorio1 and Grant Hopcraft2 for giving me access to the Geographic Information
Systems (GIS) data of Tanzania and the Serengeti and everyone in the ‘PhD Factory’ for
letting me take up a bit of computer space. Alexandre Hirzel deserves recognition for his
free BioMapper software package and his assistance with various technical matters. Last
but not least I would like to extend my gratitude to Jan Broekhuis for reviewing my
literature review and Graham Raman for his valuable suggestions and support.
1 www.africover.org 2 www.serengetidata.org
3
Literature Review:
Habitat selection patterns of Cheetahs Acinonyx jubatus in the
Serengeti, Tanzania
Introduction Understanding habitat use and the resulting spatial and temporal distribution of species along environmental gradients have repeatedly been topics of human interest. Historically, when human survival depended on hunting, predicting the presence of animals was crucial in order for a hunt to be efficient and successful (Morrison et al., 2006). Nowadays, there is the desire to attain meaningful biological information to understand the underlying ecological mechanisms that affect species survival (Palma et al., 1999; Chefaoui et al., 2005). Knowledge of which features are essential to the viability of a species can aid wildlife management when it comes to certain activities such as reintroductions, translocations, the development of reserves and determining the effects of anthropogenic disturbances (Araújo & Williams, 2000; Zimmermann, 2004; Rotenberry et al., 2006; Stamps & Swaisgood, 2007). In the early to mid-1900’s David Lack (1933) realised that animals actively select habitats when he observed that alterations in species composition were related to changes in habitat features. He believed that food availability, predation and nesting requirements were the three most important factors that influenced habitat selection in birds and that distribution was only limited by the availability of suitable habitats. The general theory still stands today but the ideas relating to the forces that drive selection have expanded slightly over the decades. Instead of animals selecting ancestral habitats based on psychological instinct (Lack, 1933), it is believed that animals will, in actual fact, choose features or a combination of features that will indirectly enhance their fitness (Morrison et al., 2006). There are numerous studies that have focused on finding ways to quantify the relationship between environmental factors and the presence of species. Various statistical methods have been developed allowing for the creation of predictive habitat suitability models (Guisan & Zimmermann, 2000; Manly et al., 2002; Rotenberry et al., 2006). Many of these models require
4
both information on the absence and presence of species, however, recently a model has been developed where only presence data is required (Hirzel et al., 2002).
Habitat and factors determining distribution Resource and habitat selection are central themes in ecology as it is believed that these selective processes permit coexistence and that they are an important driving force in evolution and speciation (Lack, 1933; McPeek, 1996; Morris, 2003). By selecting habitats that minimise encounters with competitors, species can essentially coexist. In cases where populations have diverged due to different selection processes, speciation may occur (Morris, 2003). Recognising the relationship that a species has with its environment is an important foundation in the process of developing a better understanding of a species’ ecology, but before carrying out any sort of habitat analysis, it is important to define the concept of habitat and the factors that are involved in its selection.
Habitat There is often a great deal of confusion when it comes to the terms “niche” and “habitat”. Niche is often used when describing the role or function of an organism in a particular environment and it can therefore been seen as the mechanistic interaction that arises between an individual and the area it utilises. Consequently, this interaction is indirectly related to the fitness of an individual. Habitat, on the other hand, does not have this association between environmental variables and its effect on fitness. It is therefore a descriptive, rather than a mechanistic, concept that depicts the biotic and abiotic variables at a given place and time (Kearney, 2006). When a habitat assessment is carried out for a species, vegetation and the associated characteristics, such as type, density, shape and size, are often perceived as being the key components that define a habitat (Poole et al., 1996; Mysterud & Ims, 1998; Morrison et al., 2006; Rotenberry et al., 2006). In a sense, when choosing what components to use to describe a habitat, vegetation is the obvious choice as it is linked to various biotic and abiotic factors and therefore determines the physical composition of the environment. In the case of terrestrial animals, vegetation is important as it provides cover (Caro & Collins, 1987; Yamaguchi et al., 2003), breeding sites (Lack, 1933) and it is either directly a food source for herbivorous animals or indirectly as a fundamental part of predator-prey dynamics (Spong, 2002). It is however important to realise that there are also many non-vegetative factors that make up a habitat (Lack, 1933; Morrison et al., 2006) such as water sources, soil structure, elevation, temperature gradients, prey availability and annual rainfall only to name a few (Tracy & Christian, 1986; Guisan & Zimmermann, 2000).
5
Distribution and habitat selection It is believed that an animal chooses a specific range and combination of environmental variables to best enhance their fitness in terms of survival and reproduction (Manly et al., 2002; Ottaviani et al., 2004). Often, chosen habitats are not homogenous in nature but are a collection of a variety of patches since different activities such as feeding, drinking and resting, can essentially be carried out in different environments (Mysterud & Ims, 1998; Morrison et al., 2006). In general, species can roughly be divided into two categories depending on their selection strategy, namely generalists and specialists. Generalist species tend to be flexible and have the ability to survive in a large variety of habitats. Specialists on the other hand, are more restricted in their habitat choice, consequently limiting their distribution (McPeek, 1996). Even when an optimal habitat is present it does not necessarily mean that it is readily available as access can be restricted by inter- and intraspecific competition, predation, disturbances or disease (Tracy & Christian, 1986; Brown, 1988; Thomas & Taylor, 1990; Durant, 1998; Morrison et al., 2006). The habitat that is ultimately used is the result of a complex process with various trade-offs that balance costs and benefits (McPeek, 1996; Sinclair et al., 2006). For example, areas where food availability is the highest may carry with it a higher probability of predation or kleptoparasitism, the alternative could be an area where food is less abundant but where cover provides protection (Houston et al., 1993; Cowlishaw, 1997; Bissett & Bernard, 2007). This theory is clearly illustrated by a study carried out on bluegill sunfish Lepomis macrochirus where habitat choice differed depending on whether a predator was present or not. In the absence of predation, the bluegill sunfish utilised the more dangerous, open areas where food was abundant but in the presence of predation the less profitable, dense vegetation was preferred (Werner et al., 1983). Within species, choices of habitat preference might also differ, depending on availability, season, age and sex (Thomas & Taylor, 1990; Spong, 2002; Yamaguchi et al., 2003).
Because of the relationship between specific habitat components and species viability, selection is believed to be a non-stochastic event (Hirzel et al., 2002). The type of habitat that animals exploit will inevitably determine the movement of species through an environment. By linking species with their general habitat requirements habitat suitability maps can be created and the distribution of animals can be predicted (Guisan & Zimmermann, 2000; Manly et al., 2002; Kearney, 2006). There are several ways to go about determining habitat selection of species. Most commonly studies use methods that are based on the “focal-animal approach” whereby the presence of an animal indirectly indicates habitat utilisation. For each location where an animal is observed (either directly or indirectly) the features that make up the habitat are recorded (Morrison et al., 2006). Selection is said to have occurred when the use of a particular habitat is disproportionate to its relative availability (Sinclair et al., 2006). On a larger spatial scale, this
6
can also be done by analysing the habitat types that territories and home-ranges are centred around (Caro & Collins, 1987; Broomhall et al., 2003). The habitats that are found in these areas can be analysed at different levels: (1) second-order selection compares habitats found in the home-range with the total abundance in the area and (2) third-order selection compares relative availability of habitat types within the home-range (Thomas & Taylor, 1990; Poole et al., 1996).
Spatial analysis The use of different habitats and the associated habitat characteristics can be documented by following the movements of individuals and recording information on the surroundings (Kearney, 2006). Habitat preferences can be determined by analysing this data to determine the indirect correlation that links the presence of an individual to specific environmental factors (Guisan & Zimmermann, 2000; Morrison et al., 2006). These types of analyses can be based on abundance data, presence-absence data or presence only data, depending on the quality, quantity and type of information available (Kearney, 2006). The two most common types of multivariate analyses that are currently being used in a variety of ecological studies are the Generalised Linear Models (GLM) and the Environmental Niche Factor Analysis (ENFA) which select predictors or features of the environment that best explain the presence and/or absence of a particular species (Guisan & Zimmermann, 2000; Hirzel et al., 2001; Zimmermann, 2004).
Generalised Linear Models (GLM) Like most models, the basic idea behind generalized linear models (GLM) is to try and find an equation that best describes the relationship between two or more variables, namely the dependent variable and the explanatory variables (Guisan & Zimmermann, 2000; Manly et al., 2002; Petrie & Watson, 2006). The explanatory variables, also known as the predictors, are used to predict the outcome of the dependent variable (Petrie & Watson, 2006). In this instance it would be environmental features that constitute a species habitat which can be anthropogenic, geomorphic or ecological in nature (Hirzel et al., 2001; Manly et al., 2002). When analysing data on habitat use, the dependent variable is usually binominal with only two possible outcomes; a species can either be present or absent at a particular point (Nicholls, 1989). The link between the explanatory variables and the dependent variable can either be described by a simple linear function or by a non-linear relationship with the aid of transformations (Nicholls, 1989; Petrie & Watson, 2006). The model that is eventually retained is the one that explains the largest part of the observed variance (Petrie & Watson, 2006).
7
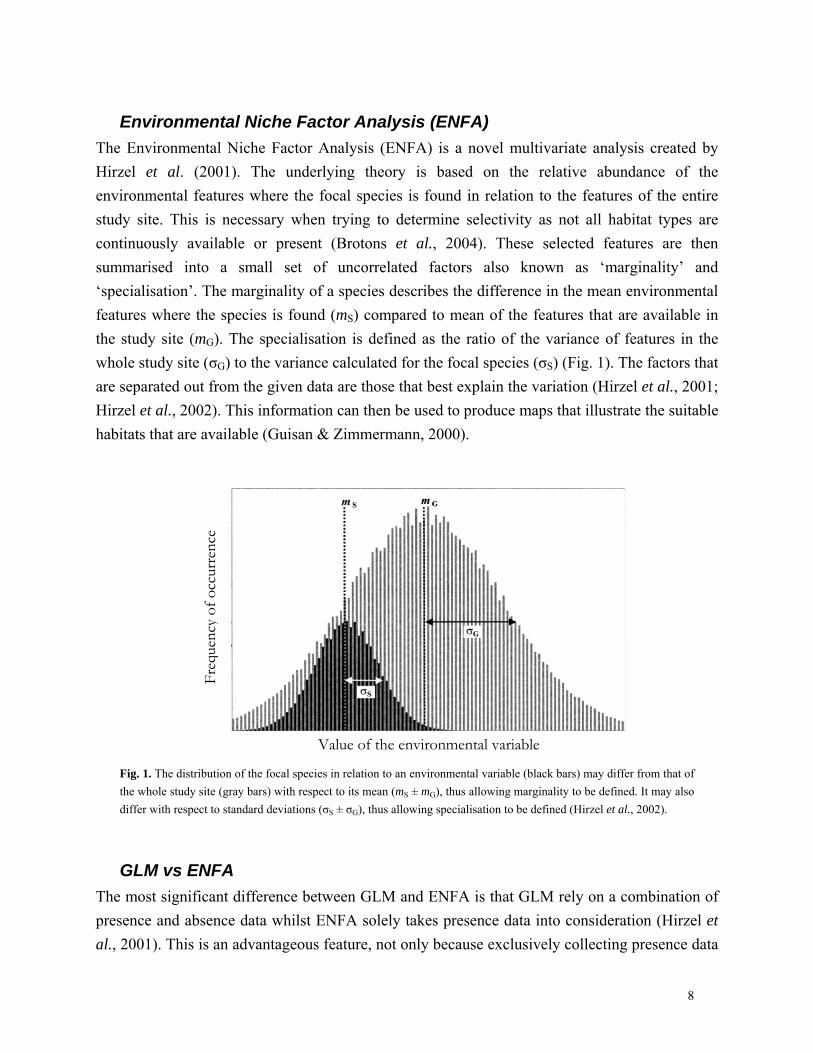
Environmental Niche Factor Analysis (ENFA) The Environmental Niche Factor Analysis (ENFA) is a novel multivariate analysis created by Hirzel et al. (2001). The underlying theory is based on the relative abundance of the environmental features where the focal species is found in relation to the features of the entire study site. This is necessary when trying to determine selectivity as not all habitat types are continuously available or present (Brotons et al., 2004). These selected features are then summarised into a small set of uncorrelated factors also known as ‘marginality’ and ‘specialisation’. The marginality of a species describes the difference in the mean environmental features where the species is found (mS) compared to mean of the features that are available in the study site (mG). The specialisation is defined as the ratio of the variance of features in the whole study site (σG) to the variance calculated for the focal species (σS) (Fig. 1). The factors that are separated out from the given data are those that best explain the variation (Hirzel et al., 2001; Hirzel et al., 2002). This information can then be used to produce maps that illustrate the suitable habitats that are available (Guisan & Zimmermann, 2000).
Value of the environmental variable
Freq
uenc
y of
occ
urre
nce
Fig. 1. The distribution of the focal species in relation to an environmental variable (black bars) may differ from that of the whole study site (gray bars) with respect to its mean (mS ± mG), thus allowing marginality to be defined. It may also differ with respect to standard deviations (σS ± σG), thus allowing specialisation to be defined (Hirzel et al., 2002).
GLM vs ENFA The most significant difference between GLM and ENFA is that GLM rely on a combination of presence and absence data whilst ENFA solely takes presence data into consideration (Hirzel et al., 2001). This is an advantageous feature, not only because exclusively collecting presence data
8
is less demanding, but also because absence data is not always reliable or available (Hirzel et al., 2001; Hirzel et al., 2002). Absence data is only accurate when a species absence is purely because environmental conditions are not suitable (Hirzel et al., 2002). Genuine absence data is difficult to come by, especially when the species being studied is mobile or inconspicuous. Just because a species was not detected in a particular area does not necessarily mean that the species is absent (Hirzel et al., 2002; Brotons et al., 2004; Ottaviani et al., 2004). This leads to two problems: 1- if detectability does not equal 1, there will be false absences (Hirzel et al., 2002), 2- if detectability varies across habitats, the outcomes from the GLM analysis will be biased. There are a few criticisms about using only presence data instead of both presence and absence data. It has been said that when both presence and absence data are available, the GLM approach should be considered as it has a higher degree of accuracy (Brotons et al., 2004). A study carried out by Hirzel et al. (2001) used a virtual species to create data in order to compare the two approaches under a variety of circumstances. The results showed that when the virtual species resided in all the potentially suitable habitats that were accessible, there was no significant difference between the two approaches. However, when the virtual species was overabundant in the study site, GLM produced better result than ENFA but ENFA outperformed the GLM method when the species was spreading e.g. an invasive species. ENFA has only been developed fairly recently and, as with any product in the early stages of development, there are still several limitations. Firstly, the software used does not yet possess the ability to create confidence intervals. Secondly, the software can as yet only deal with dependencies that are linear in origin which means that in certain cases transformations might be necessary. The last point that is important to remember is that the habitat that is described using ENFA is not an absolute habitat, but one that is relative to the background habitat chosen as a reference (Hirzel et al., 2002). The first two points are hopefully areas that will be worked on and developed in the future.
Cheetah Acinonyx jubatus
Background information Cheetahs are of significant interest to conservation, ecology, behaviour and genetic studies. It is believed that they separated from other Felidae early on in speciation, giving rise to some characteristic morphological, physiological and behavioural adaptations (Eaton, 1974; Caro, 1994). Some well known features unique to cheetahs are its extendable spine giving it the ability to cover large distances in a short space of time and its semi-retractable claws. Their group
9
behaviour is also distinct compared to other felids; most cats, apart from lions Panthera leo, are solitary animals. Cheetahs, on the other hand, display a mixture of both solitary and social behaviour. Females are often found alone, unless with dependent cubs whilst males are either solitary or in a coalition, usually related males. Independent cubs also seem to form groups in the time after leaving their mother (Caro, 1994). It has also been speculated that cheetahs have gone through a genetic bottle-neck, making the genetic structure of the existing populations interesting in terms of survival. However, this theory has been argued; as with many other carnivores, genetic variability may simply be low as a result of living at low densities and may not necessarily have detrimental consequences to viability (May, 1995; Hedrick, 1996; Caro, 2000).
Cheetahs are well-adapted to dry conditions and were formerly found in savannas and arid environments right across Africa, including North Africa, all the way to the Middle East and down to South-east India (Estes, 1993; Caro, 1994). Many of these populations have unfortunately disappeared primarily as a result of human extermination. Today their range is restricted to sub-Saharan Africa with a small remaining population in Iran (Estes, 1993; Nowell & Jackson, 1996). Within theses regions, their patterns of distribution are mainly influenced by the abundance of prey and by the presence of predators (Durant et al., 1988; Durant et al., 2004). Even though the cheetah is classified as vulnerable by IUCN and is an Appendix I species, as stated by CITES, they are still being persecuted by farmers (Nowell & Jackson, 1996; Marker, 2002). Other threats that put the cheetah at danger are largely a result of changes in land-use management. Fragmentation and encroachment of the cheetahs’ habitat can result in a decrease in prey availability and an increase in predator densities, causing a higher level of interguild competition (Nowell & Jackson, 1996; Durant et al., 2004). Anthropogenic changes to the habitat by converting the environment from an open plain and woodland landscape to a landscape that is dominated by Acacia-thicket could also have a negative effect (Muntifering et al., 2006). Cheetahs have adapted their survival strategies to a specific type of habitat and changing this could have detrimental consequences, such as reducing their hunting capability. The cheetahs are forced to utilise the altered habitat, providing the possibility that the quality of their surroundings can no longer be accurately evaluated. This can lead to a maladaptive outcome that will eventually decrease the chance of survival. This concept is often referred to as the ‘ecological trap’ (Schlaepfer et al., 2002).
Cheetah habitat selection The majority of the cheetah studies that have been conducted over the last few decades have been situated in the open plains of the Serengeti in East Africa. There are several reasons why
10
these studies have been carried out in this part of the world: first, the plains are famous for their biodiversity and annual mass migrations of prey and predator alike. Secondly, they offer a high level of visibility, making the study of inconspicuous animals, such as the cheetah, more attainable as observations and the ability to follow individuals are less problematic (Eaton, 1974; Caro, 1994; Purchase & du Toit, 2000). The high visibility has also attracted hunters, photographers and filmmakers alike, which might be an additional reason why there is this notion that cheetahs are specialised hunters of the open savannas (Eaton, 1974). This perception could possibly be biased as evidence suggests that the open plains are only a fraction of the total habitat that is utilised by this species (Hamilton, 1986). The open plains of East Africa are unique and not representative of what is found in the rest of Africa (Eaton, 1974) and studies carried out in Uganda, South Africa, Namibia and Zimbabwe suggest that cheetahs are more plastic in their habitat utilisation than what was first believed (Gros & Rejmánek, 1999; Purchase & du Toit, 2000; Mills et al., 2004; Muntifering et al., 2006). It has been hypothesised that using heterogeneous habitats could be the key to survival, but knowledge about their behaviour and ecology in woodland habitats is still limited (Durant, 1998; Mills et al., 2004; Bissett & Bernard, 2007).
Prey When prey is abundant, cheetahs tend to hunt every 2-5 days except when a female has cubs then hunting becomes a daily activity (Estes, 1993). The majority of the prey consists of medium sized ungulates between the 23-56 kg (Hayward et al., 2006), but can range between anything from guinea fowl (Purchase & du Toit, 2000) and hares (Marker, 2002) to wildebeest (Eaton, 1974) and blackbuck in Asia (Nowell & Jackson, 1996). The size of the prey that is killed usually depends on the cheetahs’ sex and the social grouping; females are more inclined to catch smaller prey than males (Marker, 2002; Mills et al., 2004) and coalitions are more likely to catch larger prey than single males (Caro, 1994). The type of prey that is caught is positively correlated to its abundance and tends to vary between different locations (Table 1) (Hayward et al., 2006). When prey is migratory, such as in the Serengeti, the distribution of female and non-territorial male cheetahs is primarily governed by the prey movement (Durant et al., 1988). Territorial males tend not to be influenced by the movement of prey unless food becomes particularly scarce (Caro & Collins, 1987). In general cheetahs do not select areas where prey abundance is the highest as these are usually areas where the presence of interspecific competitors such as lions and spotted hyenas Crocuta crocuta are also high (Durant, 1998). Since cheetah distribution and habitat selection is not influenced by prey abundance (Caro & Collins, 1987; Bissett & Bernard, 2007), it can be deduced that the cheetahs’ hunting strategy adheres to the
11
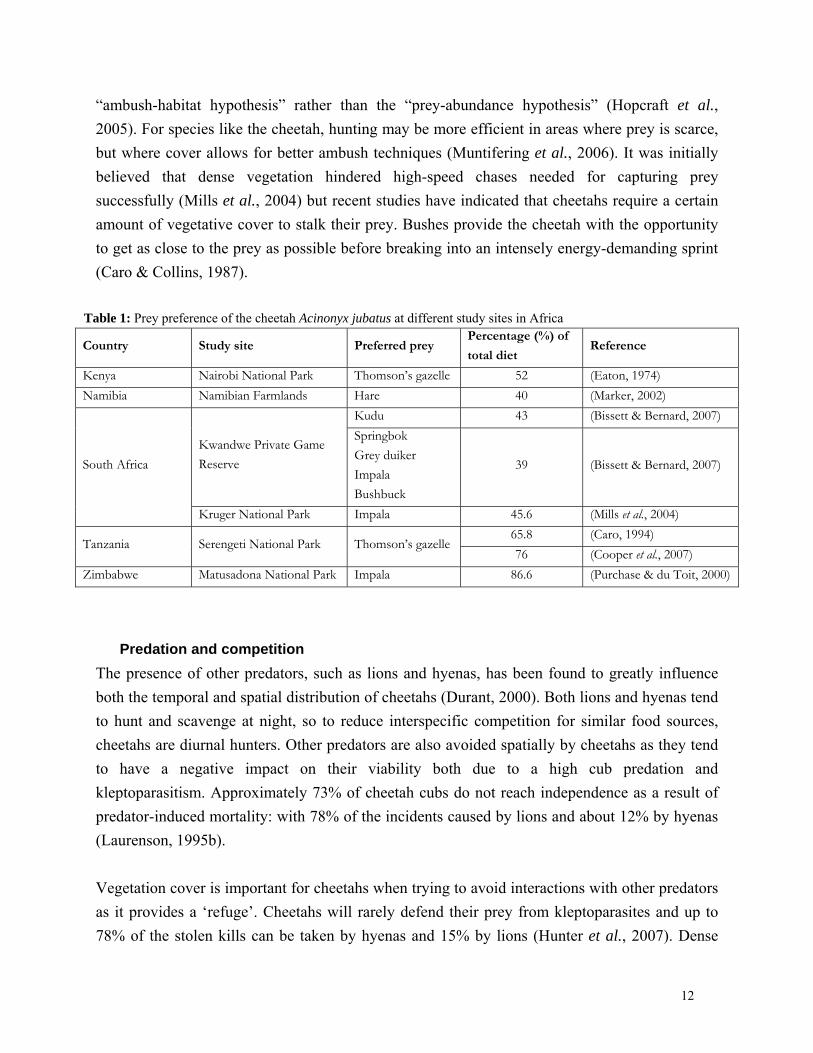
“ambush-habitat hypothesis” rather than the “prey-abundance hypothesis” (Hopcraft et al., 2005). For species like the cheetah, hunting may be more efficient in areas where prey is scarce, but where cover allows for better ambush techniques (Muntifering et al., 2006). It was initially believed that dense vegetation hindered high-speed chases needed for capturing prey successfully (Mills et al., 2004) but recent studies have indicated that cheetahs require a certain amount of vegetative cover to stalk their prey. Bushes provide the cheetah with the opportunity to get as close to the prey as possible before breaking into an intensely energy-demanding sprint (Caro & Collins, 1987).
Table 1: Prey preference of the cheetah Acinonyx jubatus at different study sites in Africa
Country Study site Preferred prey Percentage (%) of
total diet Reference
Kenya Nairobi National Park Thomson’s gazelle 52 (Eaton, 1974) Namibia Namibian Farmlands Hare 40 (Marker, 2002)
Kudu 43 (Bissett & Bernard, 2007)
Kwandwe Private Game Reserve
Springbok Grey duiker Impala Bushbuck
39 (Bissett & Bernard, 2007) South Africa
Kruger National Park Impala 45.6 (Mills et al., 2004) 65.8 (Caro, 1994)
Tanzania Serengeti National Park Thomson’s gazelle 76 (Cooper et al., 2007)
Zimbabwe Matusadona National Park Impala 86.6 (Purchase & du Toit, 2000)
Predation and competition The presence of other predators, such as lions and hyenas, has been found to greatly influence both the temporal and spatial distribution of cheetahs (Durant, 2000). Both lions and hyenas tend to hunt and scavenge at night, so to reduce interspecific competition for similar food sources, cheetahs are diurnal hunters. Other predators are also avoided spatially by cheetahs as they tend to have a negative impact on their viability both due to a high cub predation and kleptoparasitism. Approximately 73% of cheetah cubs do not reach independence as a result of predator-induced mortality: with 78% of the incidents caused by lions and about 12% by hyenas (Laurenson, 1995b). Vegetation cover is important for cheetahs when trying to avoid interactions with other predators as it provides a ‘refuge’. Cheetahs will rarely defend their prey from kleptoparasites and up to 78% of the stolen kills can be taken by hyenas and 15% by lions (Hunter et al., 2007). Dense
12
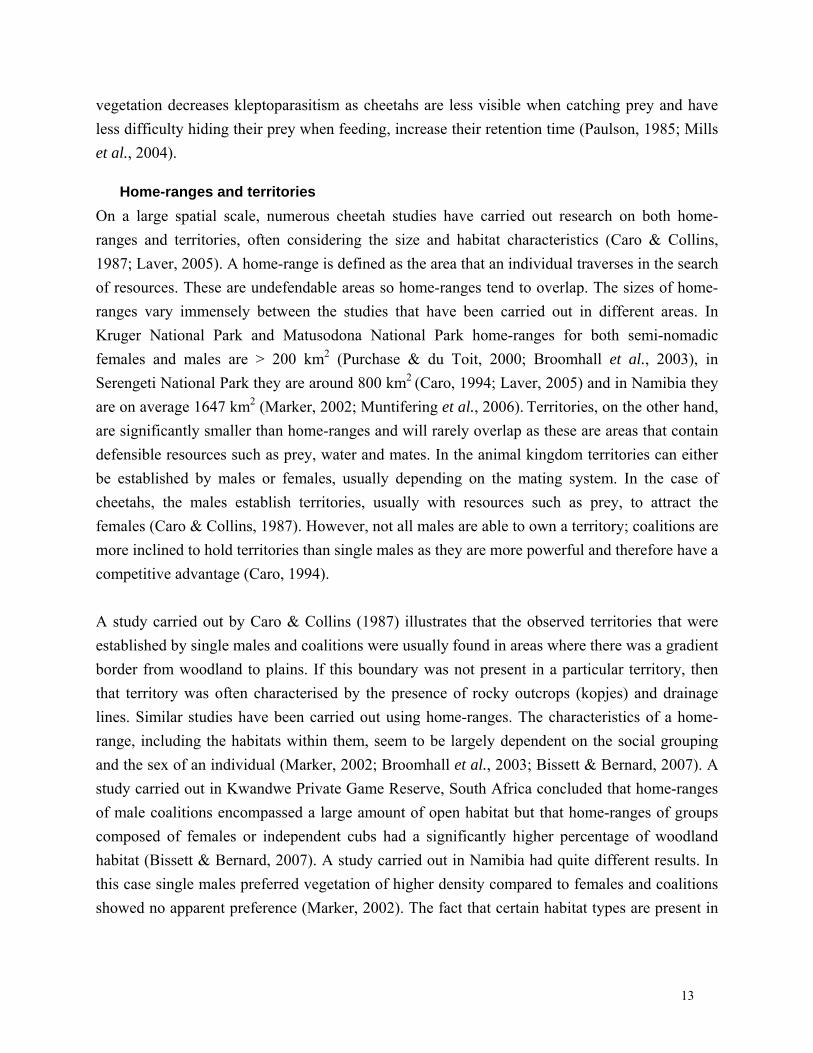
vegetation decreases kleptoparasitism as cheetahs are less visible when catching prey and have less difficulty hiding their prey when feeding, increase their retention time (Paulson, 1985; Mills et al., 2004).
Home-ranges and territories On a large spatial scale, numerous cheetah studies have carried out research on both home-ranges and territories, often considering the size and habitat characteristics (Caro & Collins, 1987; Laver, 2005). A home-range is defined as the area that an individual traverses in the search of resources. These are undefendable areas so home-ranges tend to overlap. The sizes of home-ranges vary immensely between the studies that have been carried out in different areas. In Kruger National Park and Matusodona National Park home-ranges for both semi-nomadic females and males are > 200 km2 (Purchase & du Toit, 2000; Broomhall et al., 2003), in Serengeti National Park they are around 800 km2 (Caro, 1994; Laver, 2005) and in Namibia they are on average 1647 km2 (Marker, 2002; Muntifering et al., 2006). Territories, on the other hand, are significantly smaller than home-ranges and will rarely overlap as these are areas that contain defensible resources such as prey, water and mates. In the animal kingdom territories can either be established by males or females, usually depending on the mating system. In the case of cheetahs, the males establish territories, usually with resources such as prey, to attract the females (Caro & Collins, 1987). However, not all males are able to own a territory; coalitions are more inclined to hold territories than single males as they are more powerful and therefore have a competitive advantage (Caro, 1994). A study carried out by Caro & Collins (1987) illustrates that the observed territories that were established by single males and coalitions were usually found in areas where there was a gradient border from woodland to plains. If this boundary was not present in a particular territory, then that territory was often characterised by the presence of rocky outcrops (kopjes) and drainage lines. Similar studies have been carried out using home-ranges. The characteristics of a home-range, including the habitats within them, seem to be largely dependent on the social grouping and the sex of an individual (Marker, 2002; Broomhall et al., 2003; Bissett & Bernard, 2007). A study carried out in Kwandwe Private Game Reserve, South Africa concluded that home-ranges of male coalitions encompassed a large amount of open habitat but that home-ranges of groups composed of females or independent cubs had a significantly higher percentage of woodland habitat (Bissett & Bernard, 2007). A study carried out in Namibia had quite different results. In this case single males preferred vegetation of higher density compared to females and coalitions showed no apparent preference (Marker, 2002). The fact that certain habitat types are present in
13
a particular home-range or territory does not necessarily indicate that these habitats are actually exploited by the individuals. For this, analysis on a finer scale must be carried out.
Previous research Over the past decade, several studies have been carried out throughout Africa to determine the actual habitat, and the associated characteristics, that are used by cheetahs (Gros & Rejmánek, 1999; Purchase & du Toit, 2000; Marker, 2002; Broomhall et al., 2003; Mills et al., 2004; Muntifering et al., 2006). All of these studies, apart from the Ugandan study by Gros & Rejmánek (1999), were carried out with the aid of radio-telemetry. The general consensus amongst these studies is that cheetahs require a mosaic of habitat characteristics that on the whole can be categorised into two types of habitat: grasslands or open habitat and wooded habitats (Nowell & Jackson, 1996).
Discussion In papers where the GLM and ENFA are compared using the same data set, results showed that these two statistical approaches have different strengths and weakness depending on the situation that is being analysed. Before deciding what the best method is, it is not only important to have some basic technical knowledge, but also biological knowledge about a species prior to data analysis. Before using any type of model it is important to be familiar with the underlying assumptions so that weaknesses in the results are known. The biggest assumption, with both GLM and ENFA, is that analysis infers that preference for a habitat type is indicated by the indirect relationship between presence and environmental features (Morrison et al., 2006). Additionally, not all activities are necessarily carried out in the same habitat or take up equal lengths of time. This means that if activities such as drinking only take up a small portion of time, the habitat that is used for this might be missed. Its relative importance might be suppressed due to a higher frequency of observations in the more dominant habitat types (Thomas & Taylor, 1990; Orians & Wittenberger, 1991; Brotons et al., 2004). Ecological interactions are extremely complex and no matter how elaborate the model is, it remains a simplistic representation of the real world. Care should be taken when extrapolating models. For example, when carrying out ENFA, the habitat that is described is relative to the background habitat. Habitat selection for that particular study can therefore not be extrapolated as the background habitat in other study areas might be very different (Guisan & Zimmermann, 2000; Brotons et al., 2004). This is important to keep in mind, especially for wide-ranging species, like the cheetah, that are found from the grassy plains of the Serengeti to the snowy mountains of Iran (Nowell & Jackson, 1996). There are several other problems with interpreting
14
and extrapolating information; firstly, habitat selection is scale-dependent. For example, on a small scale an animal can chose the presence of vegetation cover for breeding sites, but might be influenced by the presence of food on a larger scale (Orians & Wittenberger, 1991). This is regularly ignored in studies and often similar ecological questions are being asked, but studied at different scales, resulting in different outcomes that are difficult, if not impossible, to compare (Wiens, 1989). Secondly, habitat selection does not necessarily have to be a linear relationship as it is a complex process that unlikely to be simple and straightforward (Guisan & Zimmermann, 2000). Even so, models are valuable tools for the analyses of habitat use and habitat suitability.
The most common approach to collecting data for habitat models is based on radio-telemetry. Even though this type of data collection accurately depicts areas used by individuals, it is also expensive and is therefore not feasible in many field situations where funds and expertise are limited (Zimmermann, 2004; Morrison et al., 2006). When individuals are not radio-tracked, these models are often based on incidental sightings which rely heavily on the abundance and detectability of the species (Palma et al., 1999; Woolf et al., 2002; Brotons et al., 2004). This process can be clearly illustrated with the study by Gros & Rejmánek (1999). Their results on habitat utilisation are based on incidental sightings collected through the process of interviewing people. This study has several inherent biases. Firstly, the method of data collection was not through direct observations, but through executing interviews, providing indirect information about the location and habitat characteristics of the individual sightings. Some interviewees were asked to recall data from many months and years prior to the interview. With this method the exact location and habitat characteristics of each sighting are far from reliable, but it is an appropriate method when analyses on habitat use have to be performed in a short space of time when historical data is not readily available. Secondly, if there are no records of cheetahs in a particular type of habitat, it does not imply that there are no cheetahs present in this habitat. In certain types of habitat, such as dense woodland, visibility is not optimal and as a consequence cheetahs are difficult to locate. The habitat use might therefore have been based on areas where detection of individuals is greater, rather than on sightings that are representative of the habitat cheetahs use. Hamilton (1986) found that in areas where thick bushland had been transformed into a more open habitat by the destructive action caused by both elephants Loxodonta africana and fires, cheetahs were seen more frequently. This too could be the result of increased visibility, improving the ability for detection rather than selection for open habitats by cheetahs.
These approaches have an underlying assumption, i.e. where the animals are spotted is representative of the actual habitat the animals utilise. However, this assumption has rarely been tested. The example of the study carried out by Gros & Rejmánek (1999) illustrates the
15
importance of testing such pre-requisite assumptions before carrying out habitat selection analyses based on incidental sightings. Incidental sightings might be more likely to occur in specific habitats that represent only a small fraction of the habitat generally used by the animals. If this is the case, mapping habitat use based on incidental sightings might translate into mapping best areas to spot the animals, and not into mapping the animal’s habitat.
Over the past 25 years, extensive research has been carried out on cheetahs in the Serengeti, Tanzania in order to create a comprehensive picture of their life-history, behaviour and ecology. A large amount of data on incidental sightings have been gathered over the years, which is valuable information that can be used to explore whether incidental sightings could be used for analysing habitat selection. It is therefore important to determine whether the data offers a good picture of typical cheetah habitats to make sure that suitability is not based on visibility.
Conclusion Studying the distribution and the habitat use of animals through space and time is an important aspect in developing a deeper understanding of animal ecology. Environmental features are selected for their ability to enhance fitness and it is possible that in areas where suitable habitats are not available, species could become extinct (Brotons et al., 2004). Combining spatial distribution with environmental factors can provide an important tool when it comes to conservation and wildlife management by 1- providing factors that affect the current distribution; 2- predicting abundance and distribution in the future (Stoms et al., 1993; Stamps & Swaisgood, 2007) and 3- recommending measures to be taken to influence future abundance and distribution.
16
References
Araújo, M. B. & Williams, P. H. (2000) Selecting areas for species persistence using occurrence data. Biological Conservation, 96, 331-345.
Bissett, C. & Bernard, R. T. F. (2007) Habitat selection and feeding ecology of the cheetah (Acinonyx jubatus) in thicket vegetation: is the cheetah a savanna specialist? Journal of Zoology, 271, 310 - 317.
Broomhall, L. S., Mills, M. G. L. & Du Toit, J. T. (2003) Home range and habitat use by cheetahs (Acinonyx jubatus) in the Kruger National Park. Journal of Zoology, 261, 119 - 128.
Brotons, L., Thuiller, W., Araujo, M. B. & Hirzel, A. H. (2004) Presence-absence versus presence-only modelling methods for predicting bird habitat suitability. Ecography, 27, 437-448.
Brown, J. S. (1988) Patch use as an indicator of habitat preference, predation risk, and competition. Behavioral Ecology and Sociobiology, 22, 37-47.
Caro, T. M. (1994) Cheetah of the Serengeti: Group living in an asocial species The University of Chicago Press, Chicago.
Caro, T. M. (2000) Controversy over behaviour and genetics in cheetah conservation. Behaviour and Conservation (eds L. M. Gosling & W. J. Sutherland), pp. 221-237. Cambridge University Press, Cambridge.
Caro, T. M. & Collins, D. A. (1987) Ecological characteristics of territories of male cheetahs (Acinonyx jubatus). Journal of Zoology, 211, 89-105.
Chefaoui, R. M., Hortal, J. & Lobo, J. M. (2005) Potential distribution modelling, niche characterization and conservation status assessment using GIS tools: A case study of Iberian Copris species. Biological Conservation, 122, 327-338.
Cooper, A. B., Pettorelli, N. & Durant, S. M. (2007) Large carnivore menus: factors affecting hunting decisions by cheetahs in the Serengeti. Animal Behaviour, 73, 651-659.
Cowlishaw, G. U. Y. (1997) Trade-offs between foraging and predation risk determine habitat use in a desert baboon population. Animal Behaviour, 53, 667-686.
Durant, S. M. (1998) Competition refuges and coexistence: An example from Serengeti carnivores. The Journal of Animal Ecology, 67, 370 - 386.
Durant, S. M. (2000) Living with the enemy: Avoidance of hyenas and lions by cheetahs in the Serengeti Behavioral Ecology, 11, 624 - 632.
Durant, S. M., Caro, T. M., Collins, D. A., Alawi, R. M. & FitzGibbon, C. D. (1988) Migration patterns of Thomson's gazelles and cheetahs on the Serengeti Plains. African Journal of Ecology, 26, 257 - 268.
Durant, S. M., Kelly, M. & Caro, T. M. (2004) Factors affecting life and death in Serengeti cheetahs: Environment, age, and sociality. Behavioral Ecology, 15, 11-22.
Eaton, R. L. (1974) The cheetah: The biology, ecology, and behavior of an endangered species. Van Nostrand Reinhold, New York.
Estes, R. D. (1993) The safari companion: A guide to watching African mammals. Chelsea Green Publishing, Vermont.
Gros, P. M. & Rejmánek, M. (1999) Status and habitat preferences of Uganda cheetahs: An attempt to predict carnivore occurrence based on vegetation structure Biodiversity and Conservation, 8, 1561 - 1583.
17
Guisan, A. & Zimmermann, N. E. (2000) Predictive habitat distribution models in ecology. Ecological Modelling, 135, 147-186.
Hamilton, P. H. (1986) Status of the cheetah in Kenya, with reference to sub-saharan Africa. Cats of the World: Biology, Conservation and Management (eds S. D. Miller & D. D. Everett). National Wildlife Federation, Washington, D.C.
Hayward, M. W., Hofmeyr, M., O'Brien, J. & Kerley, G. I. H. (2006) Prey preferences of the cheetah (Acinonyx jubatus) (Felidae:Carnivora): Morphological limitations or the need to capture rapidly consumable prey before kleptoparasites arrive? Journal of Zoology, 270, 615-627.
Hedrick, P. W. (1996) Bottleneck(s) or metapopulation in cheetahs. Conservation Biology, 10, 897-899.
Hirzel, A. H., Hausser, J., Chessel, D. & Perrin, N. (2002) Ecological-niche factor analysis: How to compute habitat suitability maps without absence data? Ecology, 83, 2027 - 2036.
Hirzel, A. H., Helfer, V. & Metral, F. (2001) Assessing habitat-suitability models with a virtual species. Ecological Modelling, 145, 111-121.
Hopcraft, J. G. C., Sinclair, A. R. E. & Packer, C. (2005) Planning for success: Serengeti lions seek prey accessibility rather than abundance Journal of Animal Ecology, 74, 559 - 566.
Houston, A. I., McNamara, J. M. & Hutchinson, J. M. C. (1993) General results concerning the trade-off between gaining energy and avoiding predation. Philosophical Transactions: Biological Sciences, 341, 375-397.
Hunter, J. S., Durant, S. M. & Caro, T. M. (2007) To flee or not to flee: Predator avoidance by cheetah kills. Behavioral Ecology and Sociobiology, 61, 1033-1042.
Kearney, M. (2006) Habitat, environment and niche: What are we modelling? Oikos, 115, 186-191.
Lack, D. (1933) Habitat selection in birds. With special reference to the effects of afforestation on the Breckland avifauna. The Journal of Animal Ecology, 2, 239-262.
Laurenson, M. K. (1995) Implications of high offspring mortality for cheetah population dynamics. Serengeti II: Dynamics, management and conservation of an ecosystem (eds A. R. E. Sinclair & P. Arcese). The University of Chicago Press, Chicago.
Laver, P. N. (2005) Cheetah of the Serengeti plains: A home range analysis. MSc, Virginia Polytechnic Institute and State University.
Manly, B. F. J., McDonald, L. L., Thomas, D. L., McDonald, T. L. & Erickson, W. P. (2002) Resource selection by animals: Statistical design and analysis for field studies, 2nd edn. Kluwer Academic Publishers, Dordrecht.
Marker, L. L. (2002) Aspects of cheetah (Acinonyx jubatus) biology, ecology and conservation strategies on Namibian farmlands. PhD, University of Oxford.
May, R. M. (1995) The cheetah controversy. Nature, 374, 309-310. McPeek, M. A. (1996) Trade-offs, food web structure, and the coexistence of habitat specialists
and generalists. The American Naturalist, 148, S124-S138. Mills, M. G. L., Broomhall, L. S. & du Toit, J. T. (2004) Cheetah Acinonyx jubatus feeding
ecology in the Kruger National Park and a comparison across African savanna habitats: Is the cheetah only a successful hunter on open grassland plains? Wildlife Biology, 10, 177 - 186.
Morris, D. W. (2003) Toward an ecological synthesis: a case for habitat selection. Oecologia, 136, 1-13.
18
Morrison, M. L., Marcot, B. G. & Mannan, R. W. (2006) Wildlife-habitat relationships: concepts and applications, 3rd edn. Island Press, Washington, D.C.
Muntifering, J. R., Dickman, A. J., Perlow, M. L., Hruska, T., Ryan, P. G., Marker, L. L. & Jeo, R. N. (2006) Managing the matrix for large carnivores: a novel approach and perspective from cheetah (Acinonyx jubatus) habitat suitability modelling. Animal Conservation, 9, 103-112.
Mysterud, A. & Ims, R. A. (1998) Functional Responses in Habitat Use: Availability Influences Relative Use in Trade-Off Situations. Ecology, 79, 1435-1441.
Nicholls, A. O. (1989) How to make biological surveys go further with generalised linear models. Biological Conservation, 50, 51-75.
Nowell, K. & Jackson, P. (1996) Wild Cats. Status Survey and Conservation Action Plan. IUCN/SSC Cat Specialist Group, IUCN, Gland, Switzerland.
Orians, G. H. & Wittenberger, J. F. (1991) Spatial and Temporal Scales in Habitat Selection. The American Naturalist, 137, S29-S49.
Ottaviani, D., Lasinio, G. J. & Boitani, L. (2004) Two statistical methods to validate habitat suitability models using presence-only data. Ecological Modelling, 179, 417-443.
Palma, L., Beja, P. & Rodrigues, M. (1999) The use of sighting data to analyse Iberian lynx habitat and distribution. Journal of Applied Ecology, 36, 812 - 824.
Paulson, D. R. (1985) The importance of open habitat to the occurence of kleptoparasitism. Auk, 102, 637-639.
Petrie, A. & Watson, P. (2006) Statistics for Veterinary and Animal Science. Blackwell Publishing, Oxford.
Poole, K. G., Wakelyn, L. A. & Nicklen, P. N. (1996) Habitat selection by lynx in Northwest Territories. Canadian Journal of Zoology, 74, 845-850.
Purchase, G. K. & du Toit, J. T. (2000) The use of space and prey by cheetahs in Matusadona National Park, Zimbabwe. South African Journal of Wildlife Research, 30, 139-144.
Rotenberry, J. T., Preston, K. L. & Knick, S. T. (2006) GIS-based niche modeling for mapping species' habitat. Ecology, 87, 1458-1464.
Schlaepfer, M. A., Runge, M. C. & Sherman, P. W. (2002) Ecological and evolutionary traps. Trends in Ecology & Evolution, 17, 474-480.
Sinclair, A. R. E., Fryxell, J. M. & Caughley, G. (2006) Wildlife Ecology, Conservation and Management, 2nd edn. Blackwell Publishing, Oxford.
Spong, G. (2002) Space use in lions, Panthera leo, in the Selous Game Reserve: social and ecological factors. Behavioral Ecology and Sociobiology, 52, 303-307.
Stamps, J. A. & Swaisgood, R. R. (2007) Some place like home: Experience, habitat selection and conservation biology. Applied Animal Behaviour Science, 102, 392-409.
Stoms, D. M., Davis, F. W., Cogan, C. B., Painho, M. O., Duncan, B. W., Scepan, J. & Scott, J. M. (1993) Geographical analysis of California condor sighting data. Conservation Biology, 7, 148 - 159.
Thomas, D. L. & Taylor, E. J. (1990) Study design and tests for comparing resource use and availability. Journal of Wildlife Management, 54, 322-330.
Tracy, C. R. & Christian, K. A. (1986) Ecological Relations Among Space, Time, and Thermal Niche Axes. Ecology, 67, 609-615.
Werner, E. E., Gilliam, J. F., Hall, D. J. & Mittelbach, G. G. (1983) An Experimental Test of the Effects of Predation Risk on Habitat Use in Fish. Ecology, 64, 1540-1548.
Wiens, J. A. (1989) Spatial Scaling in Ecology. Functional Ecology, 3, 385-397.
19

Woolf, A., Nielsen, C. K., Weber, T. & Gibbs-Kieninger, T. J. (2002) Statewide modeling of bobcat, Lynx rufus, habitat in Illinois, USA. Biological Conservation, 104, 191-198.
Yamaguchi, N., Rushton, S. & MacDonald, D. W. (2003) Habitat preference of feral American mink in the upper Thames. Journal of Mammalogy, 84, 1356-1373.
Zimmermann, F. (2004) Conservation of the Eurasian Lynx (Lynx lynx) in a fragmented landscape – habitat models, dispersal and potential distribution. PhD, l’Université de Lausanne.
20
Scientific paper:
Habitat selection patterns of Cheetahs Acinonyx jubatus in the
Serengeti, Tanzania FEMKE BROEKHUIS1,2, NATHALIE PETTORELLI1 and SARAH M. DURANT1
1Institute of Zoology, Zoological Society of London, Regent’s Park, London NW1 4RY, United Kingdom
2The Royal Veterinary College, Royal College Street, NW1 0TU, United Kingdom Summary
1. Often accidental sightings of species are used to determine habitat selection patterns and habitat suitability. However, this method has the underlying assumption that these sightings are representative of the habitat that is actually used by the species. 2. The Serengeti Cheetah Project in Tanzania has collected a substantial amount of uninterrupted tracking data, providing the perfect opportunity to test whether initial sightings are indeed characteristic of the habitat that is selected. The data were analysed using both a univariate and a multivariate approach to determine the general habitat selection of cheetahs and to investigate whether the pattern of habitat selection changes over time. 3. The results, in accordance with studies that have been carried out on radio-collared cheetahs, indicate that for the cheetah sightings considered in this study, the initial sighting data are indeed representative of the habitat that they utilise. 4. Synthesis and applications. Other factors can now be used with the sighting data to gain a deeper insight to the ecology of the cheetahs in the Serengeti. Understanding habitat selection, not only that of cheetahs, is a powerful tool to aid wildlife management and conservation. Key-words: Acinonyx jubatus, carnivore, ENFA, habitat selection, spatial analysis, spatial distribution Journal of Applied Ecology (2007)
21
Introduction The basic requirements for an organism to survive are determined by the availability of essential resources such as food, water and shelter (Morrison et al., 2006). The presence of a species is therefore believed to be a non-stochastic event, as species will select particular environmental features that will best enhance their chance of survival (Hirzel et al., 2002; Manly et al., 2002; Ottaviani et al., 2004). Recognising the relationship that a species has with its environment is an important foundation in the process of developing a better understanding of a species’ ecology. The interaction with and availability of resources is the driving force behind many ecological processes; both short term, such as population dynamics, and long term, such as coexistence, speciation and evolution (Pettifor et al., 2000; Morris, 2003; Morrison et al., 2006). The individuals’ choice of resources can enable them to live in the same area or competition might drive individuals of the same species apart (Lack, 1933; McPeek, 1996; Morris, 2003). Knowledge on habitat selection provides essential information on the environmental conditions needed for a species to reach its physiological optimum, providing a potentially powerful tool for conservation and wildlife management (Sinclair et al., 2006). Realising an animals needs can help make predictions about its possible occurrence and its response to novel circumstances (Pettifor et al., 2000). This provides an ecological basis on which decisions can be made with regards to the area and type of habitat needed for translocations and reintroductions to be successful as well as providing crucial information for the establishment of new reserves and the restoration of existing habitats (Araújo & Williams, 2000; Chefaoui et al., 2005; Muntifering et al., 2006; Rotenberry et al., 2006; Stamps & Swaisgood, 2007). Over the past few decades, there have been numerous studies that have focused on finding ways to quantify the relationship between occurrence of environmental factors and the presence of species. Various statistical methods have been developed to explore resource selection patterns and predict habitat suitability (Guisan & Zimmermann, 2000; Manly et al., 2002; Rotenberry et al., 2006). Many of these classical multivariate models require both information on the absence and presence of species. These models have been widely used with the assumption that the absence data that were collected or the pseudo-absence data that were created by randomly selecting areas where species data were missing is correct (Carroll et al., 1999; Gros & Rejmánek, 1999; Woolf et al., 2002; Brotons et al., 2004; Engler et al., 2004). The problem is that absence data are not always available and reliable, especially when the species being studied is mobile or inconspicuous (Brotons et al., 2004). Just because a species was not detected in a particular area does not necessarily mean that the species is absent (Hirzel et al., 2002; Brotons et al., 2004; Ottaviani et al., 2004). If the detection of a species is not 100% or if it varies across
22
habitats, false absences will be produced, leading to biases in the analysis (Hirzel et al., 2002). For cryptic, shy, elusive species occurring at low densities (such as carnivores; (Hamilton, 1986; Woolf et al., 2002), analyses based only on the presence of species would therefore be a more reliable alternative (Hirzel et al., 2001; Hirzel et al., 2002; Brotons et al., 2004). Various ecological studies describing a species’ habitat are moreover based on the locations where an animal was initially sighted (Gros & Rejmánek, 1999; Palma et al., 1999; Woolf et al., 2002). However, this information has the underlying assumption that where the animal was sighted, is representative of the habitat that it actually uses. Many ecological studies depend on the accuracy of this type of sighting data (Brotons et al., 2004), but their reliability is rarely tested. For example, the image that is often associated with cheetahs Acinonyx jubatus is one of a high-speed hunter of the grassy plains (Eaton, 1974). However, this perception could be biased towards areas where visibility is most favourable as there have been many reports across Africa that cheetahs also utilise habitats with a certain amount of woodland cover (Hamilton, 1986; Mills et al., 2004). Woodland is believed to be an important feature of the cheetah habitat as it provides cover essential as a refuge from predators and interspecific competitors and as camouflage when stalking prey (Durant, 1998; Muntifering et al., 2006). Prior to carrying out any kind of habitat and distribution analysis, it is thus important to determine whether this type of initial sighting information is representative and can in fact be used to draw accurate conclusions about habitat selection patterns. Data collected on cheetahs in the Serengeti National Park, Tanzania, represent a significant opportunity to test whether initial sighting data are representative of an animals’ utilised habitat. Detailed location data for several cheetahs in the Serengeti were indeed collected between 1996 and 2004: whenever a cheetah was sighted, the date, time and the GPS location when it was first seen were recorded, and the cheetah was then followed, sometimes for several hours. Every five minutes the GPS coordinates of the monitored individual were noted. Thanks to these data, the data collected at incidental sightings can thus be compared to data collected at a later time period, allowing the testing of initial sighting data for representability. In this study, the habitat selection patterns of cheetahs in the Serengeti plains will be explored and the reliability of the initial sighting data will be tested. Some of the important environmental features that are believed to determine the presence of cheetahs include; vegetation type and density, the occurrence of roads, geographical features such as rocky outcrops, other predators and the availability of water and prey. Vegetation characteristics are vital components of a habitat as they influence various biotic and abiotic processes, such as prey presence and
23
temperature, but they also have an important function as cover and breeding sites. Cheetahs are frequently seen hunting on the open grasslands (Eaton, 1974), but it is believed that they need denser vegetation to provide essential cover (Durant, 1998; Muntifering et al., 2006). Based on these findings, cheetahs might be expected to inhabit the Serengeti plains where bushland and thickets are readily available (H1). Roads are also important features, as cheetahs have been reported to avoid them since they tend to be used by tourists and other predators such as lions Leo panthera and hyenas Crocuta crocuta (pers. comm. Sarah Durant 2007). The presence of tourists is thought to have a negative impact on the hunting success of cheetahs (Durant et al., 2007). It is therefore expected that cheetahs will actively avoid roads (H2). Even though cheetahs can go up to 10 days without water (Estes, 1993), water is still important, not only for consumption, but as a feature where prey species tend to congregate (Durant et al., 1988). However, for this very same reason other predators are also attracted to water features (Hopcraft et al., 2005), so it is expected that cheetahs tend to avoid water (H3). Rocky outcrops, also known as kopjes, provide important vantage points to view prey and are often located in male territories (Caro & Collins, 1987; Hopcraft et al., 2005) so it is likely that cheetahs actively select for kopjes (H4). The last hypothesis is that, even though cheetahs have been reported to hunt livestock (Marker et al., 2003), they will generally avoid areas with human settlements (H5).
Methods Data collection
Study area and cheetah data The cheetah location data were collected in a 2200km2 area South-east of the Serengeti National Park in Tanzania (Durant et al., 2007). This region is characterised by an extensive grassland plain surrounded by Acacia and Commiphora woodland, irregularly interspersed with kopjes made from granite and gneiss. The area has two distinct seasons; namely, the wet season that runs from November to June and a drier season between July and October (Caro, 1994). Over the decades, countless research studies have been carried out in this area, including those conducted by the Serengeti Cheetah Project. The project was established in 1974 and since then a considerable amount of data has been collected, both at a population level and at an individual level, providing information on many aspects of the cheetahs’ ecology. Detailed location data were collected between 1996 and 2004: whenever a cheetah was sighted it was given a sighting number and the date and time when it was first seen that day were recorded. Using a Global Positioning System (GPS) the exact location was obtained and noted every five
24
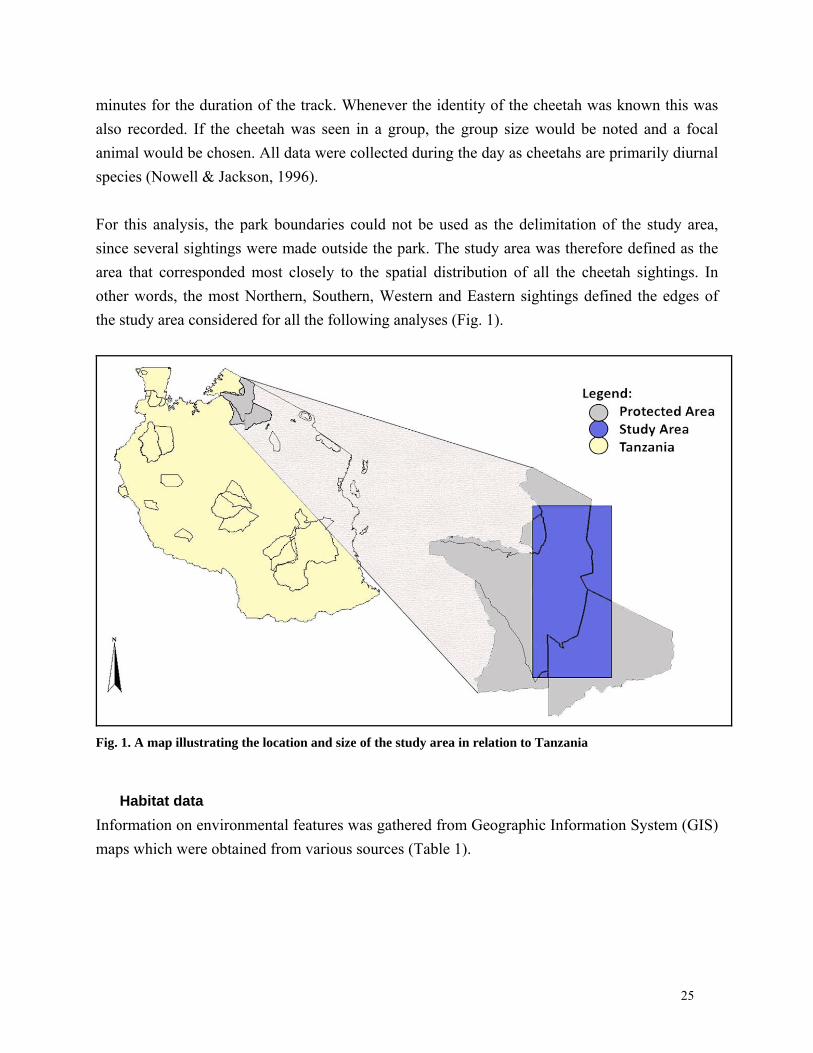
minutes for the duration of the track. Whenever the identity of the cheetah was known this was also recorded. If the cheetah was seen in a group, the group size would be noted and a focal animal would be chosen. All data were collected during the day as cheetahs are primarily diurnal species (Nowell & Jackson, 1996). For this analysis, the park boundaries could not be used as the delimitation of the study area, since several sightings were made outside the park. The study area was therefore defined as the area that corresponded most closely to the spatial distribution of all the cheetah sightings. In other words, the most Northern, Southern, Western and Eastern sightings defined the edges of the study area considered for all the following analyses (Fig. 1).
Fig. 1. A map illustrating the location and size of the study area in relation to Tanzania
Habitat data Information on environmental features was gathered from Geographic Information System (GIS) maps which were obtained from various sources (Table 1).
25
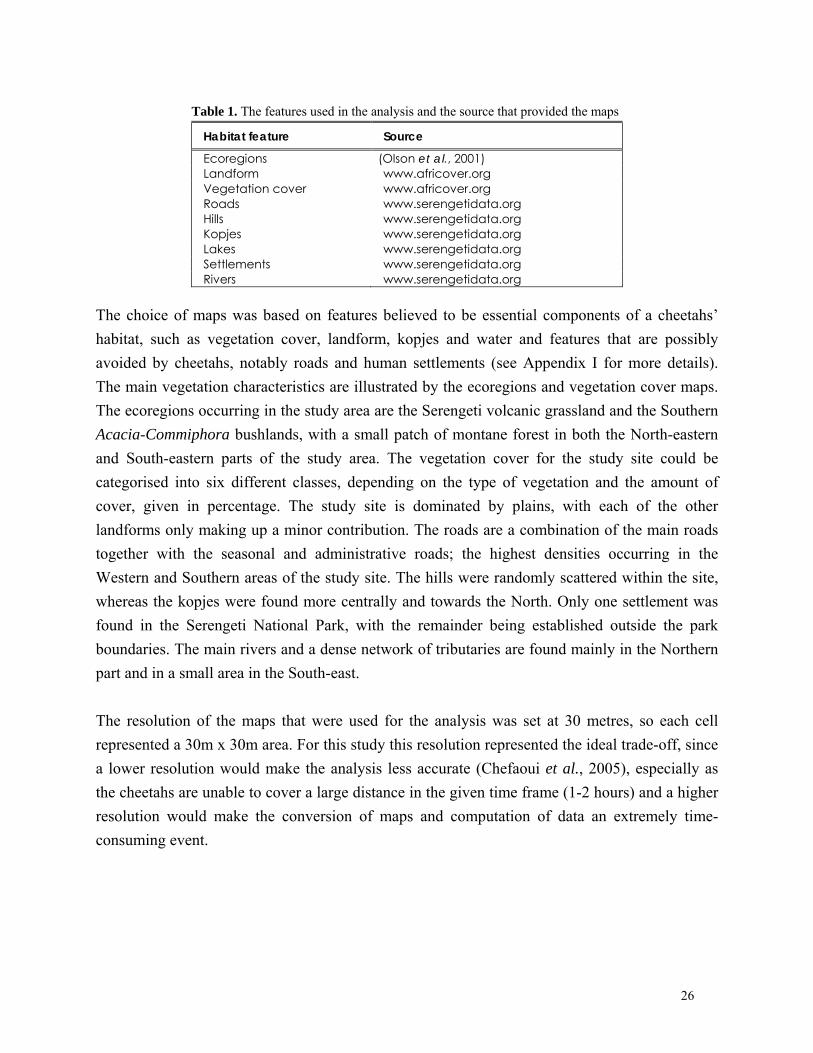
Table 1. The features used in the analysis and the source that provided the maps
Habitat feature Source
Ecoregions (Olson et al., 2001) Landform www.africover.org Vegetation cover www.africover.org Roads www.serengetidata.org Hills www.serengetidata.org Kopjes www.serengetidata.org Lakes www.serengetidata.org Settlements www.serengetidata.org Rivers www.serengetidata.org
The choice of maps was based on features believed to be essential components of a cheetahs’ habitat, such as vegetation cover, landform, kopjes and water and features that are possibly avoided by cheetahs, notably roads and human settlements (see Appendix I for more details). The main vegetation characteristics are illustrated by the ecoregions and vegetation cover maps. The ecoregions occurring in the study area are the Serengeti volcanic grassland and the Southern Acacia-Commiphora bushlands, with a small patch of montane forest in both the North-eastern and South-eastern parts of the study area. The vegetation cover for the study site could be categorised into six different classes, depending on the type of vegetation and the amount of cover, given in percentage. The study site is dominated by plains, with each of the other landforms only making up a minor contribution. The roads are a combination of the main roads together with the seasonal and administrative roads; the highest densities occurring in the Western and Southern areas of the study site. The hills were randomly scattered within the site, whereas the kopjes were found more centrally and towards the North. Only one settlement was found in the Serengeti National Park, with the remainder being established outside the park boundaries. The main rivers and a dense network of tributaries are found mainly in the Northern part and in a small area in the South-east. The resolution of the maps that were used for the analysis was set at 30 metres, so each cell represented a 30m x 30m area. For this study this resolution represented the ideal trade-off, since a lower resolution would make the analysis less accurate (Chefaoui et al., 2005), especially as the cheetahs are unable to cover a large distance in the given time frame (1-2 hours) and a higher resolution would make the conversion of maps and computation of data an extremely time-consuming event.
26
Statistics The majority of the cheetah sightings were made in the Serengeti volcanic grassland, with only a few in the Southern Acacia-Commiphora bushlands and thickets. The sightings found in both these habitat features were used when exploring general habitat selection (n=477). However, it is possible to assume that the representability of the initial sighting data differs in woodlands and grasslands. Based on this reason, only the cheetahs that were initially spotted in the volcanic grasslands were used to explore how time affected the patterns of habitat selection. An hour was the minimum time that the cheetahs were followed, so the location data for the one hour interval (t1) were available for all the grassland sightings (n=395). To establish if habitat selection changes through time, the individuals for which data at the two hour interval (t2) (n=85) were available were also analysed.
Univariate approach Using the Geoprocessing Wizard in ArcView GIS (version 3.3, ESRI, Redlands, CA, USA) habitat information was computed for every location. For each sighting three locations were considered (location of the monitored cheetah at t0, t1 and t2). For each location the shortest distance, in metres, to features such as roads, lakes, rivers, hills, kopjes and settlements were measured. Additionally, for each of these locations the vegetation cover, ecoregion and landform features were assessed. To explore how the distance to each of the features varied with time, paired t-tests were performed using the statistical package R (version 2.5.1). The idea behind this was to determine whether there was a significant difference in the distance to features at t0 compared to the distance measured at t1 and t2. Most of the paired t-tests were two-tailed, since there was no expectation on the direction the difference in distances should take. For the distance to the roads a one-tailed t-test was performed, as the expectation was that cheetahs move away from roads with time. To explore how the vegetation categories (landform, ecoregions and vegetation cover) where the cheetahs were found changed over time, the percentage of cheetahs changing categories from t0 to t1 and from t0 to t2 were determined. Using the sign test, these data were then analysed in more detail to check whether those cheetahs changed habitat categories according to some identifiable pattern, e.g. always changing from less cover to more cover.
27
Multivariate approach For each time interval (t0, t1, and t2), an Ecological Niche Factor Analysis (ENFA) was carried out on the cheetah location data using Biomapper (version 3.2). ENFA compares the habitat variables where the species is found to the background habitat features in the given study site (Hirzel et al., 2002). The output is a small set of uncorrelated factors referred to as marginality and specialisation. The marginality compares the mean habitat variables of the species to the mean of the study site. The output usually lies between 0 and 1 (although values above 1 are possible (Hirzel et al., 2002)), where 0 indicates that the mean of the species does not differ significantly from the mean of the study site and 1 indicates a large difference, which suggests that the species tends to live in an extreme habitat. The specialisation describes how specialised a species is by calculating the ratio of the explained variance of the habitat features of the study site and that of the species. Unlike marginality, specialisation can range from anywhere between 0 to infinity which makes interpretation problematic, which is why the tolerance is used. This is the inverse of specialisation (1/S), therefore ranging from 0 to 1. A tolerance around 0 (therefore a high specialisation) indicates that the species is very selective whereas a tolerance of 1 shows that the species is less restricted and so tends to use a range of conditions. The marginality and specialisation can be split into different factors, each indicating how much of the variation they account for. The marginality is always described by the first factor, whereas the specialisation is described by the remaining factors, arranged by the decreasing amount of explained variance. In most cases only the first few factors explain the overall specialisation. The coefficient found with each environmental variable reveals its correlation with the factor and hence its contribution. The maps, representing the habitat variables needed for the analysis, had to be divided into the different categories, each representing one qualitative feature referred to as eco-geographical variables (EGV) (Table 2). In total, 22 maps were created. As ENFA calculates the means and variances, qualitative data cannot be used, so the maps had to be transformed in to quantitative distance or frequency maps. Distance maps were produced for the environmental features that were scarce in the study site, whereby each cell has a particular value depending on its distance from that specific feature. The features that dominated the study site were computed into frequency maps to give the frequency of occurrence of a particular EGV within a given buffer around each cell (Table 2). The chosen size of the buffer was 2000m.
28
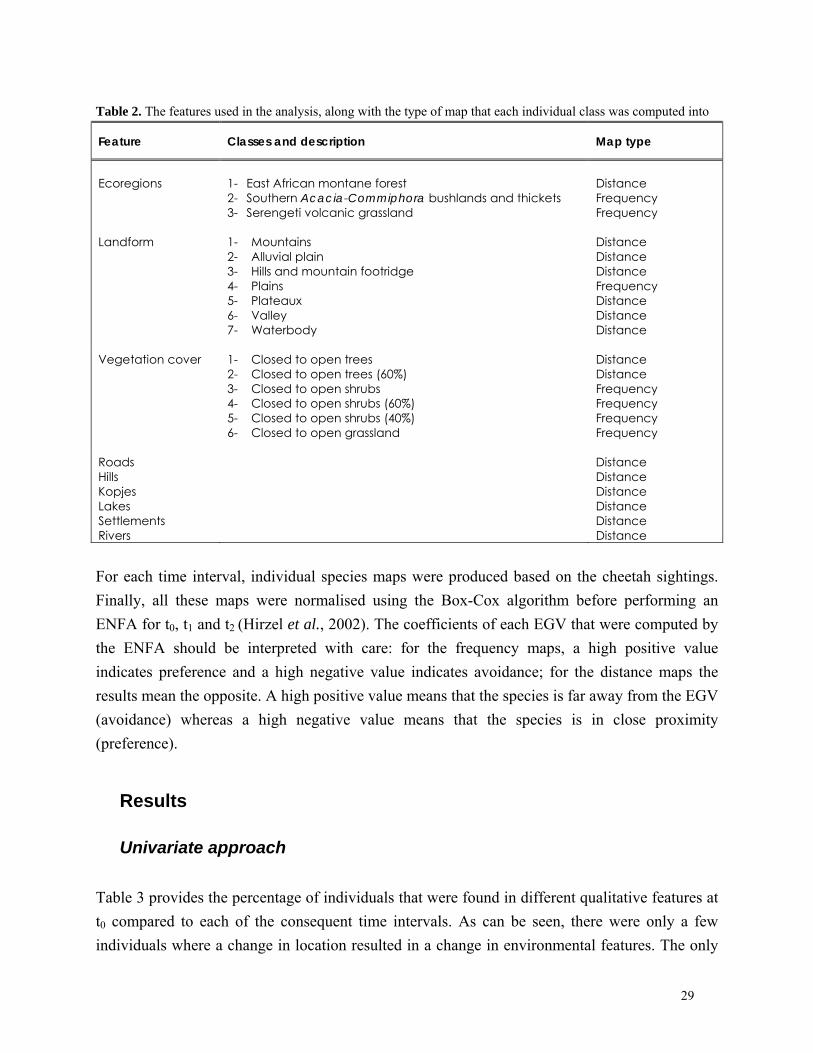
Table 2. The features used in the analysis, along with the type of map that each individual class was computed into
Feature Classes and description Map type
Ecoregions
1- East African montane forest 2- Southern Acacia-Commiphora bushlands and thickets 3- Serengeti volcanic grassland
Distance Frequency Frequency
Landform 1- Mountains 2- Alluvial plain 3- Hills and mountain footridge 4- Plains 5- Plateaux 6- Valley 7- Waterbody
Distance Distance Distance Frequency Distance Distance Distance
Vegetation cover 1- Closed to open trees 2- Closed to open trees (60%) 3- Closed to open shrubs 4- Closed to open shrubs (60%) 5- Closed to open shrubs (40%) 6- Closed to open grassland
Distance Distance Frequency Frequency Frequency Frequency
Roads Distance Hills Distance Kopjes Distance Lakes Distance Settlements Distance Rivers Distance
For each time interval, individual species maps were produced based on the cheetah sightings. Finally, all these maps were normalised using the Box-Cox algorithm before performing an ENFA for t0, t1 and t2 (Hirzel et al., 2002). The coefficients of each EGV that were computed by the ENFA should be interpreted with care: for the frequency maps, a high positive value indicates preference and a high negative value indicates avoidance; for the distance maps the results mean the opposite. A high positive value means that the species is far away from the EGV (avoidance) whereas a high negative value means that the species is in close proximity (preference).
Results Univariate approach
Table 3 provides the percentage of individuals that were found in different qualitative features at t0 compared to each of the consequent time intervals. As can be seen, there were only a few individuals where a change in location resulted in a change in environmental features. The only
29
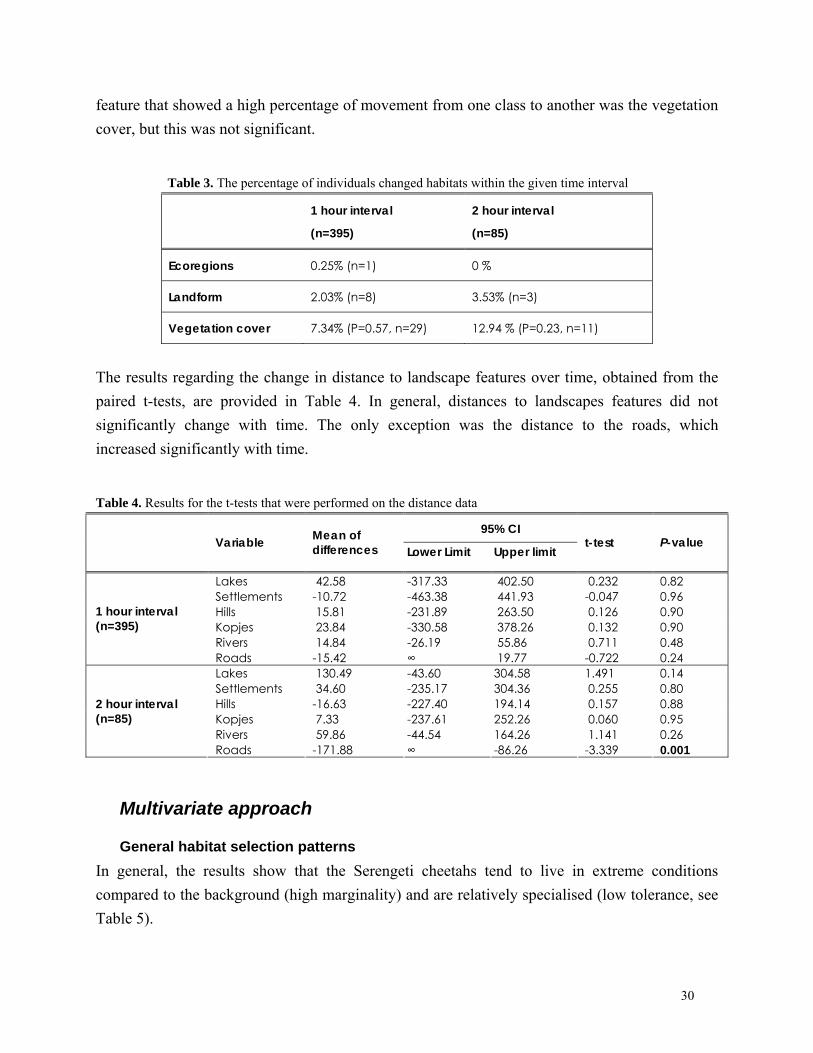
feature that showed a high percentage of movement from one class to another was the vegetation cover, but this was not significant.
Table 3. The percentage of individuals changed habitats within the given time interval
1 hour interval
(n=395)
2 hour interval
(n=85)
Ecoregions 0.25% (n=1) 0 %
Landform 2.03% (n=8) 3.53% (n=3)
Vegetation cover 7.34% (P=0.57, n=29) 12.94 % (P=0.23, n=11)
The results regarding the change in distance to landscape features over time, obtained from the paired t-tests, are provided in Table 4. In general, distances to landscapes features did not significantly change with time. The only exception was the distance to the roads, which increased significantly with time.
Table 4. Results for the t-tests that were performed on the distance data
95% CI Variable Mean of
differences Lower Limit Upper limit t-test P-value
Lakes 42.58 -317.33 402.50 0.232 0.82 Settlements -10.72 -463.38 441.93 -0.047 0.96 Hills 15.81 -231.89 263.50 0.126 0.90 Kopjes 23.84 -330.58 378.26 0.132 0.90 Rivers 14.84 -26.19 55.86 0.711 0.48
1 hour interval (n=395)
Roads -15.42 ∞ 19.77 -0.722 0.24 Lakes 130.49 -43.60 304.58 1.491 0.14 Settlements 34.60 -235.17 304.36 0.255 0.80 Hills -16.63 -227.40 194.14 0.157 0.88 Kopjes 7.33 -237.61 252.26 0.060 0.95 Rivers 59.86 -44.54 164.26 1.141 0.26
2 hour interval (n=85)
Roads -171.88 ∞ -86.26 -3.339 0.001
Multivariate approach
General habitat selection patterns In general, the results show that the Serengeti cheetahs tend to live in extreme conditions compared to the background (high marginality) and are relatively specialised (low tolerance, see Table 5).
30
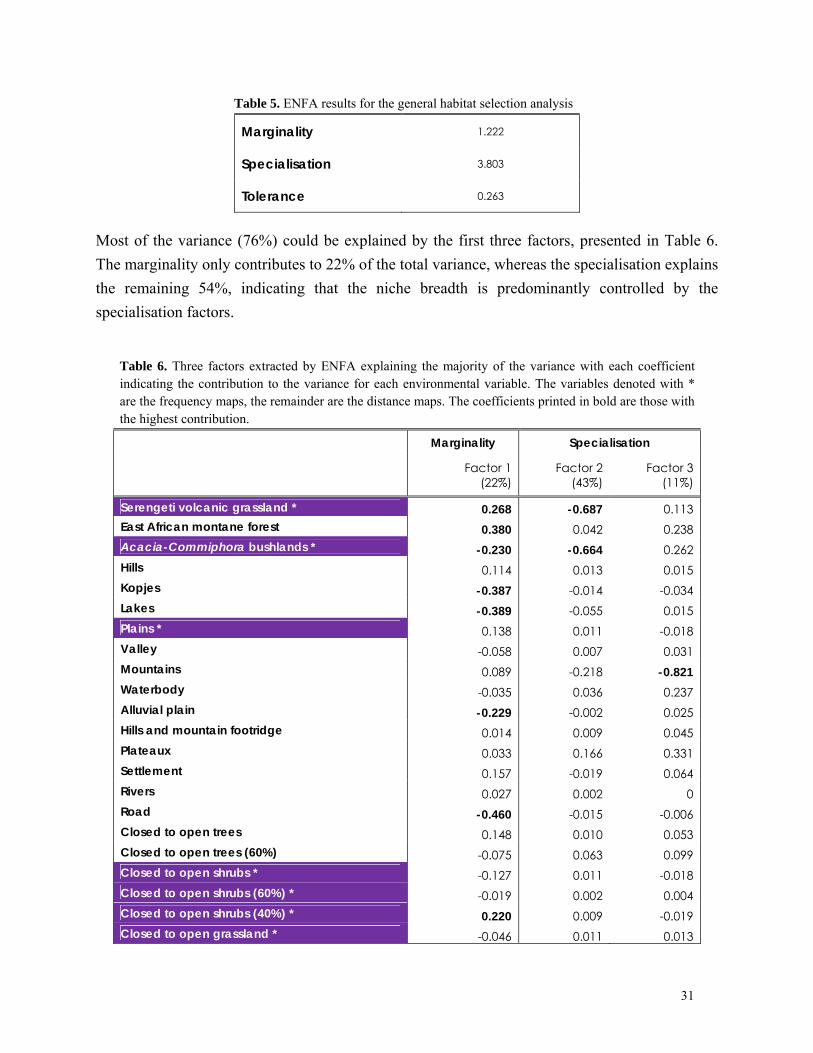
Table 5. ENFA results for the general habitat selection analysis
Marginality 1.222
Specialisation 3.803
Tolerance 0.263
Most of the variance (76%) could be explained by the first three factors, presented in Table 6. The marginality only contributes to 22% of the total variance, whereas the specialisation explains the remaining 54%, indicating that the niche breadth is predominantly controlled by the specialisation factors.
Table 6. Three factors extracted by ENFA explaining the majority of the variance with each coefficient indicating the contribution to the variance for each environmental variable. The variables denoted with * are the frequency maps, the remainder are the distance maps. The coefficients printed in bold are those with the highest contribution.
Marginality Specialisation
Factor 1
(22%) Factor 2
(43%) Factor 3
(11%)
Serengeti volcanic grassland * 0.268 -0.687 0.113 East African montane forest 0.380 0.042 0.238 Acacia-Commiphora bushlands * -0.230 -0.664 0.262 Hills 0.114 0.013 0.015 Kopjes -0.387 -0.014 -0.034 Lakes -0.389 -0.055 0.015 Plains * 0.138 0.011 -0.018 Valley -0.058 0.007 0.031 Mountains 0.089 -0.218 -0.821 Waterbody -0.035 0.036 0.237 Alluvial plain -0.229 -0.002 0.025 Hills and mountain footridge 0.014 0.009 0.045 Plateaux 0.033 0.166 0.331 Settlement 0.157 -0.019 0.064 Rivers 0.027 0.002 0 Road -0.460 -0.015 -0.006 Closed to open trees 0.148 0.010 0.053 Closed to open trees (60%) -0.075 0.063 0.099 Closed to open shrubs * -0.127 0.011 -0.018 Closed to open shrubs (60%) * -0.019 0.002 0.004 Closed to open shrubs (40%) * 0.220 0.009 -0.019 Closed to open grassland * -0.046 0.011 0.013
31
The EGVs that explain the cheetahs’ habitat difference from the global mean (marginality) are its presence in relation to the Serengeti volcanic grassland, the Southern Acacia-Commiphora shrubland and the 40% shrub cover. The distance from the East African montane forest, kopjes, lakes, alluvial plains and roads also have a significant influence on the habitat that is selected. In other words, the cheetahs considered in this analysis have a preference for the Serengeti volcanic grassland with 40% vegetation cover close to lakes, kopjes, alluvial plains and roads, but away from the East African montane forest and the Southern Acacia-Commiphora shrubland. The Serengeti volcanic grassland, Acacia-Commiphora bushland and the distance to the mountains have high coefficients for the specialisation factors, showing that the distribution of the cheetahs is restricted by these variables. Even though the distance to the settlements does not have a high coefficient, it does indicate that the cheetahs choose to keep away.
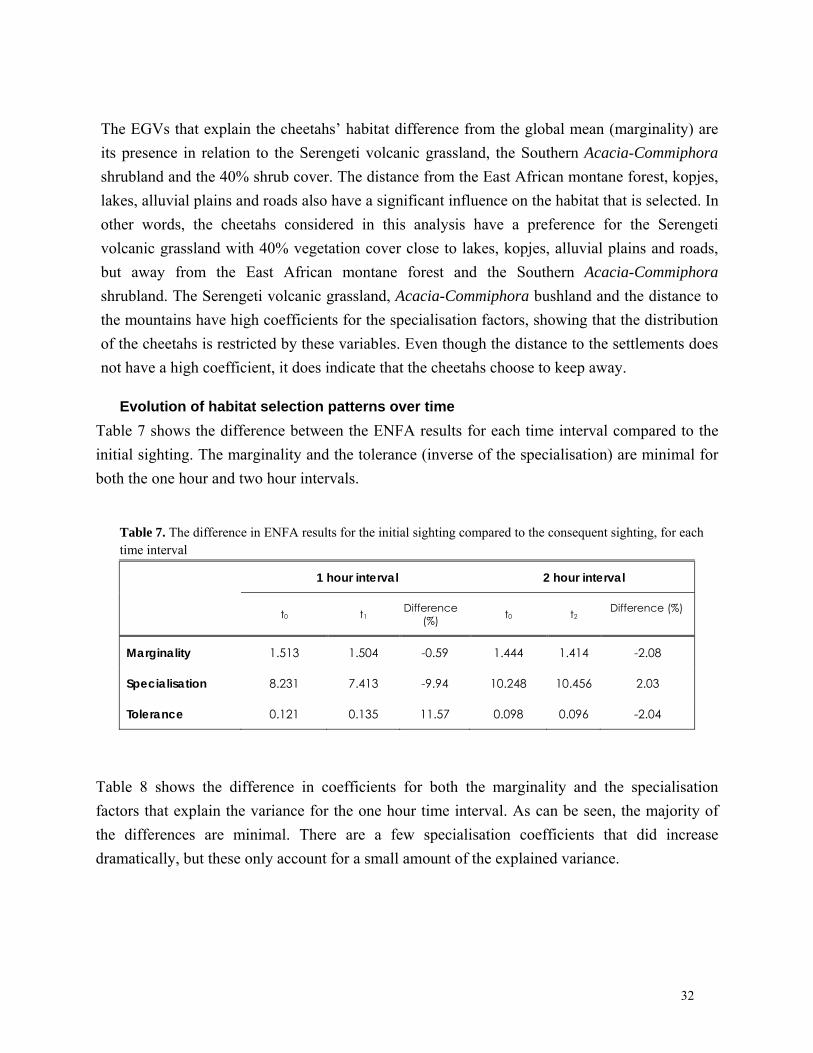
Evolution of habitat selection patterns over time Table 7 shows the difference between the ENFA results for each time interval compared to the initial sighting. The marginality and the tolerance (inverse of the specialisation) are minimal for both the one hour and two hour intervals.
Table 7. The difference in ENFA results for the initial sighting compared to the consequent sighting, for each time interval
1 hour interval 2 hour interval
t0 t1Difference
(%) t0 t2Difference (%)
Marginality 1.513 1.504 -0.59 1.444 1.414 -2.08
Specialisation 8.231 7.413 -9.94 10.248 10.456 2.03
Tolerance 0.121 0.135 11.57 0.098 0.096 -2.04
Table 8 shows the difference in coefficients for both the marginality and the specialisation factors that explain the variance for the one hour time interval. As can be seen, the majority of the differences are minimal. There are a few specialisation coefficients that did increase dramatically, but these only account for a small amount of the explained variance.
32
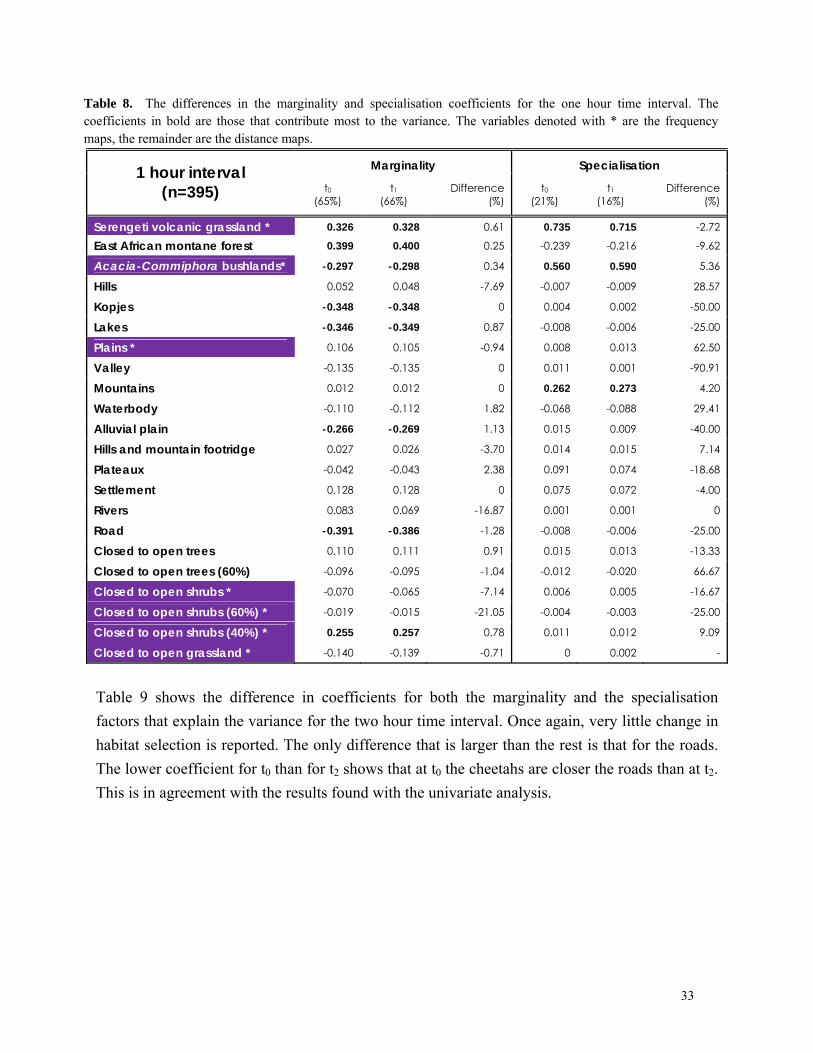
Table 8. The differences in the marginality and specialisation coefficients for the one hour time interval. The coefficients in bold are those that contribute most to the variance. The variables denoted with * are the frequency maps, the remainder are the distance maps.
Marginality Specialisation 1 hour interval (n=395) t0
(65%) t1
(66%) Difference
(%) t0
(21%) t1
(16%) Difference
(%)
Serengeti volcanic grassland * 0.326 0.328 0.61 0.735 0.715 -2.72
East African montane forest 0.399 0.400 0.25 -0.239 -0.216 -9.62
Acacia-Commiphora bushlands* -0.297 -0.298 0.34 0.560 0.590 5.36
Hills 0.052 0.048 -7.69 -0.007 -0.009 28.57
Kopjes -0.348 -0.348 0 0.004 0.002 -50.00
Lakes -0.346 -0.349 0.87 -0.008 -0.006 -25.00
Plains * 0.106 0.105 -0.94 0.008 0.013 62.50
Valley -0.135 -0.135 0 0.011 0.001 -90.91
Mountains 0.012 0.012 0 0.262 0.273 4.20
Waterbody -0.110 -0.112 1.82 -0.068 -0.088 29.41
Alluvial plain -0.266 -0.269 1.13 0.015 0.009 -40.00
Hills and mountain footridge 0.027 0.026 -3.70 0.014 0.015 7.14
Plateaux -0.042 -0.043 2.38 0.091 0.074 -18.68
Settlement 0.128 0.128 0 0.075 0.072 -4.00
Rivers 0.083 0.069 -16.87 0.001 0.001 0
Road -0.391 -0.386 -1.28 -0.008 -0.006 -25.00
Closed to open trees 0.110 0.111 0.91 0.015 0.013 -13.33
Closed to open trees (60%) -0.096 -0.095 -1.04 -0.012 -0.020 66.67
Closed to open shrubs * -0.070 -0.065 -7.14 0.006 0.005 -16.67
Closed to open shrubs (60%) * -0.019 -0.015 -21.05 -0.004 -0.003 -25.00
Closed to open shrubs (40%) * 0.255 0.257 0.78 0.011 0.012 9.09
Closed to open grassland * -0.140 -0.139 -0.71 0 0.002 -
Table 9 shows the difference in coefficients for both the marginality and the specialisation factors that explain the variance for the two hour time interval. Once again, very little change in habitat selection is reported. The only difference that is larger than the rest is that for the roads. The lower coefficient for t0 than for t2 shows that at t0 the cheetahs are closer the roads than at t2. This is in agreement with the results found with the univariate analysis.
33
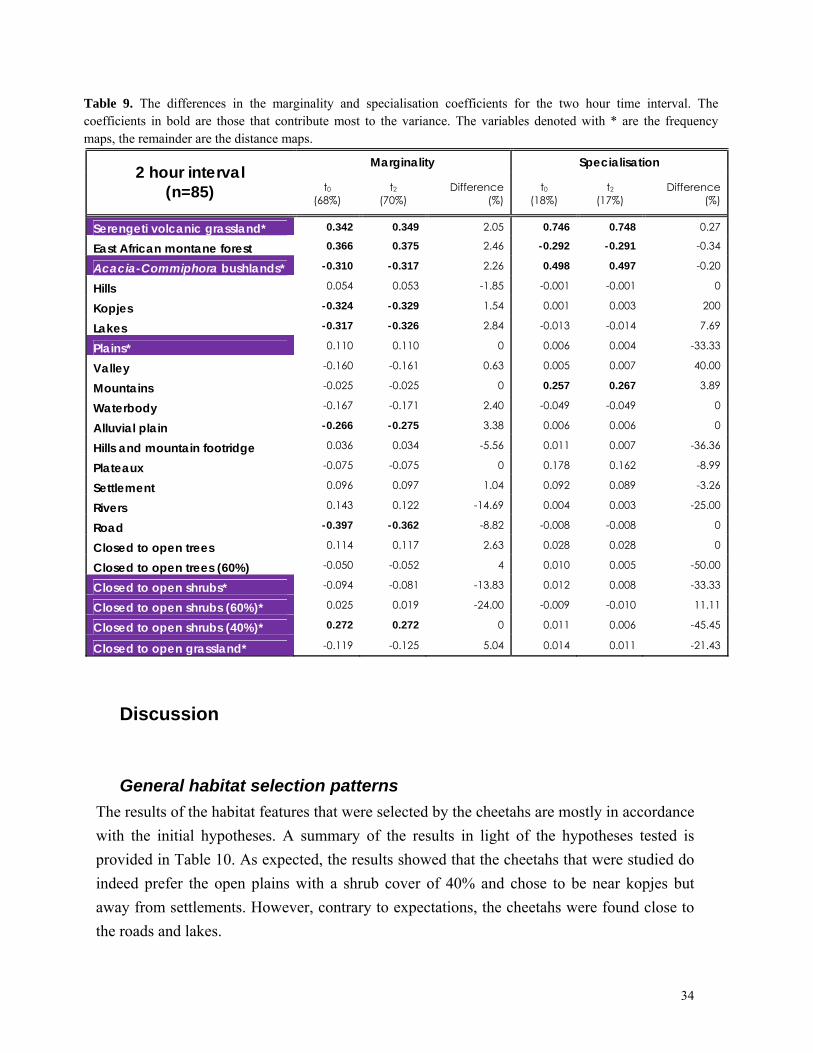
Table 9. The differences in the marginality and specialisation coefficients for the two hour time interval. The coefficients in bold are those that contribute most to the variance. The variables denoted with * are the frequency maps, the remainder are the distance maps.
Marginality Specialisation 2 hour interval (n=85) t0
(68%) t2
(70%) Difference
(%) t0
(18%) t2
(17%) Difference
(%)
Serengeti volcanic grassland* 0.342 0.349 2.05 0.746 0.748 0.27
East African montane forest 0.366 0.375 2.46 -0.292 -0.291 -0.34
Acacia-Commiphora bushlands* -0.310 -0.317 2.26 0.498 0.497 -0.20
Hills 0.054 0.053 -1.85 -0.001 -0.001 0
Kopjes -0.324 -0.329 1.54 0.001 0.003 200
Lakes -0.317 -0.326 2.84 -0.013 -0.014 7.69
Plains* 0.110 0.110 0 0.006 0.004 -33.33
Valley -0.160 -0.161 0.63 0.005 0.007 40.00
Mountains -0.025 -0.025 0 0.257 0.267 3.89
Waterbody -0.167 -0.171 2.40 -0.049 -0.049 0
Alluvial plain -0.266 -0.275 3.38 0.006 0.006 0
Hills and mountain footridge 0.036 0.034 -5.56 0.011 0.007 -36.36
Plateaux -0.075 -0.075 0 0.178 0.162 -8.99
Settlement 0.096 0.097 1.04 0.092 0.089 -3.26
Rivers 0.143 0.122 -14.69 0.004 0.003 -25.00
Road -0.397 -0.362 -8.82 -0.008 -0.008 0
Closed to open trees 0.114 0.117 2.63 0.028 0.028 0
Closed to open trees (60%) -0.050 -0.052 4 0.010 0.005 -50.00
Closed to open shrubs* -0.094 -0.081 -13.83 0.012 0.008 -33.33
Closed to open shrubs (60%)* 0.025 0.019 -24.00 -0.009 -0.010 11.11
Closed to open shrubs (40%)* 0.272 0.272 0 0.011 0.006 -45.45
Closed to open grassland* -0.119 -0.125 5.04 0.014 0.011 -21.43
Discussion
General habitat selection patterns The results of the habitat features that were selected by the cheetahs are mostly in accordance with the initial hypotheses. A summary of the results in light of the hypotheses tested is provided in Table 10. As expected, the results showed that the cheetahs that were studied do indeed prefer the open plains with a shrub cover of 40% and chose to be near kopjes but away from settlements. However, contrary to expectations, the cheetahs were found close to the roads and lakes.
34
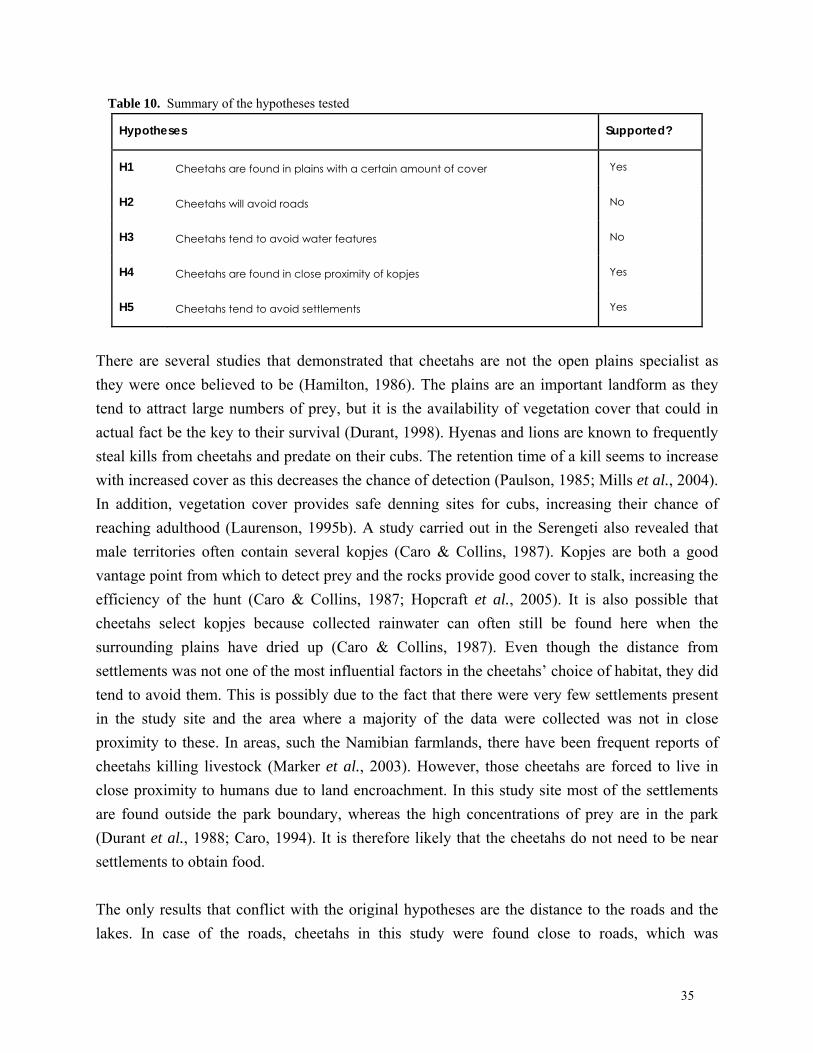
Table 10. Summary of the hypotheses tested
Hypotheses Supported?
H1 Cheetahs are found in plains with a certain amount of cover Yes
H2 Cheetahs will avoid roads No
H3 Cheetahs tend to avoid water features No
H4 Cheetahs are found in close proximity of kopjes Yes
H5 Cheetahs tend to avoid settlements Yes
There are several studies that demonstrated that cheetahs are not the open plains specialist as they were once believed to be (Hamilton, 1986). The plains are an important landform as they tend to attract large numbers of prey, but it is the availability of vegetation cover that could in actual fact be the key to their survival (Durant, 1998). Hyenas and lions are known to frequently steal kills from cheetahs and predate on their cubs. The retention time of a kill seems to increase with increased cover as this decreases the chance of detection (Paulson, 1985; Mills et al., 2004). In addition, vegetation cover provides safe denning sites for cubs, increasing their chance of reaching adulthood (Laurenson, 1995b). A study carried out in the Serengeti also revealed that male territories often contain several kopjes (Caro & Collins, 1987). Kopjes are both a good vantage point from which to detect prey and the rocks provide good cover to stalk, increasing the efficiency of the hunt (Caro & Collins, 1987; Hopcraft et al., 2005). It is also possible that cheetahs select kopjes because collected rainwater can often still be found here when the surrounding plains have dried up (Caro & Collins, 1987). Even though the distance from settlements was not one of the most influential factors in the cheetahs’ choice of habitat, they did tend to avoid them. This is possibly due to the fact that there were very few settlements present in the study site and the area where a majority of the data were collected was not in close proximity to these. In areas, such the Namibian farmlands, there have been frequent reports of cheetahs killing livestock (Marker et al., 2003). However, those cheetahs are forced to live in close proximity to humans due to land encroachment. In this study site most of the settlements are found outside the park boundary, whereas the high concentrations of prey are in the park (Durant et al., 1988; Caro, 1994). It is therefore likely that the cheetahs do not need to be near settlements to obtain food. The only results that conflict with the original hypotheses are the distance to the roads and the lakes. In case of the roads, cheetahs in this study were found close to roads, which was
35
unexpected since roads tend to attract competitors such as hyenas and lions (pers. comm. Sarah Durant). This outcome could be due to the fact that the searching effort is higher near roads and therefore the chance of spotting a cheetah near a road is higher. Additionally, the area where most of the sightings were made is an area where the density of the road network is relatively large compared to the rest of the study site. As the ENFA compares the habitat where a species is located with the background features, it will indeed seem like cheetahs are attracted to roads. Water bodies, such as the lakes, were similarly not thought to attract cheetahs as these are important features selected by other predators such as lions (Hopcraft et al., 2005). However, the results indicate that lakes are indeed a feature chosen by cheetahs. A likely explanation as to why they are found closer to lakes than expected could be because the density of the lakes was relatively high in the area where the majority of the data were collected. It could also be a question of time. Lions tend to hunt at night, whilst cheetahs are more of a diurnal species (Nowell & Jackson, 1996). It is possible that they move towards water during the day, both to drink and to hunt, but move away again at night when encounters with lions might be higher. The results also indicate that the cheetahs used in the analysis tend to live in extreme conditions compared to the background (high marginality) and that they are relatively specialised (low tolerance) which means that they are restricted by their environment, only allowing them to survive in a narrow range of conditions. However, in reality this is unlikely. Large carnivores tend to be generalist rather than specialist as they often rely on resources that are unreliable and not always available e.g. the ungulate migrations of the Serengeti (Durant et al., 1988; McPeek, 1996). It has also been noted that cheetahs are not only found in the open plains of the Serengeti, but range from parts of Iran, all the way to Southern Africa (Estes, 1993; Nowell & Jackson, 1996). The reason why the cheetahs in this study appear to be so specialised is most likely to be a consequence of both the scale used for the analysis and the searching effort. It is possible that on a small scale they appear to be a specialist species, but that on a larger scale they are more generalist (Hirzel et al., 2002), as is indicated by their enormous distribution range. For a comprehensive understanding on the effect of the spatial scale on habitat selection, multi-scale analyses should be carried out (Orians & Wittenberger, 1991; Manly et al., 2002; Graf et al., 2005). It also possible that the cheetahs appear to be grassland specialists because 1- searching effort might be higher in grassland, 2- the woodlands are not always accessible and 3- cheetahs are less visible and more difficult to detect in the denser vegetation (Caro, 1994; Mills et al., 2004).
36
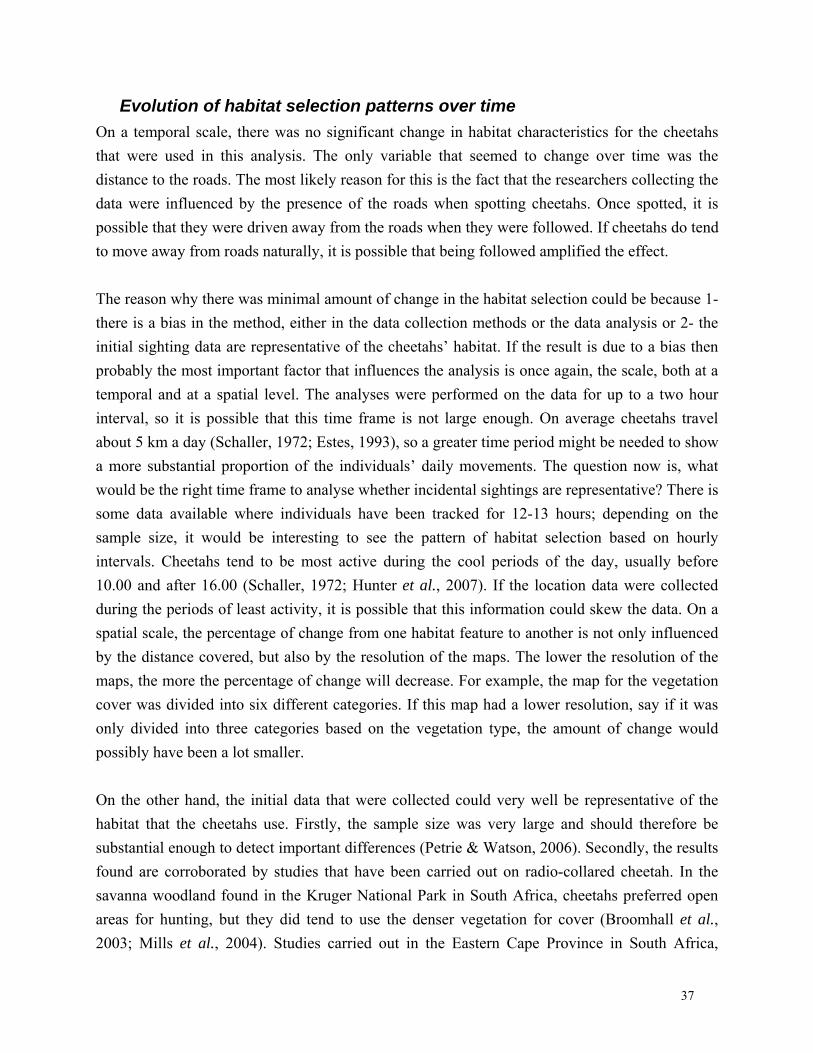
Evolution of habitat selection patterns over time On a temporal scale, there was no significant change in habitat characteristics for the cheetahs that were used in this analysis. The only variable that seemed to change over time was the distance to the roads. The most likely reason for this is the fact that the researchers collecting the data were influenced by the presence of the roads when spotting cheetahs. Once spotted, it is possible that they were driven away from the roads when they were followed. If cheetahs do tend to move away from roads naturally, it is possible that being followed amplified the effect. The reason why there was minimal amount of change in the habitat selection could be because 1- there is a bias in the method, either in the data collection methods or the data analysis or 2- the initial sighting data are representative of the cheetahs’ habitat. If the result is due to a bias then probably the most important factor that influences the analysis is once again, the scale, both at a temporal and at a spatial level. The analyses were performed on the data for up to a two hour interval, so it is possible that this time frame is not large enough. On average cheetahs travel about 5 km a day (Schaller, 1972; Estes, 1993), so a greater time period might be needed to show a more substantial proportion of the individuals’ daily movements. The question now is, what would be the right time frame to analyse whether incidental sightings are representative? There is some data available where individuals have been tracked for 12-13 hours; depending on the sample size, it would be interesting to see the pattern of habitat selection based on hourly intervals. Cheetahs tend to be most active during the cool periods of the day, usually before 10.00 and after 16.00 (Schaller, 1972; Hunter et al., 2007). If the location data were collected during the periods of least activity, it is possible that this information could skew the data. On a spatial scale, the percentage of change from one habitat feature to another is not only influenced by the distance covered, but also by the resolution of the maps. The lower the resolution of the maps, the more the percentage of change will decrease. For example, the map for the vegetation cover was divided into six different categories. If this map had a lower resolution, say if it was only divided into three categories based on the vegetation type, the amount of change would possibly have been a lot smaller. On the other hand, the initial data that were collected could very well be representative of the habitat that the cheetahs use. Firstly, the sample size was very large and should therefore be substantial enough to detect important differences (Petrie & Watson, 2006). Secondly, the results found are corroborated by studies that have been carried out on radio-collared cheetah. In the savanna woodland found in the Kruger National Park in South Africa, cheetahs preferred open areas for hunting, but they did tend to use the denser vegetation for cover (Broomhall et al., 2003; Mills et al., 2004). Studies carried out in the Eastern Cape Province in South Africa,
37
Matusadona National Park in Zimbabwe and on the Namibian farmlands found similar results (Purchase & du Toit, 2000; Marker, 2002; Bissett & Bernard, 2007). The fact that, for this study, the initial sighting data are indeed indicative of the actual habitat that is used by the cheetahs, allows the analysis on the habitat selection to be expanded to give a deeper understanding of the underlying processes. For example, factors such as the sex and age of individuals could play a very important role in the process of habitat selection. Several studies have found that female cheetahs tend to include more thicket vegetation into their home-range than do male coalitions (Broomhall et al., 2003; Bissett & Bernard, 2007). This is possibly because increased vegetation cover decreases the chance of cub predation. Lactating females are more restricted in their movement so this too could have a significant impact on the habitat that is utilised (Laurenson, 1995a; Durant, 1998). Male cheetahs have the opportunity to hold territories which means that habitat selection will be restricted by its location (Caro & Collins, 1987; Morris, 1992). It is therefore likely that habitat selection is influenced more by the presence of intraspecific competition, so the general habitat use would be very different to that of non-territorial cheetahs. It would also be interesting to analyse to what extent habitat selection changes temporally, both on a small scale (daily) and on a larger scale (seasonally). As mentioned earlier, cheetahs are usually active during the day and tend to be found in denser cover in the heat of the day, the cooler periods bring them out into more open vegetation where they are more likely to hunt. On a seasonal scale, cheetahs are seen to follow the Thomson’s gazelle Gazelle thomsoni migrations during the wet season (Durant et al., 1988), so it would be interesting to see how this effects the selection of other habitat factors.
Conclusion Habitat models are often extrapolated beyond the study area (Kearney, 2006), however doing this could provide unreliable results. The analysis carried out on the Serengeti cheetah population may not be indicative of the rest of its range mainly because the values obtained are highly dependent on the background information. When these values change, the results are no longer representative. Although this type of analysis appears to have its limitations, it is a useful tool to compare habitat selection of different species in the same area, or to document changes on a larger temporal scale e.g. seasonally or annually. Especially for long term studies, such as those being carried out by the Serengeti Cheetah Project, this analysis could detect slow or subtle changes in habitat selection, on for example, the long term effects of climate change and habitat fragmentation (Morrison et al., 2006). This is a process that can be applied to a range of species. By having a better understanding of the habitat selection patterns and realising which features
38
increase a species’ viability, it becomes a powerful tool that can aid decisions in the areas of both wildlife management and conservation.
Acknowledgements This study was carried out in fulfilment of the Wild Animal Biology MSc degree at the Royal Veterinary College and the Zoological Society of London. The authors would like to thank the Serengeti Cheetah Project for allowing access to the cheetah database. We would also like to acknowledge the Tanzania National Parks (TANAPA), the Tanzania Wildlife Research Institute (TAWIRI) and the Frankfurt Zoological Society (FZS) who supported the collection and dissemination of the GIS data on the Serengeti-Mara and the Food and Agricultural Organisation of the United Nations (FAO) for allowing access to the GIS maps of the Tanzanian vegetation. In addition we would like to thank Alexandre Hirzel for his help with the Biomapper software.
39
References Araújo, M. B. & Williams, P. H. (2000) Selecting areas for species persistence using
occurrence data. Biological Conservation, 96, 331-345. Bissett, C. & Bernard, R. T. F. (2007) Habitat selection and feeding ecology of the
cheetah (Acinonyx jubatus) in thicket vegetation: is the cheetah a savanna specialist? Journal of Zoology, 271, 310 - 317.
Broomhall, L. S., Mills, M. G. L. & Du Toit, J. T. (2003) Home range and habitat use by cheetahs (Acinonyx jubatus) in the Kruger National Park. Journal of Zoology, 261, 119 - 128.
Brotons, L., Thuiller, W., Araujo, M. B. & Hirzel, A. H. (2004) Presence-absence versus presence-only modelling methods for predicting bird habitat suitability. Ecography, 27, 437-448.
Caro, T. M. (1994) Cheetah of the Serengeti: Group living in an asocial species The University of Chicago Press, Chicago.
Caro, T. M. & Collins, D. A. (1987) Ecological characteristics of territories of male cheetahs (Acinonyx jubatus). Journal of Zoology, 211, 89-105.
Carroll, C., Zielinski, W. J. & Noss, R. F. (1999) Using presence-absence data to build and test spatial habitat models for the fisher in the Klamath region, U.S.A. Conservation Biology, 13, 1344-1359.
Chefaoui, R. M., Hortal, J. & Lobo, J. M. (2005) Potential distribution modelling, niche characterization and conservation status assessment using GIS tools: A case study of Iberian Copris species. Biological Conservation, 122, 327-338.
Durant, S. M. (1998) Competition refuges and coexistence: An example from Serengeti carnivores. The Journal of Animal Ecology, 67, 370 - 386.
Durant, S. M., Bashir, S., Maddox, T. & Laurenson, M. K. (2007) Relating long-term studies to conservation practice: The case of the Serengeti Cheetah Project. Conservation Biology, 21, 602-611.
Durant, S. M., Caro, T. M., Collins, D. A., Alawi, R. M. & FitzGibbon, C. D. (1988) Migration patterns of Thomson's gazelles and cheetahs on the Serengeti Plains. African Journal of Ecology, 26, 257 - 268.
Eaton, R. L. (1974) The cheetah: The biology, ecology, and behavior of an endangered species. Van Nostrand Reinhold, New York.
Engler, R., Guisan, A. & Rechsteiner, L. (2004) An improved approach for predicting the distribution of rare and endangered species from occurrence and pseudo-absence data. Journal of Applied Ecology, 41, 263-274.
Estes, R. D. (1993) The safari companion: A guide to watching African mammals. Chelsea Green Publishing, Vermont.
Graf, R. F., Bollmann, K., Suter, W. & Bugmann, H. (2005) The importance of spatial scale in habitat models: Capercaillie in the Swiss alps. Landscape Ecology, 20, 703-717.
Gros, P. M. & Rejmánek, M. (1999) Status and habitat preferences of Uganda cheetahs: An attempt to predict carnivore occurrence based on vegetation structure Biodiversity and Conservation, 8, 1561 - 1583.
40
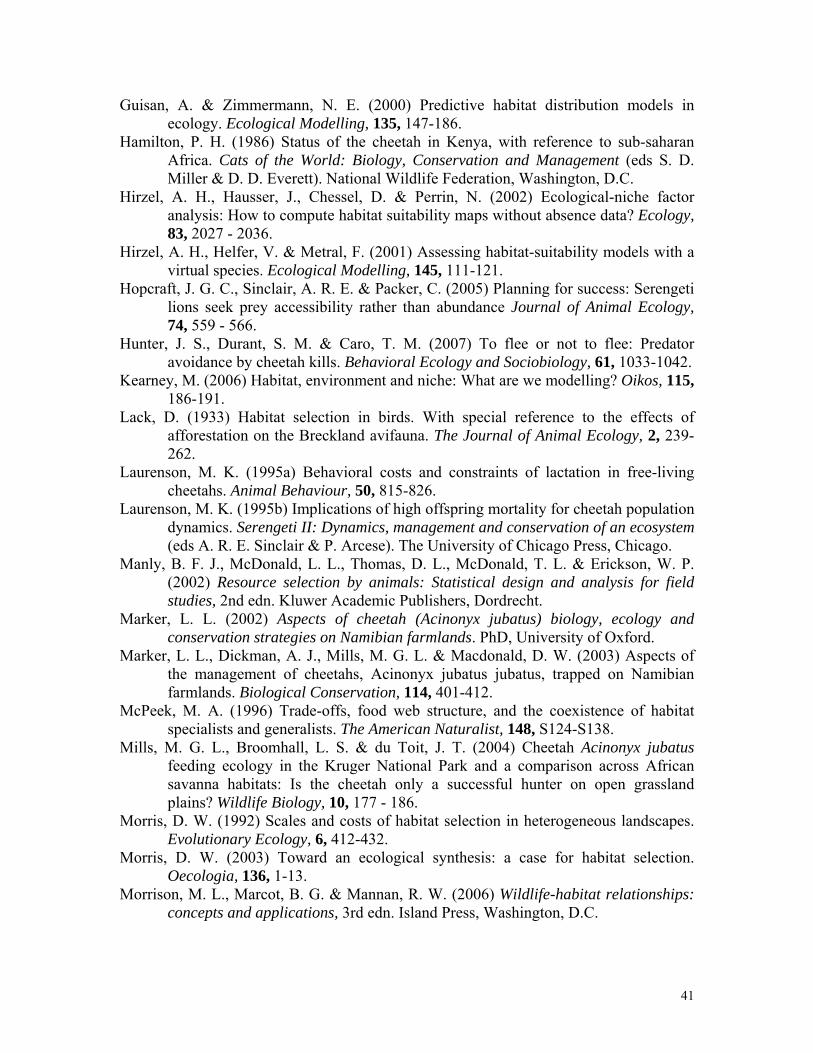
Guisan, A. & Zimmermann, N. E. (2000) Predictive habitat distribution models in ecology. Ecological Modelling, 135, 147-186.
Hamilton, P. H. (1986) Status of the cheetah in Kenya, with reference to sub-saharan Africa. Cats of the World: Biology, Conservation and Management (eds S. D. Miller & D. D. Everett). National Wildlife Federation, Washington, D.C.
Hirzel, A. H., Hausser, J., Chessel, D. & Perrin, N. (2002) Ecological-niche factor analysis: How to compute habitat suitability maps without absence data? Ecology, 83, 2027 - 2036.
Hirzel, A. H., Helfer, V. & Metral, F. (2001) Assessing habitat-suitability models with a virtual species. Ecological Modelling, 145, 111-121.
Hopcraft, J. G. C., Sinclair, A. R. E. & Packer, C. (2005) Planning for success: Serengeti lions seek prey accessibility rather than abundance Journal of Animal Ecology, 74, 559 - 566.
Hunter, J. S., Durant, S. M. & Caro, T. M. (2007) To flee or not to flee: Predator avoidance by cheetah kills. Behavioral Ecology and Sociobiology, 61, 1033-1042.
Kearney, M. (2006) Habitat, environment and niche: What are we modelling? Oikos, 115, 186-191.
Lack, D. (1933) Habitat selection in birds. With special reference to the effects of afforestation on the Breckland avifauna. The Journal of Animal Ecology, 2, 239-262.
Laurenson, M. K. (1995a) Behavioral costs and constraints of lactation in free-living cheetahs. Animal Behaviour, 50, 815-826.
Laurenson, M. K. (1995b) Implications of high offspring mortality for cheetah population dynamics. Serengeti II: Dynamics, management and conservation of an ecosystem (eds A. R. E. Sinclair & P. Arcese). The University of Chicago Press, Chicago.
Manly, B. F. J., McDonald, L. L., Thomas, D. L., McDonald, T. L. & Erickson, W. P. (2002) Resource selection by animals: Statistical design and analysis for field studies, 2nd edn. Kluwer Academic Publishers, Dordrecht.
Marker, L. L. (2002) Aspects of cheetah (Acinonyx jubatus) biology, ecology and conservation strategies on Namibian farmlands. PhD, University of Oxford.
Marker, L. L., Dickman, A. J., Mills, M. G. L. & Macdonald, D. W. (2003) Aspects of the management of cheetahs, Acinonyx jubatus jubatus, trapped on Namibian farmlands. Biological Conservation, 114, 401-412.
McPeek, M. A. (1996) Trade-offs, food web structure, and the coexistence of habitat specialists and generalists. The American Naturalist, 148, S124-S138.
Mills, M. G. L., Broomhall, L. S. & du Toit, J. T. (2004) Cheetah Acinonyx jubatus feeding ecology in the Kruger National Park and a comparison across African savanna habitats: Is the cheetah only a successful hunter on open grassland plains? Wildlife Biology, 10, 177 - 186.
Morris, D. W. (1992) Scales and costs of habitat selection in heterogeneous landscapes. Evolutionary Ecology, 6, 412-432.
Morris, D. W. (2003) Toward an ecological synthesis: a case for habitat selection. Oecologia, 136, 1-13.
Morrison, M. L., Marcot, B. G. & Mannan, R. W. (2006) Wildlife-habitat relationships: concepts and applications, 3rd edn. Island Press, Washington, D.C.
41
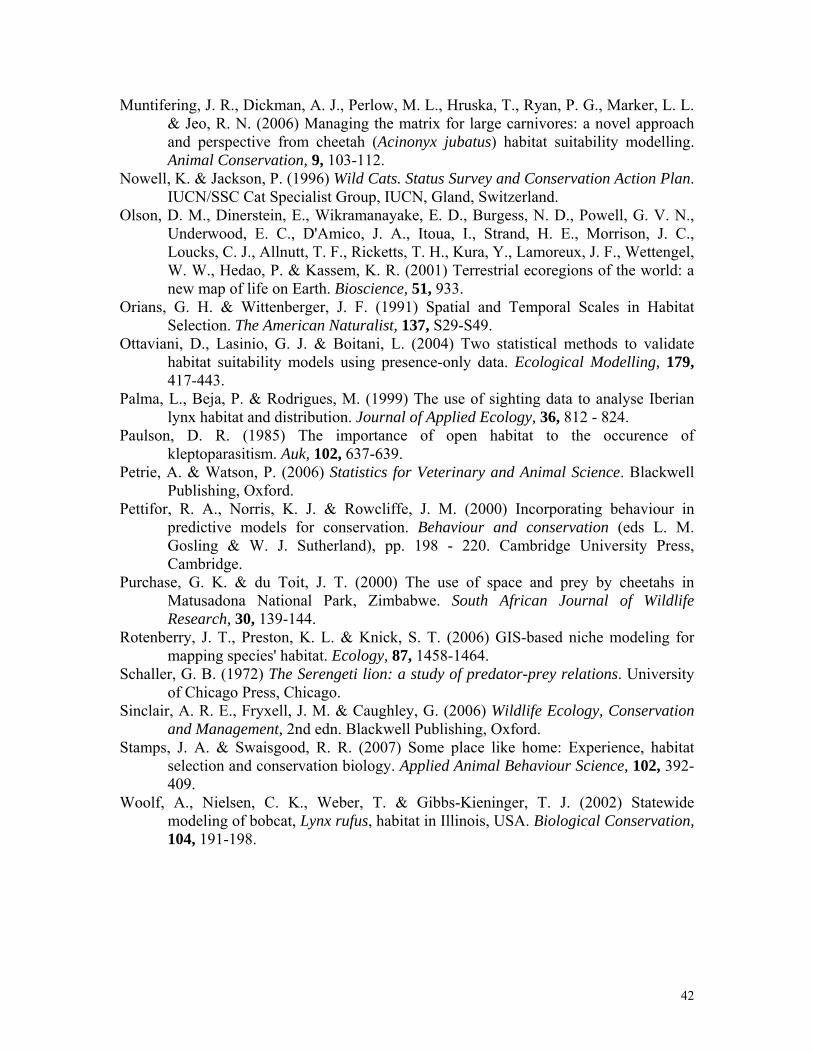
Muntifering, J. R., Dickman, A. J., Perlow, M. L., Hruska, T., Ryan, P. G., Marker, L. L. & Jeo, R. N. (2006) Managing the matrix for large carnivores: a novel approach and perspective from cheetah (Acinonyx jubatus) habitat suitability modelling. Animal Conservation, 9, 103-112.
Nowell, K. & Jackson, P. (1996) Wild Cats. Status Survey and Conservation Action Plan. IUCN/SSC Cat Specialist Group, IUCN, Gland, Switzerland.
Olson, D. M., Dinerstein, E., Wikramanayake, E. D., Burgess, N. D., Powell, G. V. N., Underwood, E. C., D'Amico, J. A., Itoua, I., Strand, H. E., Morrison, J. C., Loucks, C. J., Allnutt, T. F., Ricketts, T. H., Kura, Y., Lamoreux, J. F., Wettengel, W. W., Hedao, P. & Kassem, K. R. (2001) Terrestrial ecoregions of the world: a new map of life on Earth. Bioscience, 51, 933.
Orians, G. H. & Wittenberger, J. F. (1991) Spatial and Temporal Scales in Habitat Selection. The American Naturalist, 137, S29-S49.
Ottaviani, D., Lasinio, G. J. & Boitani, L. (2004) Two statistical methods to validate habitat suitability models using presence-only data. Ecological Modelling, 179, 417-443.
Palma, L., Beja, P. & Rodrigues, M. (1999) The use of sighting data to analyse Iberian lynx habitat and distribution. Journal of Applied Ecology, 36, 812 - 824.
Paulson, D. R. (1985) The importance of open habitat to the occurence of kleptoparasitism. Auk, 102, 637-639.
Petrie, A. & Watson, P. (2006) Statistics for Veterinary and Animal Science. Blackwell Publishing, Oxford.
Pettifor, R. A., Norris, K. J. & Rowcliffe, J. M. (2000) Incorporating behaviour in predictive models for conservation. Behaviour and conservation (eds L. M. Gosling & W. J. Sutherland), pp. 198 - 220. Cambridge University Press, Cambridge.
Purchase, G. K. & du Toit, J. T. (2000) The use of space and prey by cheetahs in Matusadona National Park, Zimbabwe. South African Journal of Wildlife Research, 30, 139-144.
Rotenberry, J. T., Preston, K. L. & Knick, S. T. (2006) GIS-based niche modeling for mapping species' habitat. Ecology, 87, 1458-1464.
Schaller, G. B. (1972) The Serengeti lion: a study of predator-prey relations. University of Chicago Press, Chicago.
Sinclair, A. R. E., Fryxell, J. M. & Caughley, G. (2006) Wildlife Ecology, Conservation and Management, 2nd edn. Blackwell Publishing, Oxford.
Stamps, J. A. & Swaisgood, R. R. (2007) Some place like home: Experience, habitat selection and conservation biology. Applied Animal Behaviour Science, 102, 392-409.
Woolf, A., Nielsen, C. K., Weber, T. & Gibbs-Kieninger, T. J. (2002) Statewide modeling of bobcat, Lynx rufus, habitat in Illinois, USA. Biological Conservation, 104, 191-198.
42
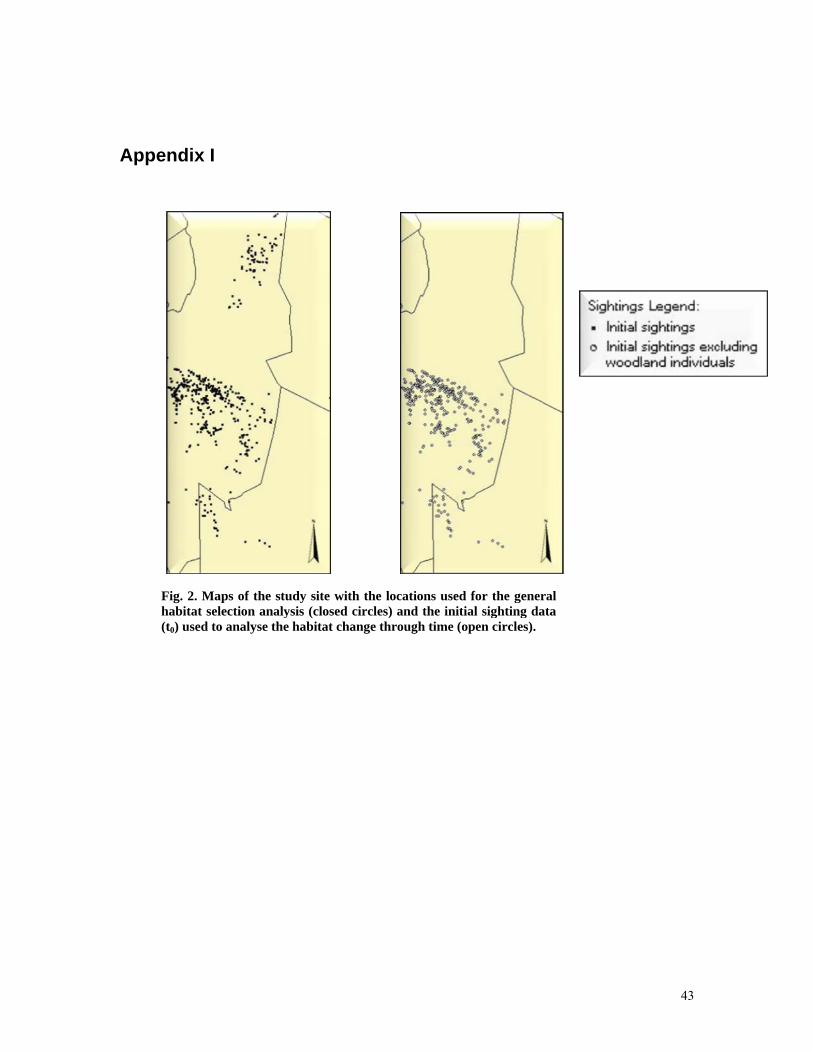
Appendix I
Fig. 2. Maps of the study site with the locations used for the generalhabitat selection analysis (closed circles) and the initial sighting data(t0) used to analyse the habitat change through time (open circles).
43
Fig. 3. A map of the study site illustrating the different ecoregions in relation to the locations used for the general habitat selection analysis
Fig. 3. A map of the study site illustrating the different landform features in relation to the cheetah locations used for the general habitat selection analysis
44
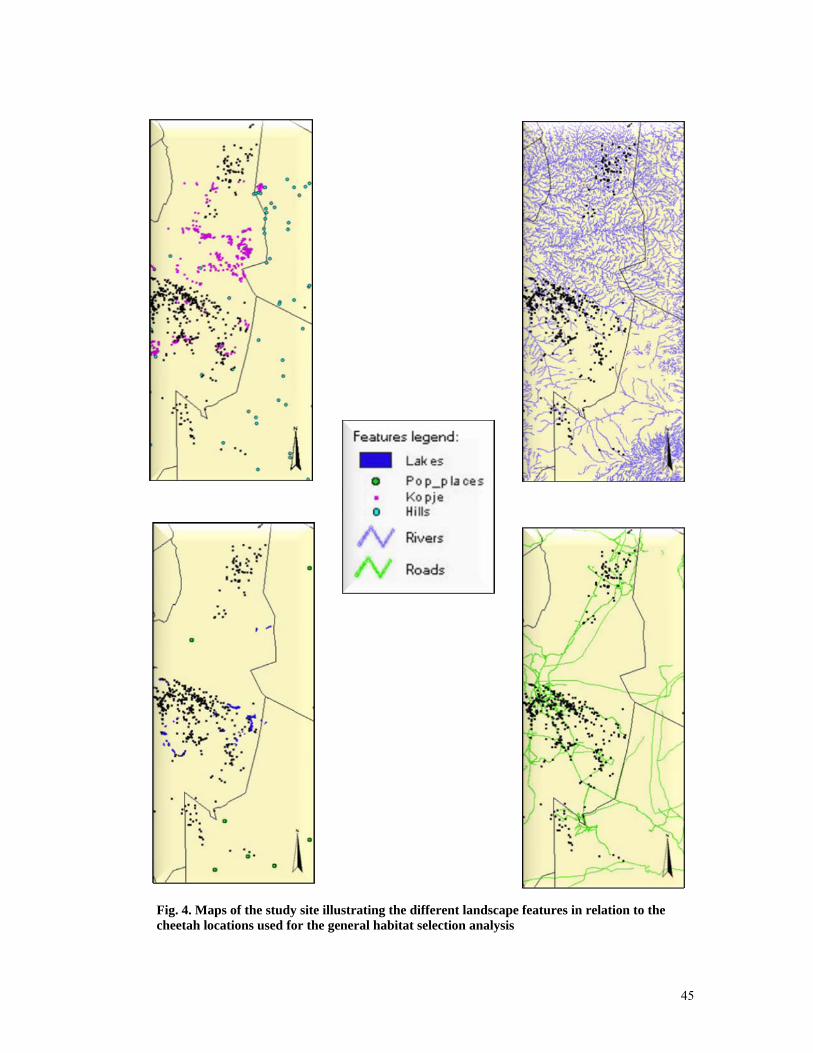
Fig. 4. Maps of the study site illustrating the different landscape features in relation to the cheetah locations used for the general habitat selection analysis
45
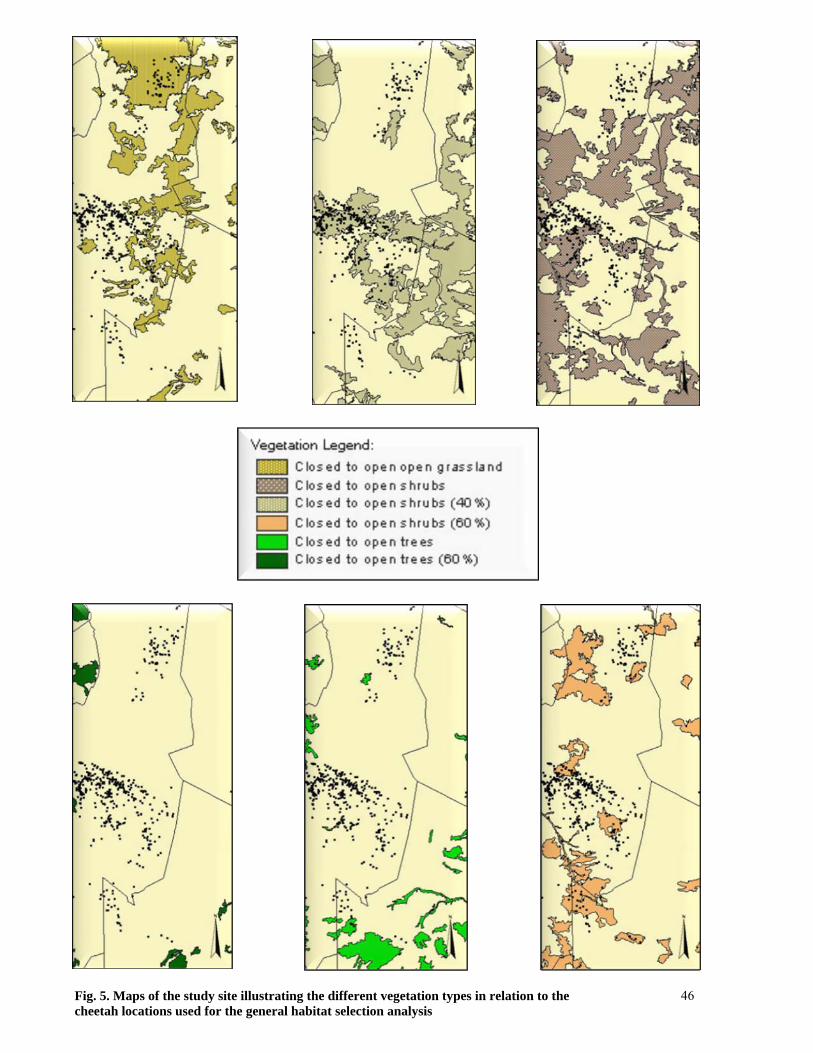
Fig. 5. Maps of the study site illustrating the different vegetation types in relation to the cheetah locations used for the general habitat selection analysis
46