research article genetic algorithm application in...
TRANSCRIPT
Research ArticleGenetic Algorithm Application in Optimization ofWireless Sensor Networks
Ali Norouzi and A Halim Zaim
Computer Engineering Department Istanbul University 34320 Istanbul Turkey
Correspondence should be addressed to Ali Norouzi norouzicscrsituedutr
Received 31 August 2013 Accepted 19 November 2013 Published 16 February 2014
Academic Editors T Chen Q Cheng and J Yang
Copyright copy 2014 A Norouzi and A H Zaim This is an open access article distributed under the Creative Commons AttributionLicense which permits unrestricted use distribution and reproduction in any medium provided the original work is properlycited
There are several applications known for wireless sensor networks (WSN) and such variety demands improvement of the currentlyavailable protocols and the specific parameters Some notable parameters are lifetime of network and energy consumption forrouting which play key role in every application Genetic algorithm is one of the nonlinear optimization methods and relativelybetter option thanks to its efficiency for large scale applications and that the final formula can bemodified by operatorsThe presentsurvey tries to exert a comprehensive improvement in all operational stages of aWSN including node placement network coverageclustering and data aggregation and achieve an ideal set of parameters of routing and application based WSN Using geneticalgorithm and based on the results of simulations in NS a specific fitness function was achieved optimized and customized for allthe operational stages of WSNs
1 Introduction
WSNs are constituted of small sensors with specializedapplications and limitations designed for specific purposesThe applications are divided into military commercial andmedical applications Among military applications are com-munication command and intelligence defense networksHealth care system for disables in remote areas smartenvironment for the elderly physicians and medical staffcommunication networks and patient surveillance systemsare some of medical applications Moreover there is awide range of commercial applications including securitysystems fire safety systems environment pollution monitorsystems (chemicalmicrobial and nuclear pollutions) vehicletracking supervising and controlling systems traffic con-trol system and natural disasters studies (eg earthquakeand flood) [1] Wide range of applications has resulted indevelopment of variety of protocols which include plenty offlexible parameters At any rate some parameters due to theirwide range of utilization can be found in several applications(as common parameters) and of great importance Wirelesssensor networks use mobile energy sources and rechargeablebatteries and due to technological limitations these batteriescan supply energy for a short period of time Thus optimum
utilization of energy in such networks is of great importance[2]
Necessity of data integrity in WNSs due to supportcontinuous and permanent communication among the sen-sors has made the lifetime another important parameter inWSNs The present study surveys some specific parametersthroughout different operational stages of WSNs In generaloperational stages of classic WSNs are divided into nodeplacement network coverage clustering and data aggrega-tion Figure 1(a) pictures general classification of the mainoperational stages of WSNs
An important stage before establishment of a WSN isldquonode placementrdquo Generally there are several types of nodedistributions in WSNs including regular random and griddistributions Under grid layout the distance between eachnode can be estimated An example of grid layout is picturedin Figure 1(b) and clearly the gap between the nodes is fixed
The decision about type of layout depends on theexpected application so that nodes for military purposes areusually scattered by airplanes over military zones while incase of underwater sensors regular distribution is adoptedand grid layouts are usually used for urban networks(Figure 1(b))
Hindawi Publishing Corporatione Scientific World JournalVolume 2014 Article ID 286575 15 pageshttpdxdoiorg1011552014286575
2 The Scientific World Journal
Network coverage
Node placement
Clustering
Data aggregationand routing
(a)
7 8 9 10 11
12
13
14
15
16171819201
2
3
4
5 24 25 26 27
2823
22
21 32 31 30
34 35
33 36 29
6
1 m
5 m
(b)
Sink
(c)
InternetSink
CRCT
Cluster
80211
CH1
CH2
CH3
(d)
201510
50
CPU TA RX
Pow
er (m
W)
Sensor Idle Sleep
Radio
(e)
Figure 1 (a) Main operatioanl stages of WSNs (b) Grid layout of WSN (c) Network coverage stage (d) Clustering in WSNs (e) Energyconsumption in different states of WSNs
Poissonrsquos distribution is useful for modeling differenttypes of random phenomena it generates an estimate ofbinomial probabilities In addition to an estimator distribu-tion Poissonrsquos distribution is a useful probability model forthe events that happen randomly whether in time or placeThe distribution is usually used for detailed study on andsimulation of wireless networks
Thenext stage is to connect the sensors based on the rangeof service As mentioned before among different featuresof sensors radio range and service domain are key factorsTaking into account the required area coverage the bestlayout must be adopted to reach the best quantity and quality
of the services Ineffective layout means waste of energy andfinancial resources
Clustering is another main operation which plays a keyrole inWSNoptimization By clustering the sensor nodes aredivided into groups known as division cluster Each clusterhas a cluster head that aggregates data from the nodes inthe cluster and forwards the data to the sink directly orstep by step using other clustersrsquo heads Therefore the nodesmay reduce their communication heading comparedwith thesituationwhen data are forwarded directly to the sinkThat isclustering is an effective approach to attenuate load betweensensor nodes
The Scientific World Journal 3
Figure 1(d) illustrates nodes clustering in WSNs Cluster-ing is a way to save more energy and increase lifetime of thesensors in WSNs The technique also has other advantagessuch as improved security less extra data and improvedscalability of the network To achieve better performancedifferent protocols can be used depending on the application
Babamir and Norouzi proposed an efficient aggregatesigncryption scheme to maximize the security of data in akind of wireless medical network named the disconnectedor unattended wireless sensor network [3] Also in otherwork they proposed another new secure scheme in whichvarious security goals such as confidentiality authenticationand integrity In addition the aggregation process of theirscheme reduces the space and communication overheadsboth for sensors and sinkThe proposed technique efficientlyenables the sensors and sinks to protect verify and recoverall the related data [4]
The protocols are reliable ways to increase lifetime ofthe networks although they cause more energy consumptionby the cluster heads Therefore to increase lifetime of thenetwork cluster heads must be reelected during each periodof cluster layout In spite of the fact that the protocols ensureimplementation of an effective clustering algorithm they failto guarantee adoption of the best node as cluster head
Through optimization the algorithms may attenuateenergy consumption to a great extent and consequentlyimprove efficiency and lifetime lifetime of the network
Eventually the transfer of data and queries betweenthe main stations information sinks or events is anotherimportant issue in WSNs A simple process for transfer ofdata is the direct transfer of data between the node andbase station The single-step oriented process is too costlythe more the distance between the node and base stationthe more energy is needed and consequently the shorter thelifetime of the network
Another process for transfer of data is multistep orientedtransfer for a specific radius This process saves considerabledeal of energy and lessens collision in the network to agreat deal although depending on the place of using routingmechanisms they have some limitations
Main reason that makes researchers more interested inthe issue data gathering and routing stages is the considerableenergy consumed at this stage Figure 1(e) pictures requiredenergy in every states of theWSN Clearly the highest energyconsumption is by radio communication Therefore moredetailed studies on this stage hold great promises to optimizeWSN concerning energy consumption and lifetime of thenetwork [2 5 6]
Improvement of the parameters mentioned above even-tuates in an optimized WSN There are variety of methodsto this end such as fuzzy theory neural networks andevolutionary algorithm and thanks to its better results forlarger scale networks and the fact that it generates finalformula at the end genetic algorithm is more common Theavailability of final formula makes the algorithmmore usefuland helpful for human users Thus the present study usesgenetic algorithm for optimization and customization of thenetworks [7]
This paper is organized as follows Section 2 gives a briefdescription of genetic algorithm Sections 3 4 5 and 6 presentour proposed fitness function in node placement networkcoverage clustering data aggregation and details of algo-rithms respectively Finally Section 7 presents conclusionsand suggestions for future projects
2 Genetic Algorithm
Also known as a global heuristic algorithm a genericalgorithm estimates an optimal solution through generatingdifferent individuals [8] Focused fitness function is one ofprocedures of the algorithm Following section describes thefundamental parts of a generic algorithm Figure 2(a) indi-cates the general scheme of genetic algorithm mechanism
21 Initialization The genetic algorithm starts with an ele-mentary population comprised of random chromosomeswhich includes genes with a sequence of 0 s or 1 s Afterwardthe algorithm leads individuals to achieve an optimum solu-tion by the way of repetitive processes including crossoverand selection operators There are two ways to develop a newpopulation [9] steady-state GA and generational GA In thecase of the former one or two members in the population arereplaced and at the same time the generational GA replacesall the generated individuals of a generation
22 Fitness Under the genetic algorithm the fitness func-tion by definition is a process for scoring each chromosomebased on their qualification The assigned score is a traitfor continuation of further reproduction Dependence toproblem by the fitness function is considerable so thatin case of some problems it is not possible to define theproblemNaturally individuals are permitted to go to the newgeneration based on their fitness score Therefore the scoredictates the fate of individuals
23 Selection During every successive generation a newgeneration is developed through adopting members of thecurrent generation to mate on the bases of their fitnessThe individuals with higher fitness score have higher chancefor being selected the process which results in preferentialadoption of the best solution Majority of the functionsinclude a stochastically designed element for adopting smallnumber of less fit individuals for sake of keeping diversityin the population [10] Among the many selection methodsRoulette-Wheel is adopted to differentiate proper individualswith the probability of
119875119894=
119865119894
sum119899
119895=1119865119894
(1)
where 119865119894and ldquo119899rdquo are the fitness chromosome and the size
of population respectively According to the Roulette-Wheeleach individual is assigned a value between 0 and 1
24 Crossover The crossover or reproduction process con-stitutes the major step toward production Indeed sexual
4 The Scientific World Journal
Crea
te in
itial
gen
eration
YesNo
Outputfitness
Modifyscripts
Convergesimulation
Drawmesh
SpecifyInitializeproblem
Run fitness function for each
individual and generation
Initi
alize
GA Fitness and generation
requirements met
BCs
Output best individual and fitness value
Fitnessfunction
Crossover and mutate new generation
(a)
Parents Children
First 101101 uarr 01101101 011110 uarr 10001011
Second 101101 uarr 10001011 011110 uarr 01101101
(b)
Figure 2 (a) The general scheme of GA mechanism (b) Single point method at random point 6
reproductive process by wich inherited characteristics aretransferred from one generation to the next generationissimulated In the reproduction process crossover processadopts a couple of individuals as the parents throughbreedingselection process The process continues to reach the desiredsize in the new population Generally several crossoveroperations take place each of which with different aims Theeasiest way is single point where a randompoint is adopted todivide the role of the patents One example of mating by twochromosomes in single point way is pictured in Figure 2(a)
Figure 2(b) represents two children that are from a singleset of parentsThe bit sequence of the offspring duplicates oneparentrsquos bit sequence until the crossover point Afterward thebit sequence of the other parent is replicated as the secondpart of children
25 Fitness Parameters in Wireless Sensor Network The fit-ness of a chromosome determines the extent to which theconsumption of energy is minimized and coverage is maxi-mized In what follows some important fitness parameters inWSN are discussed
(1) Direct distance to base station (DDBS) it refers to thesum of direct distance between all sensornodes and the BSrepresented by 119889
119894as
DDBS =
119898
sum
119894=1
119889119894 (2)
where ldquo119898rdquo stands for the number of nodes Clearly consump-tion of energy reasonably is subject to the number of nodes
and for large WSN the energy is extreme Moreover DDBS isacceptable for smaller networks where number of close nodesis not considerable
(2) Cluster based distance (CD) The total CHs and BSdistances and the sumof the distance between the determinedmember nodes and their cluster heads (3)
CD = (
119899
sum
119894=1
(
119898
sum
119895=1
119889119894119895) + 119863
119894119904) (3)
where ldquo119899rdquo and ldquo119898rdquo stand for the number of clusters andrelated members respectively ldquo119889
119894119895rdquo represents the distance
between a node and its CH and ldquo119863119894119904rdquo stand for distance
between the CH and the BS The solution suits networkswith a large number of widely-spaced nodes Higher clusterdistance leads to higher energy consumption For minimiza-tion of energy consumption the CD must not be too large[11] The density of the clusters is controlled by adopting thismeasurement while density is the count of nodes in eachcluster
(3) Cluster-based distance-standard CDSD instead of anaverage cluster distance standard derivation measures thechanges of distances of the cluster CDSD is a function of theplacement of sensor nodes (random or deterministic) Thereare clusters with different sizes in random placement so thata SD within a specified variation in the cluster distance isacceptable If so the differences in cluster distance is not zerowhile the variationmust be adopted based on the deploymentof information [12] At any rate under deterministic place-ment with uniform distribution of node positions cluster
The Scientific World Journal 5
distance change must be minimized Generally changes ofuniform cluster-based distances show that the network ispoor which is not the case when the nodes are placedrandomly
120583 =sum119899
119894=1119889119888
119899
SD = radic
119899
sum
119894=1
(120583 minus 119889119888)2
(4)
ldquo120583rdquo in equations (4) stands for the average of the clusterdistances which is the standard SD formula for obtainingcluster distance variation
(4) Transfer energy (119864) it stands for the amount ofconsumed energy required for transferring all the collecteddata to the BS Let ldquo119898rdquo be the number of associated nodes ina cluster then 119864 is obtained by
119864 =
119899
sum
119894=1
(
119898
sum
119895=1
119890119895119898
+ 119898 lowast 119864119877+ 119890119894) (5)
where ldquo119890119895119898rdquo stands for the required energy to transfer data
from a node to the corresponding CH Thus the first termin the summation of ldquo119894rdquo stands for the total consumption ofenergy for transfer of aggregated data to CHs Moreover thesecond term in the summation ldquo119894rdquo pictures the total requiredenergy to collect data from members and finally ldquo119890
119894rdquo stands
for the required energy for transmission from the cluster headto the BS
(5) Number of transmissions (119879) in general the BSdictates the number of transmissions that occurs at everymonitoring period This measure is obtained based on theconditions and the energy level of the network thereforeldquo119879rdquo stands for a long time stage for which the superioroptimumsolution formaximizing and an inferior solution forminimization are acceptable The quality of the best solutionor chromosome determines the performance of previousGA-based solutions
In what follows using genetic algorithm a fitness func-tion formula to improve each main operational aspects ofWSNs (eg node placement network coverage clusteringand data aggregation) is introduced and discussed In otherwords fitness functions are mainly used to improve energyconsumption and lifetime parameters Simulation resultsconfirmed improvement of the protocols
3 Node Placement in Wireless Sensor Network
The placement of sensor nodes on a monitored field mayinfluence the general performance of the network Takinginto account the placement of nodes in the field there arethree main categories of placement of nodes in a networkincluding the deterministic node placement (grid) the semi-deterministic node placement (eg Biased Random) and thenondeterministic (stochastic) node placement (eg SimpleDiffusion and Random) Long range transmission by sensornodes is not energy efficient as it needs more energy than
a linear function of transmission distance does Clearlynode density is just one element in network topology as theplacement of the node is another key factor The placementof nodes influences the capacity of a network to correctlysense an event as well as the number of possible disjoint pathstowards the sink(s)
Under the deterministic node placement the nodes areplaced on exact preset points on a grid or in specificparts of the grid Commonly deterministic or controllednode placement dictates the type of nodes the environmentthat nodes will be placed and the application Thus inSensor Indoor Surveillance Systems or Building Monitoringapplication nodes must be placedmanually [13] Under semi-deterministic placement on the other hand individual nodesare positioned in a nondeterministic way on the grid (egrandom) which covers the areas nodes must be spread Thatis microscopic and macroscopic ways of placement of nodesare nondeterministic and deterministic respectively
To make sure that network runs with the highest feasibleperformance the nodes are positioned on the campus net-work Along with balanced energy consumption of all nodesa preferred node placement protocol is supposed to supply abetter network throughput through attenuating contention ofchannel and collision of packet under high load An instanceof a node placement scheme is pictured in Figure 3(a)
The common advantages of proper sensor propagation inWSNs are listed below [14]
Scalability A high number of nodes can be deployed in thenetwork this is suitable when transmissions between thenodes are not unlimited
Collision Reduction Since the cluster head (CH) functions asa coordinator a limited number of nodes gain access to thechannel and cluster members and head communicate locally
Energy EfficiencyHigh energy consumption is a consequenceof the periodic relocation Still duties of CH may be dis-tributed among all other nodes through periodic relocationwhich results in lower energy consumption
Low Cost The excess costs can be avoided by deployingsensors at proper locations
Routing Backbone The data collected by cluster membersare aggregated in CH and sent to the sink Thus using alittle route-thru traffic and routing backbone with enoughefficiency one can build the network
31 Problem Statement Among themain aspects of improve-ment of performance for wireless sensor networks nodeplacement is one to name Here we discuss layout optimiza-tion of wireless sensor networks (WNNs) All the sensornodes located in the environment should have a connectionwith high energy level nodes For transmitting aggregateddata the nodes relay from environment to base or ground toa satellite Sensor nodes are not efficient choice for long-termtransmission as their energy consumption is a super linearfunction of the distance the data that is transmitted
6 The Scientific World Journal
(a)
250
200
150
100
50
0
510
24
417
39
345
58
312
01
233
21
158
18
138
46
115
48
058
26
038
18
023
51
000
00
Time
Live sensorsLive packets
Received packets
(b)
000
00
009
59
039
15
038
18
051
49
104
42
115
48
129
42
145
28
158
18
225
13
240
23
312
01
330
17
357
28
417
39
434
49
537
27
Thou
sand
s
908580757065605550454035302520151050
Power
(c)
Figure 3 (a)Node placement scheme (b) Comparison between number of available sensors live and received packets existing in the network(c) Comparison between mount of power and lifetime of network
In this part we assume that communication range ofthe sensor is fixed and the new Intelligent Node Place-ment Protocol in Wireless Sensor Networks using genericalgorithm is introduced The two competing objectivesmdashtotal sensor coverage and lifetime of the network are
optimized in the proposed framework for WSNs Thanks tothe genetic algorithm the proposed approach results in asolution where the sensing range is covered with a minimumnumber of nodes while optimum energy consumption ismet
The Scientific World Journal 7
32 The Proposed Fitness Function Calculation of a min-imum number of nodes is required in the algorithm Thenext step is to evaluate connectivity of the network Thisimproves architecture of network In addition the algorithmtakes the connection radius of applied nodes into accountThis demonstrates that formula is flexible while differentkinds of networks are measured A fitness function based onthe extension of area under coverage is introduced in whatfollows It is mainly aimed to realize an optimum solution tocover wider area while efficiency of energy consumption ispreserved Afterward connectivity of the nodes is examinedby prime and Dijkstra algorithms The coverage and thelifetime of the network are the two main objectives underconsideration The former is obtained by the area of the unitof the disk which is obtained by radius 119877 centered at eachsensor As per (6) the area of the union is normalized by thetotal area [15]coverage
=
119899
⋃
119894=1
1198772
119909119894 119910119894there41003816100381610038161003816(119909119894 119910119894) minus (119909
119894minus1 119910119894minus1
)1003816100381610038161003816 = (0 0)
119899
⋃
119894=1
1198772
119909119894 119910119894minus 1199032
119909119894 119910119894there4 119900119908
(6)
where rarr 119903119909119894 119910119894
= |(119909119894 119910119894) minus (119909
119894minus1 119910119894minus1
)|Quint et al introduced the formula (7) for obtaining the
energy required for converting a set of purpose points knownas purpose function [16]
min 119891 = sum
119894isin119904
(120576 + 119889119894) lowast 119910119894+ sum
119894isin119863
NC119895lowast ℎ119895 (7)
In (7) the constant 120576 is the required energy to set up anode and 119889
119894represents the cost of routing between upstream
throughdownstreamThismount is computed before launch-ing the program by using the Dijkstra algorithm This valueis a kind of penalty for remote nodes NC is the surchargeof uncovering points 119910
119894and ℎ
119895show the activation status of
node 119894 and covering status of point 119895 respectively Consider
fitness minus function =
min 119891119894119895
coverage119894119895
(8)
The proposed fitness function to take into account boththe proposed coverage formula and energy procedure isrepresented in (8) Ration of energy level and amount ofenergy required to achieve the proper network are obtainedby the formula
33 Evaluation and Simulation Results The experimentswere conducted with 200 nodes (119873) a network of 100 lowast
100m2 in extent (119872) and a BS at 200m from the net-work The simulation parameters are listed in Table 1 Asthe communication medium between the sensors is binaryoptimization of WSN connectivity space is significantly non-linear Considerable effects on the two objectives (networkdisconnection might be the case) is induced by trivial move-ment of the sensors Thanks to high efficiency for nonlinearobjectives GA was used in optimization [15]
Table 1 Simulation parameters
Network size 100mNode no 200Initial energy 2 J119864119890
50 nJbit120576119897
00013 pJbitm2
120576119904
10 pJbitm2
Network area 100 lowast 100m2
BS distance 200mPacket size 200 bits119889co = 119889crossover 85m
Table 2 GA parameter values
Number of candidate individuals 100Length of chromosome 20Crossover rate 5Mutation rate 2Iteration 100
The GA parameters in the environment simulation arelisted in Table 2 As it is ineffective on the final results thechromosomes can be adopted randomlyThat is regardless ofchromosome it tends to the optimum solution The numberof iterations is fixed (100)
The average of experiments on 200 packets is picturedin Figures 3(b) and 3(c) In the latter the network sustainsenergy shortage at 03915 due to heavy packets while theascending and continuous rate of packet transfer is evidentuntil 51024 in the former The figures confirm the optimumplacement so that the network tolerates heavy packetsoptimally In case of death of one node the adjacent node isstill almost functional for sending the data to the sink Thusthe proposed algorithm is optimal and improves lifetime ofthe network [15]
4 Network Coverage in WSN
Coverage of WSNs has received great deal of attention inrecent researches The term is usually defined as a measureof performance of lifetime of the sensors in observing thephysical space The coverage is also a critical factor forconnectivity of sensor network By definition connectivity isthe capability of the sensor nodes to communicate with datasink To deal with the issue of coverage based on real-worldWSN application a set of hypothetical parameters (119860 119861 119862)were assumed in a 2-D field Consistent with other studiesthe parameters are defined as close as possible to practicalsituation [12] As a result there are three types of sensorsmonitoring special objectives For sake of more simplicityof the problem the presumption is that spatial variables 119860119861 and 119862 represent density of sensors per area that monitorobjectives in the form of 120588
119860≪ 120588119861
≪ 120588119862correspondingly
In addition to general aspects of networks the concept
8 The Scientific World Journal
explains specific features of special-objective networks aswell
A Euclidian square field at the length of 1 comprised ofidentical square area was assumed so that all the subareashave sensor coverage located at the vicinal intersection linesThe configuration has been adopted in other works as a gridbased wireless sensor network layout [12] Figure 4(a) showsthe general scheme of coverage in WSN
The small sensors are featured with limited-power lim-ited range of transmission and sensing mode option (threeoperating modes) based on capabilities and condition Withlower density of the parameter 119860 sensor is featured with thelongest transmission range and 119862 with the shortest range Toachieve optimum energy consumption a clustering solutionwith clusters consisting one specific adjoining sensor of andthe same operating mode known as cluster-in-charge wasdevised All the clusters may use multi-hop to communicateto the base station (BS) or sink In normal operation a clusterin charge carries out environmentmonitoring anddata aggre-gation at specific periodic time and transmits the data to theBS Here the multiobjective algorithm capable to optimizethe three main parameters (connectivity consumption ofenergy and coverage (ECEP)) of monitoring and measuringat required spots is introduced
41 Proposed Fitness Function To introduce some feasibleoptimum network topologies with as few as possible con-straints (eg operational energy number of unconnectednodes and cluster-in charge overlap error) a novel algorithmwas adopted
Considering fitness function that takes the whole opera-tional modes in general feasible states the technique assessesthe applied parameters
411 Coverage Problem Formulation to ECEP To find theproper fitness functions as a part of genetic algorithm theformula introduce byQuintao et al [17]was used the formulais an improved version ofNakamurarsquos formula [18] where ldquo119860rdquois given monitoring area ldquo119878rdquo is set of sensor nodes ldquo119863rdquo is aset of demanded points ldquoAdrdquo is a set of areas needed to bemonitored by sensors ldquoNCrdquo is penalty cost of lack of coveragefor the needed point ldquoAErdquo is turning energy on and ldquoPCrdquois penalty costs of the path stretching from every node toBS (obtained via Dijekstrarsquos algorithm for a processing phasewhich is dedicated to each node to differentiate expensivenodes) The variables of the model are
119909119894119895= 1 when node ldquo119894rdquo covers demand point 119895 and 0
otherwise
119910119894= 1 when nodes ldquo119894rdquo is active and 0 otherwise
ℎ119895= 1 when demand point ldquo119895rdquo is not covered
min sum
119894isin119878
(AE119894+ PC119894) times 119910119894+ sum
119895isin119863
NC119895times ℎ119895 (9)
subject to
sum
119894119895
(119909119894119895+ ℎ119895) ge 1 forall119895 isin 119863 amp forall119894119895 isin 119860
119889
119909119894119895le 119910119894 forall119894 isin 119878 amp forall119894119895 isin 119860
119889
0 le 119909119894119895le 1 forall119894119895 isin 119860
119889 ℎ
119895ge 0 forall119895 isin 119863
119910 isin 0 1 119909 ℎ isin R
(10)
The formula (9) enables us to have minimum requiredactive nodes (more energy to the network) and minimumcases of lack of coverage as well Every demanded point formonitoring by a sensor or keeping uncovered is representedby constraints (10) they dictate that only active nodes are ableof sensing respectively
By taking into account penalty cost of overlapping cluster-in-charge errors and consumption of energy marked byOPCE and EC respectively an improvement wasmade in thefitness function (FF) We have
FF = min (Usage Cost + Penalty Cost)
UsageCost = sum
119894isin119904
(AE119894+ PC119894+ EC) times 119910
119894
PenaltyCost = sum
119895isin119872
sum
119896isin119863
(NC119895119896
+OPCE119895119896) times ℎ119896
(11)
subject to
119872 isin 119860 119861 119862 (12)
As a dependent to sensorrsquos mode in the network EC ismeasured numerically Clearly high communication rangeis obtained by sensor working in mode ldquo119860rdquo featured withhighest rate energy consumption By assuming 4 and 2 timespower usage comparing with ldquo119862rdquo for mode ldquo119860rdquo and ldquo119861rdquorespectively we have for EC
EC =4119899119860+ 2119899119861+ 119899119862
sum119894isin119878
119899119894
(13)
Taking into account OPCE in FF wasted energy foroverlapping error in cluster-in-charge is obtained
412 Ascertaining Connectivity to ECEP Plenty of optimumsolutions are obtained by genetic based algorithm thoughconnectivity of the nodes is not taken into account Thispresents outflow of collected data toward the BS Kruskalalgorithm was utilized to examine connectivity of network inthe 2nd part of ECEP The process proposed is comprised offour steps
The network is assumed as graph 119866 where an edge existsbetween vertices ldquo119909rdquo and ldquo119910rdquo in graph 119866 when the maximumcommunication range between two particular nodes ldquo119909rdquo andldquo119910rdquo exceeds the distance between ldquo119909rdquo and ldquo119910rdquo By introducingthe Kruskal algorithm a minimum spanning tree (MST) isachieved so that a shorter path between each two vertices forrouting aggregated data is achieved
The Scientific World Journal 9
Sensors
L
L
(a)
BA
B
B A A
AC C
C
C C
Inactive 00
A mode 01
B mode 10
C mode 11
Bit-string 0011011100 11 011000 10001001011111
(b)
0
1
2
3
4
5
6
10 20 30 40 50 60 70Iteration (80 cases per iteration)
Freq
uenc
y
(c)
Figure 4 (a) Coverage scheme in wireless sensor network (b) Network with represented encoding (c) Network lifetime in specified scale
The connectivity with specific shortest paths is achievedwhen the number of MST tree edges is the same as thenumber of vertices minus1 otherwise inactive nodes are activated(this explains shorter transmission range than communica-tion distance for some nodes) Kruskal technique is usedon newly activated and disconnected nodes This results information of new lightest tree
The shortest path between each disconnected node to theBS is obtained and the internal sensor nodes of the paths areadded to the set 119864
Any newly activated node not listed in 119864 is turneddeactivated This helps preservation of network energy whilethe quality is the same
Finally one or two network typology(s) were developedbased on the range of transmission of nodes and positionof sensor node The networks that realized maximum net-work coverage are characterized with optimum coverage andenergy usage
413 Encoding The proposed approach was implemented ina square field (119871lowast119871) with virtually equal subareas Each nodeis positioned at intersection of the subareas and obtains fourexpressions (1) active (00) (2) mode 119860 active (01) (3) mode119861 active (10) and (4) mode 119862 active (11) Figure 4(b) showsthe network with encoding
The whole nodes arrangement in the network resemblesa chromosomeThat is each node represents gen and a set ofgens in specific order creates a certain chromosome In thisway 119871 nodes in a network host 21198712 bits as mode of each nodeis showed by two bits and there are 1198712 gens in the network
42 Evaluation and Simulation Results Genetic algorithmtechnique includes set of chromosomes known as populationwhich improves by generation process To put it anotherway inspired by the nature the algorithm receives inputdata which are randomly collected by the primary pop-ulation When generation process is completed the final
10 The Scientific World Journal
populationresult represents the optimum solution for themain problem In general all improvements made by thegeneration process are comprised of crossover scoringselection and mutation function The term crossover refersto productive function at specific rate where two differentchromosomes mate to produce new generation Amongdifferent methods of crossover single point is under focushere
As the most critical part of genetic algorithm scoring orassigning fitness on the other hand employs FF for scoringSpecific weight is assigned to each chromosome dependingon the content This is to say that each chromosome isa solution developed through iterations There is a directrelation between fitness value of chromosome and chance ofsurviving in some generations The FF is a totally problem-based design and achieving intelligent fitness function todifferentiate qualified people has been the main concernof the literature Superior chromosomes are adopted byselection process to create a new population with mutationtechnique that permits specific chromosomes to enter thenew generation The stochastic nature of GA dictates thatdifferent solutions with variant performance are obtained indifferent runs of the algorithm The proposed algorithm wasimplemented by WSN simulator and almost 100 coverageover the monitored area was realized
Level of energy consumption and number of active nodesalong with live packets over time are listed in Table 3 Only18 packets were first delivered to BS and later the numberincreased to 83 packets in second 0118
Table 4 represents that the network died last time in513781 Moreover there is a gradual decrease in number oflive packets as number of active sensor converges to 0
Role of number of nodes on genetic algorithm iterationon lifetime of the network is pictured in Figure 4(c) Itis implied by iterations 50 and 57 that more number ofindividuals does not necessary result in better solution Thatis meeting stop criterion is enough to reach the optimumsolution
The results of simulation confirmed merits of relativelylarge number of sensors with low energy consumption overactivating fewer numbers of sensors with higher energyconsumption
5 Clustering in WSN
As mentioned earlier increase of lifetime and expansionand load balance are the main requirements of WSNsapplications Proper clustering using optimized techniques ofclustering is an option to realize these goals
Generally the cluster based methods suit monitoringapplications featured with necessity of nonstop stream ofdata from sensors [11] this calls for reducing the costs oftimely data message delivery by routing protocols The LowEnergy Adaptive Clustering Hierarchy (LEACH) protocolfor instance employs a hierarchical approach for clusteringthe network There is an adopted cluster head for manag-ing each cluster The cluster head is in charge of severaltasks first it is comprised of collecting data supplied from
Table 3 Observed values in the early times of network
Time (nanosecond) Power Active sensors35 Live packets0035090 20718 27 180049330 15332 27 600108107 8031 20 530118182 6739 18 830136719 5333 14 300148626 4368 12 360202956 3354 10 380209666 3123 8 380218048 2897 8 470246709 2032 7 540255352 1860 6 52
Table 4 Observed values in the last times of network
Time (nanosecond) Power Active sensors35 Live packets0322821 1096 5 870345804 616 4 890358382 421 3 750415196 307 2 330439882 122 1 250513781 0 0 0
the members of a cluster on periodical basis It aggregates thedata after gathering them so that redundancy among corre-lated values is dealt with [19] The next main task assigned toa cluster head is to directly transmit the aggregated data tothe base station The transmission is conducted via a singlehop Creating a TDMA-based schedule is aimed to assign atime slot to each clustermdashto be used for transmission is themain task The cluster members learn by the schedule whenthe head cluster disseminates it To minimize probability ofcollision among the sensors inside and outside a cluster acode-division multiple access-based scheme is employed byLEACH nodes for communication
Figure 5(a) illustrates a sample of cluster basedWSNTheaggregated data are transmitted from several clusters via CHstoward BS The CHs are marked by gray circle There areplenty of studies on protocols with less costs of transmissionbetween CHs and BS
51 The Proposed Fitness Function For defining energyconsumption and improve lifetime of the network theparameters of the genetic algorithm were set according tosoftware servicesThere is a negative relation between energyconsumption and distance parameters One way to lessenthe distance between member nodes and pertinent CH isto use more clusters each cluster may have one or morecluster head(s) which is not economic regarding the energyconsumption However by using more clusters we avoidlonger distances Because of this to achieve average amountof energy consumption by each node a ratio of total energyusage to the total distances of nodes was definedWe proposea formula to achieve optimal WSN energy consumption andcoverage (14)
The Scientific World Journal 11
Data sink
Cluster member Cluster head
(a)
1
2
3
4
5
6
7
8
9
10
020 40 60 80 100 120 140 160 180 200
Proposed AlgLEACH
Tota
l net
wor
ks e
nerg
y le
vel
Number of rounds0
(b)
0
20
40
60
80
100
120
0 20 40 60 80 100 140 160 180120
Proposed AlgLEACH
Num
ber o
f aliv
e mod
es
Number of rounds
(c)
Figure 5 (a) A sample of cluster based WSN (b) Energy consumption rate over the lifetime of a network (c) Comparison of live nodes intwo methods
Where ((119890119894lowast119879)times 119890
119895lowast119879) is the total energy consumption
and ((119863119886timesnodes)times (119863
119887timesCHs)) is the total distance between
nodes and each cluster is multiplied by total distance betweencluster heads 119865(119894) represents the maximum achievable valuefor the ratio Taking into account the negative relationbetween number of cluster heads and number of nodesCHsand the same relation between 119890
119896and 119890
119895on one hand and
amount of 119863119886and 119863
119887on the other hand the maximum
value of ratio action is a trade-off of energy consumption andnumber of blusters [17]
119865 (119894) = (119890119894times 119879
119863119886times Nodes
) times (
119890119895times 119879
119863119887times CHs
) (14)
there4 119863119886=
Width times 119892119894
radicClusters
forall119892119894isin DDBSCDCDSD
[119892119894= DDBS] = 1 ∵ [clusters = 1] = 1
there4 (119863119886= 119863119887= CHs = 1)
(15)
119865(119894) in the intelligent suitability function is capable of grad-ing any chromosome both through cluster based methodor direct method To achieve the optimum solution theoptimum chromosome choice is made based on passinggeneration
12 The Scientific World Journal
52 Evaluation and Simulation Result A comparison is madebetween the GA-based approach proposed here and othercluster-based protocols (eg LEACH)
Theparameters used in the simulation are listed inTable 5and the clusters are featured with only one CH while thegeneric algorithm process is used to obtain the number ofCHs
Table 6 represents the parameters of GA in the simula-tion It is possible to adopt the chromosomes through randomselection The number of iterations is constant at 100
A comparison between the proposed algorithm andLEACH regarding network energy and lifetime is picturedin Figures 5(b) and 5(c) The comparison is made over200 periods of time The former represents that unifiedconsumption of energy by CHs results in short lifetime ofnodes in LEACH The latter shows that death of the firstnode in the proposed algorithm is delayed compared withLEACH as the node is removed due to energy status More-over the network keeps working with minimum number ofalive nodes In general the final individuals form a clusterwith uniform energy consumption This happens thanks toalgorithm fitness function that takes the energy status ofnodes and CHsBS distances In this way the phenomenonadds to lifetime of the network significantly [20]
6 Data Aggregation in WSN
Thepurpose of data aggregation is to collect the highly criticaldata supplied by the sensors and to forward the data to thesink Efficient energy consumption and reducing data latencyas much as possible are two main concerns The latter is vitalfor many applications including environment monitoringwhere fresh data are imperative Achieving higher energyefficiency in data aggregation algorithm ensures longernetwork lifetime Failing to share the load of data amongthe members of a network by the data aggregation treeeventuates in consumption of total energy by some of thenodes that are assigned with heavy load of data Failure ofnodes leads to failure of the network Utilizing GA thissection investigates the data collecting spanning trees withhigher energy efficiency We try to achieve a proper routethat balances the data load over the network An algorithmthat ensures a balance of residual energy among the nodesincreases lifetime of the network
The highest distance between every pair of nodes of thetwo clusters determines the distance between the clustersMLDA is utilized on the basis of this cluster informationThe (EESR) Energy-Efficient Sensor Routing was introducedby Hussain and Islam to be used on multi-hop network Tohave higher efficiency of energy consumption they used aspanning tree which is in fact a group of routing trees [21]According to EESR for calculating energy edge cost thenode with minimum energy is adopted It uses the nodewith minimum energy and takes into account the lowest andhighest cost links that receives data packets from the neighbornode and forward them to BS Two spanning trees featuredwith aggregation scheme and data gathering designed to
Table 5 Simulation parameters
Network size 100mNode no 200Initial energy 2 J119864119890
50 nJbit120576119897
00013 pJbitm2
120576119904
10 pJbitm2
Network area 100 lowast 100m2
BS distance 200mPacket size 200 bits119889co = 119889crossover 85m
Table 6 GA parameter values
Number of candidate individuals 100Length of chromosome 20Crossover rate 5Mutation rate 2Iteration 100
guarantee higher lifetime of the network were studied by Tanand korpeoglu [22]
Yang and Fei proposed a new approach called Intermedi-ate Target Based Geographic Routing (ITGR) to avoid suchlong detour pathsThe novelty of the approach is that a singleforwarding path can be used to determine a shaded area thatmay covermany destination nodesTheydesigned an efficientmethod for the source to find out whether a destination nodebelongs to a shaded area [23]
In general there are twomethods for powermanagementamong the nodes in data aggregation stage One is thepower aware version (PEDAPPA) that tries to achieve higherlifetime through creating balanced energy consumption bythe nodes The second method (PEDAP) the nonpoweraware version on the other hand tries to attenuate energyconsumption by the system on the basis of data gatheringround [24] The method ensures higher lifetime of the lastnode Each method adopts different approaches to calculatethe edge cost
61 Problem Statement The first assumption is that thenetwork is initialized with every node having a fix range ofradio communication and a specific primary energy beforereceiving the multi-data packet All nodes are capable tomonitor the environment to send children packets to theneighbors and to send single one to the corresponding par-entsThis process is performed as long as possible Accordingto the proposed algorithm in this part every node afterinitialization may send a sample certain packet to the BSIn case a route is adopted for transmitting data packet theBS utilizes a routing table with all the properties and currentenergy of the nodes listed to search for themonitor node withcorresponding property and sends the resultant informationto GA
To find out an optimum route the GA generates allpossible routes Afterward BS prepares a schedule based on
The Scientific World Journal 13
the route and sends it to all nodes Then the routing table isupdated once more by GA while applying the reduction ofenergy for all the nodes In effect GA minimum spanningtree and aggregation tree are alike as the former is basedon the environment-monitor node developed to examine thebest edges toward the BS and to achieve balanced load of datapackets to the nodes In this case the network is consideredalive as far as the minimum required nodes are active to senddata packet
62 Fitness Function Under fitness function every chromo-some is scored This lets us to make comparison regardingnumber of deaths or survival over all themembers A formulalater improved to be known as Nakamura formula was usedin development of our proposed fitness function Under theformula ldquo119860rdquo stands for the given monitoring area ldquo119878rdquo standsfor the set of sensor nodes ldquo119863rdquo stands for the group ofdemanded points ldquoAdrdquo stands for the set of sensors in chargeof monitoring the area under consideration ldquoALrdquo stands forthe turning energy on in low energy level mode ldquoAHrdquo standsfor turning energy on in high energy level mode (sendingpacket load to the just ldquoBSrdquo stands ldquoECrdquo stands for the cost ofa node in 3 states (119860 119861 119862) and ldquo119878rdquo stands for the set of edgecollection Fitness function that is a procedure which scoresany chromosome This value helps us to compare the wholeones to each other for survival or death (15) The model canbe formulated as
119866 (119894) = sum
119894isin119878
(AE119894+ EC119894) forall119894 isin 119863amp forall119894119894 isin 119860
119889
AE isin ALAH
(16)
The formula above (16) obtains all the feasible paths andthe nodesrsquo status This information is required to set a nodein lowhigh level energymodeThe proposed fitness functionwas improved by defining at least 3 states for all the node forobtaining the almost exact fitness as
EC =4119899119860+ 2119899119861+ 119899119862
sum119894isin119878
119899119894
119872 isin 119860 119861 119862
(17)
The mode of the sensor network affects the EC whichis measured numerically Knowing high range of communi-cation for the sensor node in mode 119860 the highest energyconsumption is expected under this mode Modes 119861 and119862 on the other hand with shorter communication rangeare next in order of energy consumption It is assumed thatenergy consumption under mode 119860 is four times more thanthat of 119862 and that of 119861 in turn is 2 times more than that of 119862EC is obtained through [25]
In the fitness function below 119873 stands for number ofnodes the function yields the electrical power based on setupenergy The energy needed for sending data packet from thechildren is marked by 119864children
119864(119894)Total = 119864Monitor + 119866 (119894)
119865 (119894) =119864(119894)Total
119873
(18)
Table 7 Simulation parameters
Network size 100mNode no 200Initial energy 08 JBS location Center of resourceNetwork area 100 lowast 100m2
Scenario simulated 5 times that average one is reportedTree used time 15 periods
Table 8 GA parameter values
Number of candidate individuals 500Length of chromosome 20Crossover rate 7Mutation rate 7Iteration 200
The formula above gives the average energy mountthrough dividing by the number of nodes The selectionfunction is used to assess each individual so that the betterthe fitness value themore the chance for surviving to the nextgeneration
63 Evaluation and Simulation Results A network simulatorwas used for implementation of the algorithm The simu-lation is featured with two steps first Java editor is uti-lized in implementation of genetic algorithm based portionTo this end Java Genetic Algorithm package (JPAC) wasinstalledmdashthere were other studies using the same methodAfterward OMNET++ was employed to track the differentroutes between sensor node and BS in some simulatedenvironment Table 7 lists the parameters for the experiencedsensor network
As Table 7 represents each tree in the simulation isemployed for 15 periods and the simulation is repeated 5times for each scenario to obtain an average to report
Parameters of the simulation of the environment arelisted in Table 8 Taking into account priorities such asremaining energy and packet size the simulation foundall routes and GA adopted the optimum one out of themAfterward all nodes in the selected routes were scheduled byBS Comparing with the other studies the simulation showedthat the proposed fitness function met the objectives
Comparisons between the proposed algorithm here andLEACH protocol on network energy and lifetime of 200periods of time (year) are illustrated in Figures 6(a) and6(b) Figure 6(a) shows the unified packet load and energyconsumption for obtaining the optimum route toward BSOn the other hand Figure 6(b) pictures the time and thefirst node is removed Clearly in comparison with LEACHprotocol death time of the first node is considerably delayedIn addition the network can keep working with minimum
14 The Scientific World Journal
123456789
0
10
0 20 40 60 80 100 120 140 160 180 200Number of rounds
Tota
l net
wor
ks e
nerg
y le
vel
Proposed AlgLEACH
(a)
20
40
60
80
100
120
140 160 18020 40 60 80 100 1200
0
LEACHProposed Alg
Number of rounds
Num
ber o
f aliv
e nod
es
(b)
Figure 6 (a) Energy consumption rate in lifetime of virtual environments (b) Comparison of coverage in two methods
number of active node In general by using routing algo-rithm fitness function takes three states of energy status (lowmiddle and high) or communication range for the BS Thefinal individuals provide route with almost uniform energyconsumption This feature makes a great contribution to thenetworkrsquos lifetime [25]
7 Conclusion and Future Work
WSNs are comprised of a set of wireless sensors with varietyof capabilities and limitations which make them suitable forspecific applications There are several imaginable applica-tions for WSNs in military commercial and medical fieldsTaking into consideration the recent technological advancesutilization of these networks in daily life is increasingOf the main limitations of WSNs is energy consumptionand lifetime of the network which are common concernsalmost for any WSN application In general the operationalstages of WSNs include node placement network coverageclustering data aggregation and routing A technical surveywas conducted on these operational stages By finding thedrawbacks and optimizing them ideal parameters of thenetwork were achieved Finally using genetic algorithm afitness function with optimum formula was obtained and thepresent protocols were optimized The results of simulationsin JPAC MATLAB and NS were compared with are of thepresent protocols and optimization of the two parametersconfirmed It is also noticeable that the diagrams obtainedfrom the simulations showed an improvement in energyconsumption parameters and lifetime of the network thismeans more ideal WSNs An application based protocolwithout specific limitation regarding its applicationmdashsuitablefor military medical and commercial applicationsmdashwill besubject of our future studies
Conflict of Interests
The authors declare that there is no conflict of interestsregarding the publication of this paper
References
[1] I F Akyildiz andM C Vuran ldquoFrontmatterrdquo inWireless SensorNetworks John Wiley amp Sons Chichester UK 2010
[2] K Akkaya and M Younis ldquoA survey on routing protocols forwireless sensor networksrdquo Ad Hoc Networks vol 3 no 3 pp325ndash349 2005
[3] F S Babamir and A Norouzi ldquoAchieving key privacy and invis-ibility for unattended wireless sensor networks in healthcarerdquoThe Computer Journal 2013
[4] F S Babamir and Z Eslami ldquoData security in unattendedwireless sensor networks through aggregate signcryptionrdquo KSIITransactions on Internet and Information Systems vol 6 no 11pp 2940ndash2955 2012
[5] M Romoozi M Vahidipour M Romoozi and S MaghsoodildquoGenetic algorithm for energy efficient amp coverage-preservedpositioning in wireless sensor networksrdquo in Proceedings of theIEEE International Conference on Intelligent Computing andCognitive Informatics (ICICCI rsquo10) pp 22ndash25 June 2010
[6] A Norouzi A H Zaim and A Sertbas ldquoA comparative studybased on power usage performance for routing protocols inwireless sensor networkrdquo in Proceedings of the IEEE Inter-national Conference on Technological Advances in ElectricalElectronics and Computer Engineering (TAEECE rsquo13) KonyaTurkey May 2013
[7] A Norouzi F S Babamir and A H Zaim ldquoAn interactivegenetic algorithm for mobile sensor networksrdquo Studies inInformatics and Control vol 22 no 2 pp 213ndash218 2013
[8] D E GoldbergGenetic Algorithm in a Search Optimization andMachine Learning Addison Wesley 1989
The Scientific World Journal 15
[9] V Kreinovich C Quintana and O Fuentes ldquoGenetic algo-rithms What fitness scaling is optimalrdquo Cybernetics andSystems vol 24 no 1 pp 9ndash26 1993
[10] A Norouzi F S Babamir and A H Zaim ldquoA novel energyefficient routing protocol in wireless sensor networksrdquo Journalof Wireless Sensor Network vol 3 no 10 pp 1ndash10 2011
[11] S Hussain A Matin and O Islam ldquoGenetic algorithm forhierarchical wireless sensor networkrdquo Journal of Networks vol2 no 5 pp 87ndash97 2007
[12] A P Bhondekar R Vig M L Singla C Ghanshyam and PKapur ldquoGenetic algorithm based node placement methodologyfor wireless sensor networksrdquo in Proceedings of the InternationalMultiConference of Engineering and Computer Science (IMECSrsquo09) vol 1 pp 106ndash112 Hong Kong China March 2009
[13] C Sergiou andVVassiliou ldquoChapter 1 efficient node placementfor congestion control in wireless sensor networksrdquo inWirelessSensor Networks Technology and Applications InTech
[14] N Trigoni Y Yao A Demers J Gehrke and R RajaramanyldquoWave scheduling energy-efficient data dissemination for sen-sor networksrdquo in Proceedings of the International Workshop onDataManagement for Sensor Networks (DMSN) in Conjunctionwith the International Confernece on Very Large Data Bases(VLDB) August 2004
[15] Z Orman A Norouzi and F S Babamir ldquoIntelligent nodeplacement using GA (INPGA) protocol in wireless sensornetworksrdquo in Proceedings of the International Conference onWireless Networks (ICWNrsquo11) 2011
[16] F P Quint F Nakamural and G R Mateusl ldquoA Hybridapproach to solve the coverage and connectivity problem inwireless sensor networksrdquo in Proceedings of the Annual AllertonConference on Communication Control and Computing Mon-ticello Ill USA 2005
[17] F P Quintao FG Nakamura and G R Mateus ldquoA hybridapproach to solve the coverage and connectivity problem inwireless sensor networksrdquo in Proceedings of the 4th Euro-pean Workshop on Meta-Heuristics Design and Evaluation ofAdvanced Hybrid Meta-Heuristics Nottingham UK 2004
[18] F G Nakamura Planejamento Dinamico para Controle deCobertura e Conectividade em Redes de Sensores sem fio planas[Masterrsquos thesis] Universidade Federal de Minas Gerais 2003(portuguese)
[19] K Sohraby D Minoli and T Znati Wireless Sensor NetworksTechnology Protocols and Applications John Wiley amp Sons2007
[20] ANorouzi F Babamir andA Zaim ldquoAnew clustering protocolfor wireless sensor networks using genetic algorithm approachrdquoWireless Sensor Network vol 3 no 11 pp 362ndash370 2011
[21] S Hussain and O Islam ldquoAn energy efficient spanning treebased multi-hop routing in wireless sensor networksrdquo in Pro-ceedings of the IEEE Wireless Communications and NetworkingConference (WCNC rsquo07) pp 4386ndash4391 March 2007
[22] H O Tan and I Korpeoglu ldquoPower efficient data gathering andaggregation in wireless sensor networksrdquo SIGMOD Record vol32 no 4 pp 66ndash71 2003
[23] J Yang and Z Fei ldquoITGR intermediate target based geographicroutingrdquo in Proceedings of the 19th International Conference onComputer Communications and Networks (ICCCN rsquo10) pp 1ndash6IEEE Zurich Switzerland August 2010
[24] O Islam S Hussain andH Zhang ldquoGenetic algorithm for dataaggregation trees in wireless sensor networksrdquo in Proceedings ofthe 3rd IET International Conference on Intelligent Environments(IE rsquo07) pp 312ndash316 September 2007
[25] A Norouzi F Babamir and Z Orman ldquoA tree based dataaggregation scheme for wireless sensor networks using GArdquoWireless Sensor Network vol 4 no 8 pp 191ndash196 2012
Submit your manuscripts athttpwwwhindawicom
Computer Games Technology
International Journal of
Hindawi Publishing Corporationhttpwwwhindawicom Volume 2014
Hindawi Publishing Corporationhttpwwwhindawicom Volume 2014
Distributed Sensor Networks
International Journal of
Advances in
FuzzySystems
Hindawi Publishing Corporationhttpwwwhindawicom
Volume 2014
International Journal of
ReconfigurableComputing
Hindawi Publishing Corporation httpwwwhindawicom Volume 2014
Hindawi Publishing Corporationhttpwwwhindawicom Volume 2014
Applied Computational Intelligence and Soft Computing
thinspAdvancesthinspinthinsp
Artificial Intelligence
HindawithinspPublishingthinspCorporationhttpwwwhindawicom Volumethinsp2014
Advances inSoftware EngineeringHindawi Publishing Corporationhttpwwwhindawicom Volume 2014
Hindawi Publishing Corporationhttpwwwhindawicom Volume 2014
Electrical and Computer Engineering
Journal of
Journal of
Computer Networks and Communications
Hindawi Publishing Corporationhttpwwwhindawicom Volume 2014
Hindawi Publishing Corporation
httpwwwhindawicom Volume 2014
Advances in
Multimedia
International Journal of
Biomedical Imaging
Hindawi Publishing Corporationhttpwwwhindawicom Volume 2014
ArtificialNeural Systems
Advances in
Hindawi Publishing Corporationhttpwwwhindawicom Volume 2014
RoboticsJournal of
Hindawi Publishing Corporationhttpwwwhindawicom Volume 2014
Hindawi Publishing Corporationhttpwwwhindawicom Volume 2014
Computational Intelligence and Neuroscience
Industrial EngineeringJournal of
Hindawi Publishing Corporationhttpwwwhindawicom Volume 2014
Modelling amp Simulation in EngineeringHindawi Publishing Corporation httpwwwhindawicom Volume 2014
The Scientific World JournalHindawi Publishing Corporation httpwwwhindawicom Volume 2014
Hindawi Publishing Corporationhttpwwwhindawicom Volume 2014
Human-ComputerInteraction
Advances in
Computer EngineeringAdvances in
Hindawi Publishing Corporationhttpwwwhindawicom Volume 2014
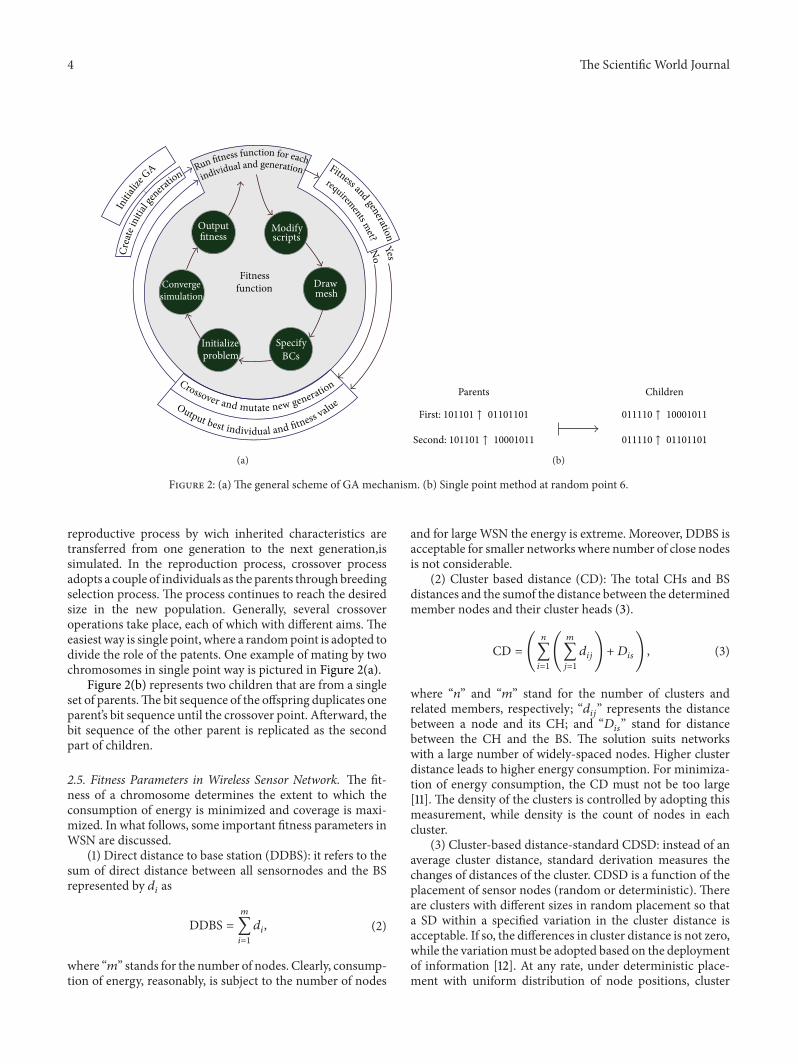
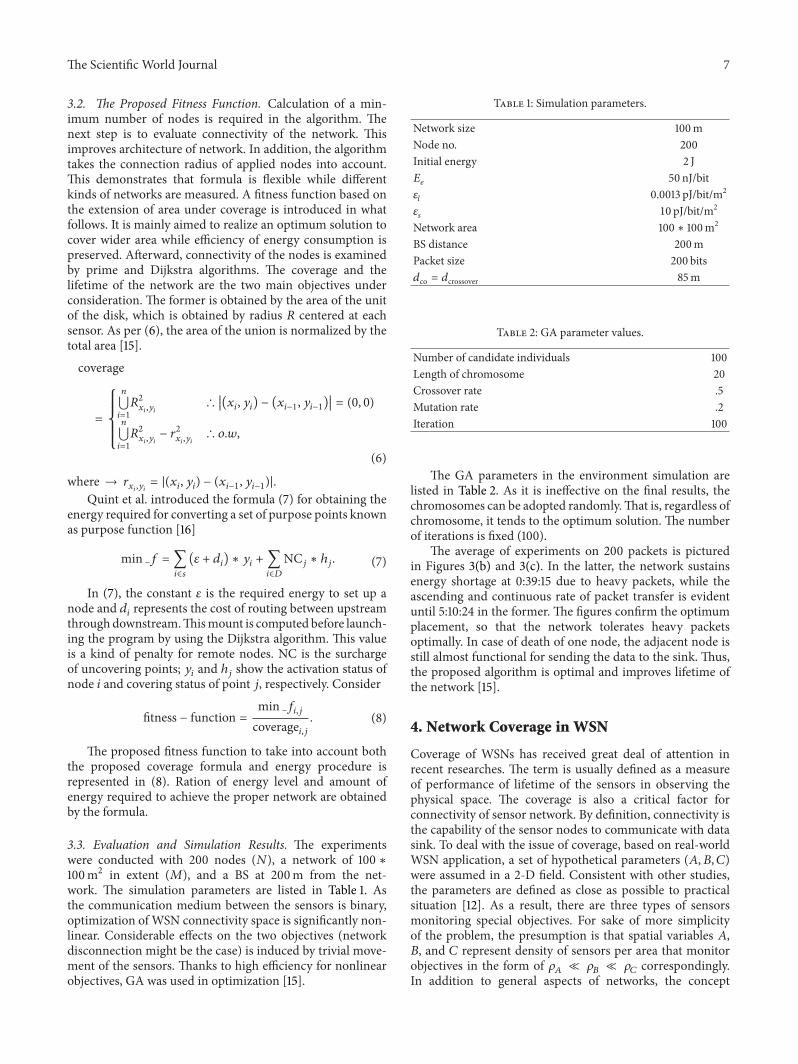
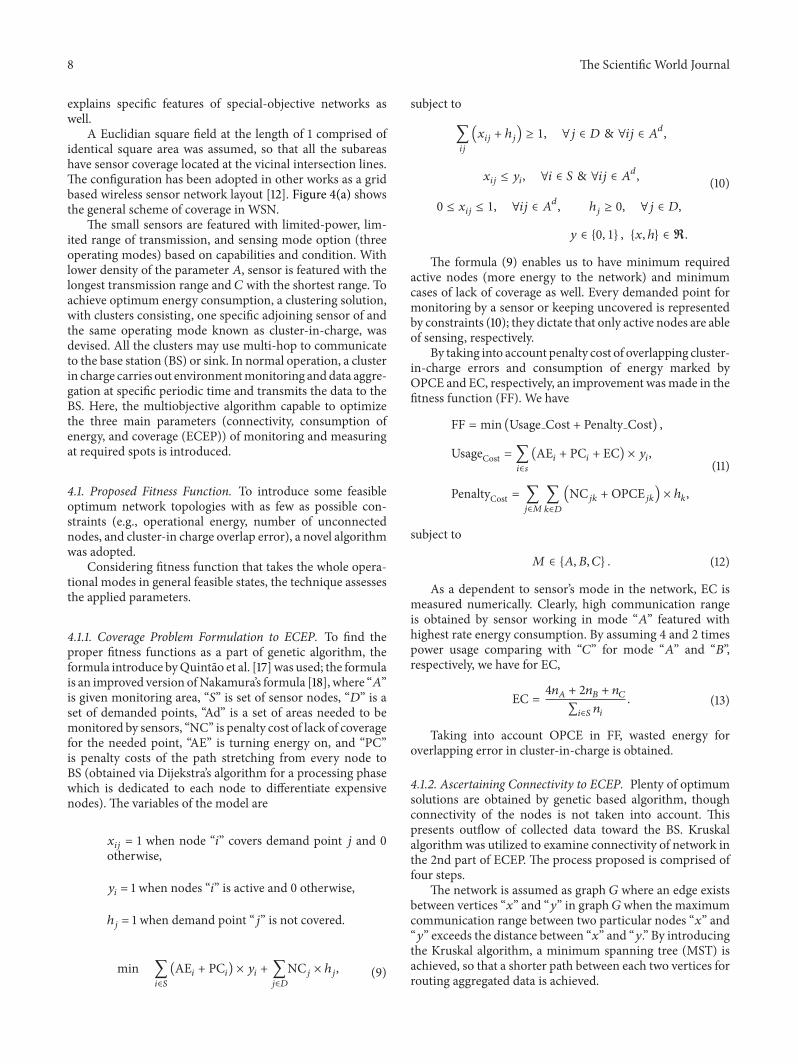
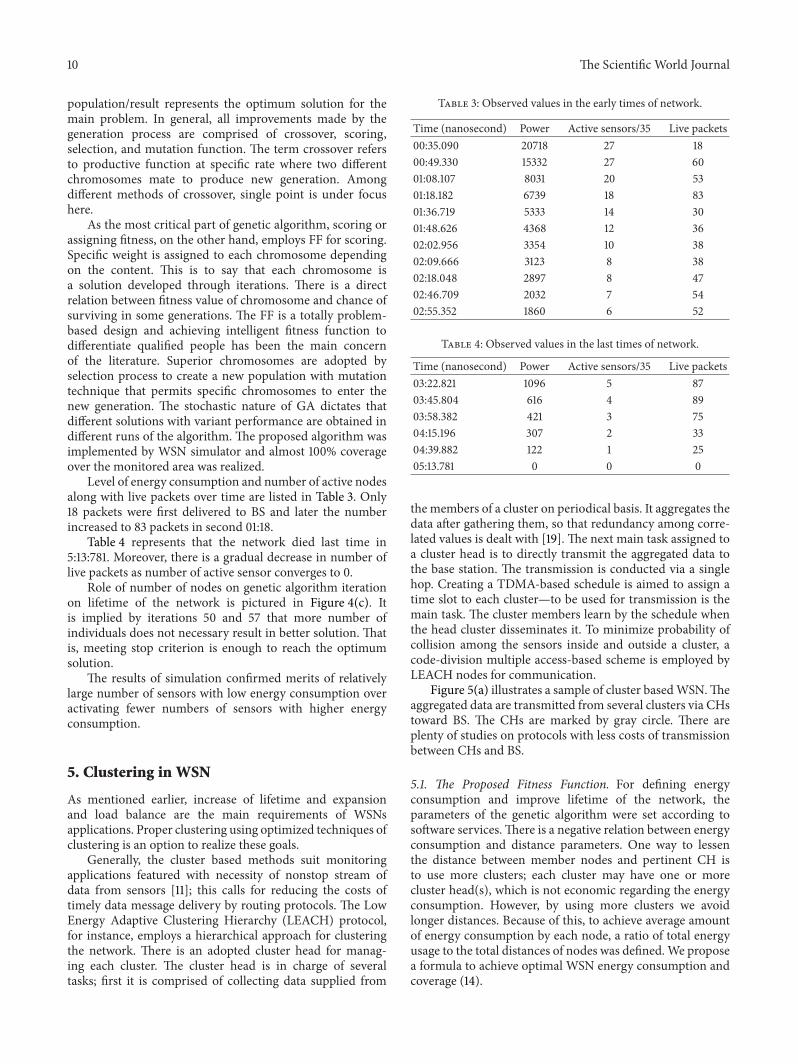
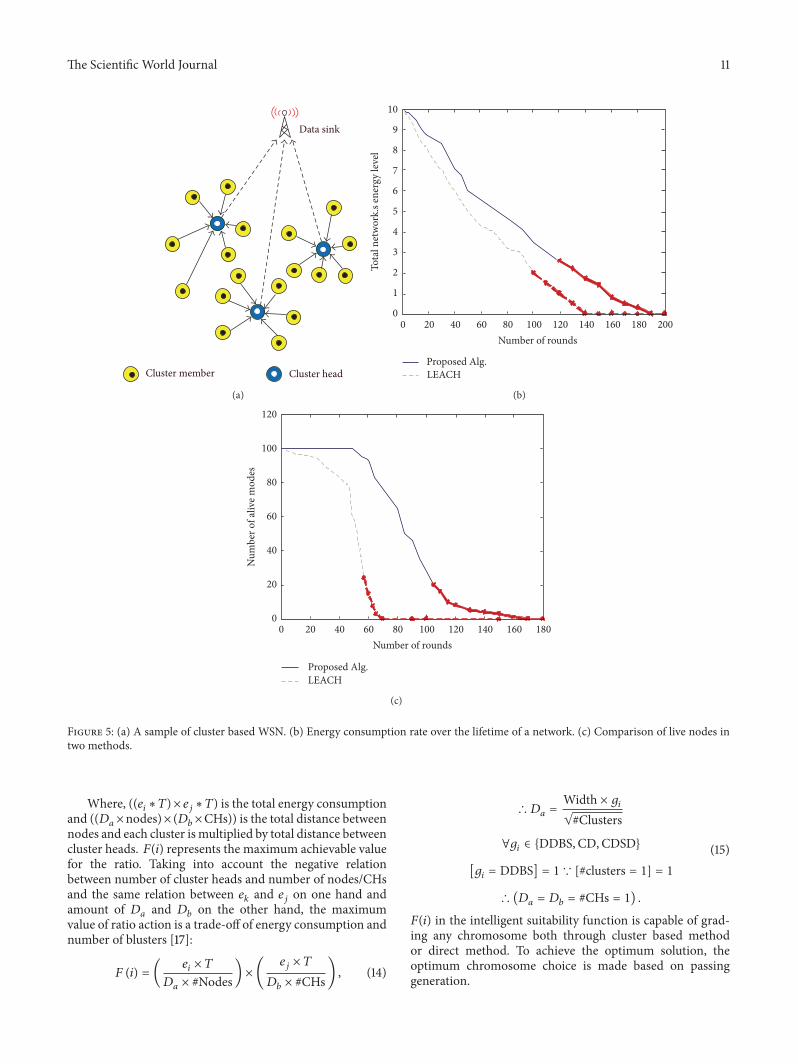