research article empirical analysis of server...
TRANSCRIPT
Hindawi Publishing CorporationMathematical Problems in EngineeringVolume 2013, Article ID 947234, 11 pageshttp://dx.doi.org/10.1155/2013/947234
Research ArticleEmpirical Analysis of Server Consolidation and DesktopVirtualization in Cloud Computing
Bao Rong Chang,1 Hsiu-Fen Tsai,2 and Chi-Ming Chen3
1 Department of Computer Science and Information Engineering, National University of Kaohsiung, 81148 Kaohsiung, Taiwan2Department of Marketing Management, Shu Te University, 82445 Kaohsiung, Taiwan3Department of Computer Science and Information Engineering, National University of Kaohsiung, 81148 Kaohsiung, Taiwan
Correspondence should be addressed to Bao Rong Chang; [email protected]
Received 11 September 2013; Accepted 10 October 2013
Academic Editor: Teen-Hang Meen
Copyright © 2013 Bao Rong Chang et al. This is an open access article distributed under the Creative Commons AttributionLicense, which permits unrestricted use, distribution, and reproduction in any medium, provided the original work is properlycited.
Physical server transited to virtual server infrastructure (VSI) and desktop device to virtual desktop infrastructure (VDI) havethe crucial problems of server consolidation, virtualization performance, virtual machine density, total cost of ownership (TCO),and return on investments (ROI). Besides, how to appropriately choose hypervisor for the desired server/desktop virtualization isreally challenging, because a trade-off between virtualization performance and cost is a hard decision to make in the cloud. Thispaper introduces five hypervisors to establish the virtual environment and then gives a careful assessment based on C/P ratio thatis derived from composite index, consolidation ratio, virtual machine density, TCO, and ROI. As a result, even though ESX serverobtains the highest ROI and lowest TCO in server virtualization and Hyper-V R2 gains the best performance of virtual machinemanagement; both of themhowever cost toomuch. Instead the best choice is ProxmoxVirtual Environment (ProxmoxVE) becauseit not only saves the initial investment a lot to own a virtual server/desktop infrastructure, but also obtains the lowest C/P ratio.
1. Introduction
Well-known public large-size cloud and private enterprise-owned cloud are currently leading cloud computing andservices, for example, Amazon AWS, Google App Engine,and Windows Azure in public cloud and Saleforce.comand EMC2 in private cloud. In contrast, small-to-mediumsized enterprises (SMEs), educational institutes, and socialgroups are also very eager to pursue the services they wantbased on virtual server in cloud (VSiC) [1] architecturedue to cost reduction, performance escalation, and securityimprovement. With this service, the operational costs forthe information system can be drastically reduced and itcan quickly increase the competitiveness of its informationsystem, which is sustained by the following advantages:centralized monitoring, quick management, dynamic opti-mization, and efficient backup.
Technically, unexpected situations with service-typeservers, such as websites, databases, AP servers, and fileservers, bring much trouble for enterprises. Once a service
stops its function, it can cause faulty data, stalled produc-tion lines, and interrupted operation procedures, leading tomultiple losses. However, a physical host has problems ofpromptness of service transfer to another host, restarting theservice, and inability to update data in real time. The hard-ware, information, and data will be obstacles for enterprisesto overcome.
To solve the issues mentioned above, virtual machinemanagement system or hypervisor [2], such as VMwareESX/ESXi Server, Microsoft Hyper-V R2 [3], and Proxmoxvirtual environment (Proxmox VE) [4], is able to deliver thevirtualmachine services for virtual server/desktop infrastruc-ture with high availability in computing, secured networking,and consolidated storage. With this approach, users makeit possible to adopt low cost thin clients (a low-end PC orPDA) to link to the system for the services [5], reducingIT purchasing cost and saving computation power becausethin client devices are easier to setup where the chances ofmalfunction, heat crash, and computer virus are considerably
2 Mathematical Problems in Engineering
low. In addition, easy to use through wireless mobile comput-ing environment gains peoples’ attraction a lot.
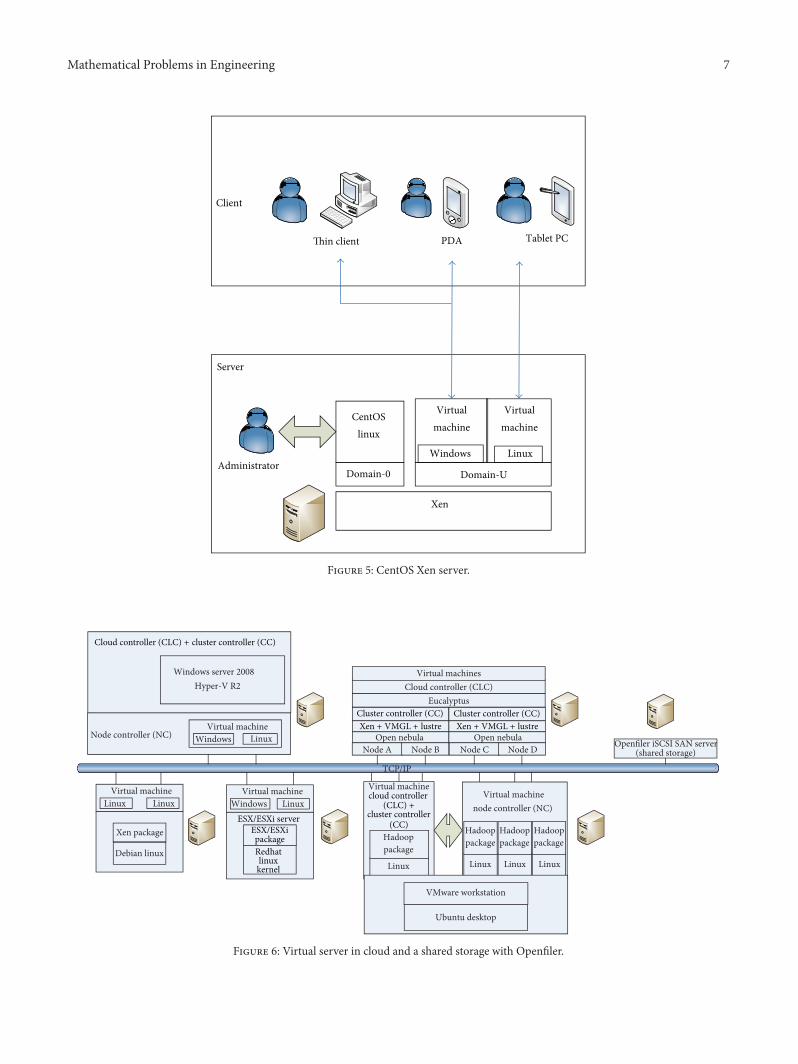
As the virtualization architecture expands continuously,network storage services have become part of the virtual-ization architecture. Openfiler [6] is a storage managementsystem used for disk read/write accessing in a shared storageamong several virtual machines or servers in enterprises. Itis a free and conducive system that supports both network-attached storage (NAS) [7] and storage area network (SAN)[7] functions. As installed, it can be managed via webbrowsers in conjunction with iSCSI shared storage (IPSAN)[7] technique to provide file accessing on cloud computingservers. One can also use logical unit number (LUN) [8]through iSCSI to complete the placement of block accessingfor virtual machines that are created by VMware or Hyper-V.This paper will evaluate the performance of accessing to blockstorage area network with Openfiler.
The goal in this paper also wants to clarify a credibility ofcost and benefits on infrastructure virtualization. Speaking ofvirtualization cost and benefits, we will give the explorationof total cost of ownership (TCO) and return on investment(ROI) individually in the following statements. ROI [9]related to two factors, savings and investment, is equal tosavings/investment, where investment represents the sum ofincremental investment in transition from physical to virtual(new servers, shared storage, software licenses & support, ser-vices and training, etc.). In addition to investment, TCO [10]yet includes IT administration and downtime cost. Appar-ently, ROI and TCO can be properly undertaken well accord-ing to how big infrastructure has been virtualized. In terms ofvirtualization, how many infrastructures can be virtualizedthat intuitively depend on the ratio of the virtual machinesper core (VMs/core), the so-called consolidation ratio [11].The consolidation ratio is a measurement unit that virtualiza-tion vendors use with extreme prudence to provide a roughidea of the server consolidation level that can be achievedon their hypervisors. Virtual infrastructure as we know hasbeen classified into server virtualization and desktop virtual-ization.Wewill explore the consolidation ratio andTCO/ROIfor both server and desktop virtualizations in this study.
In addition, how to appropriately choose the virtualmachine management (i.e., hypervisor) for the desiredserver/desktop virtualization is a really tough problem ofa trade-off between performance and cost before makingthe decision to deploy virtual server in cloud (VSiC) asa new IT. Given five hypervisors used to establish VSiCs,this paper introduces a composite index to represent theevaluated functional performance as well as formulates aproper equation to stand for the estimated virtualization costso that a C/P ration will conclude a careful assessment abouta variety of VSiCs discussed in this paper.
2. Structure of Virtual Machine andShared Storage
The purpose of this session is to setup five different virtualservers in cloud (VSiC) and provide an appropriate assess-ment for every virtual machine monitor (i.e., hypervisor).
Table 1: Hypervisor architecture.
VMM Hypervisor architectureVMware ESXi 5.0 (Redhat Linux) Bare-metal/monolithicMS Hyper-V R2 (Windows Server 2008) Bare-metal/microkernelProxmox VE∗ (Debian) HostedKVM∗ (Ubuntu Enterprise Server) HostedXen∗ (Cent OS) Bare-metal/microkernel∗Open source.
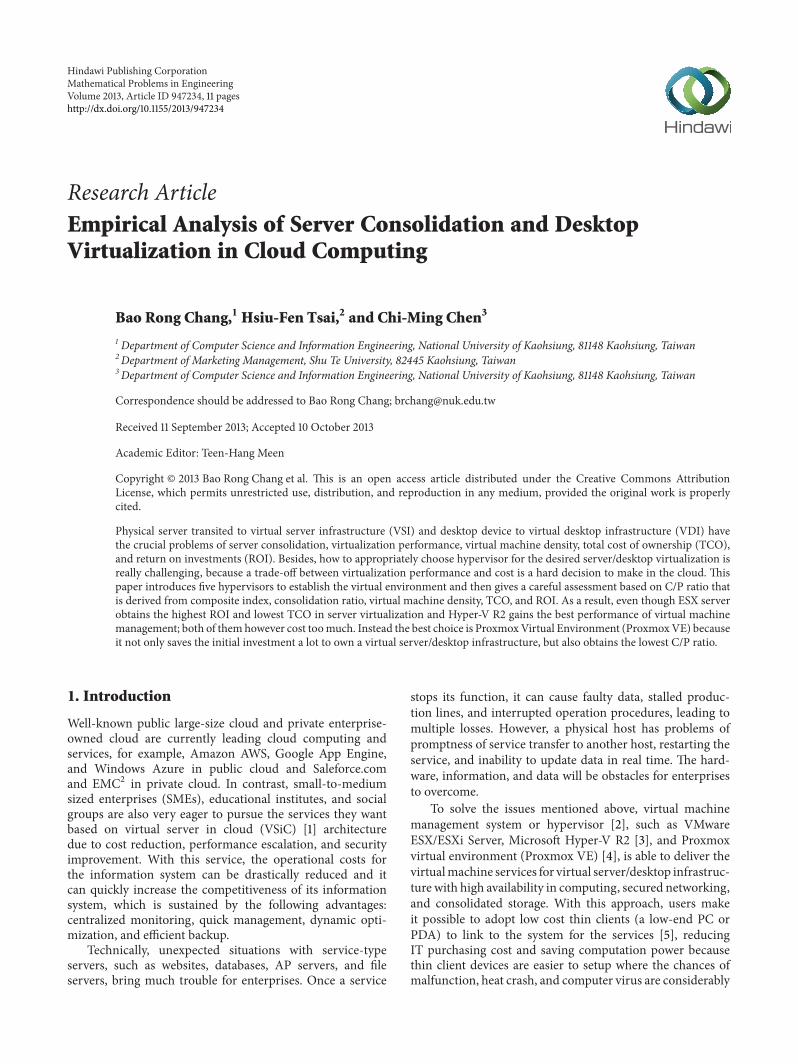
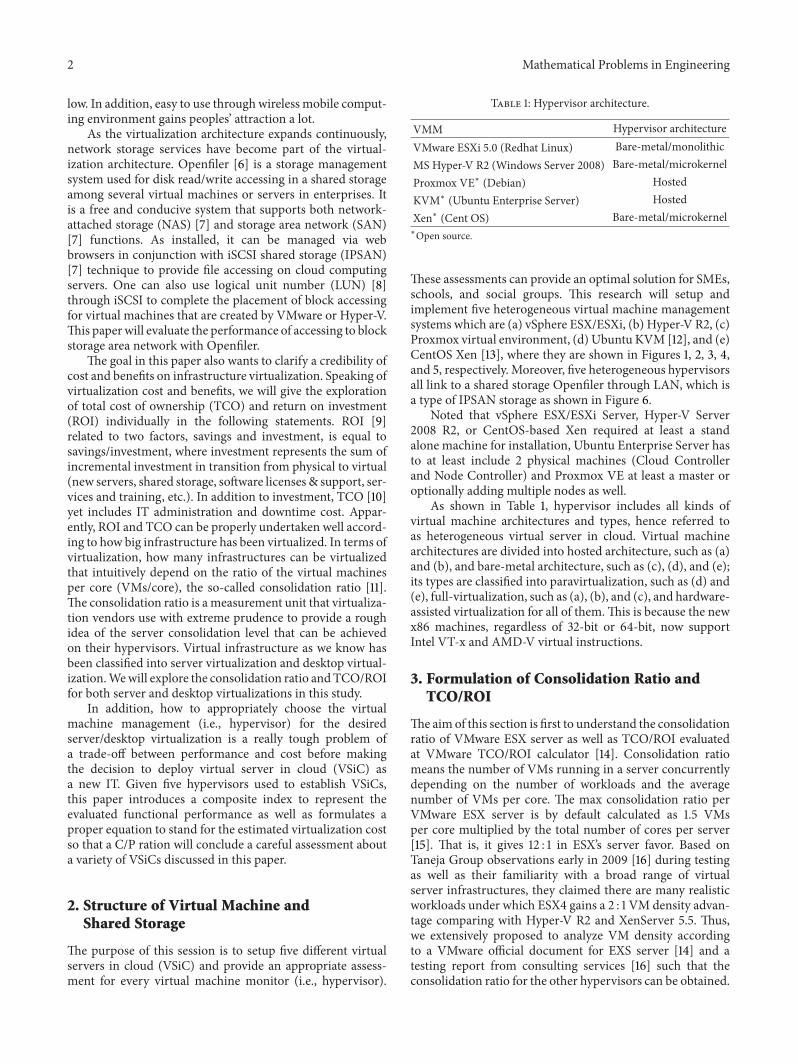
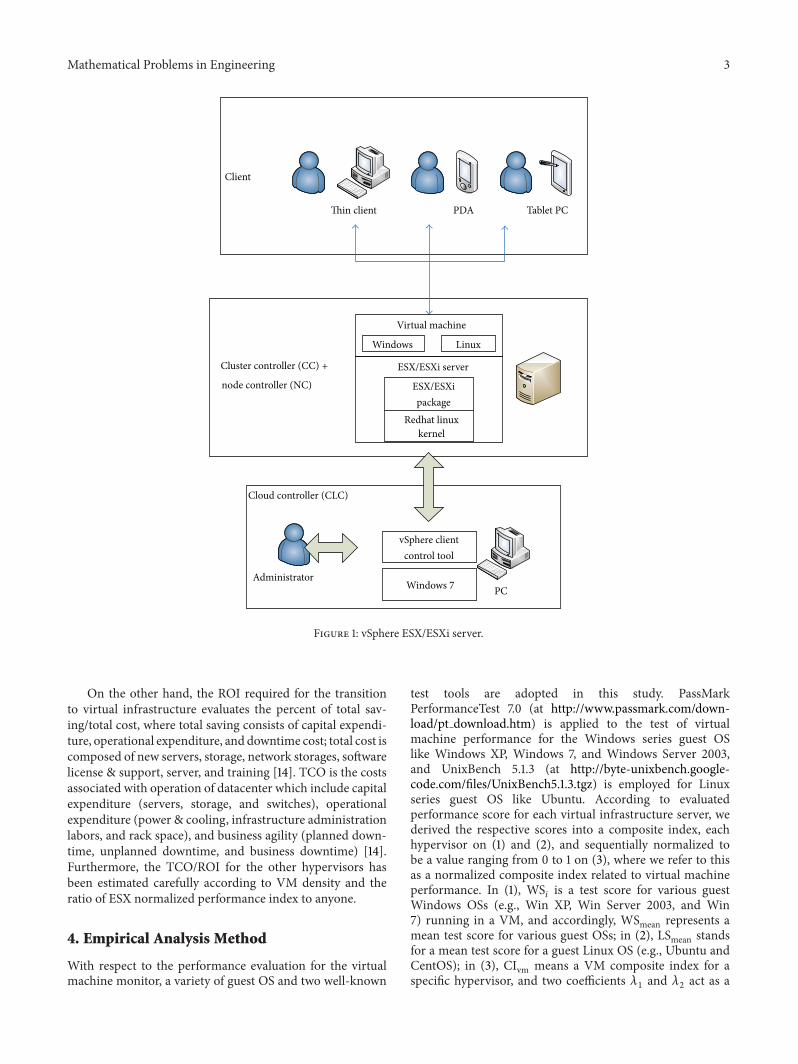
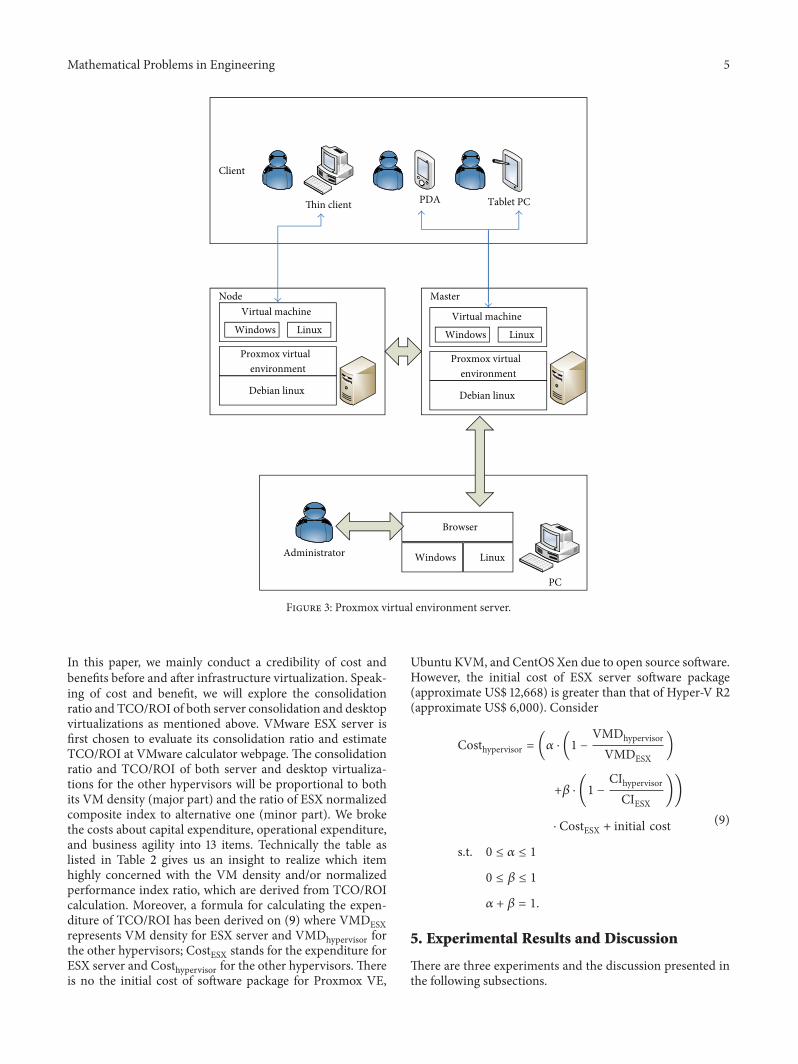
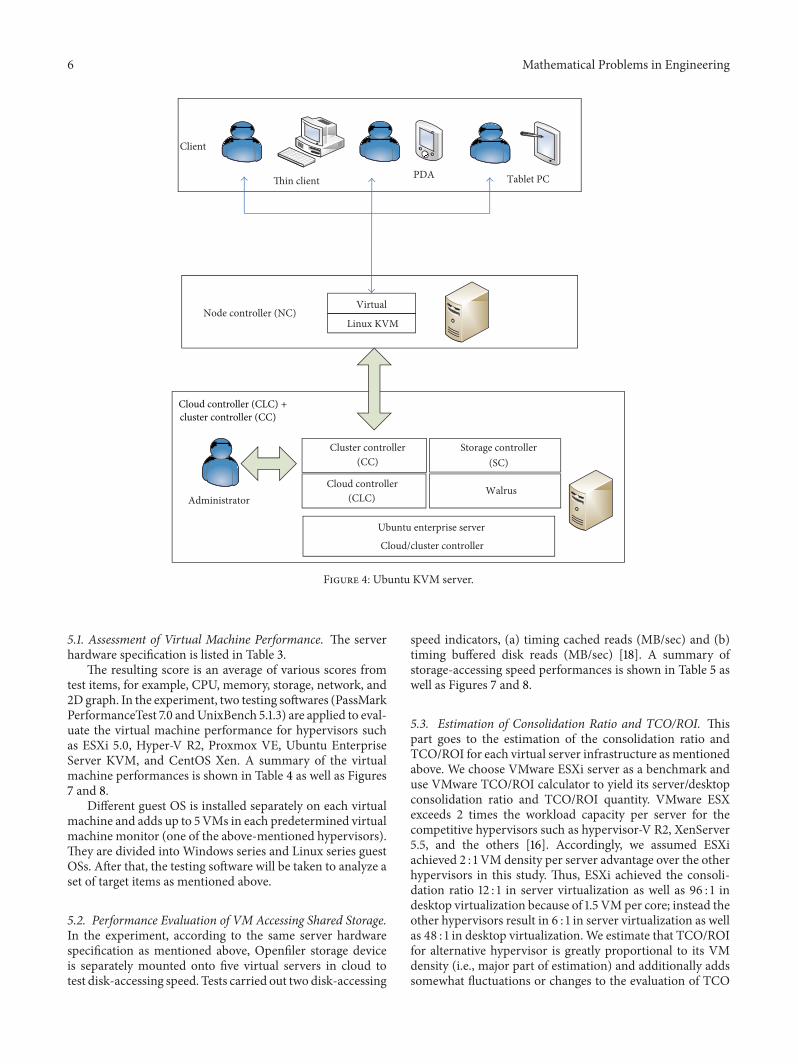
These assessments can provide an optimal solution for SMEs,schools, and social groups. This research will setup andimplement five heterogeneous virtual machine managementsystems which are (a) vSphere ESX/ESXi, (b) Hyper-V R2, (c)Proxmox virtual environment, (d) Ubuntu KVM [12], and (e)CentOS Xen [13], where they are shown in Figures 1, 2, 3, 4,and 5, respectively. Moreover, five heterogeneous hypervisorsall link to a shared storage Openfiler through LAN, which isa type of IPSAN storage as shown in Figure 6.
Noted that vSphere ESX/ESXi Server, Hyper-V Server2008 R2, or CentOS-based Xen required at least a standalone machine for installation, Ubuntu Enterprise Server hasto at least include 2 physical machines (Cloud Controllerand Node Controller) and Proxmox VE at least a master oroptionally adding multiple nodes as well.
As shown in Table 1, hypervisor includes all kinds ofvirtual machine architectures and types, hence referred toas heterogeneous virtual server in cloud. Virtual machinearchitectures are divided into hosted architecture, such as (a)and (b), and bare-metal architecture, such as (c), (d), and (e);its types are classified into paravirtualization, such as (d) and(e), full-virtualization, such as (a), (b), and (c), and hardware-assisted virtualization for all of them.This is because the newx86 machines, regardless of 32-bit or 64-bit, now supportIntel VT-x and AMD-V virtual instructions.
3. Formulation of Consolidation Ratio andTCO/ROI
Theaimof this section is first to understand the consolidationratio of VMware ESX server as well as TCO/ROI evaluatedat VMware TCO/ROI calculator [14]. Consolidation ratiomeans the number of VMs running in a server concurrentlydepending on the number of workloads and the averagenumber of VMs per core. The max consolidation ratio perVMware ESX server is by default calculated as 1.5 VMsper core multiplied by the total number of cores per server[15]. That is, it gives 12 : 1 in ESX’s server favor. Based onTaneja Group observations early in 2009 [16] during testingas well as their familiarity with a broad range of virtualserver infrastructures, they claimed there are many realisticworkloads under which ESX4 gains a 2 : 1 VM density advan-tage comparing with Hyper-V R2 and XenServer 5.5. Thus,we extensively proposed to analyze VM density accordingto a VMware official document for EXS server [14] and atesting report from consulting services [16] such that theconsolidation ratio for the other hypervisors can be obtained.
Mathematical Problems in Engineering 3
Client
Cloud controller (CLC)
Thin client PDA
Administrator
vSphere clientcontrol tool
Tablet PC
Virtual machine
Windows Linux
ESX/ESXi server
Redhat linuxkernel
ESX/ESXipackage
PCWindows 7
Cluster controller (CC) +
node controller (NC)
Figure 1: vSphere ESX/ESXi server.
On the other hand, the ROI required for the transitionto virtual infrastructure evaluates the percent of total sav-ing/total cost, where total saving consists of capital expendi-ture, operational expenditure, and downtime cost; total cost iscomposed of new servers, storage, network storages, softwarelicense & support, server, and training [14]. TCO is the costsassociated with operation of datacenter which include capitalexpenditure (servers, storage, and switches), operationalexpenditure (power & cooling, infrastructure administrationlabors, and rack space), and business agility (planned down-time, unplanned downtime, and business downtime) [14].Furthermore, the TCO/ROI for the other hypervisors hasbeen estimated carefully according to VM density and theratio of ESX normalized performance index to anyone.
4. Empirical Analysis Method
With respect to the performance evaluation for the virtualmachine monitor, a variety of guest OS and two well-known
test tools are adopted in this study. PassMarkPerformanceTest 7.0 (at http://www.passmark.com/down-load/pt download.htm) is applied to the test of virtualmachine performance for the Windows series guest OSlike Windows XP, Windows 7, and Windows Server 2003,and UnixBench 5.1.3 (at http://byte-unixbench.google-code.com/files/UnixBench5.1.3.tgz) is employed for Linuxseries guest OS like Ubuntu. According to evaluatedperformance score for each virtual infrastructure server, wederived the respective scores into a composite index, eachhypervisor on (1) and (2), and sequentially normalized tobe a value ranging from 0 to 1 on (3), where we refer to thisas a normalized composite index related to virtual machineperformance. In (1), WS
𝑖is a test score for various guest
Windows OSs (e.g., Win XP, Win Server 2003, and Win7) running in a VM, and accordingly, WSmean represents amean test score for various guest OSs; in (2), LSmean standsfor a mean test score for a guest Linux OS (e.g., Ubuntu andCentOS); in (3), CIvm means a VM composite index for aspecific hypervisor, and two coefficients 𝜆
1and 𝜆
2act as a
4 Mathematical Problems in Engineering
Hyper-V server 2008 R2
Administrator
Hyper-Vmanager
PCWindows 7
Client
Thin client PDA Tablet PC
Virtual machine
Windows Linux
Cloud controller (CLC)
Cluster controller (CC) +
node controller (NC)
Figure 2: Hyper-V Server 2008 R2 server.
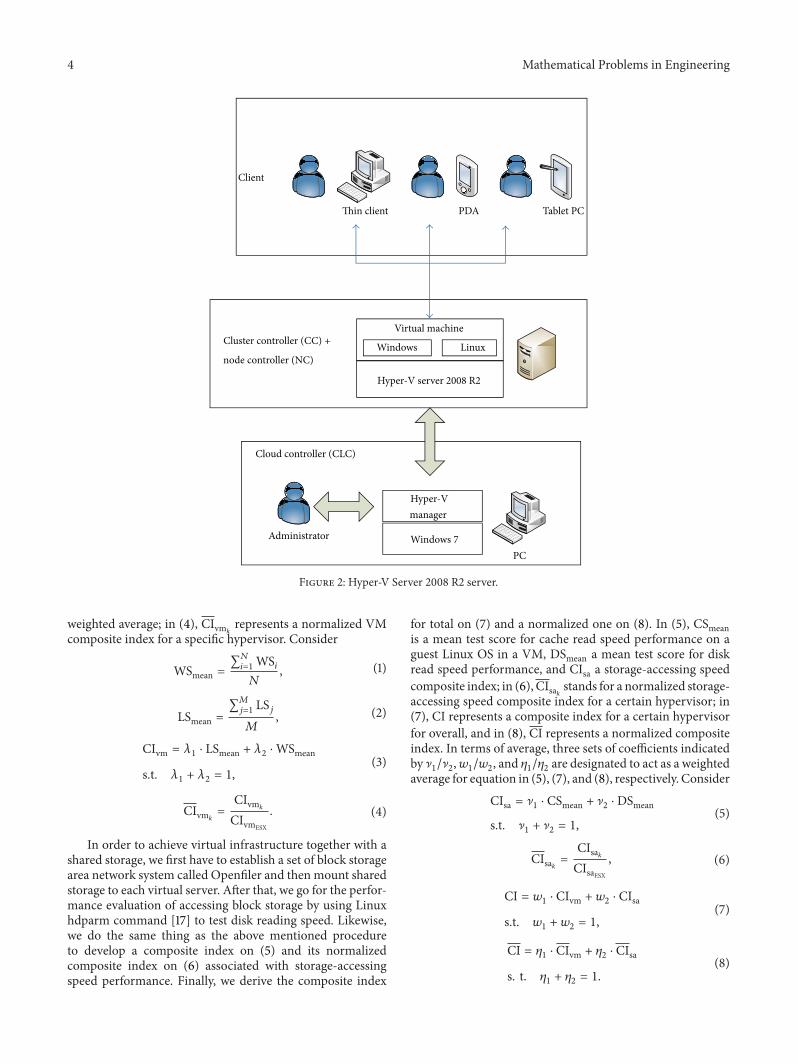
weighted average; in (4), CIvm𝑘 represents a normalized VMcomposite index for a specific hypervisor. Consider
WSmean =∑𝑁
𝑖=1WS𝑖
𝑁, (1)
LSmean =∑𝑀
𝑗=1LS𝑗
𝑀, (2)
CIvm = 𝜆1 ⋅ LSmean + 𝜆2 ⋅WSmean
s.t. 𝜆1+ 𝜆2= 1,
(3)
CIvm𝑘 =CIvm𝑘CIvmESX
. (4)
In order to achieve virtual infrastructure together with ashared storage, we first have to establish a set of block storagearea network system called Openfiler and thenmount sharedstorage to each virtual server. After that, we go for the perfor-mance evaluation of accessing block storage by using Linuxhdparm command [17] to test disk reading speed. Likewise,we do the same thing as the above mentioned procedureto develop a composite index on (5) and its normalizedcomposite index on (6) associated with storage-accessingspeed performance. Finally, we derive the composite index
for total on (7) and a normalized one on (8). In (5), CSmeanis a mean test score for cache read speed performance on aguest Linux OS in a VM, DSmean a mean test score for diskread speed performance, and CIsa a storage-accessing speedcomposite index; in (6), CIsa𝑘 stands for a normalized storage-accessing speed composite index for a certain hypervisor; in(7), CI represents a composite index for a certain hypervisorfor overall, and in (8), CI represents a normalized compositeindex. In terms of average, three sets of coefficients indicatedby ]1/]2,𝑤1/𝑤2, and 𝜂
1/𝜂2are designated to act as a weighted
average for equation in (5), (7), and (8), respectively. ConsiderCIsa = ]1 ⋅ CSmean + ]2 ⋅ DSmean
s.t. ]1+ ]2= 1,
(5)
CIsa𝑘 =CIsa𝑘CIsaESX, (6)
CI = 𝑤1⋅ CIvm + 𝑤2 ⋅ CIsa
s.t. 𝑤1+ 𝑤2= 1,
(7)
CI = 𝜂1⋅ CIvm + 𝜂2 ⋅ CIsa
s. t. 𝜂1+ 𝜂2= 1.
(8)
Mathematical Problems in Engineering 5
Client
Thin client PDA Tablet PC
Administrator
Browser
PC
Windows
NodeVirtual machine
Windows Linux
Proxmox virtualenvironment
Debian linux
Master
Virtual machine
Windows Linux
Proxmox virtualenvironment
Debian linux
Linux
Figure 3: Proxmox virtual environment server.
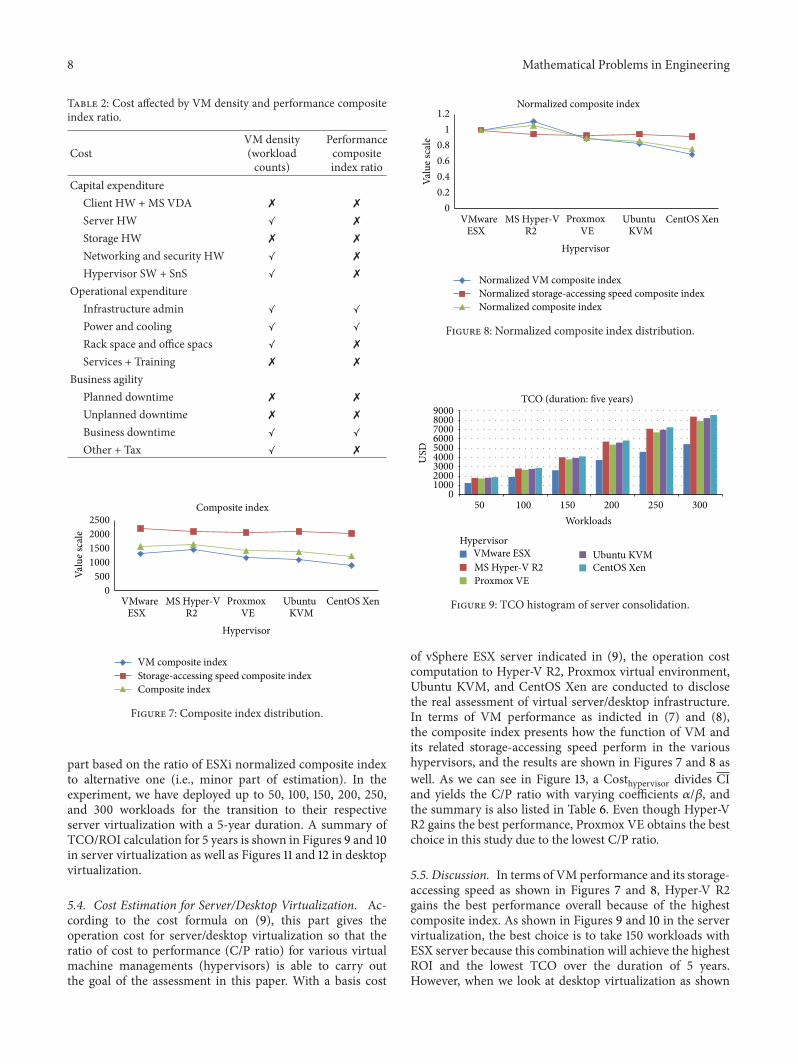
In this paper, we mainly conduct a credibility of cost andbenefits before and after infrastructure virtualization. Speak-ing of cost and benefit, we will explore the consolidationratio and TCO/ROI of both server consolidation and desktopvirtualizations as mentioned above. VMware ESX server isfirst chosen to evaluate its consolidation ratio and estimateTCO/ROI at VMware calculator webpage. The consolidationratio and TCO/ROI of both server and desktop virtualiza-tions for the other hypervisors will be proportional to bothits VM density (major part) and the ratio of ESX normalizedcomposite index to alternative one (minor part). We brokethe costs about capital expenditure, operational expenditure,and business agility into 13 items. Technically the table aslisted in Table 2 gives us an insight to realize which itemhighly concerned with the VM density and/or normalizedperformance index ratio, which are derived from TCO/ROIcalculation. Moreover, a formula for calculating the expen-diture of TCO/ROI has been derived on (9) where VMDESXrepresents VM density for ESX server and VMDhypervisor forthe other hypervisors; CostESX stands for the expenditure forESX server and Costhypervisor for the other hypervisors. Thereis no the initial cost of software package for Proxmox VE,
Ubuntu KVM, and CentOS Xen due to open source software.However, the initial cost of ESX server software package(approximate US$ 12,668) is greater than that of Hyper-V R2(approximate US$ 6,000). Consider
Costhypervisor = (𝛼 ⋅ (1 −VMDhypervisor
VMDESX)
+𝛽 ⋅ (1 −CIhypervisorCIESX
))
⋅ CostESX + initial cost
s.t. 0 ≤ 𝛼 ≤ 1
0 ≤ 𝛽 ≤ 1
𝛼 + 𝛽 = 1.
(9)
5. Experimental Results and Discussion
There are three experiments and the discussion presented inthe following subsections.
6 Mathematical Problems in Engineering
Node controller (NC)
Client
Thin client PDA Tablet PC
Administrator
Virtual
Linux KVM
Ubuntu enterprise server
Cloud/cluster controller
(CC)Cluster controller
Walrus
Storage controller(SC)
Cloud controller(CLC)
Cloud controller (CLC) +cluster controller (CC)
Figure 4: Ubuntu KVM server.
5.1. Assessment of Virtual Machine Performance. The serverhardware specification is listed in Table 3.
The resulting score is an average of various scores fromtest items, for example, CPU, memory, storage, network, and2D graph. In the experiment, two testing softwares (PassMarkPerformanceTest 7.0 andUnixBench 5.1.3) are applied to eval-uate the virtual machine performance for hypervisors suchas ESXi 5.0, Hyper-V R2, Proxmox VE, Ubuntu EnterpriseServer KVM, and CentOS Xen. A summary of the virtualmachine performances is shown in Table 4 as well as Figures7 and 8.
Different guest OS is installed separately on each virtualmachine and adds up to 5VMs in each predetermined virtualmachine monitor (one of the above-mentioned hypervisors).They are divided into Windows series and Linux series guestOSs. After that, the testing software will be taken to analyze aset of target items as mentioned above.
5.2. Performance Evaluation of VM Accessing Shared Storage.In the experiment, according to the same server hardwarespecification as mentioned above, Openfiler storage deviceis separately mounted onto five virtual servers in cloud totest disk-accessing speed. Tests carried out two disk-accessing
speed indicators, (a) timing cached reads (MB/sec) and (b)timing buffered disk reads (MB/sec) [18]. A summary ofstorage-accessing speed performances is shown in Table 5 aswell as Figures 7 and 8.
5.3. Estimation of Consolidation Ratio and TCO/ROI. Thispart goes to the estimation of the consolidation ratio andTCO/ROI for each virtual server infrastructure asmentionedabove. We choose VMware ESXi server as a benchmark anduse VMware TCO/ROI calculator to yield its server/desktopconsolidation ratio and TCO/ROI quantity. VMware ESXexceeds 2 times the workload capacity per server for thecompetitive hypervisors such as hypervisor-V R2, XenServer5.5, and the others [16]. Accordingly, we assumed ESXiachieved 2 : 1 VM density per server advantage over the otherhypervisors in this study. Thus, ESXi achieved the consoli-dation ratio 12 : 1 in server virtualization as well as 96 : 1 indesktop virtualization because of 1.5 VM per core; instead theother hypervisors result in 6 : 1 in server virtualization as wellas 48 : 1 in desktop virtualization. We estimate that TCO/ROIfor alternative hypervisor is greatly proportional to its VMdensity (i.e., major part of estimation) and additionally addssomewhat fluctuations or changes to the evaluation of TCO
Mathematical Problems in Engineering 7
Client
Thin client PDA Tablet PC
Server
CentOSlinux
Xen
AdministratorDomain-UDomain-0
Virtualmachine
Linux
Virtualmachine
Windows
Figure 5: CentOS Xen server.
Virtual machine
Linux
Virtual machinenode controller (NC)
Ubuntu desktop
VMware workstation
Cloud controller (CLC)Eucalyptus
Node A Node B Node C Node D
Debian linux
Xen package
Openfiler iSCSI SAN server(shared storage)
Node controller (NC)Virtual machine
Virtual machines
Open nebula Open nebula
Virtual machine
Windows server 2008Hyper-V R2
Linux
Linux Linux
Windows
Virtual machineLinuxWindows
Cluster controller (CC) Cluster controller (CC)
TCP/IP
ESX/ESXi server
Redhatlinuxkernel
ESX/ESXipackage
Linux Linux Linux
HadooppackageHadoop
package
Hadooppackage
Hadooppackage
Cloud controller (CLC) + cluster controller (CC)
Xen + VMGL + lustre Xen + VMGL + lustre
cluster controller(CC)
cloud controller(CLC) +
Figure 6: Virtual server in cloud and a shared storage with Openfiler.
8 Mathematical Problems in Engineering
Table 2: Cost affected by VM density and performance compositeindex ratio.
CostVM density(workloadcounts)
Performancecompositeindex ratio
Capital expenditureClient HW +MS VDA M M
Server HW ✓ M
Storage HW M M
Networking and security HW ✓ M
Hypervisor SW + SnS ✓ M
Operational expenditureInfrastructure admin ✓ ✓
Power and cooling ✓ ✓
Rack space and office spacs ✓ M
Services + Training M M
Business agilityPlanned downtime M M
Unplanned downtime M M
Business downtime ✓ ✓
Other + Tax ✓ M
0500
1000150020002500
VMwareESX
MS Hyper-VR2
ProxmoxVE
UbuntuKVM
CentOS Xen
Valu
e sca
le
Hypervisor
Composite index
VM composite indexStorage-accessing speed composite indexComposite index
Figure 7: Composite index distribution.
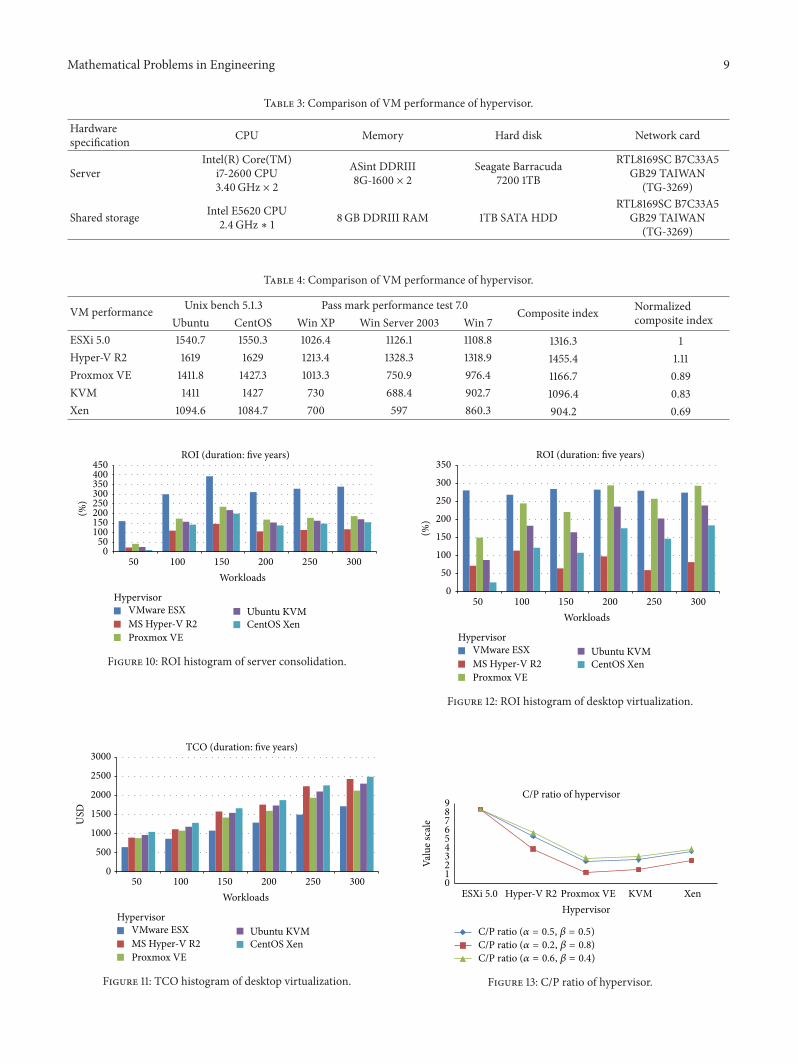
part based on the ratio of ESXi normalized composite indexto alternative one (i.e., minor part of estimation). In theexperiment, we have deployed up to 50, 100, 150, 200, 250,and 300 workloads for the transition to their respectiveserver virtualization with a 5-year duration. A summary ofTCO/ROI calculation for 5 years is shown in Figures 9 and 10in server virtualization as well as Figures 11 and 12 in desktopvirtualization.
5.4. Cost Estimation for Server/Desktop Virtualization. Ac-cording to the cost formula on (9), this part gives theoperation cost for server/desktop virtualization so that theratio of cost to performance (C/P ratio) for various virtualmachine managements (hypervisors) is able to carry outthe goal of the assessment in this paper. With a basis cost
00.20.40.60.8
11.2
Valu
e sca
le
Normalized composite index
Normalized VM composite indexNormalized storage-accessing speed composite indexNormalized composite index
VMwareESX
MS Hyper-VR2
ProxmoxVE
UbuntuKVM
CentOS Xen
Hypervisor
Figure 8: Normalized composite index distribution.
0100020003000400050006000700080009000
50 100 150 200 250 300
USD
Workloads
TCO (duration: five years)
VMware ESXMS Hyper-V R2Proxmox VE
Ubuntu KVMCentOS Xen
Hypervisor
Figure 9: TCO histogram of server consolidation.
of vSphere ESX server indicated in (9), the operation costcomputation to Hyper-V R2, Proxmox virtual environment,Ubuntu KVM, and CentOS Xen are conducted to disclosethe real assessment of virtual server/desktop infrastructure.In terms of VM performance as indicted in (7) and (8),the composite index presents how the function of VM andits related storage-accessing speed perform in the varioushypervisors, and the results are shown in Figures 7 and 8 aswell. As we can see in Figure 13, a Costhypervisor divides CIand yields the C/P ratio with varying coefficients 𝛼/𝛽, andthe summary is also listed in Table 6. Even though Hyper-VR2 gains the best performance, Proxmox VE obtains the bestchoice in this study due to the lowest C/P ratio.
5.5. Discussion. In terms of VM performance and its storage-accessing speed as shown in Figures 7 and 8, Hyper-V R2gains the best performance overall because of the highestcomposite index. As shown in Figures 9 and 10 in the servervirtualization, the best choice is to take 150 workloads withESX server because this combination will achieve the highestROI and the lowest TCO over the duration of 5 years.However, when we look at desktop virtualization as shown
Mathematical Problems in Engineering 9
Table 3: Comparison of VM performance of hypervisor.
Hardwarespecification CPU Memory Hard disk Network card
ServerIntel(R) Core(TM)
i7-2600 CPU3.40GHz × 2
ASint DDRIII8G-1600 × 2
Seagate Barracuda7200 1TB
RTL8169SC B7C33A5GB29 TAIWAN
(TG-3269)
Shared storage Intel E5620 CPU2.4GHz ∗ 1 8GB DDRIII RAM 1TB SATA HDD
RTL8169SC B7C33A5GB29 TAIWAN
(TG-3269)
Table 4: Comparison of VM performance of hypervisor.
VM performance Unix bench 5.1.3 Pass mark performance test 7.0 Composite index Normalizedcomposite indexUbuntu CentOS Win XP Win Server 2003 Win 7
ESXi 5.0 1540.7 1550.3 1026.4 1126.1 1108.8 1316.3 1Hyper-V R2 1619 1629 1213.4 1328.3 1318.9 1455.4 1.11Proxmox VE 1411.8 1427.3 1013.3 750.9 976.4 1166.7 0.89KVM 1411 1427 730 688.4 902.7 1096.4 0.83Xen 1094.6 1084.7 700 597 860.3 904.2 0.69
500
100150200250300350400450
(%)
ROI (duration: five years)
50 100 150 200 250 300Workloads
VMware ESXMS Hyper-V R2Proxmox VE
Ubuntu KVMCentOS Xen
Hypervisor
Figure 10: ROI histogram of server consolidation.
0
500
1000
1500
2000
2500
3000
USD
TCO (duration: five years)
50 100 150 200 250 300Workloads
VMware ESXMS Hyper-V R2Proxmox VE
Ubuntu KVMCentOS Xen
Hypervisor
Figure 11: TCO histogram of desktop virtualization.
0
50
100
150
200
250
300
350
(%)
ROI (duration: five years)
50 100 150 200 250 300Workloads
VMware ESXMS Hyper-V R2Proxmox VE
Ubuntu KVMCentOS Xen
Hypervisor
Figure 12: ROI histogram of desktop virtualization.
0123456789
ESXi 5.0 Hyper-V R2 Proxmox VE KVM Xen
Valu
e sca
le
Hypervisor
C/P ratio of hypervisor
C/P ratio (𝛼 = 0.5, 𝛽 = 0.5)
C/P ratio (𝛼 = 0.2, 𝛽 = 0.8)
C/P ratio (𝛼 = 0.6, 𝛽 = 0.4)
Figure 13: C/P ratio of hypervisor.
10 Mathematical Problems in Engineering
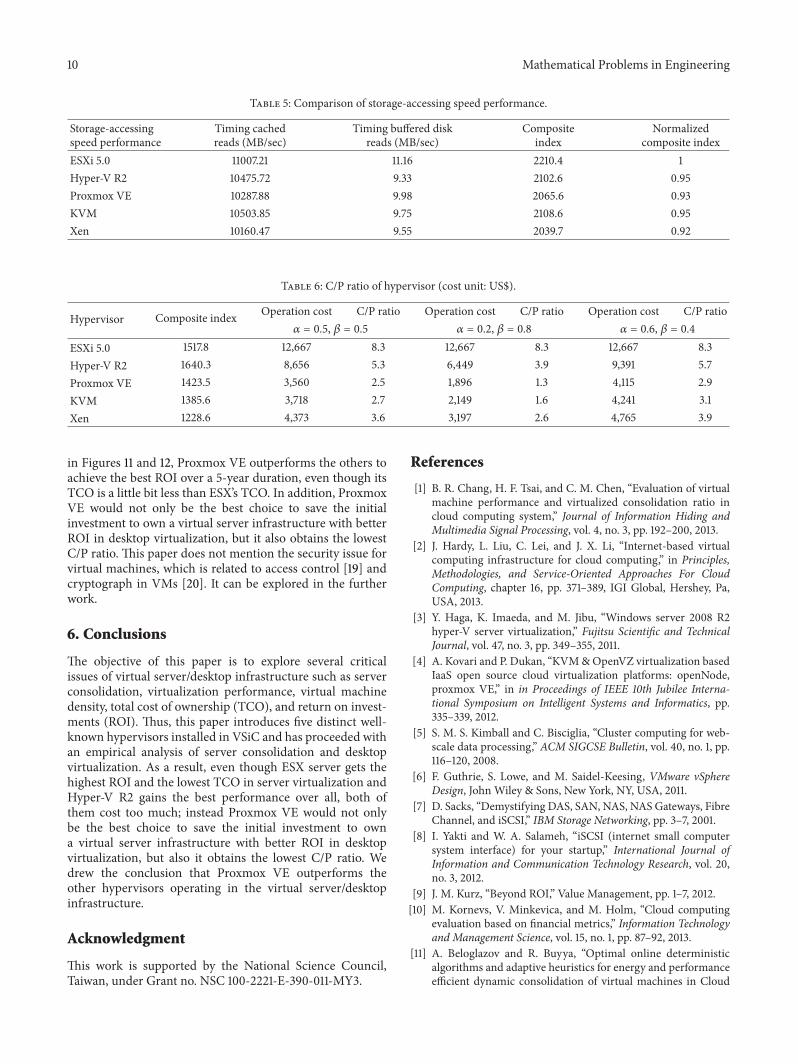
Table 5: Comparison of storage-accessing speed performance.
Storage-accessingspeed performance
Timing cachedreads (MB/sec)
Timing buffered diskreads (MB/sec)
Compositeindex
Normalizedcomposite index
ESXi 5.0 11007.21 11.16 2210.4 1Hyper-V R2 10475.72 9.33 2102.6 0.95Proxmox VE 10287.88 9.98 2065.6 0.93KVM 10503.85 9.75 2108.6 0.95Xen 10160.47 9.55 2039.7 0.92
Table 6: C/P ratio of hypervisor (cost unit: US$).
Hypervisor Composite index Operation cost C/P ratio Operation cost C/P ratio Operation cost C/P ratio𝛼 = 0.5, 𝛽 = 0.5 𝛼 = 0.2, 𝛽 = 0.8 𝛼 = 0.6, 𝛽 = 0.4
ESXi 5.0 1517.8 12,667 8.3 12,667 8.3 12,667 8.3Hyper-V R2 1640.3 8,656 5.3 6,449 3.9 9,391 5.7Proxmox VE 1423.5 3,560 2.5 1,896 1.3 4,115 2.9KVM 1385.6 3,718 2.7 2,149 1.6 4,241 3.1Xen 1228.6 4,373 3.6 3,197 2.6 4,765 3.9
in Figures 11 and 12, Proxmox VE outperforms the others toachieve the best ROI over a 5-year duration, even though itsTCO is a little bit less than ESX’s TCO. In addition, ProxmoxVE would not only be the best choice to save the initialinvestment to own a virtual server infrastructure with betterROI in desktop virtualization, but it also obtains the lowestC/P ratio. This paper does not mention the security issue forvirtual machines, which is related to access control [19] andcryptograph in VMs [20]. It can be explored in the furtherwork.
6. Conclusions
The objective of this paper is to explore several criticalissues of virtual server/desktop infrastructure such as serverconsolidation, virtualization performance, virtual machinedensity, total cost of ownership (TCO), and return on invest-ments (ROI). Thus, this paper introduces five distinct well-known hypervisors installed in VSiC and has proceeded withan empirical analysis of server consolidation and desktopvirtualization. As a result, even though ESX server gets thehighest ROI and the lowest TCO in server virtualization andHyper-V R2 gains the best performance over all, both ofthem cost too much; instead Proxmox VE would not onlybe the best choice to save the initial investment to owna virtual server infrastructure with better ROI in desktopvirtualization, but also it obtains the lowest C/P ratio. Wedrew the conclusion that Proxmox VE outperforms theother hypervisors operating in the virtual server/desktopinfrastructure.
Acknowledgment
This work is supported by the National Science Council,Taiwan, under Grant no. NSC 100-2221-E-390-011-MY3.
References
[1] B. R. Chang, H. F. Tsai, and C. M. Chen, “Evaluation of virtualmachine performance and virtualized consolidation ratio incloud computing system,” Journal of Information Hiding andMultimedia Signal Processing, vol. 4, no. 3, pp. 192–200, 2013.
[2] J. Hardy, L. Liu, C. Lei, and J. X. Li, “Internet-based virtualcomputing infrastructure for cloud computing,” in Principles,Methodologies, and Service-Oriented Approaches For CloudComputing, chapter 16, pp. 371–389, IGI Global, Hershey, Pa,USA, 2013.
[3] Y. Haga, K. Imaeda, and M. Jibu, “Windows server 2008 R2hyper-V server virtualization,” Fujitsu Scientific and TechnicalJournal, vol. 47, no. 3, pp. 349–355, 2011.
[4] A. Kovari and P. Dukan, “KVM&OpenVZ virtualization basedIaaS open source cloud virtualization platforms: openNode,proxmox VE,” in in Proceedings of IEEE 10th Jubilee Interna-tional Symposium on Intelligent Systems and Informatics, pp.335–339, 2012.
[5] S. M. S. Kimball and C. Bisciglia, “Cluster computing for web-scale data processing,” ACM SIGCSE Bulletin, vol. 40, no. 1, pp.116–120, 2008.
[6] F. Guthrie, S. Lowe, and M. Saidel-Keesing, VMware vSphereDesign, John Wiley & Sons, New York, NY, USA, 2011.
[7] D. Sacks, “Demystifying DAS, SAN, NAS, NAS Gateways, FibreChannel, and iSCSI,” IBM Storage Networking, pp. 3–7, 2001.
[8] I. Yakti and W. A. Salameh, “iSCSI (internet small computersystem interface) for your startup,” International Journal ofInformation and Communication Technology Research, vol. 20,no. 3, 2012.
[9] J. M. Kurz, “Beyond ROI,” Value Management, pp. 1–7, 2012.[10] M. Kornevs, V. Minkevica, and M. Holm, “Cloud computing
evaluation based on financial metrics,” Information Technologyand Management Science, vol. 15, no. 1, pp. 87–92, 2013.
[11] A. Beloglazov and R. Buyya, “Optimal online deterministicalgorithms and adaptive heuristics for energy and performanceefficient dynamic consolidation of virtual machines in Cloud
Mathematical Problems in Engineering 11
data centers,” Concurrency and Computation, vol. 24, no. 13, pp.1397–1420, 2012.
[12] S. Simanta, G. A. Lewis, E. J. Morris, K. Ha, and M. Satya-narayanan, “Cloud computing at the tactical edge,” SoftwareEngineering Institute 680, 2012.
[13] B. K. Kim, K. W. Hur, J. H. Jang, and Y. W. Ko, “Feedbackscheduling for realtime task on Xen virtual machine,” Commu-nications in Computer and Information Science, vol. 266, no. 2,pp. 283–291, 2011.
[14] VMware TCO/ROI Calculator, VMware, http://roitco.vmware.com/vmw/.
[15] Frequently Asked Questions, Report of VMware ROI TCOCalculator, Version 2.0, VMware, 2013.
[16] TANEJA Group Technology Analysis, “Evaluating the ESX 4Hypervisor and VM Density Advantage,” Technology Valida-tion, pp. 1–12, 2009.
[17] M. Tabuchi, K.-I. Itoh, Y. Nomura, and H. Taniguchi, “Designand evaluation of a system for running two coexisting linuxsystems,” Electronics and Communications in Japan, vol. 90, no.9, pp. 56–68, 2007.
[18] M. Aboutabl, A. Agrawala, and J. D. Decotignie, “Temporallydeterminate disk access (extended abstract): an experimentalapproach,”ACMSIGMETRICS Performance Evaluation Review,vol. 26, no. 1, pp. 280–281, 1998.
[19] S. Prabhakar, S. Pankanti, and A. K. Jain, “Biometric recogni-tion: security and privacy concerns,” IEEE Security and Privacy,vol. 1, no. 2, pp. 33–42, 2003.
[20] R. L. Krutz and R. D. Scott Lowe Vines, Cloud Security: AComprehensive Guide to Secure Cloud Computing, John Wiley& Sons, New York, NY, USA, 2010.

Submit your manuscripts athttp://www.hindawi.com
Hindawi Publishing Corporationhttp://www.hindawi.com Volume 2014
MathematicsJournal of
Hindawi Publishing Corporationhttp://www.hindawi.com Volume 2014
Mathematical Problems in Engineering
Hindawi Publishing Corporationhttp://www.hindawi.com
Differential EquationsInternational Journal of
Volume 2014
Applied MathematicsJournal of
Hindawi Publishing Corporationhttp://www.hindawi.com Volume 2014
Probability and StatisticsHindawi Publishing Corporationhttp://www.hindawi.com Volume 2014
Journal of
Hindawi Publishing Corporationhttp://www.hindawi.com Volume 2014
Mathematical PhysicsAdvances in
Complex AnalysisJournal of
Hindawi Publishing Corporationhttp://www.hindawi.com Volume 2014
OptimizationJournal of
Hindawi Publishing Corporationhttp://www.hindawi.com Volume 2014
CombinatoricsHindawi Publishing Corporationhttp://www.hindawi.com Volume 2014
International Journal of
Hindawi Publishing Corporationhttp://www.hindawi.com Volume 2014
Operations ResearchAdvances in
Journal of
Hindawi Publishing Corporationhttp://www.hindawi.com Volume 2014
Function Spaces
Abstract and Applied AnalysisHindawi Publishing Corporationhttp://www.hindawi.com Volume 2014
International Journal of Mathematics and Mathematical Sciences
Hindawi Publishing Corporationhttp://www.hindawi.com Volume 2014
The Scientific World JournalHindawi Publishing Corporation http://www.hindawi.com Volume 2014
Hindawi Publishing Corporationhttp://www.hindawi.com Volume 2014
Algebra
Discrete Dynamics in Nature and Society
Hindawi Publishing Corporationhttp://www.hindawi.com Volume 2014
Hindawi Publishing Corporationhttp://www.hindawi.com Volume 2014
Decision SciencesAdvances in
Discrete MathematicsJournal of
Hindawi Publishing Corporationhttp://www.hindawi.com
Volume 2014 Hindawi Publishing Corporationhttp://www.hindawi.com Volume 2014
Stochastic AnalysisInternational Journal of