representations and information visualization characteristics of good representations information...
Post on 21-Dec-2015
228 views
TRANSCRIPT
Representations andinformation visualization
Characteristics of good representationsInformation visualization
guidelinesvisual information-seeking mantratechniques
Slide deck by Saul Greenberg. Permission is granted to use this for non-commercial purposes as long as general credit to Saul Greenberg is clearly maintained. Warning: some material in this deck is used from other sources without permission. Credit to the original source is given if it is known.
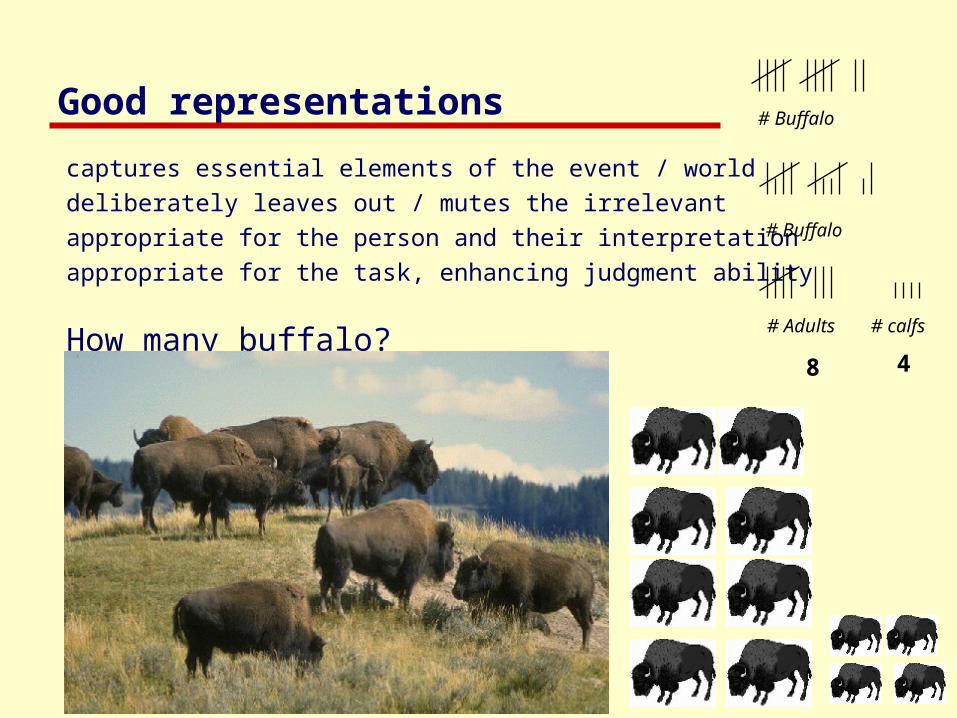
Good representations
captures essential elements of the event / worlddeliberately leaves out / mutes the irrelevantappropriate for the person and their interpretationappropriate for the task, enhancing judgment ability
How many buffalo?
# Buffalo
# Adults # calfs
# Buffalo
8 4
Saul Greenberg
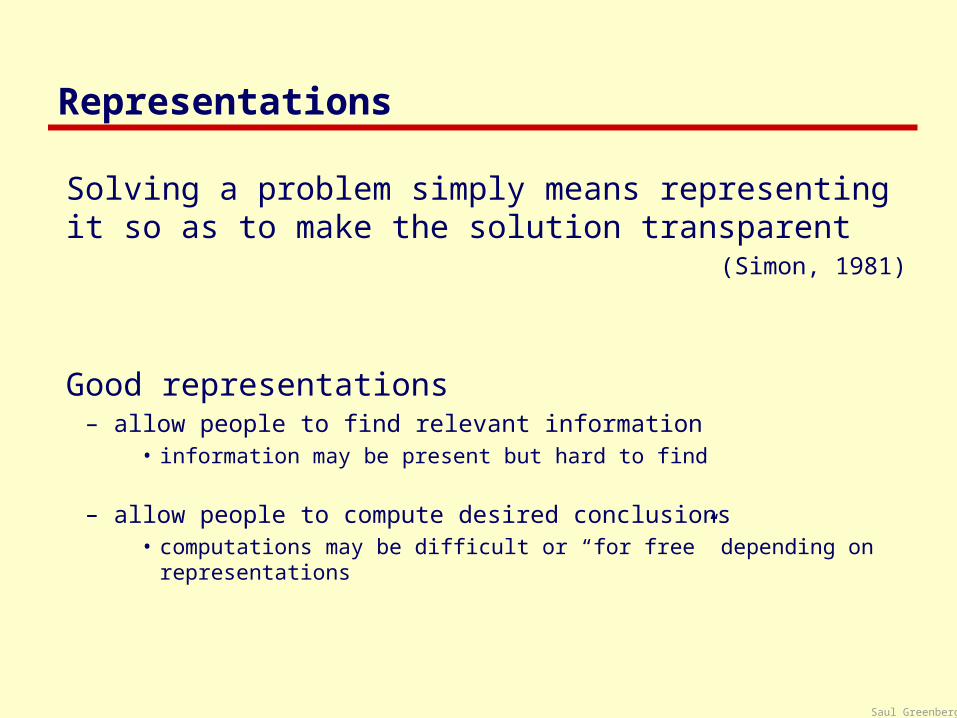
Representations
Solving a problem simply means representing it so as to make the solution transparent
(Simon, 1981)
Good representations– allow people to find relevant information
• information may be present but hard to find
– allow people to compute desired conclusions• computations may be difficult or “for free” depending on
representations
Saul Greenberg
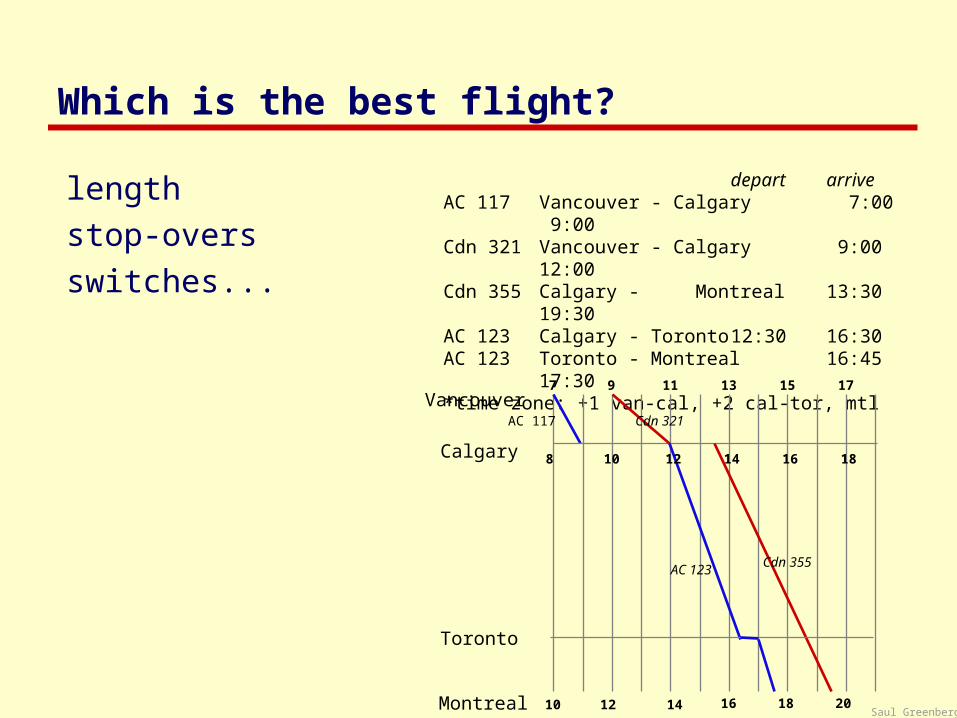
Which is the best flight?
depart arriveAC 117 Vancouver - Calgary 7:00 9:00Cdn 321 Vancouver - Calgary 9:00 12:00Cdn 355 Calgary - Montreal 13:30 19:30AC 123 Calgary - Toronto 12:30 16:30AC 123 Toronto - Montreal 16:45 17:30*time zone: +1 van-cal, +2 cal-tor, mtl
lengthstop-oversswitches...
7 9 11 13 15 17
10 12 14 16 18 20
Vancouver
8 10 12 14 16 18
AC 117 Cdn 321
Cdn 355AC 123
Calgary
Toronto
Montreal
Saul Greenberg
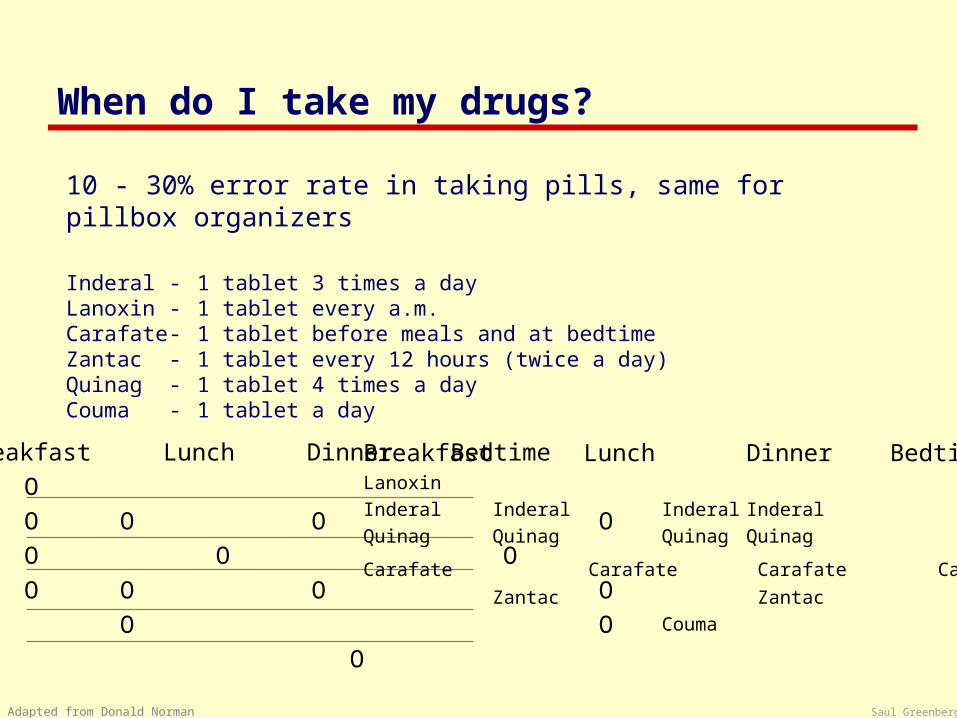
When do I take my drugs?
10 - 30% error rate in taking pills, same for pillbox organizers
Inderal - 1 tablet 3 times a dayLanoxin - 1 tablet every a.m.Carafate - 1 tablet before meals and at bedtimeZantac - 1 tablet every 12 hours (twice a day)Quinag - 1 tablet 4 times a dayCouma - 1 tablet a day
Breakfast Lunch Dinner Bedtime
Lanoxin O
Inderal O O O O
Quinag O O O O
Carafate O O O O
Zantac O O
Couma O
Breakfast Lunch Dinner BedtimeLanoxin
Inderal Inderal Inderal Inderal
Quinag Quinag Quinag Quinag
Carafate Carafate Carafate Carafate Zantac Zantac
Couma
Adapted from Donald Norman
Saul Greenberg
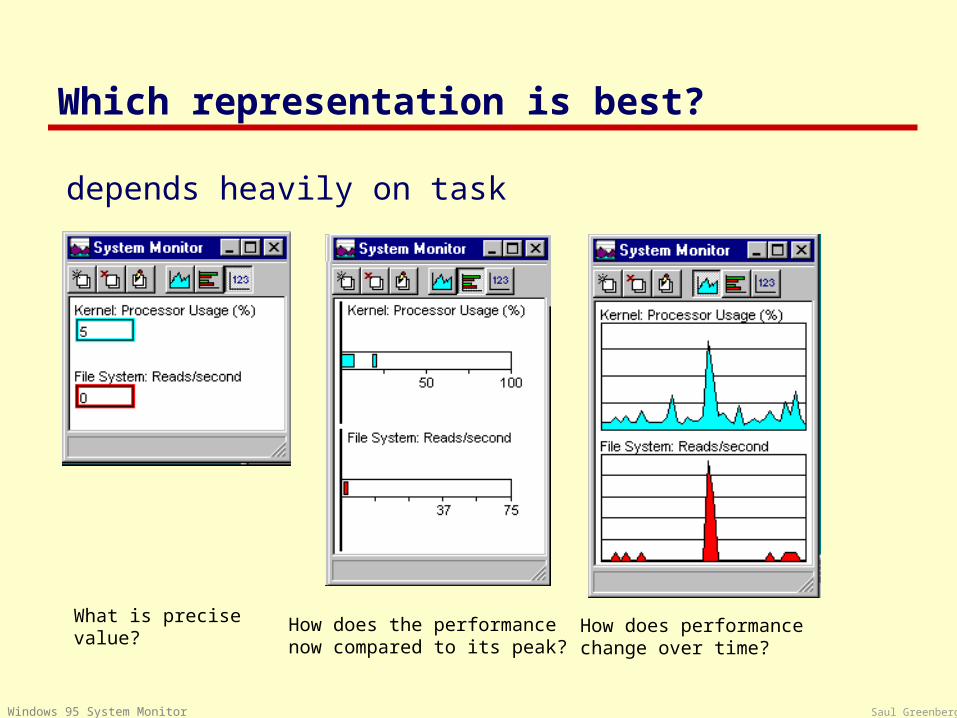
Which representation is best?
depends heavily on task
What is precise value?
How does the performancenow compared to its peak?
How does performancechange over time?
Windows 95 System Monitor
Saul Greenberg
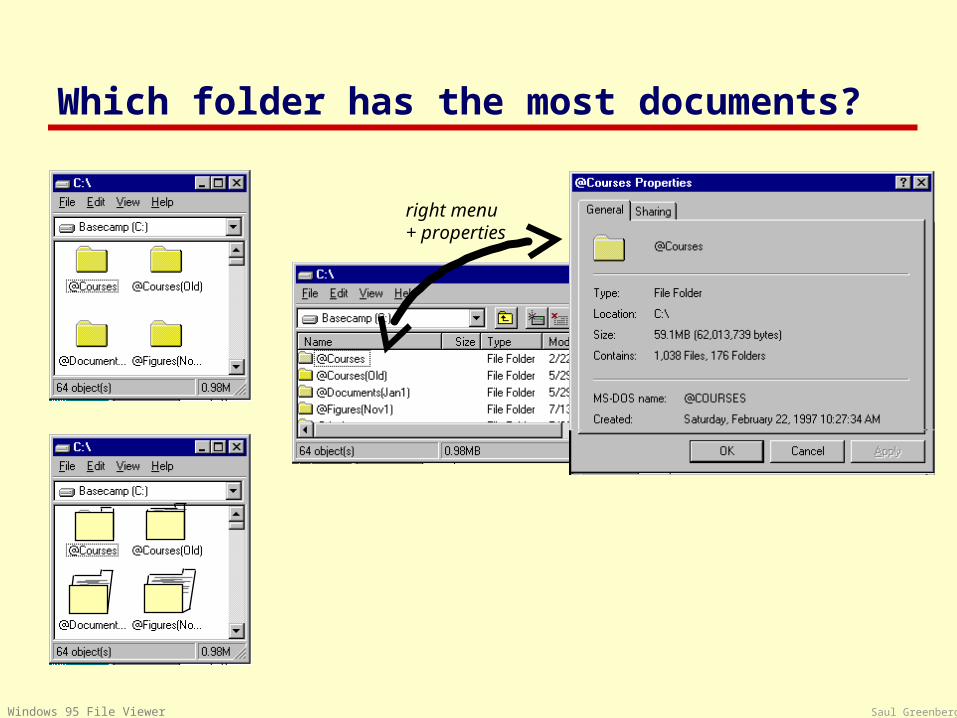
right menu+ properties
Which folder has the most documents?
Windows 95 File Viewer
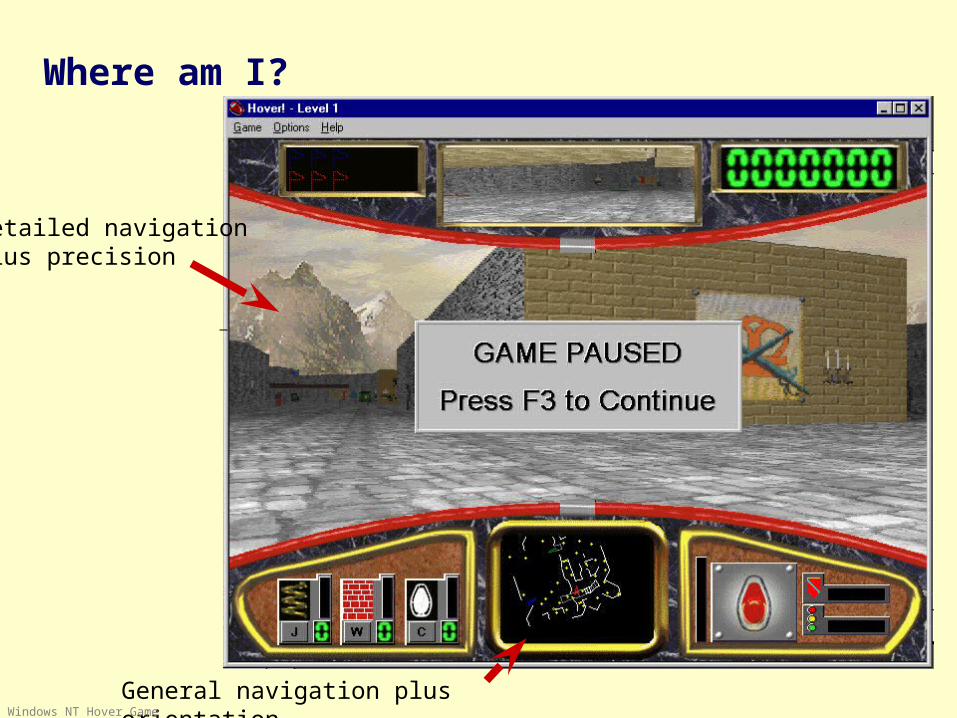
Detailed navigationplus precision
General navigation plus orientation
Where am I?
Windows NT Hover Game
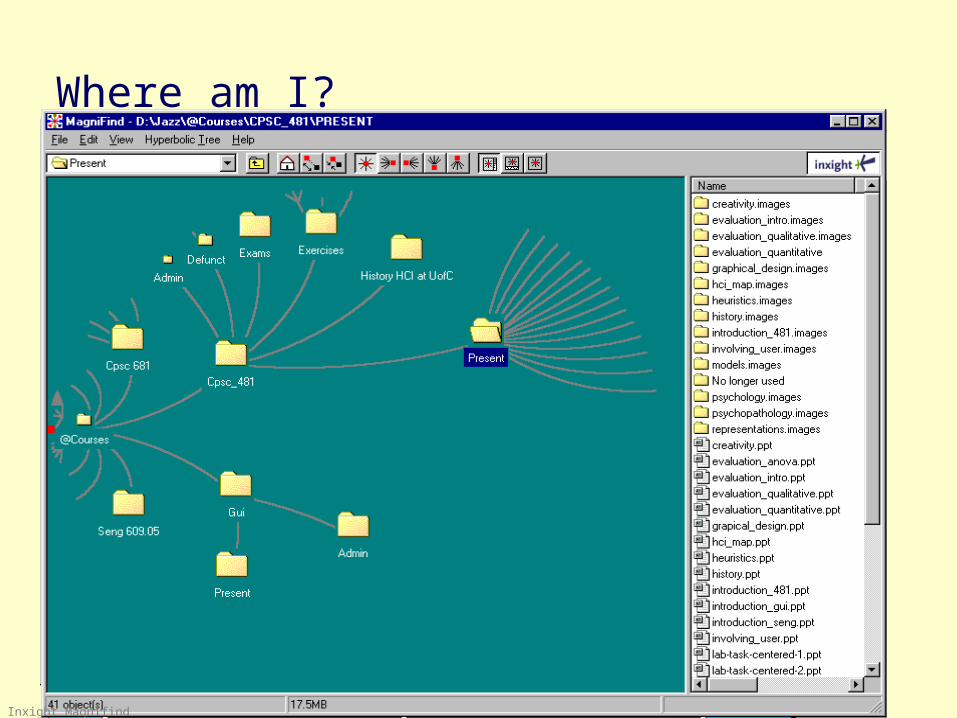
Where am I?
Inxight Magnifind
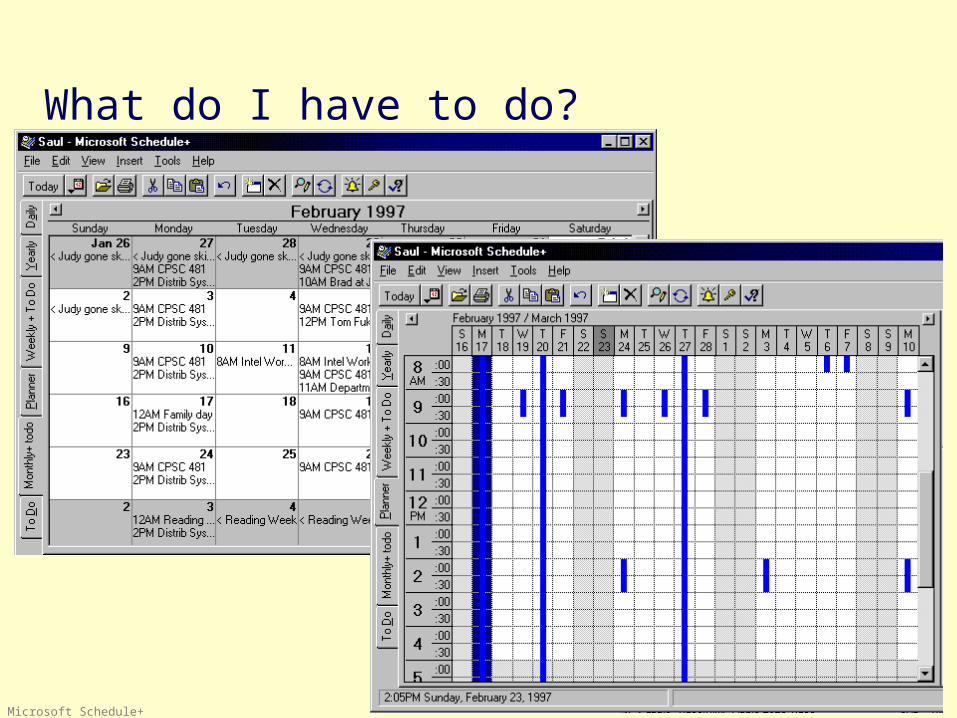
What do I have to do?
Microsoft Schedule+
Saul Greenberg
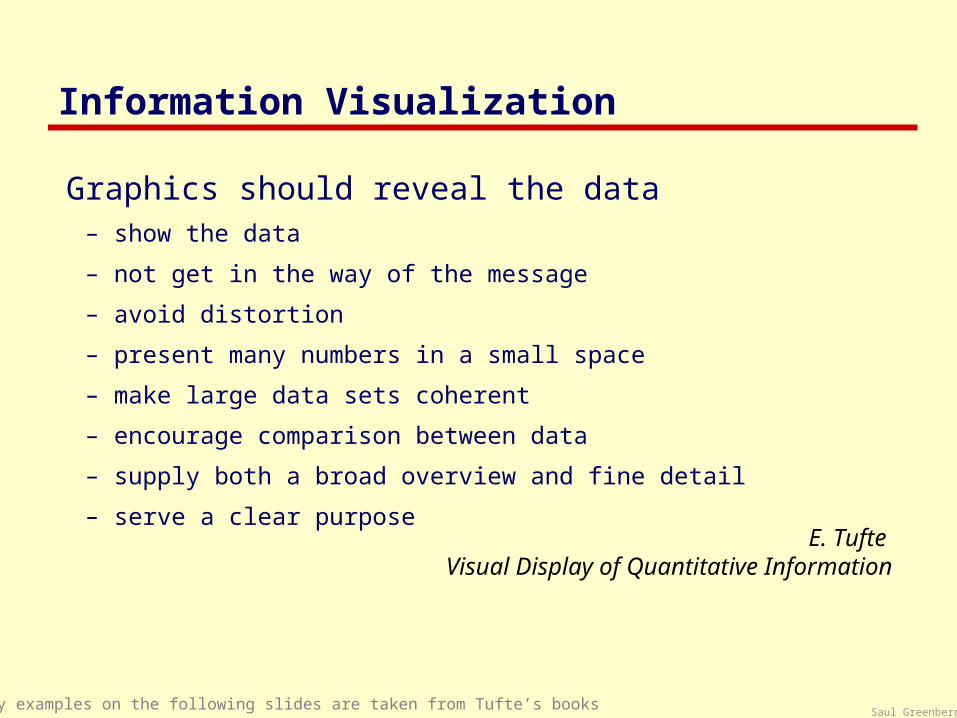
Information Visualization
Graphics should reveal the data– show the data
– not get in the way of the message
– avoid distortion
– present many numbers in a small space
– make large data sets coherent
– encourage comparison between data
– supply both a broad overview and fine detail
– serve a clear purposeE. Tufte
Visual Display of Quantitative Information
many examples on the following slides are taken from Tufte’s books
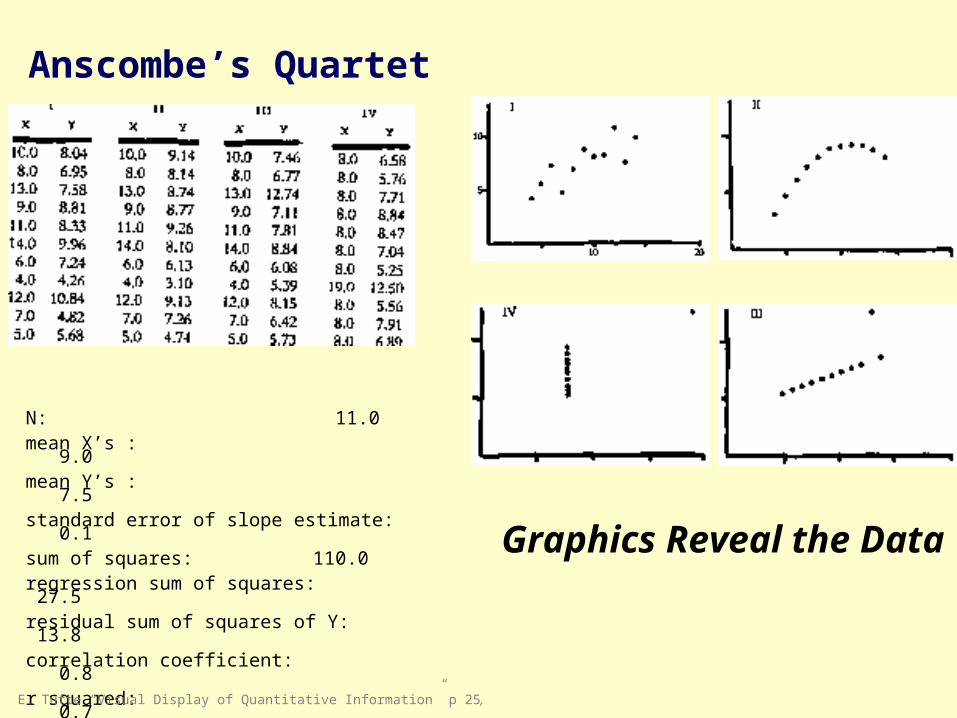
Anscombe’s Quartet
N: 11.0mean X’s : 9.0mean Y’s : 7.5standard error of slope estimate: 0.1sum of squares: 110.0regression sum of squares: 27.5residual sum of squares of Y: 13.8correlation coefficient: 0.8r squared: 0.7regression line: Y=3+0.5X
Graphics Reveal the Data
E. Tufte “Visual Display of Quantitative Information” p 25,
Saul Greenberg
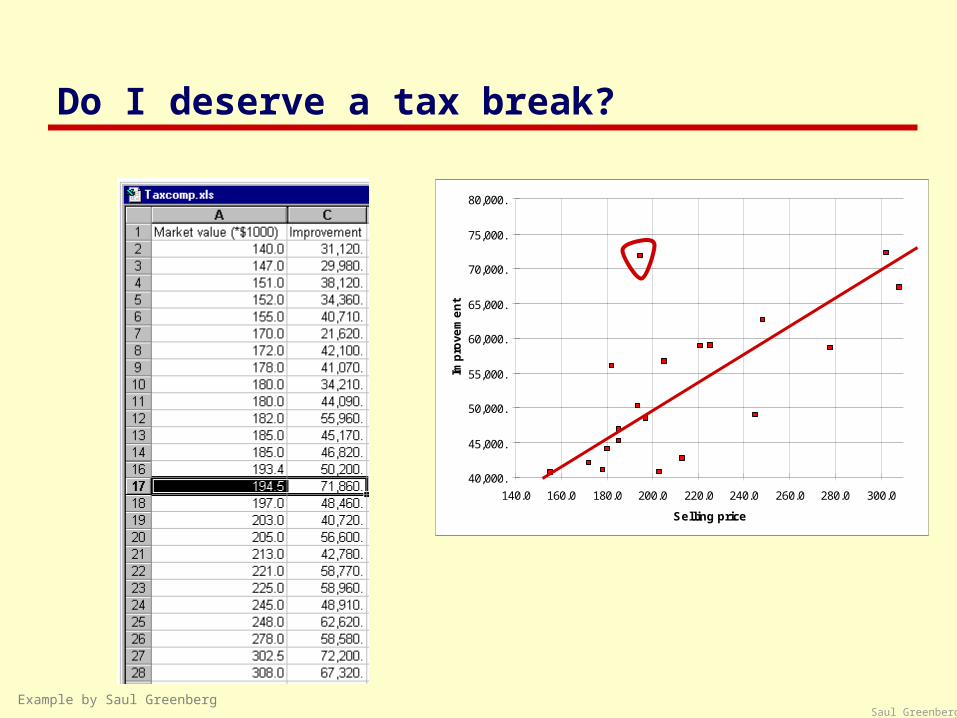
40,000.
45,000.
50,000.
55,000.
60,000.
65,000.
70,000.
75,000.
80,000.
140.0 160.0 180.0 200.0 220.0 240.0 260.0 280.0 300.0
Selling price
Impro
vem
ent
Do I deserve a tax break?
Example by Saul Greenberg
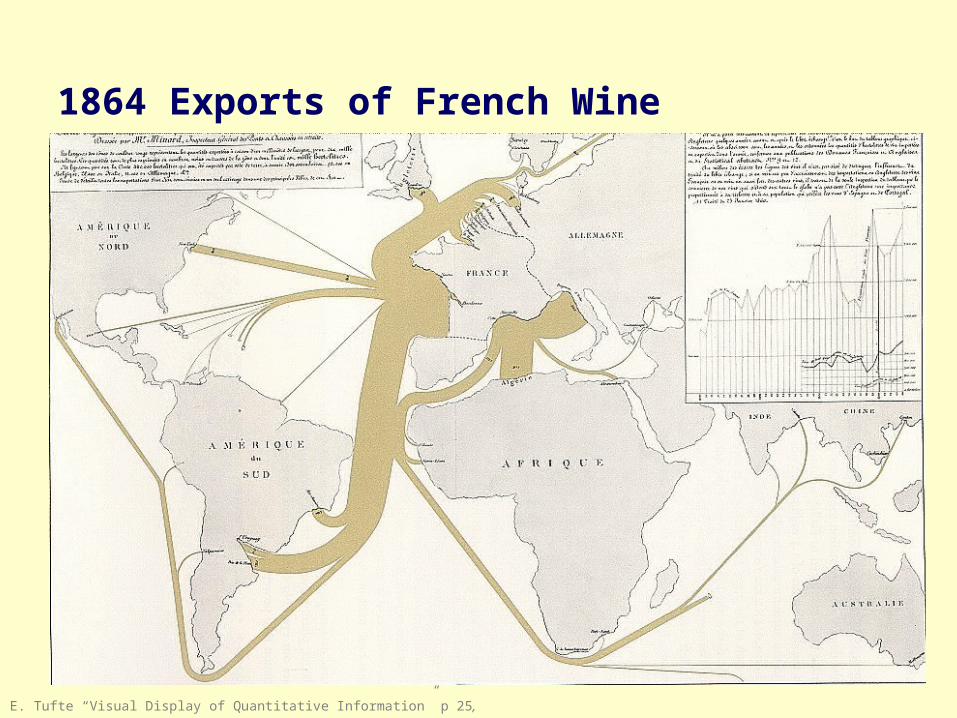
1864 Exports of French Wine
E. Tufte “Visual Display of Quantitative Information” p 25,
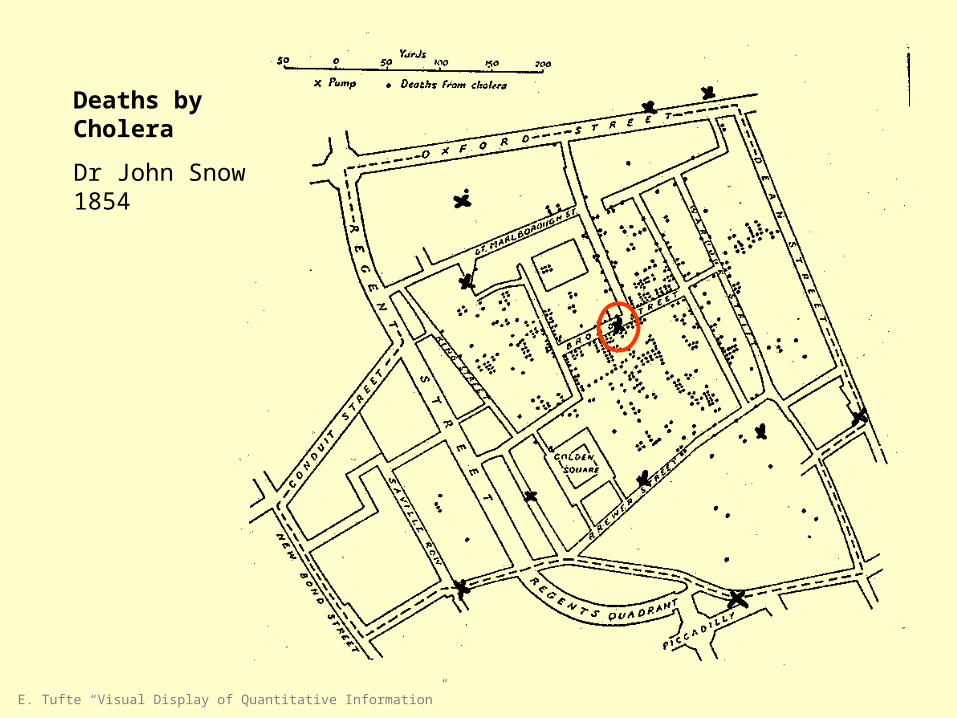
Deaths by Cholera
Dr John Snow1854
E. Tufte “Visual Display of Quantitative Information”
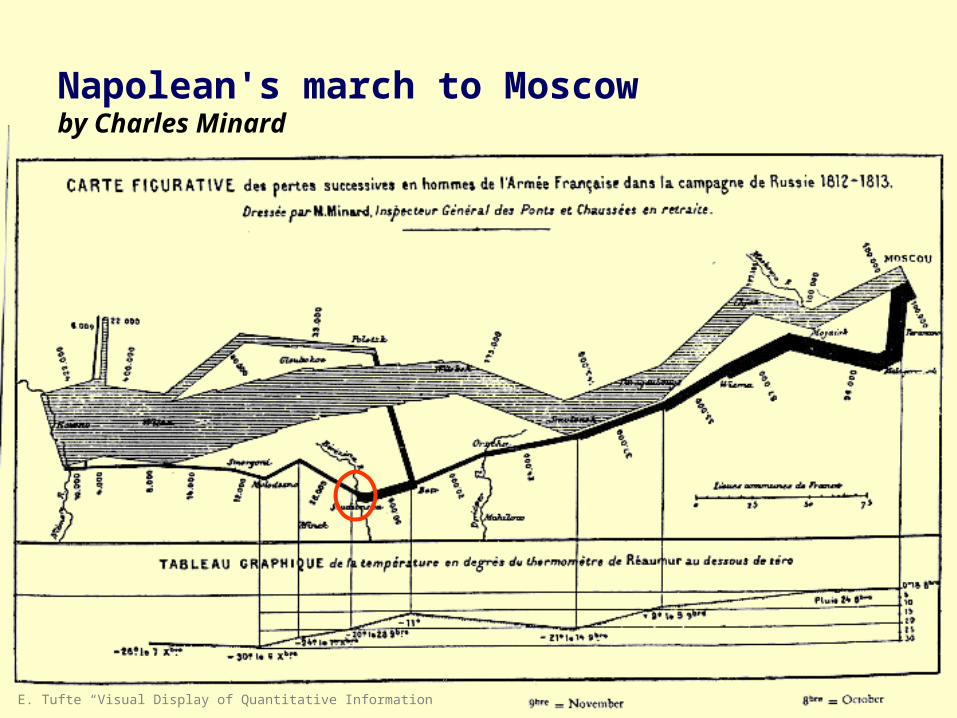
Napolean's march to Moscow by Charles Minard
E. Tufte “Visual Display of Quantitative Information”
Saul Greenberg
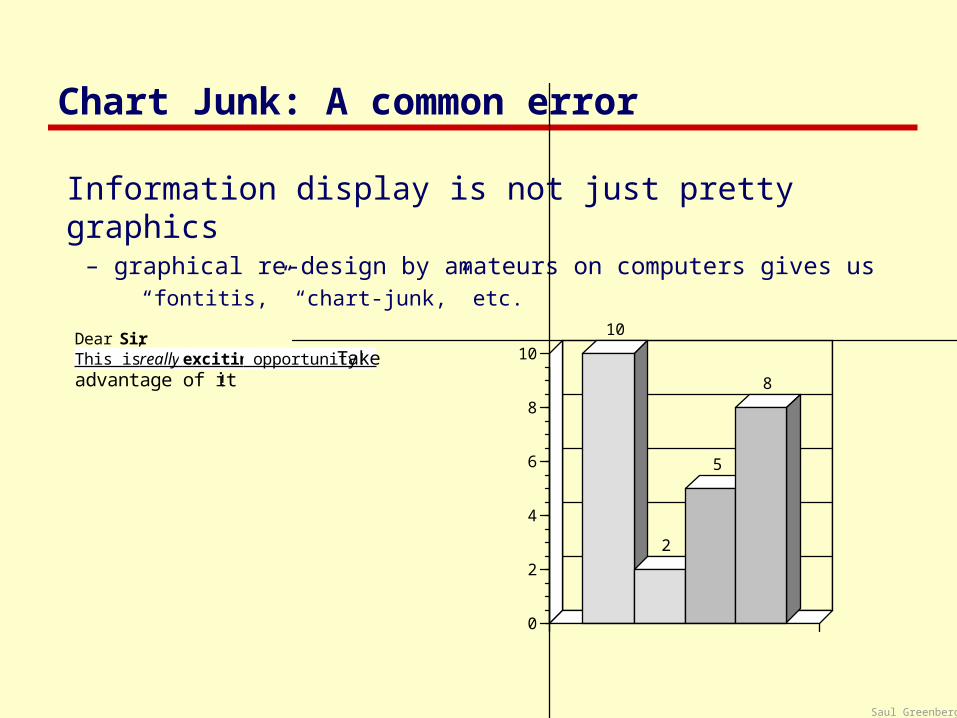
Chart Junk: A common error
Information display is not just pretty graphics– graphical re-design by amateurs on computers gives us
“fontitis,” “chart-junk,” etc.
10
2
5
8
0
2
4
6
8
10Dear Sir; This is a really exciting opportunity! Take advantage of it!
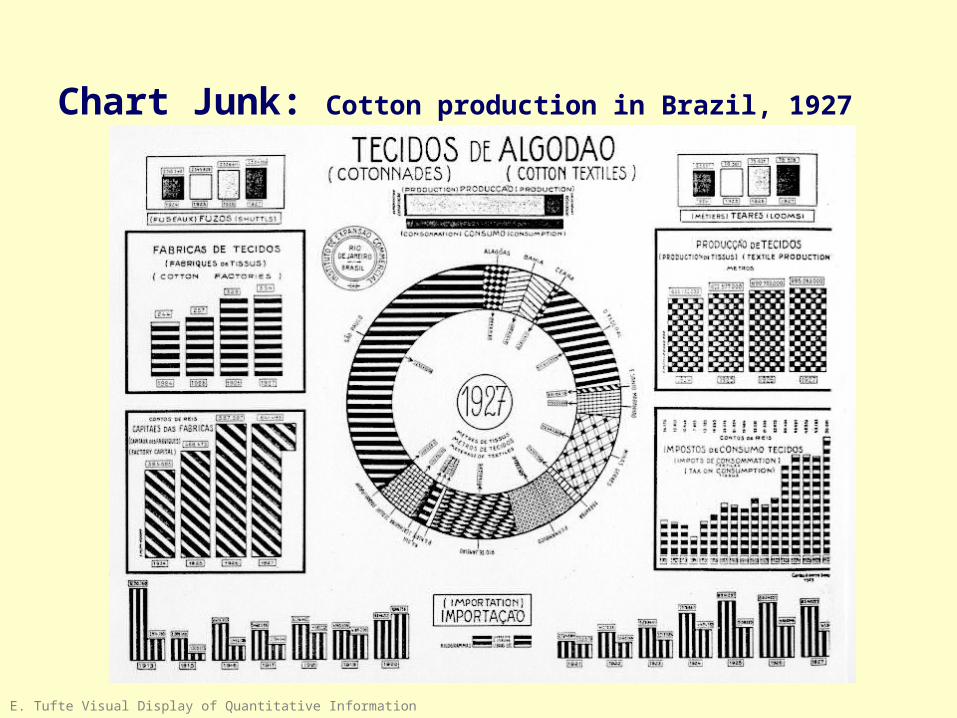
Chart Junk: Cotton production in Brazil, 1927
E. Tufte Visual Display of Quantitative Information
Saul Greenberg
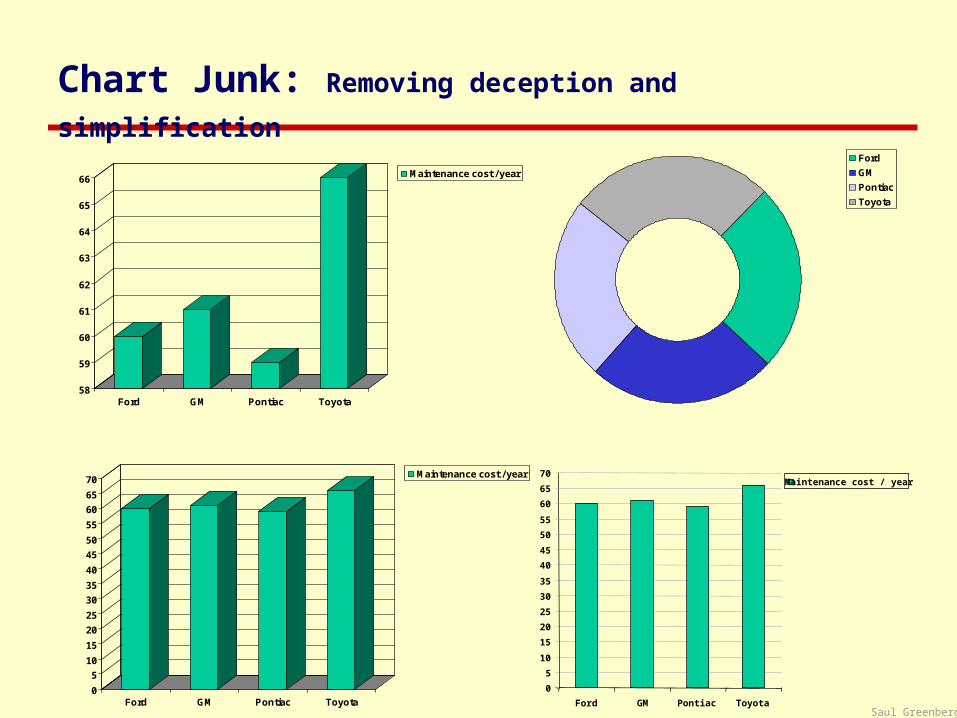
Chart Junk: Removing deception and simplification
58
59
60
61
62
63
64
65
66
Ford GM Pontiac Toyota
Maintenance cost / year
0
5
10
15
20
25
30
35
40
45
50
55
60
65
70
Ford GM Pontiac Toyota
Maintenance cost / year
Ford
GM
Pontiac
Toyota
0
5
10
15
20
25
30
35
40
45
50
55
60
65
70
Ford GM Pontiac Toyota
Maintenance cost / year
Saul Greenberg
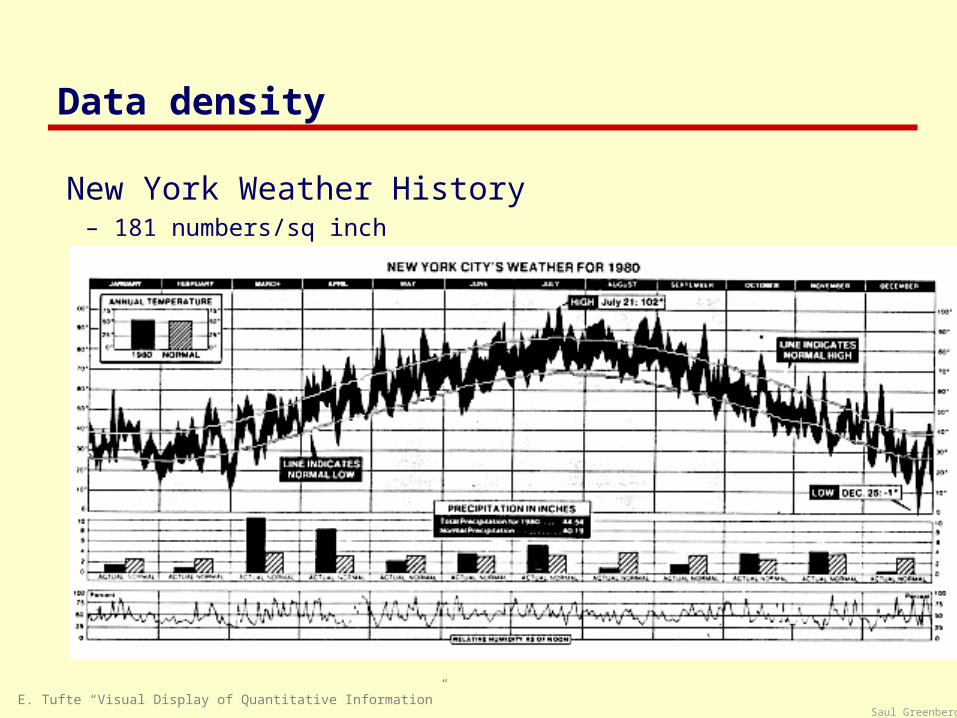
Data density
New York Weather History– 181 numbers/sq inch
E. Tufte “Visual Display of Quantitative Information”
Saul Greenberg
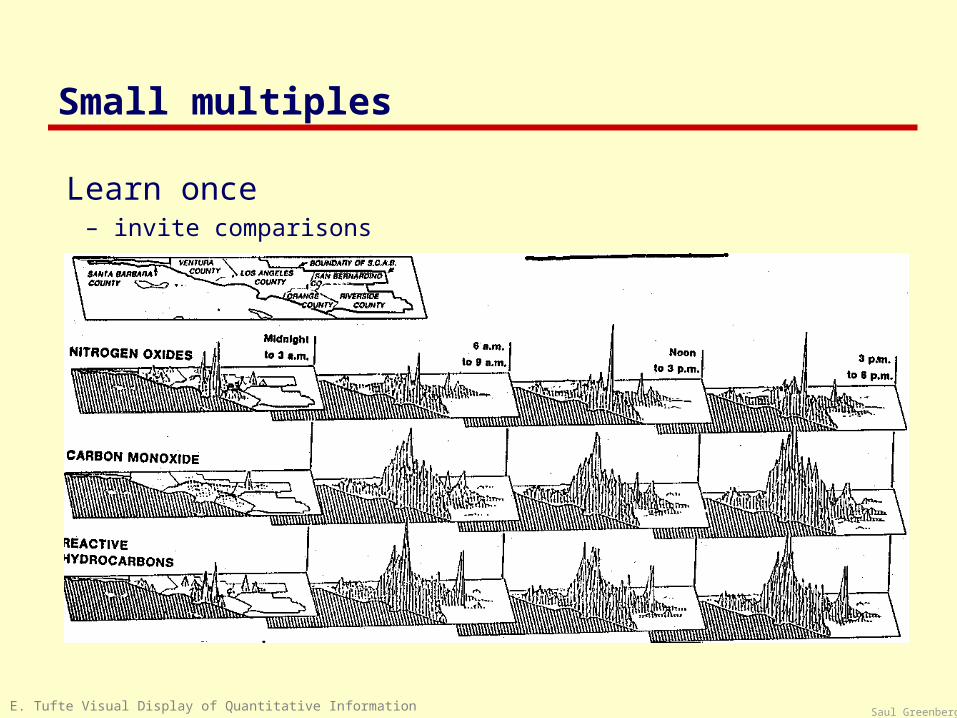
Small multiples
Learn once– invite comparisons
E. Tufte Visual Display of Quantitative Information
Saul Greenberg
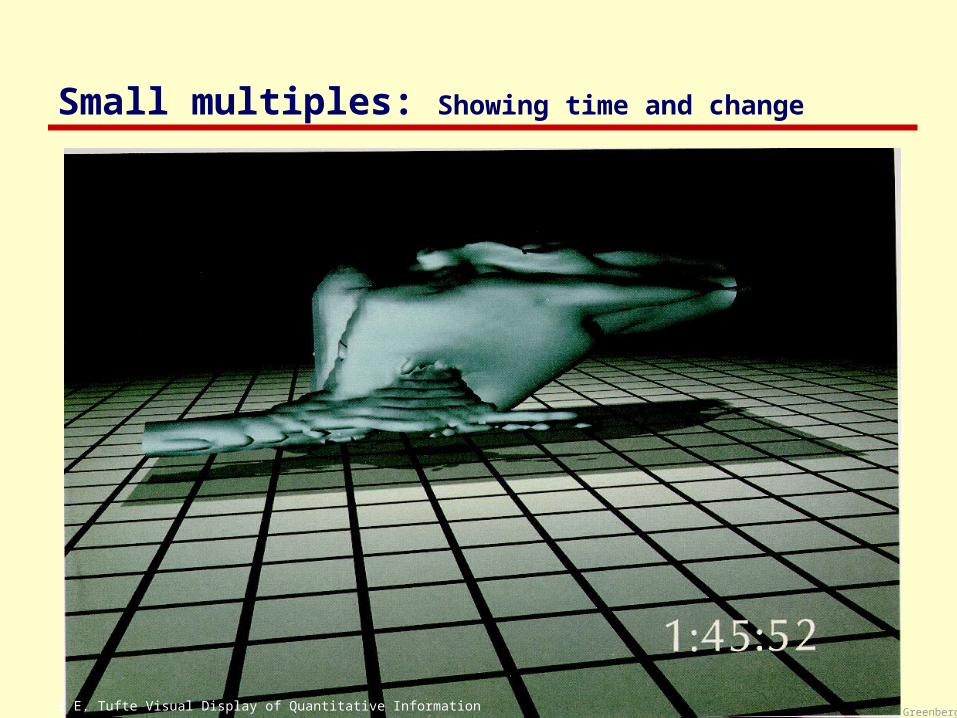
Small multiples: Showing time and change
E. Tufte Visual Display of Quantitative InformationE. Tufte Visual Display of Quantitative Information
Saul Greenberg
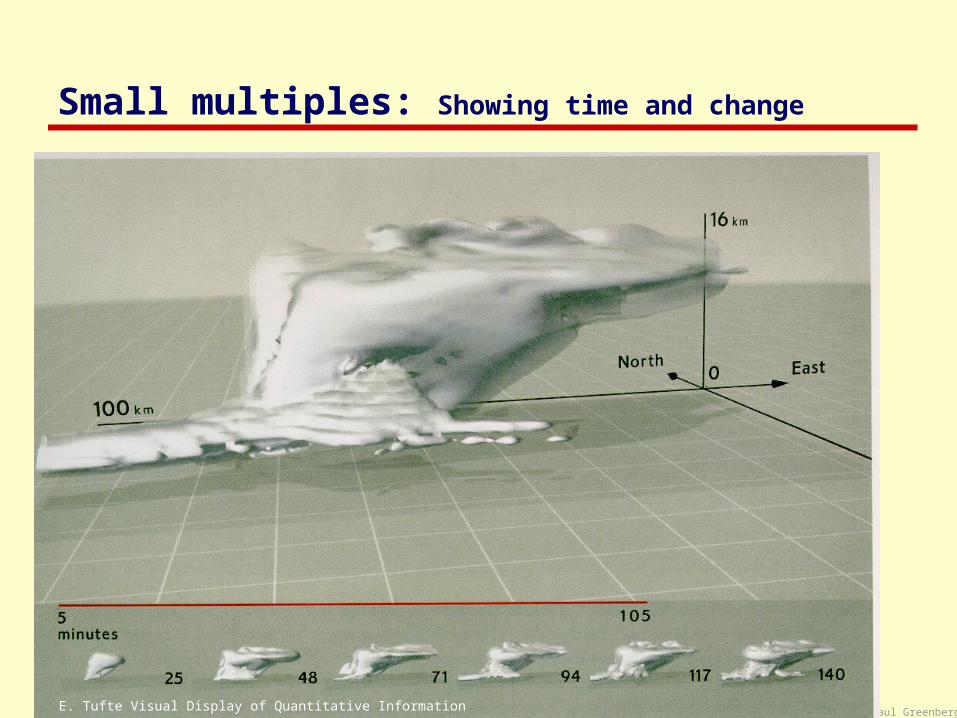
Small multiples: Showing time and change
E. Tufte Visual Display of Quantitative Information
Saul Greenberg
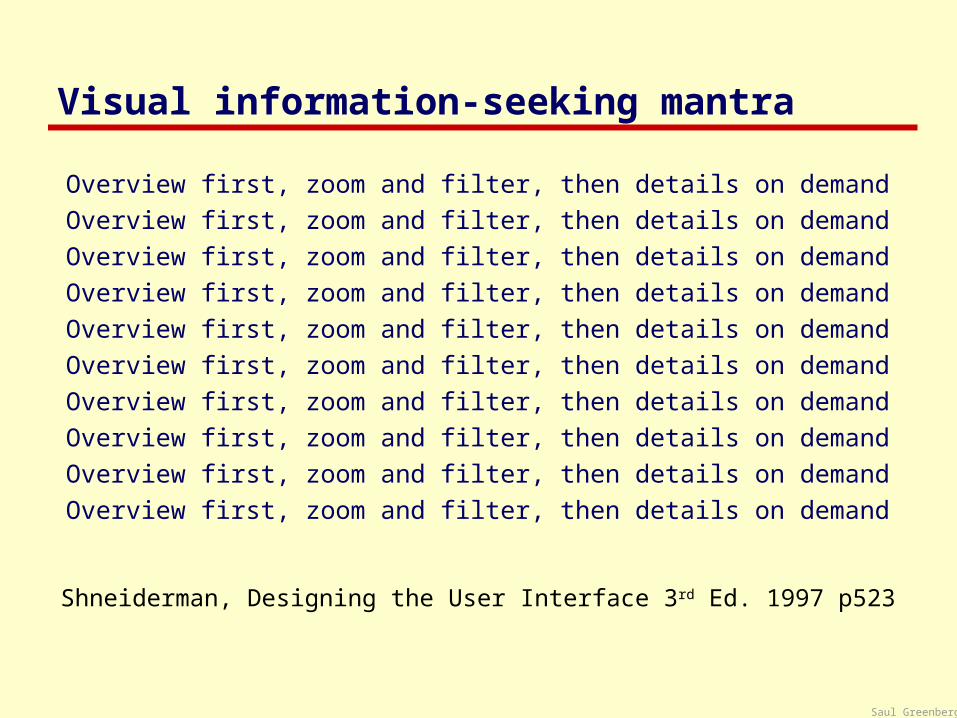
Visual information-seeking mantra
Overview first, zoom and filter, then details on demandOverview first, zoom and filter, then details on demandOverview first, zoom and filter, then details on demandOverview first, zoom and filter, then details on demandOverview first, zoom and filter, then details on demandOverview first, zoom and filter, then details on demandOverview first, zoom and filter, then details on demandOverview first, zoom and filter, then details on demandOverview first, zoom and filter, then details on demandOverview first, zoom and filter, then details on demand
Shneiderman, Designing the User Interface 3rd Ed. 1997 p523
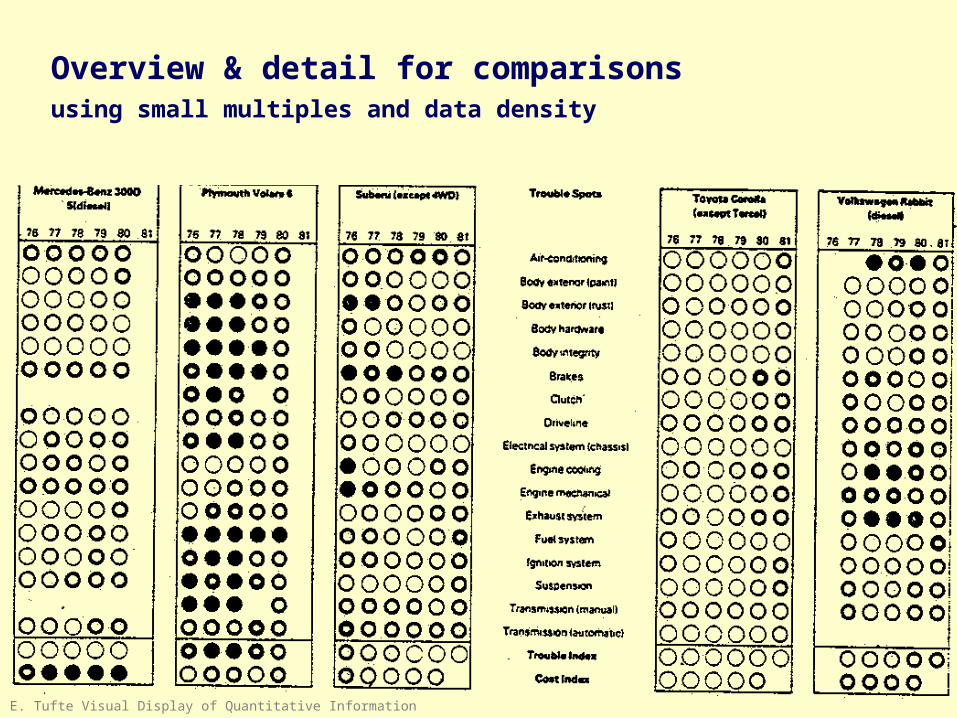
Overview & detail for comparisonsusing small multiples and data density
E. Tufte Visual Display of Quantitative Information
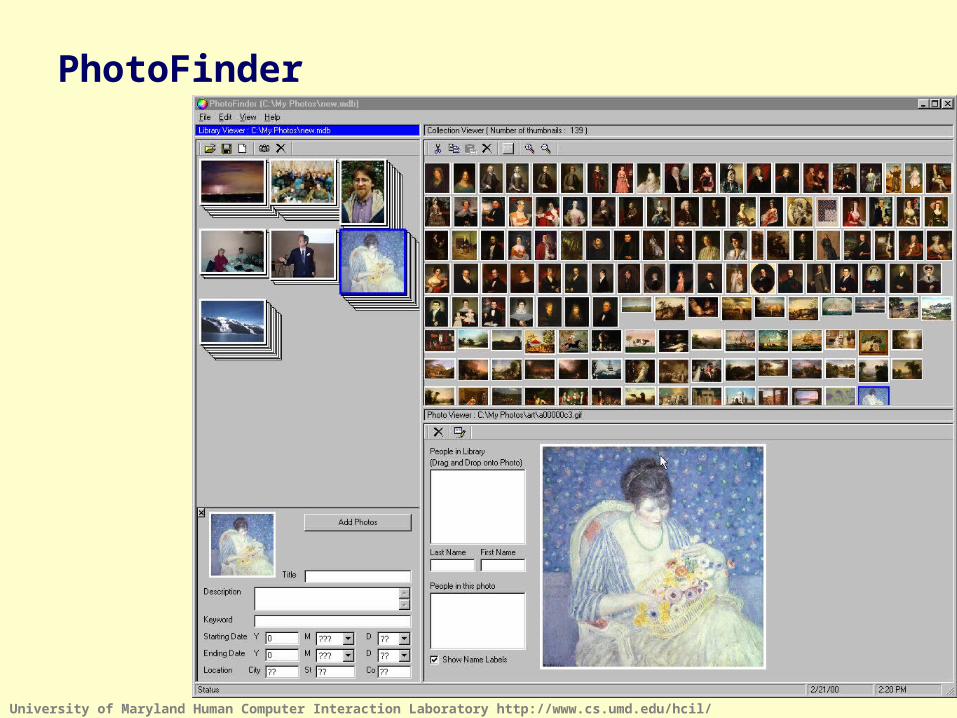
PhotoFinder
University of Maryland Human Computer Interaction Laboratory http://www.cs.umd.edu/hcil/
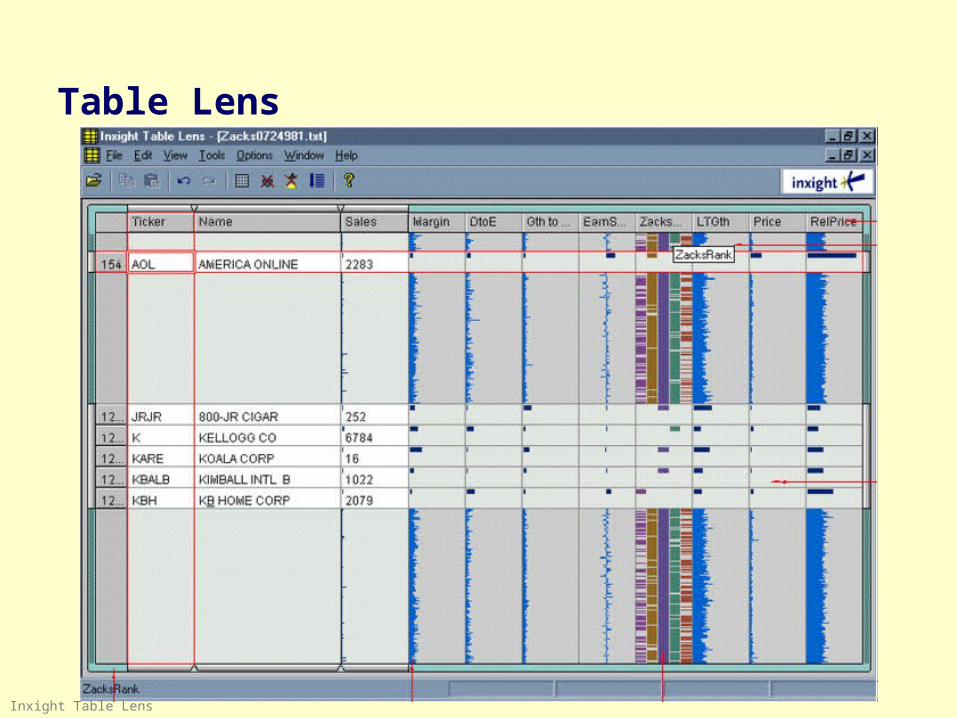
Table Lens
Inxight Table Lens
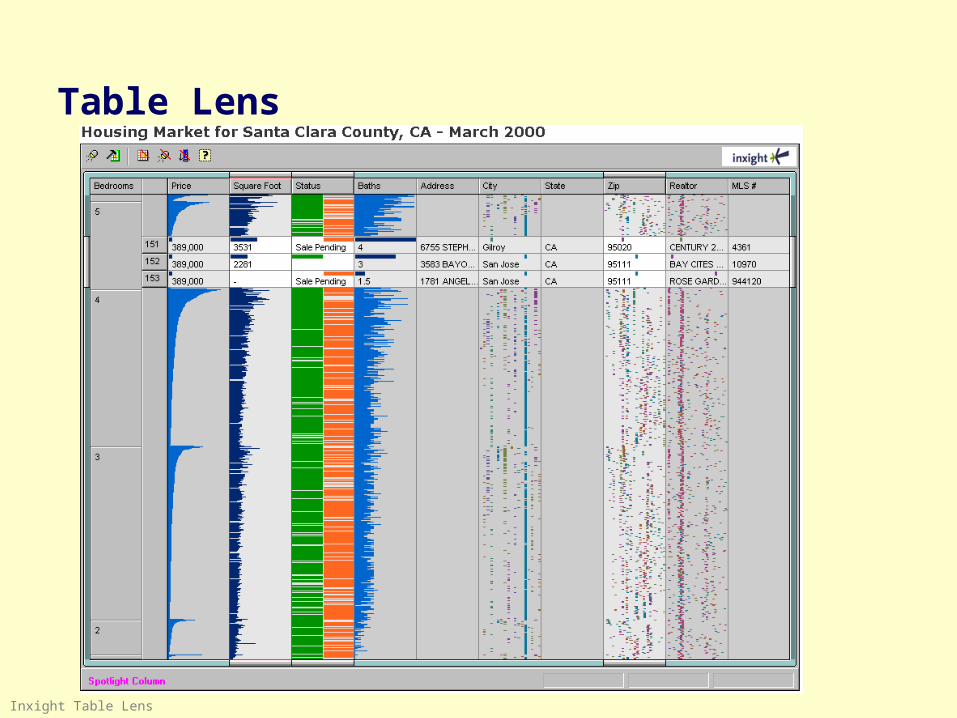
Table Lens
Inxight Table Lens
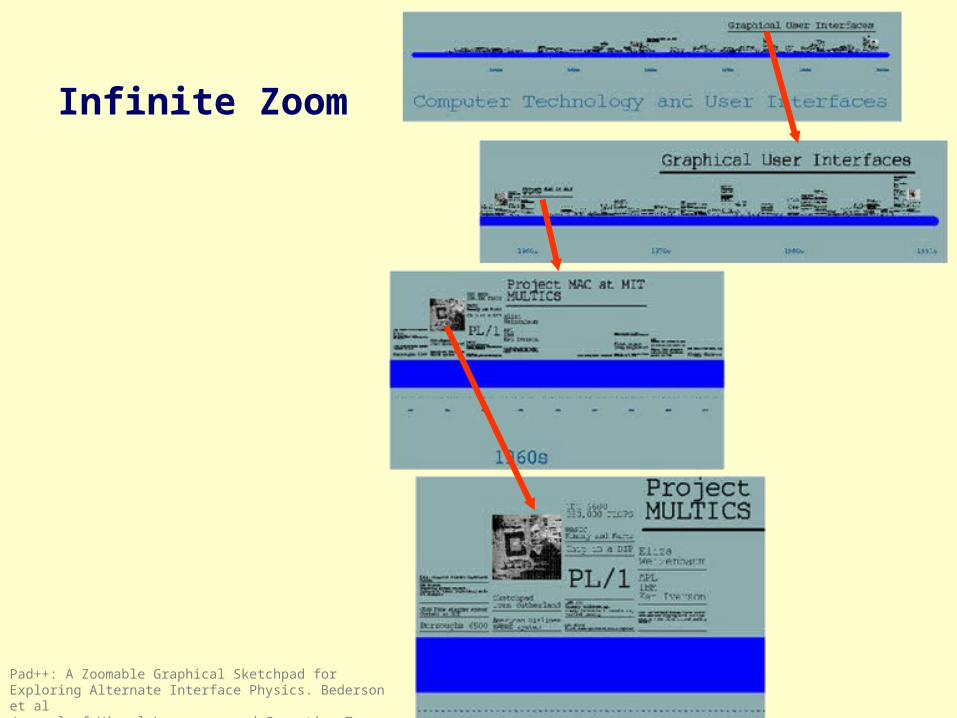
Infinite Zoom
Pad++: A Zoomable Graphical Sketchpad for Exploring Alternate Interface Physics. Bederson et al Journal of Visual Languages and Computing 7, 1996
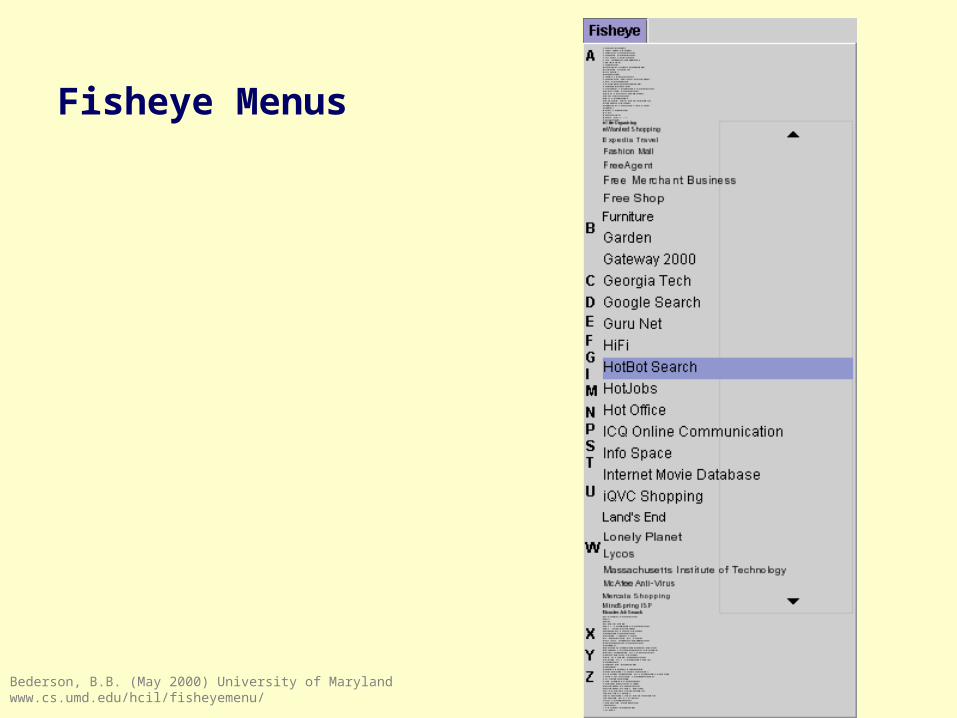
Fisheye Menus
Bederson, B.B. (May 2000) University of Maryland www.cs.umd.edu/hcil/fisheyemenu/
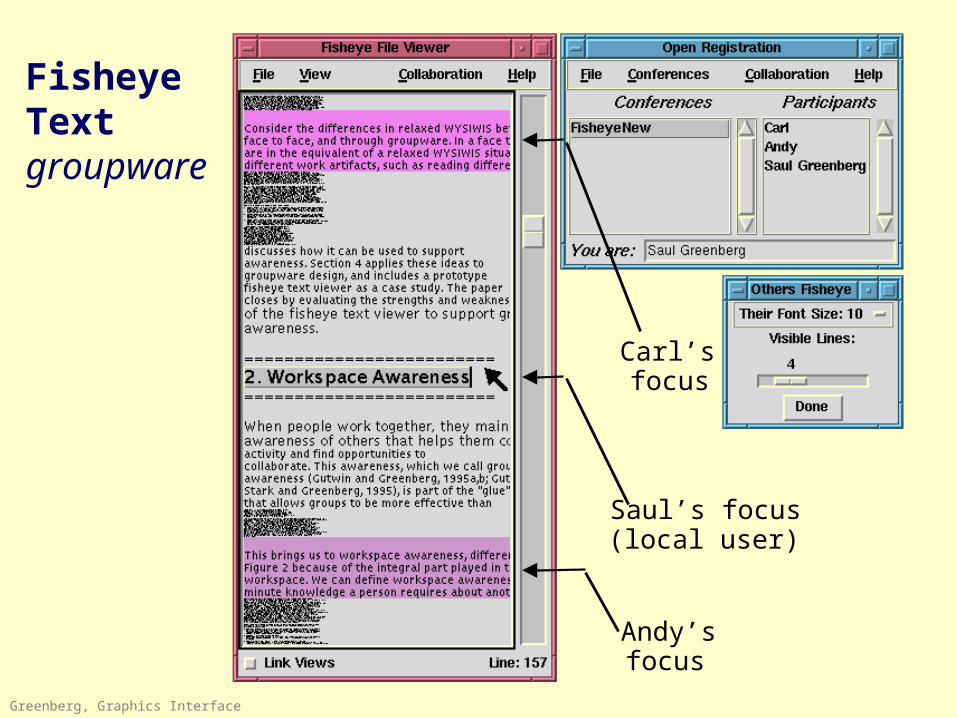
Saul’s focus (local user)
Carl’s focus
Andy’s focus
FisheyeTextgroupware
Greenberg, Graphics Interface
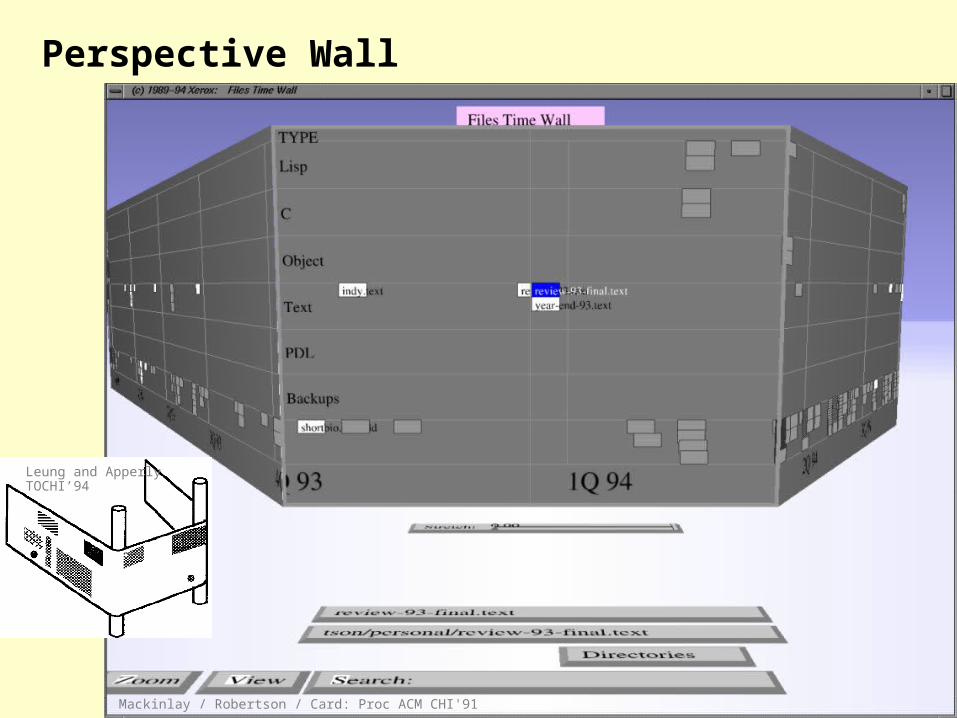
Perspective Wall
Leung and Apperly TOCHI’94
Mackinlay / Robertson / Card: Proc ACM CHI'91
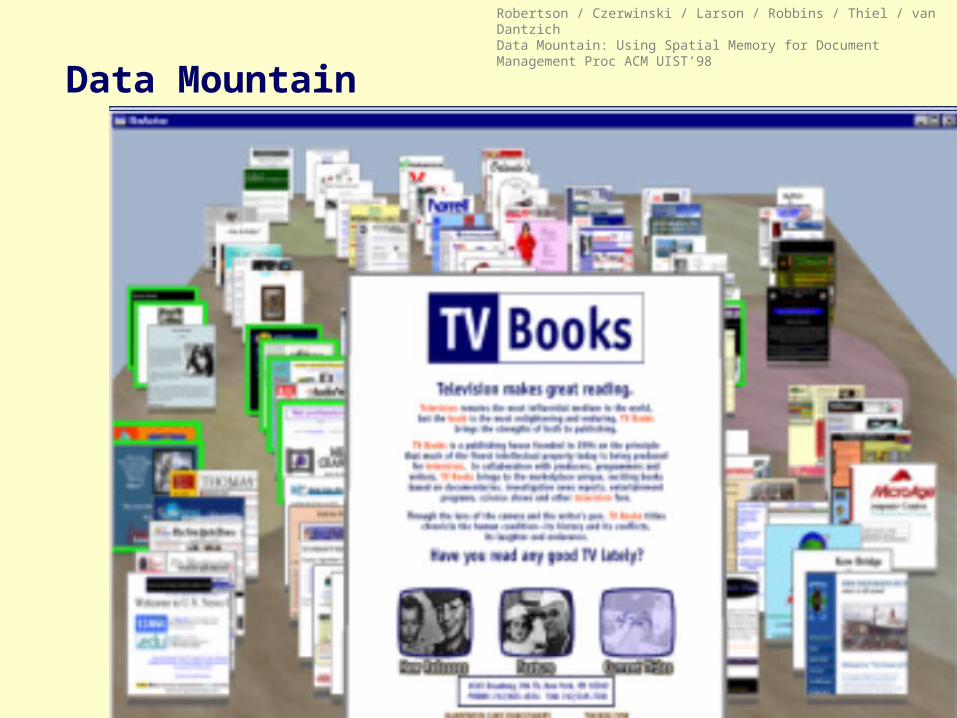
Data Mountain
Robertson / Czerwinski / Larson / Robbins / Thiel / van Dantzich Data Mountain: Using Spatial Memory for Document Management Proc ACM UIST’98
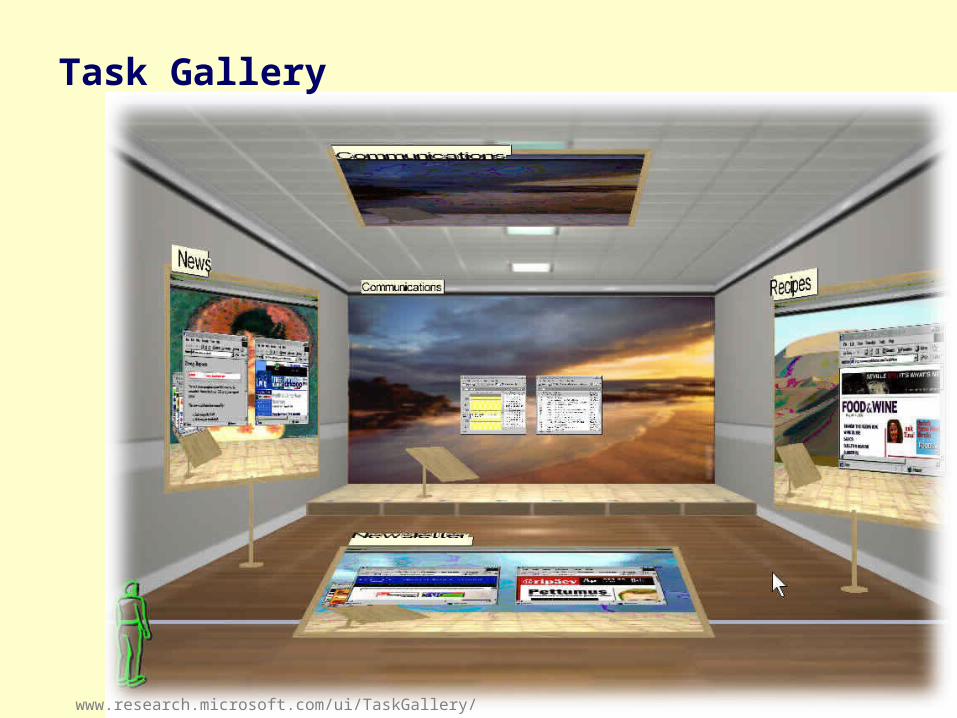
www.research.microsoft.com/ui/TaskGallery/
Task Gallery
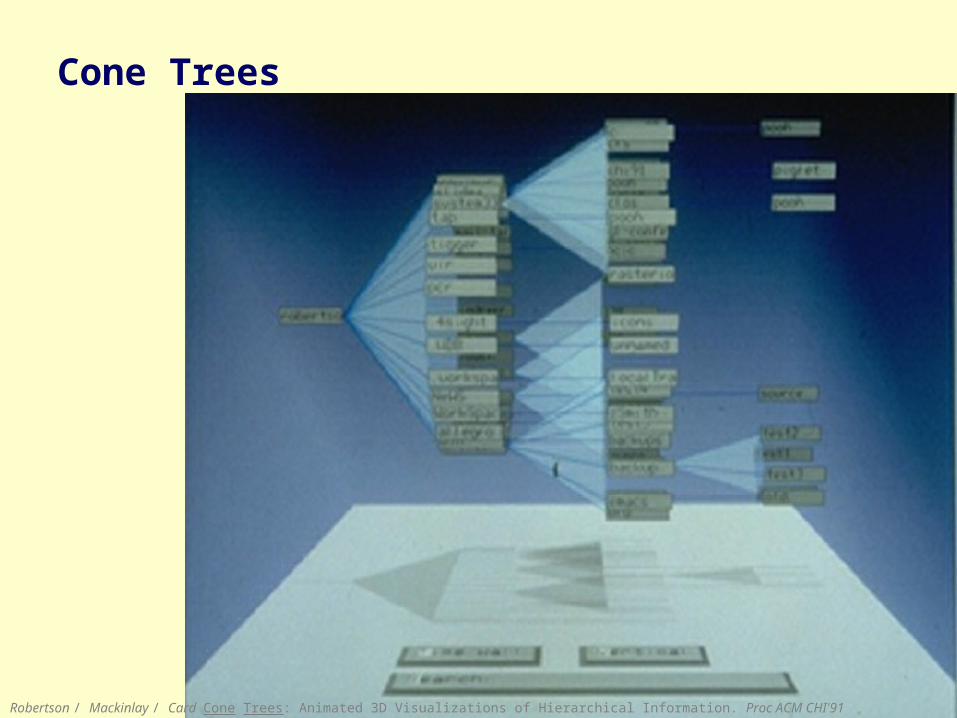
Cone Trees
Robertson / Mackinlay / Card Cone Trees: Animated 3D Visualizations of Hierarchical Information. Proc ACM CHI'91
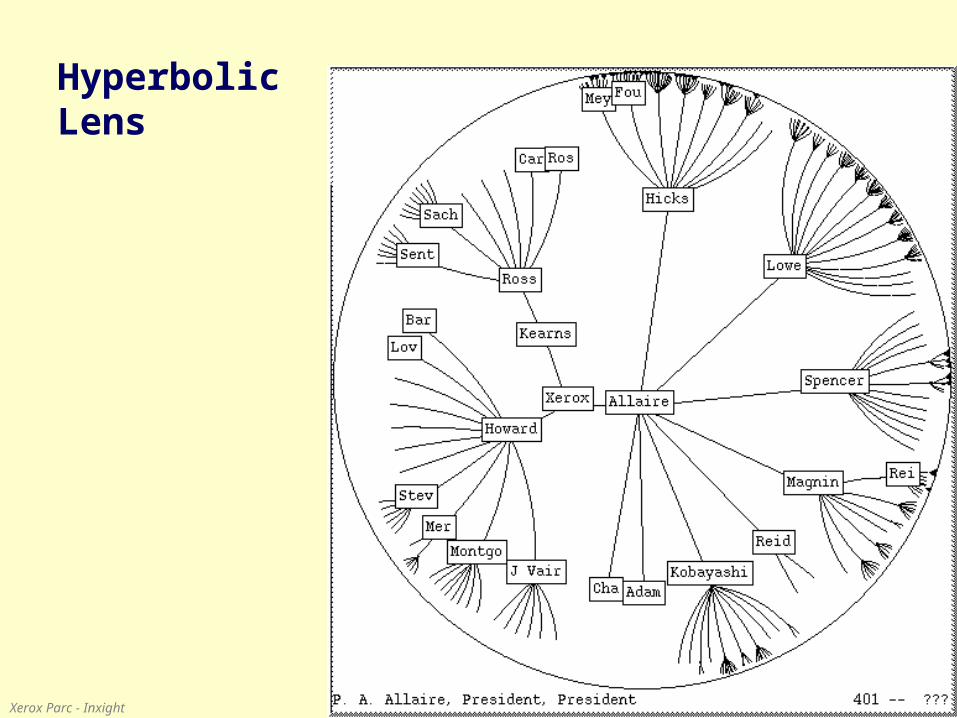
Hyperbolic Lens
Xerox Parc - Inxight
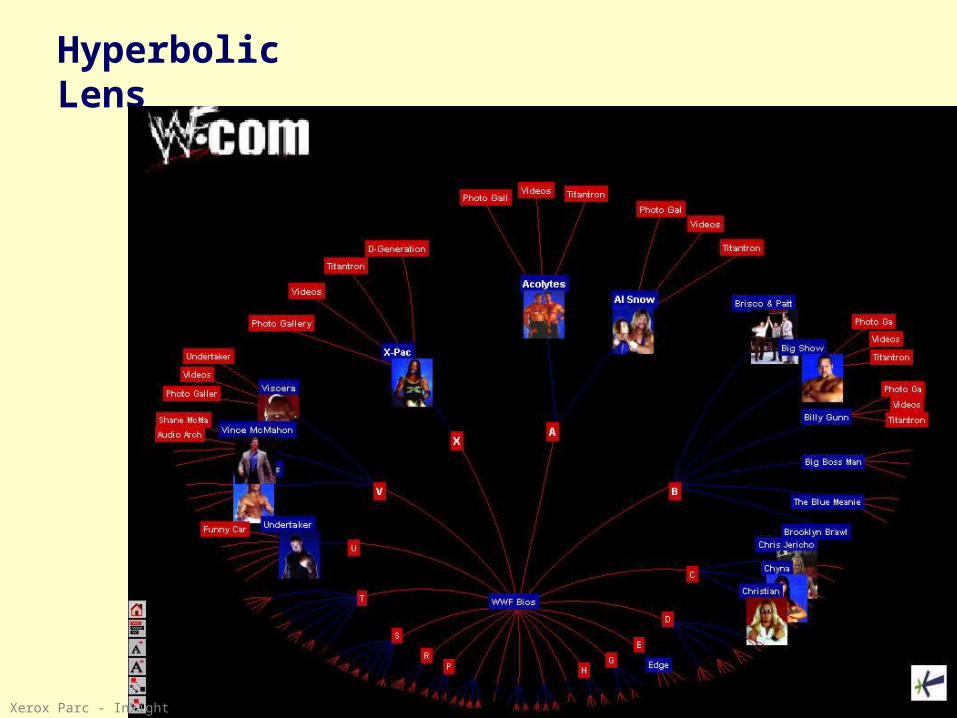
Hyperbolic Lens
Xerox Parc - Inxight
Saul Greenberg
What you now know
Good representations– captures essential elements of the event / world & mutes the
irrelevant– appropriate for the person, their task, and their interpretation
Information visualization– Tufte’s principles– overview first, zoom and filter, then details on demand– many techniques now available