reports the dynamic energy landscape of...
TRANSCRIPT
The Dynamic Energy Landscape ofDihydrofolate Reductase CatalysisDavid D. Boehr, Dan McElheny,* H. Jane Dyson, Peter E. Wright†
We used nuclear magnetic resonance relaxation dispersion to characterize higher energyconformational substates of Escherichia coli dihydrofolate reductase. Each intermediate in thecatalytic cycle samples low-lying excited states whose conformations resemble the ground-statestructures of preceding and following intermediates. Substrate and cofactor exchange occursthrough these excited substates. The maximum hydride transfer and steady-state turnover rates aregoverned by the dynamics of transitions between ground and excited states of the intermediates.Thus, the modulation of the energy landscape by the bound ligands funnels the enzyme through itsreaction cycle along a preferred kinetic path.
It has long been recognized that dynamic
fluctuations in protein conformation play a
central role in enzyme catalysis (1–3). Pro-
tein dynamics are implicated in events such as
substrate or cofactor binding and product re-
lease, and the chemical event itself involves an
inherently dynamic process, with changes in
atomic coordinates required along the reaction
coordinate (4). Although there is considerable
evidence from both theory and experiment that
many enzymes are inherently flexible, the funda-
mental mechanisms by which protein fluctua-
tions couple to catalytic function remain poorly
understood.
Escherichia coli dihydrofolate reductase
(DHFR) has been used extensively as a model
enzyme for investigating the relations between
structure, dynamics, and function. Theoretical
and experimental investigations suggest that
protein fluctuations play a direct role in catal-
ysis by DHFR Esee (5) for a recent review^. Theenzyme catalyzes the reduction of 7,8-dihydro-
folate (DHF) to 5,6,7,8-tetrahydrofolate (THF)
by using reduced nicotinamide adenine di-
nucleotide phosphate (NADPH) as a cofactor.
The kinetic mechanism involves rebinding
of NADPH to assist the release of the THF
product. The enzyme (E) cycles through five
major intermediates: E:NADPH, E:NADPH:DHF,
E:NADPþ:THF, E:THF, and E:NADPH:THF
(6) (Fig. 1A). The structures of all of the kinet-
ic intermediates, or models of the intermediates,
have been determined by x-ray crystallog-
raphy, and the conformational changes that
occur during the catalytic cycle have been de-
lineated (7, 8). The major sites of conforma-
tional change include the active-site loop
(residues 9 to 24, termed the Met20 loop) and
the substrate-binding pocket (7) (Fig. 1B). In
the holoenzyme E:NADPH and the Michaelis
complex E:NADPH:DHF (modeled by the ter-
nary E:NADPþ:folate complex), the Met20loop
adopts a closed conformation, where it packs
against the nicotinamide ring of the cofactor
bound within the active site. In the three product
complexes, the Met20 loop adopts an occluded
conformation, where it sterically hinders the
nicotinamide ring from binding in the active
site; therefore, the nicotinamide ring is outside
the pocket in these complexes. The substrate-
binding pocket undergoes a similar transition,
closing more tightly when both substrate and
cofactor are present and opening to release
products (7).
Protein dynamics can be evaluated experi-
mentally by nuclear magnetic resonance (NMR)
spin relaxation techniques (9). Carr-Purcell-
Meiboom-Gill (CPMG)–based R2relaxation
dispersion experiments monitor motion on the
ms to ms time scale that is generally the most
relevant for protein conformational change
(10). Through these methods, the transverse
relaxation rate, R2, can be decomposed into R
ex,
the contribution from exchange between differ-
ent conformations, and R0, all other contri-
butions (9). For two-site chemical exchange
between a ground state (A) and an excited state
(B), R2relaxation dispersion is a function of the
exchange rate constant kex(kex0 k
AYBþ k
BYA),
the populations of states A and B (pAand p
B,
respectively), and the chemical shift difference
between states A and B (Dw) (11), thus giving
information regarding the kinetics and thermo-
dynamics of protein motion (12–15) and
providing insight into the structure of the higher
energy state (13, 15, 16).
The 15N R2relaxation dispersion measure-
ments for the Michaelis complex model
E:NADPþ:folate (15) indicated that many of
the residues that exhibit exchange contributions
to relaxation are directly or indirectly associated
with the Met20 loop (Fig. 2A). These residues
show characteristic chemical shift differences
between closed and occluded complexes, and
their resonances have been previously catego-
rized as active site loop conformation markers
(17). Likewise, chemical shift perturbation studies
identified cofactor-binding and substrate- or
Department of Molecular Biology and Skaggs Institute forChemical Biology, Scripps Research Institute, 10550 NorthTorrey Pines Road, La Jolla, CA 92037, USA.
*Present address: Division of Biological Sciences, Universityof Chicago, Chicago, IL 60637, USA.†To whom correspondence should be addressed. E-mail:[email protected]
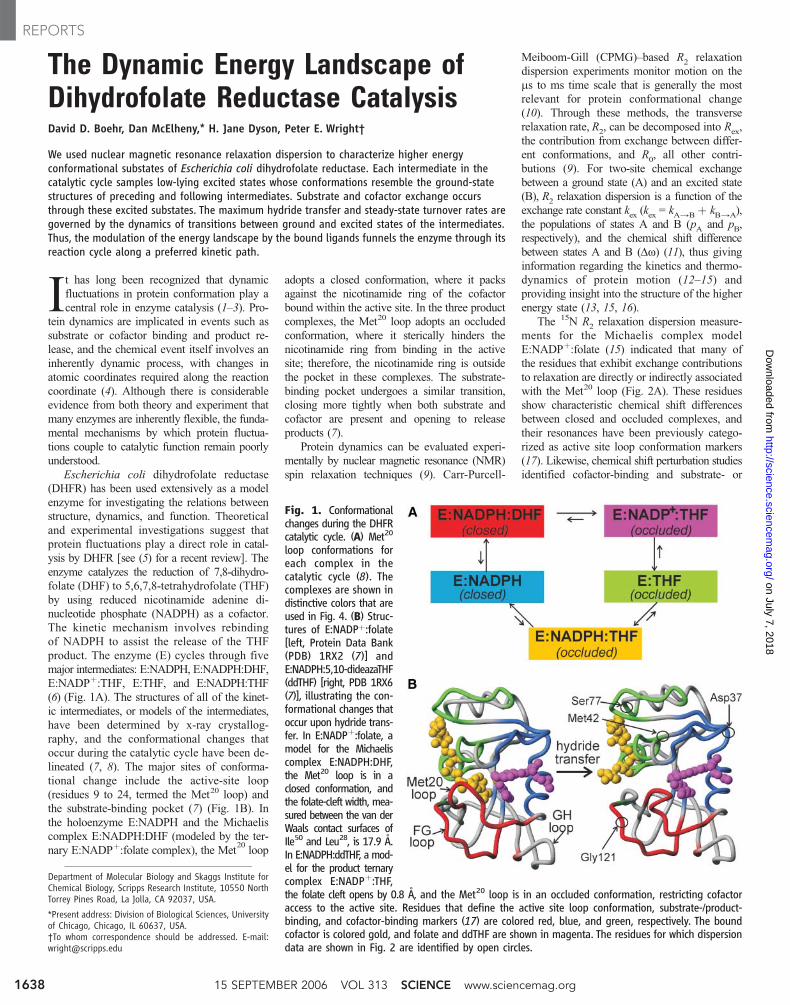
Fig. 1. Conformationalchanges during the DHFRcatalytic cycle. (A) Met20
loop conformations foreach complex in thecatalytic cycle (8). Thecomplexes are shown indistinctive colors that areused in Fig. 4. (B) Struc-tures of E:NADPþ:folate[left, Protein Data Bank(PDB) 1RX2 (7)] andE:NADPH:5,10-dideazaTHF(ddTHF) [right, PDB 1RX6(7)], illustrating the con-formational changes thatoccur upon hydride trans-fer. In E:NADPþ:folate, amodel for the Michaeliscomplex E:NADPH:DHF,the Met20 loop is in aclosed conformation, andthe folate-cleft width, mea-sured between the van derWaals contact surfaces ofIle50 and Leu28, is 17.9 A.In E:NADPH:ddTHF, a mod-el for the product ternarycomplex E:NADPþ:THF,the folate cleft opens by 0.8 A, and the Met20 loop is in an occluded conformation, restricting cofactoraccess to the active site. Residues that define the active site loop conformation, substrate-/product-binding, and cofactor-binding markers (17) are colored red, blue, and green, respectively. The boundcofactor is colored gold, and folate and ddTHF are shown in magenta. The residues for which dispersiondata are shown in Fig. 2 are identified by open circles.
15 SEPTEMBER 2006 VOL 313 SCIENCE www.sciencemag.org1638
REPORTSon July 7, 2018
http://science.sciencemag.org/
Dow
nloaded from

product-binding (substrate-/product-binding) mark-
er resonances associated with residues that clus-
ter around the cofactor- and substrate-binding
pockets, respectively (17) (Fig. 1B). A compar-
ison of the dynamic chemical shift differences
(Dw values) determined from fits of the R2
relaxation dispersion data to the equilibrium
chemical shift differences (Dd values) between
the closed complex E:NADPþ:folate and the
occluded complex E:DHNADPH:folate showed
a remarkable linear correlation (15). Thus, the
higher energy state contributing to R2relaxation
in the closed E:NADPþ:folate complex rep-
resents an occluded conformation similar to that
found in the E:NADPþ:THF product ternary
complex.
A complete set of 15N and 1H R2relaxation
dispersion data have now been obtained for
DHFR complexes that represent all of the kinetic
intermediates populated in the steady-state
catalytic cycle. Dispersion data measured at two
frequencies were fitted to the general two-site
exchange equations; the methods, dispersion
curves, and fitted parameters for all complexes
are provided (tables S1 to S4 and figs. S1 to S5).
Some of these data are shown in Figs. 2 and 3.
Analysis of amide 15N and 1H R2relaxation
dispersion measurements for the holoenzyme
E:NADPH revealed exchange processes for
many residues located in or around the sub-
strate binding site (Fig. 2B). Dispersive behav-
ior was also observed for several residues in the
active site loop and the loop (residues 116 to
132) between b strands F and G (the FG loop),
but no relaxation dispersion was seen for
residues in the cofactor-binding site. The
localization of the residues showing exchange
contributions to relaxation around the substrate-
binding pocket suggests that the higher energy
conformation sampled by E:NADPH plays an
important role in capturing the substrate. Indeed,
there is a strong linear correlation between the
Dw values derived from the relaxation dispersion
curves and the Dd values derived from the
chemical shift differences between E:NADPH
and E:NADPH:THF, or between E:NADPH and
E:NADPþ:folate, representing the previous step
or the next step in the cycle, respectively (Fig.
3A). This result implies that the E:NADPH
complex samples a higher energy substate in
which the empty substrate-/product-binding
pocket adopts a conformation similar to that of
the ligand-bound state. A similar observation
has been reported for ribonuclease A (RNaseA):
As a result of conformational fluctuations, the
free enzyme samples a higher energy state
whose structure resembles the ligand-bound
form (18). Although many residues in the
Met20 and FG loops experience exchange
contributions, the derived Dw values do not
correlate with the Dd values between the closed
and the occluded conformations (fig. S6); the
active site loop conformation in the excited
state is currently unknown.
Fig. 2. Relaxationdispersiondata foreach intermediatein the catalytic cycle of DHFR. (Left) Model structures forvarious intermediates of the DHFR catalytic cycle (7). Thebackbone is colored red, green, or blue as in Fig. 1B.Residues for which conformational exchange isobserved are indicated with spheres, which are coloredred, green, and blue for resonances that report onactive site loop conformation, cofactor binding, andsubstrate/product binding, respectively, and gray forresonances that are not identified with any of thesecategories. Yellow indicates resonances that showbroadening, but for which data quality was insufficientto obtain reliable R2 relaxation dispersion results. (Right)Representative 15N R2 relaxation dispersion curves foreach complex. A full set of data for all residues thatshow detectable relaxation dispersion is included (figs. S1to S5). Error bars indicate estimated uncertainties in R2(15). (A) E:NADPþ:folate (PDB 1RX2) and NMR data at303 K. (B) E:NADPH (PDB 1RX1) and NMR data at284 K. (C) E:THF (PDB 1RX5) and NMR data at 300 K.(D) E:NADPþ:THF (PDB 1RX4) and NMR data at 300 K.(E) E:NADPH:THF (PDB 1RX6) and NMR data at300 K. Relaxation dispersion data were collected andanalyzed at two external magnetic field strengths (1H500 MHz and 800 MHz), but only 800 MHz data areshown for clarity. Red curves report on the active siteloop conformation marker Gly121; blue curves, on thesubstrate-/product-binding marker Asp37; and greencurves, on the cofactor-binding marker Ser77 [(A) to(C) and (E)] or Met42 (D). The green curve for Ser77 in(E) (green) has been offset for clarity (right axis). Thisfigure was generated in part by using MOLMOL (27).
Fig. 3. Correlation between Dwvalues obtained from relaxationdispersion measurements anddifferences (Dd) between chemi-cal shifts in the ground states ofadjacent complexes in the cata-lytic cycle. (A) Dw for E:NADPHplotted against Dd [equal to
d(E:NADPH) – d(E:NADPH:THF), circles; or d(E:NADPH) – d(E:NADPþ:folate), triangles] (slope 0 0.95, R2 0 0.97); (B) Dwfor E:THF plotted against Dd [equal to d(E:THF) – d(E:NADPþ:THF), circles; or d(E:THF) – d(E:NADPH:THF), triangles](slope 0 1.1, R2 0 0.99); (C) Dw for E:NADPþ:THF plotted against Dd [d(E:NADP
þ:THF) – d(NADPþ:folate)] by
using 10 mM (circles) and 50 mM (triangles) NADPþ (slope 0 1.0, R2 0 0.99); and (D) Dw forE:NADPþ:THF plotted against Dd [d(E:NADPþ:THF) – d(E:THF)] by using 10 mM (circles) or 50 mM (squares)NADPþ, or plotted against Dd [d(E:NADPþ:THF) – d(E:folate)] by using 10 mM (triangles) or 50 mM (diamonds)NADPþ (slope 0 0.91, R2 0 0.94). The data points for the Gly96 amide, which hydrogen-bonds directly tothe cofactor, are enclosed in a circle and were not included when determining the line of best fit. (E) Dwfor E:NADPH:THF plotted against Dd [d(E:NADPH:THF) – d(E:NADPH)] (slope 0 0.97, R2 0 0.98). Residues arecolored red, green, and blue to indicate residues reporting on the active site loop conformation, cofactorbinding, and substrate/product binding, respectively. Solid symbols indicate that the sign of Dw could bedetermined from a comparison of HSQC and heteronuclear multiple-quantum coherence spectra at anexternal magnetic field strength of 1H 500 MHz (28), and open symbols indicate residues where only theabsolute values for Dw and Dd are reported. Error bars indicate uncertainties in Dw estimated by MonteCarlo simulation (15).
www.sciencemag.org SCIENCE VOL 313 15 SEPTEMBER 2006 1639
REPORTSon July 7, 2018
http://science.sciencemag.org/
Dow
nloaded from
In direct contrast to the E:NADPH complex,
residues surrounding the cofactor-binding cleft
display exchange contributions to relaxation in the
E:THF complex (Fig. 2C). A linear correlation is
observed between Dw and Dd(E:THF – E:NADP
þ:THF)
or Dd(E:THF – E:NADPH:THF)
values (Fig. 3B), sug-
gesting that the higher energy conformation
contributing to 15N R2relaxation in E:THF re-
sembles the product ternary complexes. Any
relaxation dispersion observed for residues lining
the substrate-binding pocket or in the FG loop
can generally be traced to local differences in
conformation between E:THF and product ter-
nary complexes (table S2 and fig. S7).
In the E:NADPþ:THF complex, confor-
mational changes are observed in the active
site loops and the ligand-binding pockets
(Fig. 2D). The Dw values for residues sur-
rounding the cofactor-binding cleft and the
active site loops correlate with different Ddvalues (Fig. 3, C and D). The Dw values for
residues in the active site loops correlate to
Dd(E:NADPþ:THF – E:NADPþ:folate) (Fig. 3C),
showing that the occluded E:NADPþ:THF com-
plex samples a higher energy state in which the
active site loops are in a closed conformation, re-
sembling the conformation of the E:DHF:NADPH
Michaelis complex (modeled by E:NADPþ:folate)
that immediately precedes it in the catalytic
cycle. For many of the residues surrounding the
cofactor-binding cleft, a linear correlation is ob-
served between Dw and Dd(E:NADP
þ:THF – E:folate)
and/or Dd(E:NADP
þ:THF – E:THF)
(Fig. 3D), reveal-
ing the presence of an additional excited state
in which the conformation of the adenosine-
binding site is similar to that in the binary
E:THF product complex. The excited protein
substates do not reflect physical dissociation of
cofactor or chemical changes. The population of
E:THF in equilibrium with the ternary product
complex E:NADPþ:THF is estimated to be 0.4%
on the basis of rate constants determined from
pre–steady-state analysis (6), whereas the
excited state population from relaxation disper-
sion experiments is much larger ( pB9 2.3%).
Repeat experiments at fivefold higher NADPþ
concentration, where the population of the E:THF
complex is estimated to be È0.08%, showed
identical R2relaxation dispersion for the res-
idues surrounding the adenosine-binding site
(table S3), which rules out cofactor dissociation
as the origin of the exchange contributions to
the R2relaxation rates. In addition, the x-ray
structures (7) show that the Gly96 amide forms
a hydrogen bond to the phosphate group of the
cofactor, which leads to a large change in the15N chemical shift E3.5 to 4.0 parts per million
(ppm)^ upon binding of NADPþ to the E:THF
or E:folate complexes. However, the Dw for
Gly96 is much smaller (G1.35 ppm) (Fig. 3D),
implying that the hydrogen bond remains
largely intact and that conformational exchange
is not modulated by cofactor dissociation. The
closed excited-state conformation of the active
site loops also cannot be a consequence of hy-
dride transfer, because the rate constant of the
back reaction is too slow at this pH (È0.03 sj1)
for this process to contribute measurably to R2
relaxation dispersion (6).
The ground-state conformations of
E:NADPH:THF and E:NADPþ:THF are very
similar, as evidenced by their nearly identical15N heteronuclear single-quantum coherence
(HSQC) spectra, yet the two complexes exhibit
very different R2relaxation dispersion. The
E:NADPH:THF complex (Fig. 2E) exhibits
more pronounced dispersive behavior for resi-
dues surrounding the substrate-/product-binding
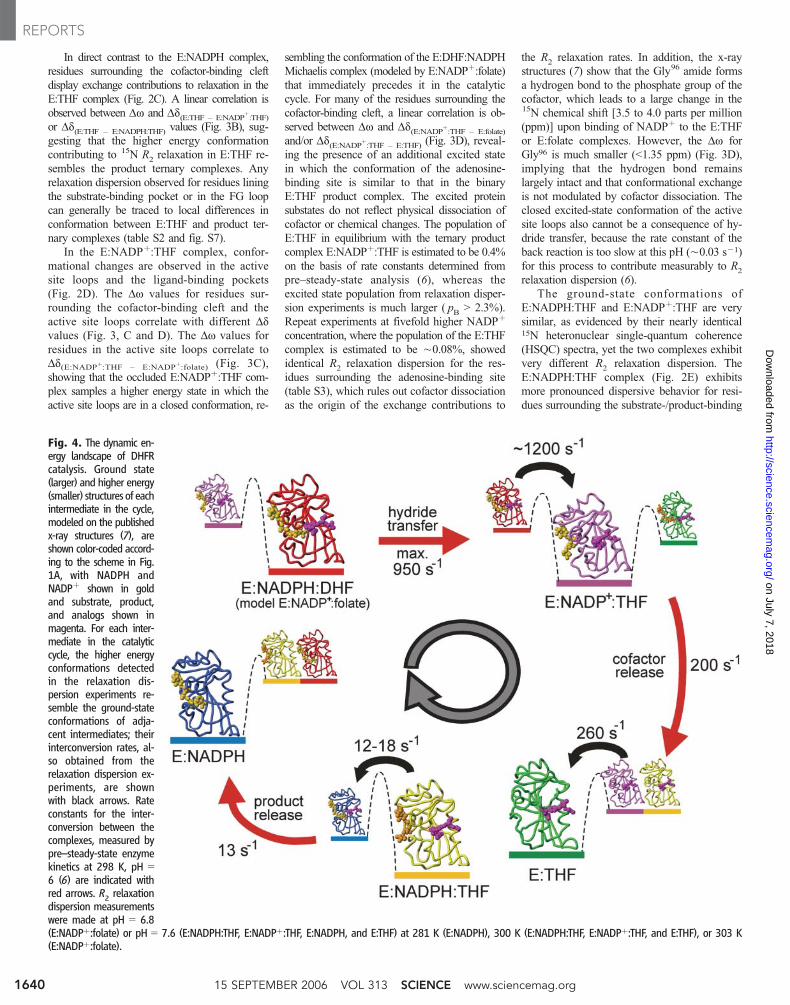
Fig. 4. The dynamic en-ergy landscape of DHFRcatalysis. Ground state(larger) and higher energy(smaller) structures of eachintermediate in the cycle,modeled on the publishedx-ray structures (7), areshown color-coded accord-ing to the scheme in Fig.1A, with NADPH andNADPþ shown in goldand substrate, product,and analogs shown inmagenta. For each inter-mediate in the catalyticcycle, the higher energyconformations detectedin the relaxation dis-persion experiments re-semble the ground-stateconformations of adja-cent intermediates; theirinterconversion rates, al-so obtained from therelaxation dispersion ex-periments, are shownwith black arrows. Rateconstants for the inter-conversion between thecomplexes, measured bypre–steady-state enzymekinetics at 298 K, pH 06 (6) are indicated withred arrows. R2 relaxationdispersion measurementswere made at pH 0 6.8(E:NADPþ:folate) or pH 0 7.6 (E:NADPH:THF, E:NADPþ:THF, E:NADPH, and E:THF) at 281 K (E:NADPH), 300 K (E:NADPH:THF, E:NADPþ:THF, and E:THF), or 303 K(E:NADPþ:folate).
15 SEPTEMBER 2006 VOL 313 SCIENCE www.sciencemag.org1640
REPORTSon July 7, 2018
http://science.sciencemag.org/
Dow
nloaded from
pocket and no conformational exchange for res-
idues in the cofactor-binding cleft. The Dw val-
ues for most residues surrounding the substrate-/
product-binding pocket correlate strongly with
Dd(E:NADPH:THF – E:NADPH)
(Fig. 3E). Again, this
cannot be due to the physical dissociation of THF
from the complex, because the population of the
excited-state (pB9 1.9%) is substantially greater
than the population of the binary E:NADPH
complex in equilibrium with E:NADPH:THF
(population È 0.12%). Moreover, repeating the
experiment at a THF concentration three times
higher (estimated population of E:NADPH È
0.04%) yielded nearly identical results (table
S4). Many residues associated with the active site
loops also display conformational exchange, yet
the derived Dw values for most of these do not
correlate with an occluded-to-closed conforma-
tional change. This result provides further
evidence that we are not observing physical
dissociation of product THF to form the closed
E:NADPH complex but are monitoring fluctua-
tions into a higher energy conformation of
E:NADPH:THF that resembles one without
product bound. The higher energy substates
sampled by E:NADPH and E:NADPH:THF
may be similar, because Dw values for reso-
nances showing dispersion in both the binary
and the ternary complex display a linear cor-
relation (fig. S11).
These results can be placed in the context of
the catalytic cycle (Fig. 4). The higher energy
conformations that we observe in the R2relax-
ation dispersion experiments appear to play a
direct role in catalysis. In all five intermediates,
there is conformational exchange on a ms-ms
time scale between the ground-state structure
and one or two excited states that resemble the
ground state of the preceding and/or the fol-
lowing intermediate in the catalytic cycle. The
binary complexes E:NADPH and E:THF sam-
ple excited-state conformations that facilitate
binding of substrate/product and cofactor, respec-
tively. Thus, binding of ligands to the enzyme
appears to occur by a conformational selection
(19, 20) or selected-fit (21) mechanism, rather
than by the induced-fit mechanism (22) that has
been traditionally invoked to explain substrate-
induced conformational change. An underlying
tenet of the induced-fit model is conformational
homogeneity, with binding occurring by a
sequential mechanism; the ligand binds to the
enzyme and induces a conformational change that
increases the complementarity between ligand
and protein. However, most proteins are structur-
ally heterogeneous; their energy landscapes are
rugged, and a number of conformational substates
lie close in energy to the ground state and are
populated through thermal fluctuations (23). In
the conformational selection model, a small
population of a minor conformational substate
resembling the ligand-bound or induced con-
formation is already present in solution, in a
preexisting equilibrium with the major ligand-
free state. Ligand binds to the minor substate,
causing a shift in the equilibrium such that the
ligand-bound conformation becomes the new
major substate (19, 20). The experimentally de-
termined bimolecular rate constant for binding
of substrate to E:NADPH (4 � 107 Mj1 sj1) (6)
is consistent with a mechanism that invokes the
diffusion-controlled association (È109 Mj1 sj1)
of substrate with a small population ( pB0 2%)
of a binding-competent excited state of the
E:NADPH holoenzyme.
Our results suggest that ligand release also
occurs through higher energy substates. The
excited state structures of E:NADPþ:THF and
E:NADPH:THF resemble conformations in
which the cofactor- or product-binding pocket is
empty, even though ligand dissociation has not
occurred. Fluctuations that populate these higher
energy substates effectively prepare the enzyme
for ligand dissociation; this process can be viewed
as the opposite to conformational selection and
ligand binding. Indeed, Dw values for amides in
the substrate-/product- and cofactor-binding
pockets of the complementary binary and ternary
complexes E:NADPH/E:NADPH:THF and
E:(THF or folate)/E:NADPþ:THF, respectively,
are correlated (fig. S11), suggesting that ex-
change contributions to relaxation arise from
similar, but opposing, processes.
Transitions between the conformational sub-
states occur at rates, determined from the R2
relaxation dispersion experiments, that are di-
rectly relevant to DHFR catalysis. Comparison
with the rate constants determined from pre–
steady-state kinetics (6) provides strong evi-
dence that the rate of progression through the
various steps of the reaction cycle is governed by
the dynamics of the conformational fluctuations
between the ground and the excited states of the
kinetic intermediates (Fig. 4). Thus, the first-
order rate constant for release of THF from the
E:NADPH:THF complex (12.5 sj1 at 298 K),
which is the rate-determining step at physio-
logical pH, is very similar to the ground-to-
excited state conformational exchange rate
constant (12 to 18 sj1 at 300 K) that we
measure for the residues surrounding the
substrate-/product-binding pocket. This argues
strongly that product dissociation occurs from
the excited state. Maximum substrate turnover
can also be rationalized in the context of this
model. Subsequent to hydride transfer, which is
effectively instantaneous relative to the rate of
protein conformational change (24), the enzyme
is converted from the closed E:NADPH:DHF
Michaelis complex to a closed E:NADPþ:THF
complex. The kinetic rate constant for the con-
formational change from the higher energy
closed state to the occluded ground state of
E:NADPþ:THF (k È 1200 sj1 at 300 K) is
very similar to the pH-independent rate constant
for hydride transfer (khyd
0 950 sj1 at 298 K)
(6). Thus, both the product release and the
chemical transformation rate constants are large-
ly determined by the exchange rate constants
between substates that are thermally populated
within the conformational ensemble; that is, the
maximum hydride transfer rate and the steady-
state turnover rate are dictated by physical
changes within the energy landscape of the
enzyme. A correlation between the overall turn-
over rate and protein motions has also been
described for the enzyme cyclophilin (25).
Because R2relaxation dispersion experiments
can generally only characterize higher energy
conformations thatmake up at least 1 to 2%of the
ensemble, there may be additional excited states
that are inaccessible to the technique. However,
the excited-state conformations that we observe,
together with the ground-state conformation, will
constitute the lowest-energy members of the
conformational ensemble of each intermediate.
These results imply that the most functionally
relevant conformations also possess the lowest
energy of all potential conformations. In this
view, ligands dictate not only the ground-state
conformation but also the most accessible higher
energy substates. As ligands change, through
binding or dissociation processes or through
chemistry, the energy landscape and the pop-
ulations of the accessible states change in re-
sponse. Thus, the dynamic energy landscape (26)
efficiently funnels the enzyme through its
catalytically competent conformations along a
preferred kinetic path, where the number and
heights of the energetic barriers between consec-
utive conformations have been minimized.
References and Notes1. G. G. Hammes, Nature 204, 342 (1964).2. G. Careri, P. Fasella, E. Gratton, Annu. Rev. Biophys.
Bioeng. 8, 69 (1979).3. B. Gavish, M. M. Werber, Biochemistry 18, 1269 (1979).4. W. R. Cannon, S. F. Singleton, S. J. Benkovic, Nat. Struct.
Biol. 3, 821 (1996).5. J. R. Schnell, H. J. Dyson, P. E. Wright, Annu. Rev.
Biophys. Biomol. Struct. 33, 119 (2004).6. C. A. Fierke, K. A. Johnson, S. J. Benkovic, Biochemistry
26, 4085 (1987).7. M. R. Sawaya, J. Kraut, Biochemistry 36, 586 (1997).8. R. P. Venkitakrishnan et al., Biochemistry 43, 16046
(2004).9. A. G. Palmer III, Chem. Rev. 104, 3623 (2004).
10. J. P. Loria, M. Rance, A. G. Palmer, J. Am. Chem. Soc.121, 2331 (1999).
11. M. Tollinger, N. R. Skrynnikov, F. A. Mulder, J. D. Forman-Kay,L. E. Kay, J. Am. Chem. Soc. 123, 11341 (2001).
12. F. A. Mulder, A. Mittermaier, B. Hon, F. W. Dahlquist,L. E. Kay, Nat. Struct. Biol. 8, 932 (2001).
13. D. M. Korzhnev et al., Nature 430, 586 (2004).14. M. Wolf-Watz et al., Nat. Struct. Mol. Biol. 11, 945
(2004).15. D. McElheny, J. R. Schnell, J. C. Lansing, H. J. Dyson,
P. E. Wright, Proc. Natl. Acad. Sci. U.S.A. 102, 5032(2005).
16. J. Evenas, A. Malmendal, M. Akke, Structure 9, 185(2001).
17. M. J. Osborne, R. P. Venkitakrishnan, H. J. Dyson,P. E. Wright, Protein Sci. 12, 2230 (2003).
18. H. Beach, R. Cole, M. L. Gill, J. P. Loria, J. Am. Chem. Soc.127, 9167 (2005).
19. C. J. Tsai, S. Kumar, B. Y. Ma, R. Nussinov, Protein Sci. 8,1181 (1999).
20. H. R. Bosshard, News Physiol. Sci. 16, 171 (2001).21. C. Wang, N. Karpowich, J. F. Hunt, M. Rance, A. G. Palmer,
J. Mol. Biol. 342, 525 (2004).22. D. E. Koshland, Proc. Natl. Acad. Sci. U.S.A. 44, 98 (1958).23. H. Frauenfelder, F. Parak, R. D. Young, Annu. Rev.
Biophys. Biophys. Chem. 17, 451 (1988).
www.sciencemag.org SCIENCE VOL 313 15 SEPTEMBER 2006 1641
REPORTSon July 7, 2018
http://science.sciencemag.org/
Dow
nloaded from
24. S. Hammes-Schiffer, S. J. Benkovic, Annu. Rev. Biochem.75, 519 (2006).
25. E. Z. Eisenmesser et al., Nature 438, 117 (2005).26. S. Kumar, B. Y. Ma, C. J. Tsai, N. Sinha, R. Nussinov,
Protein Sci. 9, 10 (2000).27. R. Koradi, M. Billeter, K. Wuthrich, J. Mol. Graph. 14, 51
(1996).28. N. R. Skrynnikov, F. W. Dahlquist, L. E. Kay, J. Am. Chem.
Soc. 124, 12352 (2002).
29. We thank J. Chung and G. Kroon for assistance withthe NMR experiments, L. Tennant for technicalassistance, and S. Benkovic for valuable discussions.This work was supported by NIH grants GM56879and GM75995 and by the Skaggs Institute forChemical Biology. D.D.B. was a recipient of a CanadianInstitutes of Health Research postdoctoral fellowship.D.M. was supported by a postdoctoral fellowshipfrom NIH.
Supporting Online Materialwww.sciencemag.org/cgi/content/full/313/5793/1638/DC1Materials and MethodsFigs. S1 to S11Tables S1 to S4
22 May 2006; accepted 25 July 200610.1126/science.1130258
Imaging Intracellular FluorescentProteins at Nanometer ResolutionEric Betzig,1,2*† George H. Patterson,3 Rachid Sougrat,3 O. Wolf Lindwasser,3 Scott Olenych,4
Juan S. Bonifacino,3 Michael W. Davidson,4 Jennifer Lippincott-Schwartz,3 Harald F. Hess5*
We introduce a method for optically imaging intracellular proteins at nanometer spatial resolution.Numerous sparse subsets of photoactivatable fluorescent protein molecules were activated,localized (to È2 to 25 nanometers), and then bleached. The aggregate position information fromall subsets was then assembled into a superresolution image. We used this method—termedphotoactivated localization microscopy—to image specific target proteins in thin sections oflysosomes and mitochondria; in fixed whole cells, we imaged vinculin at focal adhesions, actinwithin a lamellipodium, and the distribution of the retroviral protein Gag at the plasma membrane.
Transfected cells expressing fluorescent
proteins (1) contain information that is
accurate at the molecular level about the
spatial organization of the target proteins to
which they are bound. However, the best reso-
lution that can be obtained by diffraction-
limited conventional optical techniques is coarser
than the molecular level by two orders of mag-
nitude. Great progress has been made with
superresolution methods that penetrate beyond
this limit, such as near field (2), stimulated emis-
sion depletion (3), structured illumination (4, 5),
and reversible saturable optical fluorescence tran-
sitions microscopy (6), but the goal remains a
fluorescence technique capable of achieving reso-
lution closer to the molecular scale.
Early results (7) in single-molecule micros-
copy (8) and the spatiospectral isolation of
individual exciton recombination sites in a semi-
conductor quantum well (9) led to a proposal for
a means of molecular resolution fluorescence
microscopy a decade ago (10). In brief,
individual molecules densely packed within
the resolution limit of a given instrument Easdefined by its point-spread function (PSF)^ arefirst isolated from one another on the basis of
one or more distinguishing optical character-
istics. Each molecule is then localized to much
higher precision by determining its center of
fluorescence emission through a statistical fit of
the ideal PSF to its measured photon distribu-
tion (Fig. 1). When the background noise is
negligible compared with the molecular signal,
the error in the fitted position is sx,y , s/(N½),
where s is the standard deviation of a Gaussian
approximating the true PSF (,200 nm for light
of wavelength l 0 500 nm) and N is the total
number of detected photons (11, 12). Given that
it is possible to detect many more than 104
photons from a single fluorophore before it
bleaches, single-molecule localization to nearly
1-nm precision has already been demonstrated
(13–15) and applied to studies of molecular
motor dynamics (13).
Multiple emitters within a single diffraction-
limited region (DLR) have been isolated fromone
another by either spectral (15, 16) or temporal
means, the latter exploiting the photobleaching
(14,17) or blinking (18) of the emitters. How-
ever, the number of emitters isolated per DLR
(typically 2 to 5) has been too small to give
resolution within the DLR that is comparable to
existing superresolution techniques, and it is far
from the molecular level. Here, we developed a
method for isolation of single molecules at
high densities (up to È105/mm2) based on the
serial photoactivation and subsequent bleaching
of numerous sparse subsets of photoactivatable
fluorescent protein (PA-FP) molecules (19–24)
within a sample. We then applied the method to
image specific target proteins in thin (È50- to
80-nm) sections and near the surfaces of fixed
cultured cells, resolving the most precisely
localized molecules therein at separations
(È10 nm) approaching the molecular level.
The method and typical data subsets are
shown in Fig. 1. Cultured mammalian cells ex-
pressing PA-FP–tagged target proteins were
prepared by transient transfection, fixed, and
processed on cover slips either as whole cells or
in cryosections cut from a centrifuged pellet of
cells (25). Such cover slips were then placed in
a custom microscope chamber (fig. S1) de-
signed to minimize thermal and mechanical
drift (fig. S2) (25). They were continuously
excited by a laser at a wavelength (lexc
0 561
nm) near the excitation maximum of the ac-
tivated form of the expressed PA-FPs. Finally,
to minimize both autofluorescence and detector
noise, they were imaged by total internal
reflection fluorescence (TIRF) microscopy
(13, 26) onto an electron-multiplying charge
coupled device (EMCCD) camera that can
detect single photons.
Initial image frames typically consisted of
sparse fields of individually resolvable single
molecules on a weaker background presumably
dominated by the much larger population of
PA-FP molecules still in the inactivated state.
When necessary, excitation and thus bleach-
ing was maintained until such sparse fields
were obtained. Additional image frames were
then captured until single-molecule bleaching
resulted in a mean molecular separation con-
siderably larger than that required for isolation
(Fig. 1, A and C). At that point, we applied a
light pulse from a second laser at a wavelength
(lact
0 405 nm) capable of activating the re-
maining inactive PA-FPs, at a duration and in-
tensity chosen so that the overall density of
activated PA-FPs was increased back to a higher,
but still resolvable, level (Fig. 1, B and D). This
process of photoactivation, measurement, and
bleaching was then repeated (movie S1) for
many cycles over È104 to 9105 image frames
(depending on the expression level and spatial
distribution of the PA-FPs) until the population
of inactivated, unbleached molecules was de-
pleted. At typical frame rates of È0.5 to 1.0 s,
between 2 and 12 hours were required to acquire
a complete image stack that could be distilled
to a single superresolution image containing
È105 to 9106 localized molecules. We con-
tinued to explore methods (such as brighter
molecules, higher excitation power, and higher
activation density) to speed this process.
When the xy frames from any such image
stack are summed across time t, the molecular
signals overlap to produce a diffraction-limited
image (Fig. 1, E and F) similar to that obtained
by conventional TIRF, in which all molecules
emit simultaneously (fig. S3). However, when
the data are plotted in a multidimensional
volume xyt (Fig. 1, center), the signal from
each molecule m is uniquely isolated and can
be summed at each pixel and across all of
1Howard Hughes Medical Institute, Janelia Farm ResearchCampus, Ashburn, VA 20147, USA. 2New Millennium Re-search, LLC, Okemos, MI 48864, USA. 3Cell Biology andMetabolism Branch, National Institute of Child Health andHuman Development (NICHD), Bethesda, MD 20892, USA.4National High Magnetic Field Laboratory, Florida StateUniversity, Tallahassee, FL 32310, USA. 5NuQuest Research,LLC, La Jolla, CA 92037, USA.
*These authors contributed equally to this work.†To whom correspondence should be addressed. E-mail:[email protected].
15 SEPTEMBER 2006 VOL 313 SCIENCE www.sciencemag.org1642
REPORTSon July 7, 2018
http://science.sciencemag.org/
Dow
nloaded from
The Dynamic Energy Landscape of Dihydrofolate Reductase CatalysisDavid D. Boehr, Dan McElheny, H. Jane Dyson and Peter E. Wright
DOI: 10.1126/science.1130258 (5793), 1638-1642.313Science
ARTICLE TOOLS http://science.sciencemag.org/content/313/5793/1638
MATERIALSSUPPLEMENTARY http://science.sciencemag.org/content/suppl/2006/09/11/313.5793.1638.DC1
CONTENTRELATED http://science.sciencemag.org/content/sci/313/5793/1586.full
REFERENCES
http://science.sciencemag.org/content/313/5793/1638#BIBLThis article cites 28 articles, 2 of which you can access for free
PERMISSIONS http://www.sciencemag.org/help/reprints-and-permissions
Terms of ServiceUse of this article is subject to the
is a registered trademark of AAAS.Sciencelicensee American Association for the Advancement of Science. No claim to original U.S. Government Works. The title Science, 1200 New York Avenue NW, Washington, DC 20005. 2017 © The Authors, some rights reserved; exclusive
(print ISSN 0036-8075; online ISSN 1095-9203) is published by the American Association for the Advancement ofScience
on July 7, 2018
http://science.sciencemag.org/
Dow
nloaded from