report & route manager - bkvibro.com · document available to the public without prior written...
TRANSCRIPT

Keep it accessible for future reference
Report & Route Manager
Analysis, Machine Diagnosis, Reporting- & Data Collection Software for VIBROPORT 80 & VIBROTEST 80
Product Specification


© Brüel & Kjaer Vibro ● July 2018 ● BPS0137-EN-14 ● █ Page 3 of 32
Technical alterations reserved!
Copyright © 2018 Brüel & Kjaer Vibro GmbH All rights to this technical documentation remain reserved. Any corporeal or incorporeal reproduction or dissemination of this technical documentation or making this document available to the public without prior written approval from Brüel & Kjaer Vibro GmbH shall be prohibited. This also applies to parts of this technical documentation. Brüel & Kjaer Vibro GmbH Leydhecker Str. 10 64293 Darmstadt Germany Phone: +49 6151 428 0 Fax: +49 6151 428 10 00 [email protected]
Brüel & Kjær Vibro A/S Skodsborgvej 307 B 2850 Nærum Dänemark Phone: +45 77 41 25 00 Fax: +45 45 80 29 37
Hotline: Phone: +49 6151 428 1400 E-Mail: [email protected]
Page 4 of 32 █ © Brüel & Kjaer Vibro ● July 2018 ● BPS0137-EN-14 ●
Technical alterations reserved!
EN
Content
1 Product Specification 5
1.1 Placement within VT-80 & VP-80 portable instruments product line 5
1.2 Introduction 6
1.3 Overview Functions & Features 6
1.4 Measurement & Data Collection 8
1.4.1 ReO AB → Measurements by “Reports” 9
1.4.2 ReO ABC → ReO AB + Measurements by “Route” & “Off-Route” 10
1.5 Program Structure & Features for Analysis, Diagnosis, Reporting 12
1.5.1 Frequently used buttons – (1) 13
1.5.2 Data & Route Management – (2) 13
1.5.3 Measuring Device – (3) 14
1.5.4 Administration – (4) 14
1.5.5 Detailed data view – (5) 16
1.5.6 Views – (6) 18
1.5.7 Menu bar – (7) 26
2 Technical Data 27
2.1 Installation 27
2.2 PC-Software System Requirements 27
2.3 PC-Hardware System Requirements 28
2.3.1 Minimum System Requirements 28
2.3.2 Recommended System Requirements 28
2.4 Further technical information 28
3 Order Information 29
3.1 VT-80/VP-80 Packages with ReO AB or ReO ABC 29
3.2 Separate Orders ReO AB or ReO ABC and Upgrades 30

© Brüel & Kjaer Vibro ● July 2018 ● BPS0137-EN-14 ● █ Page 5 of 32
Technical alterations reserved!
© Brüel & Kjaer Vibro │Report & Route Manager Product Specification EN
1 Product Specification
1.1 Placement within VT-80 & VP-80 portable instruments product line
The scope of delivery of the entire VIBROTEST 80 & VIBROPORT 80 product family consists of hardware with the VT-80/VP-80 firmware application modules and the software Report & Route Manager, as well as accessories - more information about the VT-80/VP-80 is available in the corresponding product specification document. Hardware VIBROTEST 80 /E & VIBROPORT 80 Firmware Application Modules: 1 Overalls, 2 FFT-Analyzer, 3 Tracking, 6 Data collection, 7 Balancing, 9 Transfer Function, 10 Time Signal, 11 Acceptance Test Software Report & ROute Manager Please note: for the VT-80/VP-80 Acceptance Test module 11 and for particular sophisticated applications such as DSP signal post processing we offer “Report & EXaminer Software PREMIUM” for download on B&K VIBRO webpage. Hardware, firmware, software and accessories are supplied as packages, which are modular and can be flexible upgraded according to customer needs. The following listed packages are available with VT-80 respectively VP-80 and as E-Type ONLY with the small device VT-80 E (certified in hazardous/explosive atmosphere areas). Package Types Analyzer „A“ Analyzer & Balancer „AB“ Balancer “B” – Note: ONLY VT-80 Analyzer & Collector „AC“ Collector „C“ – Note: ONLY VT-80 More information about the packages later in the section 3 „Order information“

Page 6 of 32 █ © Brüel & Kjaer Vibro ● July 2018 ● BPS0137-EN-14
Technical alterations reserved!
EN
1.2 Introduction
The Report & Route Manager software is an integral part of the diagnostics and condition-based maintenance package for machinery and plants. Using this software will enable you to transmit and evaluate the vibration measurement data and process variables that you collect from all the machines in your plant asset when using VT-80 / VP-80 in the event of a problem or from regular route runs. The Report & Route Manager software simplifies organizing and evaluating the collected measurement data. You can then select the precise machines that need immediate maintenance from the machines in your plant asset. This will enable you to establish what caused the problems with the selected machines and identify the start of any damage as early as possible. Report & Route Manager is an extensive new development, i.e. the underlying software architecture is generic, highly flexible and arbitrary expandable. This state of the art software architecture is the foundation for future extensions in terms of functions, features and efficient solutions. The available VT-80 / VP-80 packages include either "ReO AB" or "ReO ABC", depending on their content of delivery. "ReO AB" or "ReO ABC" can also be ordered separately or the additional C functionality can also be purchased later on as an upgrade, which will enable "ReO ABC". In the following section you find an overview about all functions & features belonging to ReO AB respectively ReO ABC
1.3 Overview Functions & Features
Functions ReO AB ReO ABC
Basic Functions
Language version German / English / French X X
Data sources link access X X
Data source hierarchy X X
Filter for types of measurements X X
Expanded date and time filter X X
Support & Assistance X X
Default Report function - Diagrams X X
Default Report function - Tables X X
Standard reporting function balancing X X
Standard diagnosis X X
Journal X X
Sensor management X X
Manage comments X X
Manage data sources X X
User Management X X
Manage machine templates X X
Manage roller bearing database X X

© Brüel & Kjaer Vibro ● July 2018 ● BPS0137-EN-14 ● █ Page 7 of 32
Technical alterations reserved!
© Brüel & Kjaer Vibro │Report & Route Manager Product Specification EN
Functions ReO AB ReO ABC
Manage symptoms X X
System Manager X X
Backup and Restore databases X X
Multi-Edit & Select X X
"Over-lapping configurations" X X
Analysis Functions
Zooming X X
Comment area (visible) X X
Alarms X X
Diagrams X X
Standard cursors X X
Alarm and reference spectra editor X X
Frequency spectra analysis X X
Envelope curve spectra analysis X X
Transfer function analysis (Bode, coherence) X X
Tracking analysis (Bode, Nyquist) X X
Gear cursor to examine individual gear stages X X
Alarm indicator, automatic Y-axis standardization X X
System-wide Y-axis standardization X X
Y-axis Lin / Log scaling X X
Freely selectable signal detection display X X
Switchable phase response correction X X
Diagrams X X
configure own symptoms X X
Cursor-Readout Area X X
Exporting measurement data to Excel *.csv / *.xls X X
Protocol Expert (Measurement data Reports with Microsoft Word
Report template management X X
Text node management X X
Protocol expert X X
Export the measuring point hierarchy identifiers X X
Export the diagrams X X
VT-80/VP-80 Modules – Report Measurements
1.1 & 1.2 Overalls X X
2.1 & 2.2 FFT Analyzer X X
3 Tracking X X
7 Balancing X X
9 Transfer function X X
10 Time signal X X
Manually assigning the report measurements to measurement points when stored in the measurement database is possible via the interactive user dialog.
X X
Report module filter for efficient unloading, presentation & analysis of all supported report modules.
X X

Page 8 of 32 █ © Brüel & Kjaer Vibro ● July 2018 ● BPS0137-EN-14
Technical alterations reserved!
EN
Functions ReO AB ReO ABC
VT-80/VP-80 Module 6 Data Collection – Route Measurements (and Off-Route Function)
Route measuring points configuration X
Alarm limits handling X
Route Configurations X
Route Transfer & Management X
Unload Report X
Off-Route Function – Measurements from the VT-80 / VP-80 Module 6 with access to the following modules
1.1 & 1.2 Overalls X X
2.1 & 2.2 FFT Analyzer X X
10 Time signal X X
Table 1-1 Functions & Features related to ReO AB and ReO ABC
1.4 Measurement & Data Collection
Figure 1-1 Work sequence of a user for his application related ReO AB and ReO ABC
In the above Figure 1-1 the typical work sequence of an user in his application is related to the two software options ReO AB and ReO ABC. The general difference is, that adding C and using ReO ABC enhances the user to do systematic data collection via Route inspection where the measurements are configured within the software and a plant respectively routes are downloaded to the VT-80/VP-80 for use of VT-80/VP-80 module “6 Data Collection” According to the red highlighted boxes in Figure 1-1 the following measurement acquisition types respectively “Collection of Data” options are available
• Measurements by “Reports” belonging to ReO AB with the following VT-80/VP-80 modules ▪ Module 1.1 & 1.2 Overalls ▪ Module 2.1 & 2.2 FFT-Analyzer ▪ Module 3 Tracking ▪ Module 7 Balancing ▪ Module 9 Transfer Function ▪ Module 10 Time signal ▪ (Module 11 Acceptance Test with Report & Examiner Software)

© Brüel & Kjaer Vibro ● July 2018 ● BPS0137-EN-14 ● █ Page 9 of 32
Technical alterations reserved!
© Brüel & Kjaer Vibro │Report & Route Manager Product Specification EN
• Measurements by “Route” & “Off-Route” belonging to ReO ABC (respectively in particular C) o “Route”
▪ Module 6 Data Collection o “Off-Route”
▪ Module 1.1 & 1.2 Overalls ▪ Module 2.1 & 2.2 FFT Analyzer ▪ Module 10 Time signal
1.4.1 ReO AB → Measurements by “Reports”
Measurements configured and run directly on the VT-80 / VP-80 device are called Report measurements – abbreviation “Reports”. These measurement results can be viewed and analyzed directly on the device and it is also possible to transfer these measurements to the PC for a more detailed examination. The option to archive such reports in a database, if needed, already exists in ReO AB. They must be assigned to a measuring point during the storage process and they will be displayed in the data hierarchy below the route measuring tasks for the relevant measuring points after completion of the storage process. The following operations on Reports are available:
1. Filtering (based on all Reports saved on the VT-80/VP-80)
2. Opening (to look at it before they are stored in the database)
3. Storeing in the database (also directly possible without opening)
Filter options Open and/or Store & Analysis of Reports
Filter type Description Overview Description
Date/Time: You can filter the reports by date or time range.
Open: You have the option to analyze the Report BEFORE you decide to store it
Report [storage media]: You can filter the reports by their storage location "internal” or “SD card”
Analyse: You simply use the view Tab “Analysis”. Furthermore you can Synchronizing diagrams or decide on different views in case of multi-channel measurements
Report [module]: You can filter the reports according to the VT-80/VP-80 module used for the measurement
Save: Store the Report in the data base via a GUI
Table 1-2 Functions handling Reports – ReO AB
Page 10 of 32 █ © Brüel & Kjaer Vibro ● July 2018 ● BPS0137-EN-14
Technical alterations reserved!
EN
1.4.2 ReO ABC → ReO AB + Measurements by “Route” & “Off-Route”
Route measurements
The configuration for these measurements is made in the Report & Route manager at the measuring point level. All of the points to be measured will be compiled into a route and transferred to the meas- uring device. This route can then be opened in the measuring device's data collector module and be processed on a step-by-step basis. Configuring the specific measurements is no longer necessary on-site as all of the parameters that need to be set up have already been configured in the software Report & Route manager. You must download the route to the VT-80/VP-80 in order to be able to transfer the measured values made during the route run to the PC afterwards (unload). Up to 12 measurement tasks per measurement point can be configured as part of a route measure- ment. The measured values from these measurement tasks will be displayed directly underneath the measuring point's name after the route has been unloaded. When you have finalized the configuration in your plant in the hierarchy view, the general sequential steps of a route run are:
1. Create a new route
• It is an empty template to be filled 2. Configure the route
• by giving a name, description and setting the state (active / inactive) 3. Edit the Route
• Move, cut & insert elements or edit the properties of the route 4. Compile the Route
• By using a special GUI. Select from your Plant those elements or parts which should belong to a particular Route
5. Adapt the Route
• Within the GUI you have the option to adapt the particular Route independent of the plant structure – move, cut, delete, etc.
6. Download the Route to the VT-80/VP-80
• You are supported by the GUI and a download protocol summary 7. Perform the Route run
• You follow the Route and collect data with the VT-80/VP-80 8. Unload the Route from your VT-80/VP-80
• After the data is collected a GUI and unload protocol summary support you
Off-route measurements Further measurements called “Off-Route” from VT-80 / VP-80 modules 1.1 & 1.2 (Overalls), 2.1 & 2.2 FFT Analyzer and 10 (time signal) accessed out of VT-80 / VP-80 Module 6 are only possible in conjunction with ReO ABC. You can run an off-route measurement if, during a route run, you notice that you still have to make a measurement that you did not take into account during route creation. You can use a special device menu within the VT-80 / VP-80 Module 6 data collector to call up one of the VT-80 / VP-80 modules listed above, configure the measurement and then run it immediately afterwards. When the route is unloaded, the taken Off-Route measurements will be automatically assigned to the route measurement point that you were currently processing in your route when you have performed the Off-route measurement.

© Brüel & Kjaer Vibro ● July 2018 ● BPS0137-EN-14 ● █ Page 11 of 32
Technical alterations reserved!
© Brüel & Kjaer Vibro │Report & Route Manager Product Specification EN
The following table shows you the symbols in ReO AB and ReO ABC for:
• Reports
• Route Measurements & Off Route
Symbols Description
(1) Measurement point level
(2) Route Measured values
(3) Single measurements (Reports and/or Off-route measurements have the same icons)
Table 1-3 Symbols describing measurement types and measurement concepts

Page 12 of 32 █ © Brüel & Kjaer Vibro ● July 2018 ● BPS0137-EN-14
Technical alterations reserved!
EN
1.5 Program Structure & Features for Analysis, Diagnosis, Reporting
When you work with the Report & Route Manager you can open one or multiple working windows at the same time. A program window like shown in the above figure is always subdivided into the following work areas:
1. Frequently used buttons – (1): Some are used frequently and are available in different areas.
2. Data & Route Management – (2): covers your systems, machine groups, machines and
measurement points, Routes, Sensors, Comments.
3. Measuring Device – (3): In this work area you can set up a data link to your measurement
Device or to an SD Memory Card.
4. Administration – (4): Here you manage data sources, users, Machine Templates, Bearing
data and Symptoms
5. Detailed data view – (5): Select Measurement data source, Filter options, Hierarchical view
6. Views – (6): Configuration, Journal, Analysis, Reporting and Media
7. Menu bar – (7)
The following sections are related directly to the number items 1 to 7 shown in Figure 1-2
Figure 1-2 Overview about Software structure, handling & views

© Brüel & Kjaer Vibro ● July 2018 ● BPS0137-EN-14 ● █ Page 13 of 32
Technical alterations reserved!
© Brüel & Kjaer Vibro │Report & Route Manager Product Specification EN
1.5.1 Frequently used buttons – (1)
Some buttons are used very frequently and are available in many different areas. Table of frequently used buttons:
1.5.2 Data & Route Management – (2)
Data & Route Management covers your systems, machine groups, machines and measurement points. Routes, Sensors, Comments. The following options are available:
Buttons Description
Element / Add entry
Element / Delete entry
Save changes
Discard changes
Send to Protocol Expert
Clone window - opens the work area in a new window
Table 1-4 User Operations view (1)
Buttons Description
Measurement point hierarchy: Create and manage systems (including machine groups, machines and measuring points)
Routes: Create and manage Routes (applies only to ReO ABC)
Sensors: Create and manage Sensors (applies only to ReO ABC)
Comments: Create and manage Comments (applies only to ReO ABC)
Table 1-5 User operations view (2)

Page 14 of 32 █ © Brüel & Kjaer Vibro ● July 2018 ● BPS0137-EN-14
Technical alterations reserved!
EN
1.5.3 Measuring Device – (3)
In this work area you can set up a data link to your measurement Device or to an SD Memory Card. The following options are available:
1.5.4 Administration – (4)
The Software provides the following administrative functions: Here you manage data sources, users, Machine Templates, Bearing data
(4a) “Data sources”
The following data sources are available:
• “Measurement database” is initially empty and will contain your measurement data o Name, Description o You can backup and restore databases
• “Demo database” already contains data for learning to work with the software. o Name, Description
• “VT-80/VP-80 devices” having internal memory and SD card in the device o Connect & disconnect devices o Register devices o Edit and download/unload the VT-80/VP-80 device System Settings via the
software
Buttons Description
Device communication: Set up data link and configure Device
SD Memory Card: Configure SD Memory Card
Table 1-6 User Operations view (3)
Buttons Description
(4a) “Data sources” Create Databases
(4b) “Users administration” create new user accounts, manage rights
(4c) “Machine templates” Create and manage machine templates
(4d) “Bearing data management” Bearing datasets: Import, create manually, or calculate from bearing geometry
Table 1-7 User Operations view (4)
© Brüel & Kjaer Vibro ● July 2018 ● BPS0137-EN-14 ● █ Page 15 of 32
Technical alterations reserved!
© Brüel & Kjaer Vibro │Report & Route Manager Product Specification EN
• “SD card reader” o Software supports direct reading of VT-80 / VP-80 memory cards directly from a
PC-CARD drive (SD card reader)
• “Data Import from VT-60 / xms” o You can only edit data and measurement points for the VT-80 / VP-80. However
you have the option of importing your data from an XMS database. During import, the data are automatically converted to VT-80 / VP-80 type measurement points.
o An import assistant GUI assists you
(4b) “Users administration”
The Software has different access rights for the following user groups which you will find listed in a detailed table overview in the user manual:
• Admin
• User
• Data Collector
• Guest The following options are possible for users which you can edit and also assign passwords
• New User Group
• Additional User Group
• New User
• Additional User
(4c) “Machine templates”
Any machine created in the hierarchy tree, can be defined as the Default Machine or as a Template. After defined and stored
• Default Machines can be added to the hierarchy tree whenever you create a new machine.
• Template Machines can be selected from the menu item "New Machine from Template" when you create a new machine. The machine saved as a Template is inserted into the hierarchy tree.
(4d) “Bearing data management”
The following options are available for bearing data diagnosis
• Create a Bearing dataset manually o Manufacturer o Bearing type o Cycling frequencies o Outer race & Inner race o Rolling element & Rolling element (2x) o Cage

Page 16 of 32 █ © Brüel & Kjaer Vibro ● July 2018 ● BPS0137-EN-14
Technical alterations reserved!
EN
• Calculate bearing dataset from Bearing Geometry o Manufacturer o Bearing type o Bearing geometry o Rolling element diameter (d1) o Pitch circle diameter (d2) o Contact angle (ß) o Number of rolling elements (n)
1.5.5 Detailed data view – (5)
The work area "Detailed data view" is subdivided into the following areas:
(5a) Select measurement data source
You can choose the Measurement data source i.e. database. In the case above it is “HKW xms Demo”. The Levels in the hierarchical view are:
• Plant
• Sections
• Machine groups
• Machine
• Measurement point
• Measurement type
• Measurements under measurement type
Workarea Description
(5a) “Select measurement data source” where you can select the data source for which you want to edit the data, or on which your measurements are based.
(5b) “Filter options” where you can filter your measurement data
(5c) “Hierarchical view” where the data is presented hierarchically in the form of a hierarchy tree.
Table 1-8 User Operations view (5)

© Brüel & Kjaer Vibro ● July 2018 ● BPS0137-EN-14 ● █ Page 17 of 32
Technical alterations reserved!
© Brüel & Kjaer Vibro │Report & Route Manager Product Specification EN
(5b) Filter options
(5c) Hierarchical view
Workarea Operational commands
Move
Cut, copy, paste, Duplicate Elements
Edit Elements
Create Elements
Delete Elements down to Measurement Values itself (even a particular range out of Overall Trend can be deleted by a user friendly GUI)
Save Machine Templates and save settings as new default standards when creating new elements
Sent to Microsoft word customized measurement reports “Protocol Expert”
Table 1-10 Commands by right click in the hierarchical view
Workarea Description of filtering
Quick Display of Elements, to Machine Level -> Measurement Point level -> Measurement type Level
Time Ranges, Dates, Recent “days” “weeks” “month”, detailed time range by dd.mm.yyyy incl. time hh.mm.ss
Machine Name (on Machine level)
Measurement Type
Alarm State
Table 1-9 Filter options – here showing example of filtering by “Measurement Type”
Page 18 of 32 █ © Brüel & Kjaer Vibro ● July 2018 ● BPS0137-EN-14
Technical alterations reserved!
EN
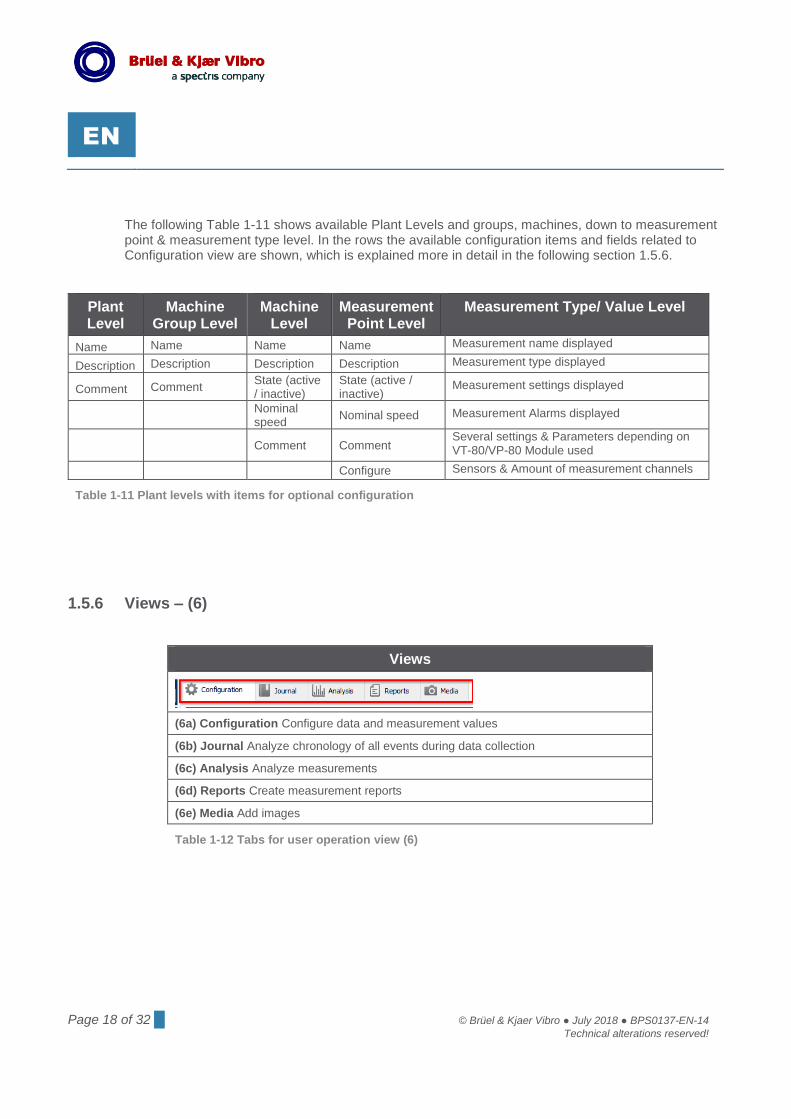
The following Table 1-11 shows available Plant Levels and groups, machines, down to measurement point & measurement type level. In the rows the available configuration items and fields related to Configuration view are shown, which is explained more in detail in the following section 1.5.6.
Plant Level
Machine Group Level
Machine Level
Measurement Point Level
Measurement Type/ Value Level
Name Name Name Name Measurement name displayed
Description Description Description Description Measurement type displayed
Comment Comment State (active / inactive)
State (active / inactive)
Measurement settings displayed
Nominal speed
Nominal speed Measurement Alarms displayed
Comment Comment Several settings & Parameters depending on VT-80/VP-80 Module used
Configure Sensors & Amount of measurement channels
Table 1-11 Plant levels with items for optional configuration
1.5.6 Views – (6)
Views
(6a) Configuration Configure data and measurement values
(6b) Journal Analyze chronology of all events during data collection
(6c) Analysis Analyze measurements
(6d) Reports Create measurement reports
(6e) Media Add images
Table 1-12 Tabs for user operation view (6)

© Brüel & Kjaer Vibro ● July 2018 ● BPS0137-EN-14 ● █ Page 19 of 32
Technical alterations reserved!
© Brüel & Kjaer Vibro │Report & Route Manager Product Specification EN
(6a) Configuration
Measurement Point Level Features available
The figure on the right belongs to ReO C (VT-80/VP-80 module 6 “Data Collection”). All other measurements are configured on the VT-80/VP-80 device
Configuration of the settings / parameters for the measurement
Sensor Type & Speed Reference
Plausibility check
Alarm limits for scalar values
Monitoring via Frequency Bands (arrays)
Monitoring via Reference & alarm spectra (arrays) special editor GUI
Edit Speed Values & enhanced speed measurement management for route measurements related to where the speed value is manually entered vs. measured vs. edited afterwards
Multi Edit: You have the option to edit multiple measurement point configurations (measurement tasks at measurement points) simultaneously and across the measurement points including a plausibility check.
Left middle in the figure on the right buttons:
• Bearing Data: from database & own bearings
• Symptoms: own symptoms in frequency range including experts symptoms like “harmonics or sidebands of a base frequency”
• Annotations: add comments
Enhanced Speed measurement management for on route measurements
Table 1-13 Configuration of route measurements in “Configuration tab”
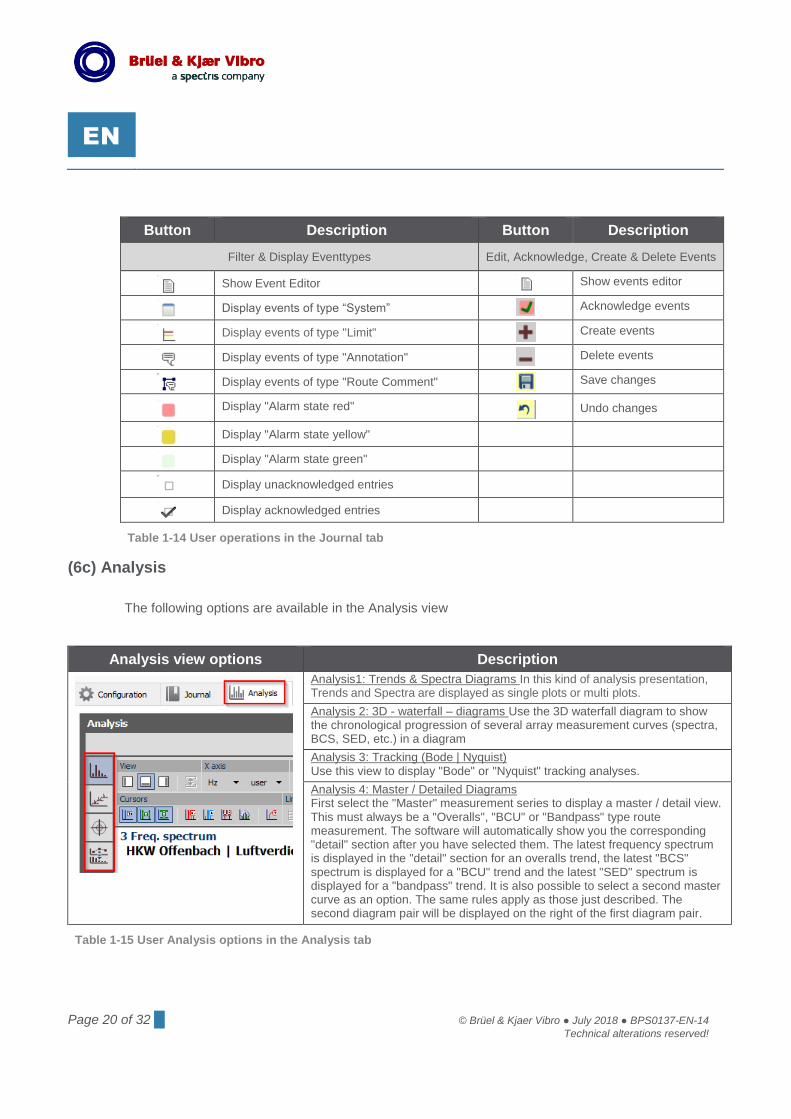
(6b) Journal
The Journal of ReO displays chronologically all events that have occurred since the commissioning of the software. The events are automatically acquired by the ReO program and recorded in the event table. The entries can be distinguished according to e.g. system messages, limit violations (alarms), changes in the properties of data elements (measurement Point setup), manual entries etc.
Page 20 of 32 █ © Brüel & Kjaer Vibro ● July 2018 ● BPS0137-EN-14
Technical alterations reserved!
EN
Button Description Button Description
Filter & Display Eventtypes Edit, Acknowledge, Create & Delete Events
Show Event Editor
Show events editor
Display events of type “System”
Acknowledge events
Display events of type "Limit"
Create events
Display events of type "Annotation"
Delete events
Display events of type "Route Comment"
Save changes
Display "Alarm state red"
Undo changes
Display "Alarm state yellow"
Display "Alarm state green"
Display unacknowledged entries
Display acknowledged entries
Table 1-14 User operations in the Journal tab
(6c) Analysis
The following options are available in the Analysis view
Analysis view options Description
Analysis1: Trends & Spectra Diagrams In this kind of analysis presentation, Trends and Spectra are displayed as single plots or multi plots.
Analysis 2: 3D - waterfall – diagrams Use the 3D waterfall diagram to show the chronological progression of several array measurement curves (spectra, BCS, SED, etc.) in a diagram
Analysis 3: Tracking (Bode | Nyquist) Use this view to display "Bode" or "Nyquist" tracking analyses.
Analysis 4: Master / Detailed Diagrams First select the "Master" measurement series to display a master / detail view. This must always be a "Overalls", "BCU" or "Bandpass" type route measurement. The software will automatically show you the corresponding "detail" section after you have selected them. The latest frequency spectrum is displayed in the "detail" section for an overalls trend, the latest "BCS" spectrum is displayed for a "BCU" trend and the latest "SED" spectrum is displayed for a "bandpass" trend. It is also possible to select a second master curve as an option. The same rules apply as those just described. The second diagram pair will be displayed on the right of the first diagram pair.
Table 1-15 User Analysis options in the Analysis tab

© Brüel & Kjaer Vibro ● July 2018 ● BPS0137-EN-14 ● █ Page 21 of 32
Technical alterations reserved!
© Brüel & Kjaer Vibro │Report & Route Manager Product Specification EN
The following Table 1-16 lists all feature items available at least in one of the four main “Analysis views 1 to 4” described in Table 1-15
Buttons Description Buttons Description
Group: View Group Cursor
Show symptom section
Show standard cursor
Show plot legend
Show Delta X cursor
Show cursor readout section
Show Delta Y cursor
Diagram synchronization
Show harmonics cursor
Group: X-axis Show sideband cursor
Axes scaling
Show symptom cursor
Axes standardization
Show gearbox cursor
Group: Y-axis Show text cursor
Axes scaling
Order cursor
Displaying the signal detection Group: Limits & Alarms
Axes standardization
Show limit values
Axes arrangement
Show reference spectrum
Ignore phase jumps
Show alarm spectra
Group: Zoom Show alarm bands
Display diagram in full
Show alarm indicators
Select zoom range using mouse Group: Peak values
Move axes using mouse clicks
Show peak indicators
Zoom axes using mouse clicks
Show peak list
Group: Print Reset the standard cursor to maximum
Print Group: Export
Print Preview
Copy into clipboard
Group: Display Send to protocol expert
3D waterfall grid
Export measurement data
3D waterfall grid (filled) Group: Help
3D waterfall contour
Help – Keyboard shortcuts
2D contour Diagram types for order & phase
3D resolution
Bode Diagram
Nyquist Diagram
Table 1-16 User Operation features in analysis tab

Page 22 of 32 █ © Brüel & Kjaer Vibro ● July 2018 ● BPS0137-EN-14
Technical alterations reserved!
EN
Figure 1-3 Exemplary views (Analysis 2 top / Analysis 4 bottom)
© Brüel & Kjaer Vibro ● July 2018 ● BPS0137-EN-14 ● █ Page 23 of 32
Technical alterations reserved!
© Brüel & Kjaer Vibro │Report & Route Manager Product Specification EN
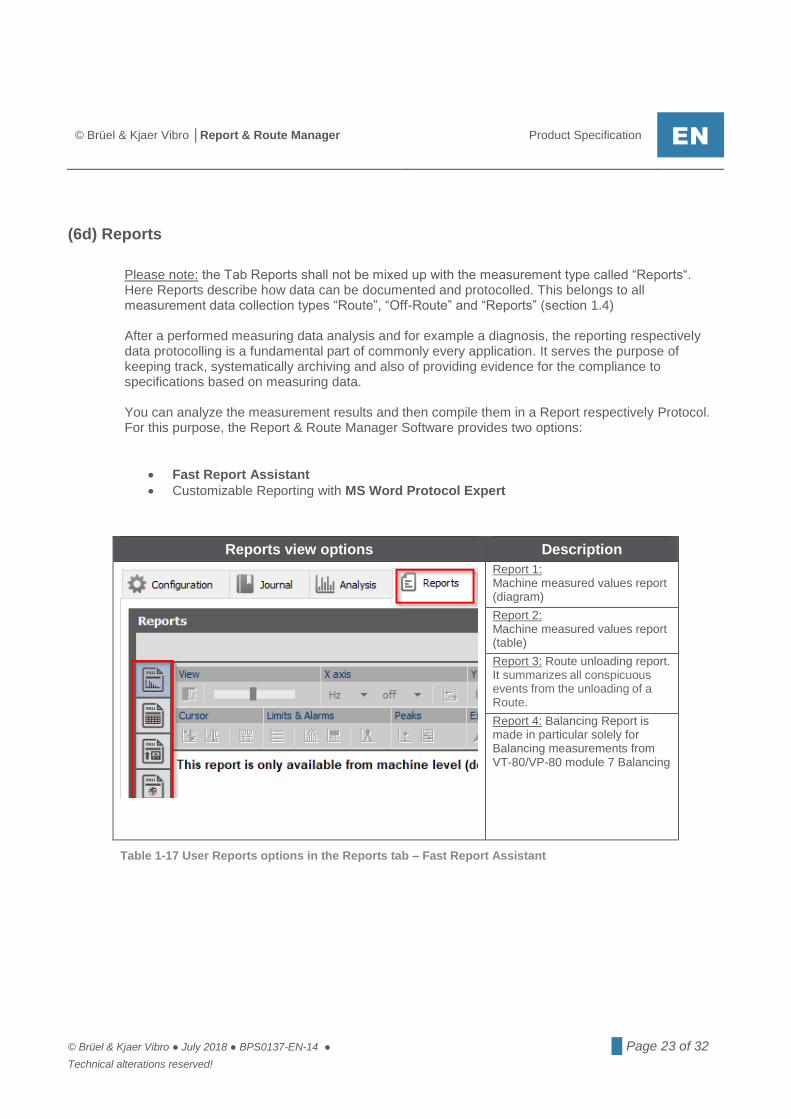
(6d) Reports
Please note: the Tab Reports shall not be mixed up with the measurement type called “Reports“. Here Reports describe how data can be documented and protocolled. This belongs to all measurement data collection types “Route”, “Off-Route” and “Reports” (section 1.4) After a performed measuring data analysis and for example a diagnosis, the reporting respectively data protocolling is a fundamental part of commonly every application. It serves the purpose of keeping track, systematically archiving and also of providing evidence for the compliance to specifications based on measuring data. You can analyze the measurement results and then compile them in a Report respectively Protocol. For this purpose, the Report & Route Manager Software provides two options:
• Fast Report Assistant
• Customizable Reporting with MS Word Protocol Expert
Reports view options Description
Report 1: Machine measured values report (diagram)
Report 2: Machine measured values report (table)
Report 3: Route unloading report. It summarizes all conspicuous events from the unloading of a Route.
Report 4: Balancing Report is made in particular solely for Balancing measurements from VT-80/VP-80 module 7 Balancing
Table 1-17 User Reports options in the Reports tab – Fast Report Assistant

Page 24 of 32 █ © Brüel & Kjaer Vibro ● July 2018 ● BPS0137-EN-14
Technical alterations reserved!
EN
The following table shows the user operations possible in the Fast Report Assistant views 1, 2, 3 & 4.
Buttons Description Buttons Description
ALL Report views 1, 2, 3, 4 ONLY Report view 1 and 3
Print Groups: X and Y Axis
Print Preview
Axes scaling
Help – Keyboard shortcuts
Axes standardization
Send to protocol expert
Axes scaling
In addition in Report view 3 Displaying the signal detection
Display the unloading statistics
Date range standardization
Show measured values diagram Groups: Cursor & Limits
In addition in Report view 2
Show standard cursor in trend display
Display alarm statuses
Show standard cursor in spectra f(n) / f(t) displays
Display prognosis bar
Show symptom cursor
Number of values The number of values to be displayed can be adjusted to fit your screen
Show limit values
Display the signal detection
Show reference spectrum
In addition in Report view 4 Show alarm spectra
Display measured value configuration
Show alarm bands
Do not list the balance process
Show alarm indicators
List the balance process (compact)
Show peak indicators
List the balance process (standard)
Show peak list
List the balance process (detailed)
Diagram Size
Display the diagram(s)
Displaying the measured value configuration
Diagram size
Standard cursor
Table 1-18 User Operation features in Reports tab

© Brüel & Kjaer Vibro ● July 2018 ● BPS0137-EN-14 ● █ Page 25 of 32
Technical alterations reserved!
© Brüel & Kjaer Vibro │Report & Route Manager Product Specification EN
In addition to Fast Report Assistant basic reporting, it is a well-known requirement to create measurement protocols in a flexible and user-specific manner. Starting with simple requirements, such as the integration of your corporate logo, cover letter or company information the requirements extend to the efficient processing of recurring text passages or application-specific structures within the measurement protocols that are related to the specific applications. Furthermore, an easily editable and widely-known document format is desired, as well as a simple management of the user-specific report templates. The MS Word Protocol Expert compiles the measurement results in a Word file. It allows you to edit and present the results in a professional, total flexible and versatile way. Key properties & Features:
• Protocol Templates & Text Modules: Up to 10 text modules (for example a glossary or extensive customer information) can be designed arbitrary, saved as a text module or block template to be used in the future. Additionally, up to 10 individual protocol templates can be customized, saved as a template to be used at any time. The Microsoft Word Document Base allows for:
o There are (almost) no limits to the possible design. o Company logos or cover letters, as well as headers and footers can be defined. o The structure of every report template can be precisely adapted to the requirements
of the measurement protocols or the application. o The text modules can be of any length and their contents may be chosen flexible. If
desired, it is, for example, possible to define a text module or block that is attached to every report and comprises, for example, a total amount of 50 pages that contains complex technical drawings of the installation respectively plant.
Figure 1-4 Balancing Report with Polar graph ready for print out

Page 26 of 32 █ © Brüel & Kjaer Vibro ● July 2018 ● BPS0137-EN-14
Technical alterations reserved!
EN
• Machine- and Measurement data Protocols: These can be presented in tabular as well as diagram types. The analysis view respectively the analyzed diagrams can be sent to the Protocol Expert together with further information by mouse click and are integrated into the Word documents immediately.
(6e) Media
For a system, a machine group, a machine and a measurement point, you can add an image that will be displayed below the hierarchy tree in the work area "Detailed View".
• Import several image formats you created with arbitrary 3rd party software programs
• Add the image and save it or delete it later
• Give a name & a description
1.5.7 Menu bar – (7)
The menu bar consists of the following options
• File
o Exit the software
• View
o Optional access to the views
• Extras
o Link to Protocol Expert
o System Manager (Restore, Backup, import of xms database VT-60)
o Preferences (Protocol Expert Templates, Language EN, DE, FR, Time signal
archive, basic settings)
o More (link for developer support)
• ?
o User Manual
o Help
o License manager
o Check for updates
o Remote support (integrated in the Software GUI)
o About

© Brüel & Kjaer Vibro ● July 2018 ● BPS0137-EN-14 ● █ Page 27 of 32
Technical alterations reserved!
© Brüel & Kjaer Vibro │Report & Route Manager Technical Data EN
2 Technical Data
2.1 Installation
The Software can be installed on a single workstation, or on multiple PCs on a network. In a network installation, a single common database can be installed to allow all workstations to access the same data. Here are the differences between the installation options:
• Single-user installation [Client & Server]: B&K Vibro Report & Route Manager and
database server will be installed on a PC.
• Network installation [Client only]: Only the B&K Vibro Report & Route Manager will be
installed in single clients on client PCs and a connection to a Report & Route Manager
database server must be set up afterwards.
• Network installation [Server only]: Only the Report & Route Manager database server
will be installed on the server PC. An example: A multi-client server application, e.g. with 4
client PCs, which accesses a common server PC via a network can be realized through
the network installation.
• Demo installation: You can try out the Software for 90 days before you buy and install it
without a valid license (serial number). During this evaluation period, all program functions
are available without restrictions.
The Software is supplied on the installation CD that comes with the purchase of a VT-80/VP-80.
2.2 PC-Software System Requirements
The Report & Route Manager Software is compatible with the following operating systems:
• Windows 7SP1 / Windows 8.1 Update 1 / Windows 10
• Windows Server 2008 R2 / Windows Server 2012 R2 /Windows Server 2016
You will also need to install the following drivers to run the VT-80 / VP-80 with your PC:
• Windows Mobile Device Center (for Windows 7,8 & 10 - 32/64bit)
o The Windows mobile device center is needed for communicating between your
computer and other Windows devices. You can download this driver as freeware
from the official Microsoft homepage.
• CMC USB driver (driver for connecting up to the VT-80 / VP-80 device)
o You will find the required USB driver on the installation CD for the Report & Route
Manager. You need to install this driver first, and then execute it via Start |
Programs | CMC USB Driver | Install.
Page 28 of 32 █ © Brüel & Kjaer Vibro ● July 2018 ● BPS0137-EN-14
Technical alterations reserved!
EN
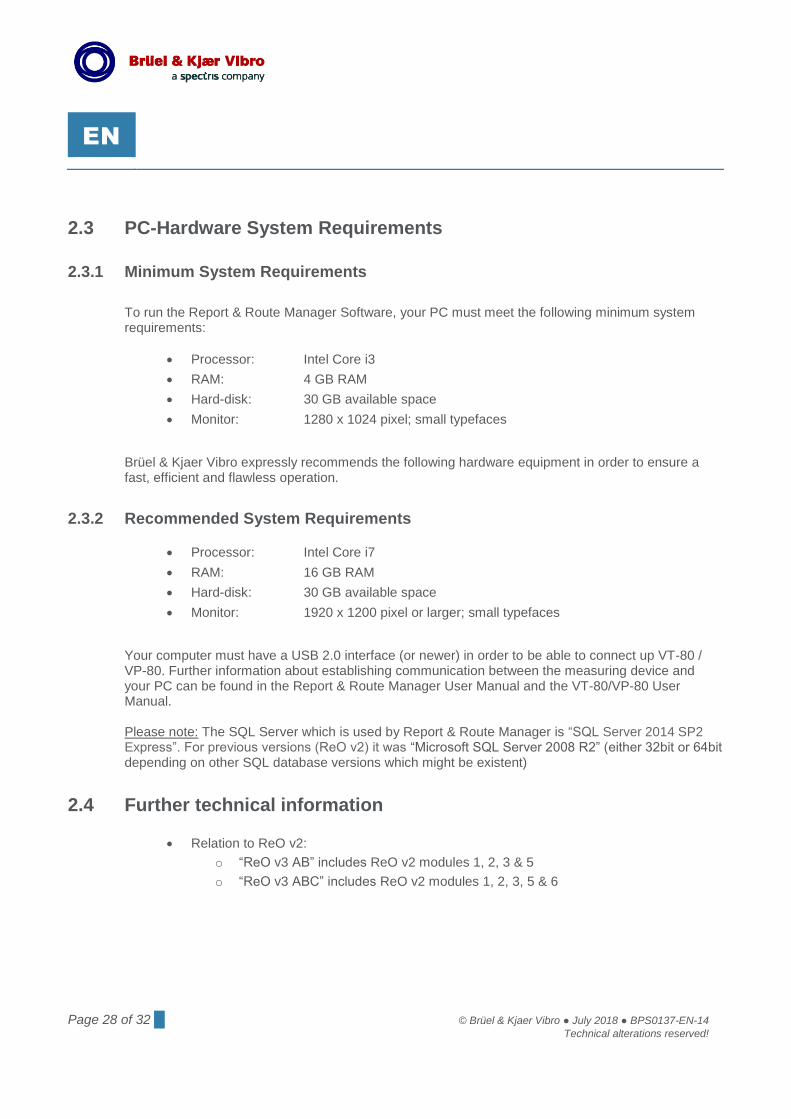
2.3 PC-Hardware System Requirements
2.3.1 Minimum System Requirements
To run the Report & Route Manager Software, your PC must meet the following minimum system requirements:
• Processor: Intel Core i3
• RAM: 4 GB RAM
• Hard-disk: 30 GB available space
• Monitor: 1280 x 1024 pixel; small typefaces
Brüel & Kjaer Vibro expressly recommends the following hardware equipment in order to ensure a fast, efficient and flawless operation.
2.3.2 Recommended System Requirements
• Processor: Intel Core i7
• RAM: 16 GB RAM
• Hard-disk: 30 GB available space
• Monitor: 1920 x 1200 pixel or larger; small typefaces
Your computer must have a USB 2.0 interface (or newer) in order to be able to connect up VT-80 / VP-80. Further information about establishing communication between the measuring device and your PC can be found in the Report & Route Manager User Manual and the VT-80/VP-80 User Manual. Please note: The SQL Server which is used by Report & Route Manager is “SQL Server 2014 SP2 Express”. For previous versions (ReO v2) it was “Microsoft SQL Server 2008 R2” (either 32bit or 64bit depending on other SQL database versions which might be existent)
2.4 Further technical information
• Relation to ReO v2:
o “ReO v3 AB” includes ReO v2 modules 1, 2, 3 & 5
o “ReO v3 ABC” includes ReO v2 modules 1, 2, 3, 5 & 6

© Brüel & Kjaer Vibro ● July 2018 ● BPS0137-EN-14 ● █ Page 29 of 32
Technical alterations reserved!
© Brüel & Kjaer Vibro │Report & Route Manager Order Information EN
3 Order Information
The Report & Route Manager Software is available as follows
(1) In all VT-80/VP-80 packages as either ReO AB or ReO ABC with upgrade option by ReO C (2) Separate order ReO AB or ReO ABC with upgrade option by ReO C as
• Client (Single User)
• Multi-Client (Multi User / 50 % discount on client price for licenses > 1 of same order)
• Client upgrade ReO v2 to ReO v3 (arbitrary ReO v2 configuration is upgraded to ReO v3 ABC)
3.1 VT-80/VP-80 Packages with ReO AB or ReO ABC
Figure 3-1 Order Overview of VT-80/VP-80 packages
Page 30 of 32 █ © Brüel & Kjaer Vibro ● July 2018 ● BPS0137-EN-14
Technical alterations reserved!
EN
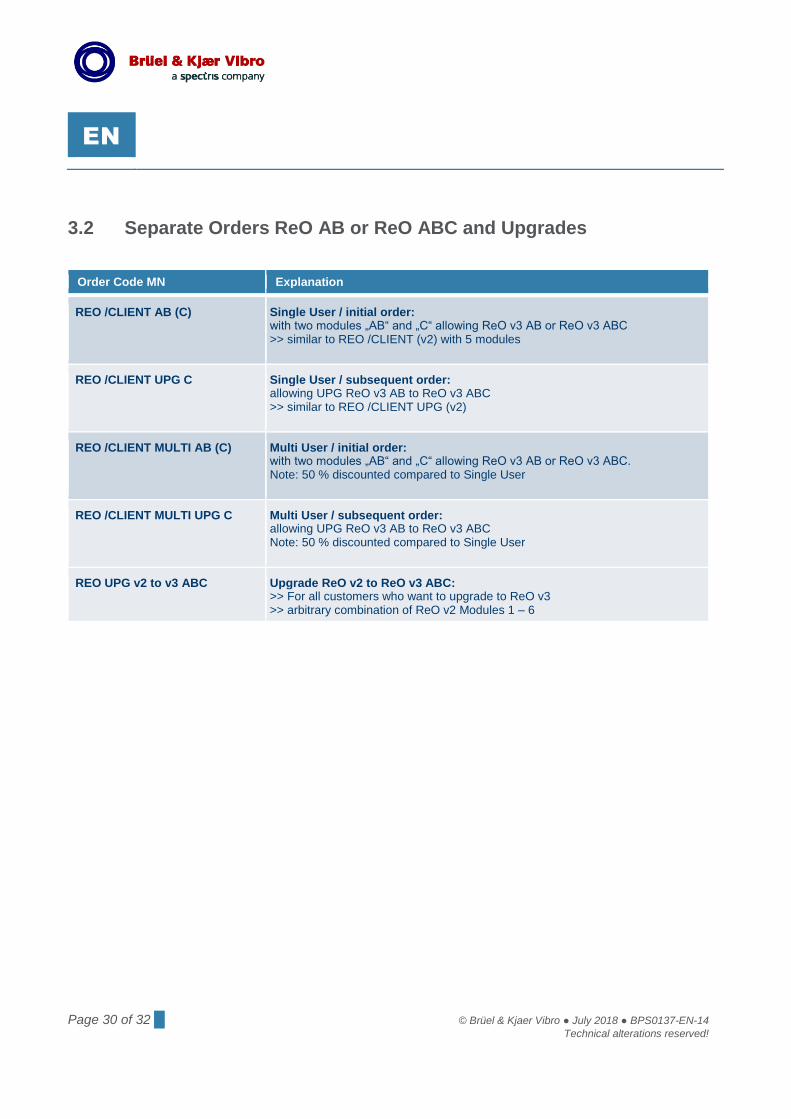
3.2 Separate Orders ReO AB or ReO ABC and Upgrades
Order Code MN Explanation
REO /CLIENT AB (C) Single User / initial order: with two modules „AB“ and „C“ allowing ReO v3 AB or ReO v3 ABC >> similar to REO /CLIENT (v2) with 5 modules
REO /CLIENT UPG C Single User / subsequent order: allowing UPG ReO v3 AB to ReO v3 ABC >> similar to REO /CLIENT UPG (v2)
REO /CLIENT MULTI AB (C) Multi User / initial order: with two modules „AB“ and „C“ allowing ReO v3 AB or ReO v3 ABC. Note: 50 % discounted compared to Single User
REO /CLIENT MULTI UPG C Multi User / subsequent order: allowing UPG ReO v3 AB to ReO v3 ABC Note: 50 % discounted compared to Single User
REO UPG v2 to v3 ABC Upgrade ReO v2 to ReO v3 ABC: >> For all customers who want to upgrade to ReO v3 >> arbitrary combination of ReO v2 Modules 1 – 6

© Brüel & Kjaer Vibro ● July 2018 ● BPS0137-EN-14 ● █ Page 31 of 32
Technical alterations reserved!
© Brüel & Kjaer Vibro │Report & Route Manager Order Information EN

Contact Brüel und Kjaer Vibro GmbH
Leydhecker Str.10
64293 Darmstadt
Germany
Phone: +49 6151 428 0
Fax: +49 6151 428 1000
Report & Route Manager ● BPS0137-EN-14 ●© Brüel & Kjaer Vibro ● Technical alterations reserved!