report on ridge 2000 (r2k) open data exchange system ... · ridge 2000 (r2k) open data exchange...
TRANSCRIPT

1
Report on RIDGE 2000 (R2K) Open Data Exchange System (RODES) Education Workshop
July 21-23, 2004 Lamont-Doherty Earth Observatory
1. Introduction The RODES Workshop project was designed to facilitate the use of interdisciplinary Earth science data collected by the RIDGE 2000 research program at the mid-ocean ridges. The workshop brought together the scientists from the Ridge2000 research program with educators at the high school and undergraduate level. There were three main objectives of the workshop: discuss issues of data access; develop strategies for student-centered data analysis; and, to provide recommendations on data access and curriculum development using Ridge2000 data. This report provides brief summaries of RODES goals and Ridge2000 data. The main intent of this report is to provide recommendations to both the Ridge2000 scientific community and to educators interested in using marine geophysical, geomorphological, geochemical, and biological data. This report provides recommendations from educators on data access via GeoMapApp and offers suggestions on the integration of new data types to augment Ridge2000 data. The report also provides recommendations on suggested curriculum use and classroom integration of Ridge 2000 data. Educators in the workshop emphasized the importance of having students explore data in a scientifically authentic manner. Educators assume students have some prior knowledge, but how much? A difficult task in teaching is gauging what students know and need to know. The answer is in having students conduct scientifically authentic investigations. Students need to make connections between the questions scientists are asking and their preconceived knowledge. By doing so, students are able to recognize their own gaps in knowledge, essentially motivating the student to learn new knowledge. If students are examining data on the cutting edge of scientific questions, then educators can reasonably assume that students will be fully exploring datasets as if they were conducting the research on their own. The Digital Library for Earth System Education (DLESE) Data Services (DDS) participated in the workshop as a collaborator with RODES scientists and educators. Additional information regarding the workshop, including presentations slides and discussion notes can be found at http://swiki.dlese.org/DataSvcsWkshp-04/140. 2. Overview of RODES: Defining RODES, RODES Data, and Data Recommendations 2.1. What is RODES? The Ridge 2000 (R2K) Open Data Exchange System (RODES) is a project designed to provide integrated access to all data types collected at the Ridge 2000 (R2K) study sites (http://www.marine-geo.org/ridge2000/). The intent is to have an overarching Data Management System (DMS) encompassing RODES and other scientific research projects

2
involved large amounts of geophysical, geomorphological, geochemical, and biological data. RODES education and outreach has three main goals:
1. To promote Ridge2000 science to the general public, helping make the public more aware, excited and supportive of this science.
2. To promote Ridge2000 science within the scientific community, helping recruit new and future research scientists and collaborators, and to increase awareness at colleges, universities, and research institutions.
3. To increase the awareness and understanding of Ridge2000 science within the context of science education in the K-12 community, and to help infuse science learning with excitement of discovery of the deep ocean.
In return, the users of Ridge2000 data can:
1. Contribute marine geological, geophysical, geomorphological, geochemical, and biological data types in order to augment data collected in R2K study sites.
2. Inform the development of RODES tools (i.e., GeoMapApp) without compromise to researchers
3. Develop a suite of exemplary activities that utilize RIDGE data (encourage development of future activities by example)
4. Provide data usage testing, offer suggestions for software revisions (GeoMapApp), and suggest new audiences and dissemination methods, revising, and dissemination.
5. Provide an understanding about how people learn from data Some scientists and educators think of Earth data as the sole propriety of scientists. However, Earth data provides an opportunity for students learn more about the origin of data, how data is represented, how data can be analyzed, and how data can help us learn more about Earth (Figure 1).
Figure 1. The data driven learning cycle for the purpose of learning more about Earth.

3
2.2. Data Availability, Good Scientific Questions to Ask, and Recommendations for Data Augmentation In this section, each dataset is briefly described as presented during the workshop. Accompanying the description are some good scientific questions that could be asked about the data, as presented by RODES scientists. The final section provides data augmentation recommendations from educators to the scientific community that would enhance the educators’ ability to use RODES data in learning environments. 2.2.1. Bathymetry There are two fundamental types of bathymetry data collected:
1. Classic echo sounder, in which a sound wave reflects of the seafloor and returns to the transducer on the ship (Figure 2). The data is collected continuously as the ship moves.
Swath Bathymetry data is obtained from a "swath" of measurements taken perpendicular to length of the ship and narrow in the direction of the ship’s path (Figure 3). Most measurements are at an angle to the bottom. Depth is determined from knowing the angle of emission from the transducer and strength of the signal returning to the ship. Swath bathymetry gives much more detail (Multi-beam is a special case of this, Sea Beam and hydrosweep are brand names of multi-beam). http://www.divediscover.whoi.edu/images/sonar_multibeam_top.gif
Figure 2. Schematic drawing of the echo sounding method. The arrow indicates direction of ship movement. (http://www.divediscover.whoi.edu/images/sonar_swath_top.gif)
Figure 3. Schematic drawing of the swath bathymetry sounding method. The arrow indicates direction of ship movement. (http://www.divediscover.whoi.edu/images/sonar_multibeam_top.gif).

4
What kinds of questions can we address with bathymetry data? When examining bathymetry data users of the data can visualize the ocean floor morphology – and see that there are indeed ridges associated with Plate Tectonics, which are different from mountains on land, and other topographic rises on the ocean floor. Questions that can be asked include:
• How high is a particular the ridge? • Where are the ridges? • Why do ridges have steep sides? (Liquid, hot, low density rock can be thought of as
floating on higher density material. Further away from the ridges things are cooler, thus denser, and thus lower standing.)
• What causes ridges to have faults and volcanic bumps, and some to have rift valleys? • What is the difference between the ridges and their surroundings? The ocean is a site
of deposition and volcanic eruption. People live in world of erosion while the ocean bottom is a world of deposition)
• What is the relationship between the ocean floor morphology represented on a map and the real-world sea floor shapes? (There has been some thought given to what the best colorscheme might be best for bathymetry data.)
• Why are some ridges segmented? (Many mid-ocean ridges are interrupted by major offsets (transform faults) and minor offsets (overlapping spreading center).
• What are the distribution and characteristics of the offsets? o Question about causes: Why are they there? o Question about consequences: What are the implications for the ecosystems,
for example, in the dispersion of hydrothermal organisms? • What are differences in the data visualization that are due to different modes of data
collection? collection (Figure 4)?
Swath bathymetry data Class Echo bathymetry data
Figure 4. A visual difference in data resolution from swath and echo bathymetry data (Adapted from Kim Kastens’ presentation at the workshop).
5
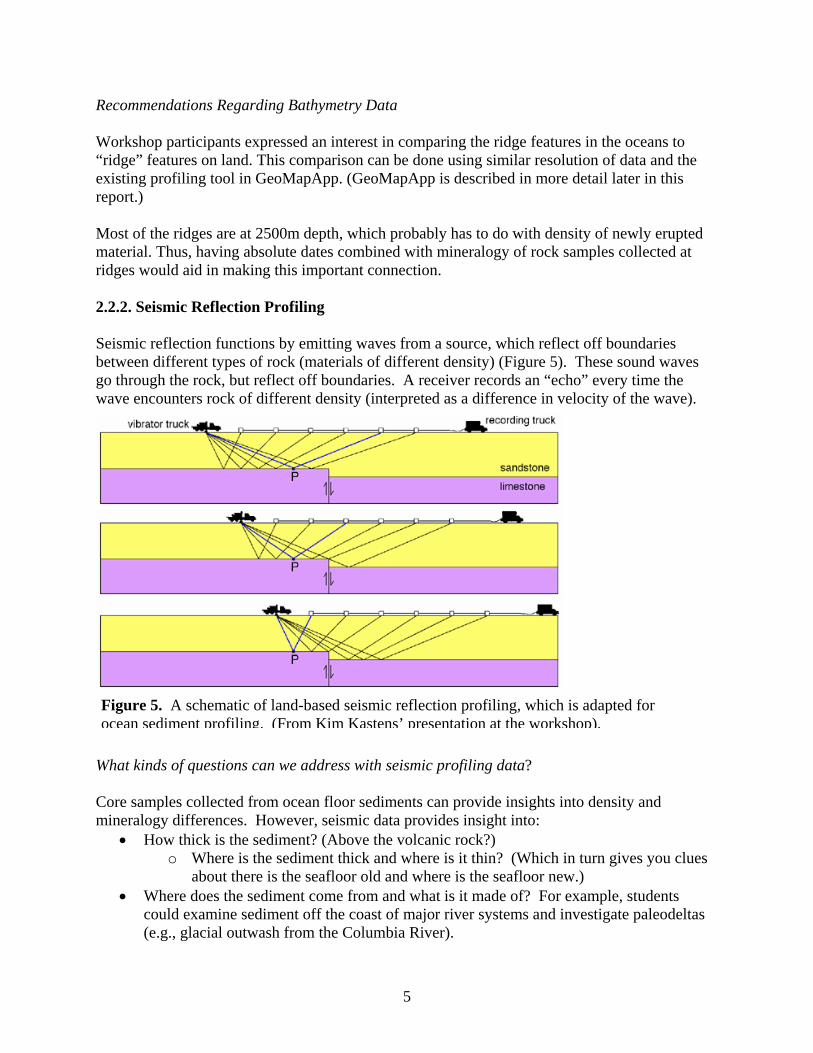
Recommendations Regarding Bathymetry Data Workshop participants expressed an interest in comparing the ridge features in the oceans to “ridge” features on land. This comparison can be done using similar resolution of data and the existing profiling tool in GeoMapApp. (GeoMapApp is described in more detail later in this report.) Most of the ridges are at 2500m depth, which probably has to do with density of newly erupted material. Thus, having absolute dates combined with mineralogy of rock samples collected at ridges would aid in making this important connection. 2.2.2. Seismic Reflection Profiling Seismic reflection functions by emitting waves from a source, which reflect off boundaries between different types of rock (materials of different density) (Figure 5). These sound waves go through the rock, but reflect off boundaries. A receiver records an “echo” every time the wave encounters rock of different density (interpreted as a difference in velocity of the wave). What kinds of questions can we address with seismic profiling data? Core samples collected from ocean floor sediments can provide insights into density and mineralogy differences. However, seismic data provides insight into:
• How thick is the sediment? (Above the volcanic rock?) o Where is the sediment thick and where is it thin? (Which in turn gives you clues
about there is the seafloor old and where is the seafloor new.) • Where does the sediment come from and what is it made of? For example, students
could examine sediment off the coast of major river systems and investigate paleodeltas (e.g., glacial outwash from the Columbia River).
Figure 5. A schematic of land-based seismic reflection profiling, which is adapted for ocean sediment profiling. (From Kim Kastens’ presentation at the workshop).

6
• How can we describe the morphology of turbidites? (For example, turbidite deposits are generally horizontal and fill low spots on the ocean floor).
• Can we use seismic data combined with bathymetry data to identify sediment made of dead planktonic organisms, which tend to drape over topography, like snow?
• Can we distinguish between the geometry of extrusive volcanic layer versus intrusive plutonic layer?
Recommendations Regarding Seismic Profiling Data Interpreting seismic profile data is not an easy task for the novice learner. Addition tutorials will be required on how to interpret a seismic “line” (Figure 6). There appears to be, however, an opportunity to link seismic reflection data with bathymetry data for investigating a particular ridge. 2.2.3. Magnetic Anomalies At mid-ocean ridges, lava erupts, forming a new basaltic floor for the ocean. As the lava cools, magnetic minerals in the lava align with the Earth’s magnetic field, providing geologists with a “snapshot” of the Earth’s magnetic orientation (a magnetic “stripe”). Scientists who study ocean floor magnetism are exploring questions such as:
• Why there are magnetic reversals?
Figure 6. A seismic reflection profile indicating “lines” of different rock densities (designated by the different colored lines. (http://strata.geol.sc.edu/exerices/seismic/EXERCIXE1-SOL-LRG.JPG).

7
• Can we predict the next reversal from the weakening of magnetic fields just prior to reversal?
Magnetic reversals, as evidence supporting plate tectonics, is a fundamental relationship taught in most Earth science courses. Overlapping magnetic data on bathymetry data would allow students to visualize the relationship between ridges and magnetic stripes. Additional data provided by the Ridge2000 research project can be found at http://www.marine-geo.org/ridge2000/. 3. GeoMapApp as a Data Access and Analysis Tool: Recommendations for Increasing Educator Use 3.1.Overview of the tool GeoMapApp is a platform independent Java application (http://www.marine-geo.org/geomapapp/) that presents digital elevation and bathymetric data (both echo and multi-beam swath) as a base map in Mercator projection. The user is allowed to interact with other data sets, including seismic reflection profiles, geochemical analyses, seismicity, and shipboard measurements. In addition, the user is allowed to import ASCII text (spatially designated by longitude and latitude) data on top of the base elevation/bathymetry map. Other functionalities include:
• Zoom and focus tools at the current data resolution. • Mask function, which distinguishes low resolution data from high resolution data. • User can define a place locator. • Grid data in order to change the color palette, range of data display, adjust vertical
exaggeration, and generate contour lines. In addition, the user can change the “sun illumination angle” to adjust the shaded relief, providing details on hidden morphologic features (in an otherwise “dark” ocean)
• User defined 3-D, where the user can change the orientation of the projection. • Profile the data spatially and create a depth graph. Users might use this feature to locate
an unusual depression feature, such as a collapsed volcano. • Include satellite data, such as LandSat data for land regions.
Recommendations from Educators for Improving Data Access and the Tool Learners need a map scale that adjusts with the zoom and focus features. In addition, the user needs a “you are here” location inset. (Note: At the time of this publication, this feature was added.) A colorscheme inset also should be added as a legend for visually determining elevations. On related data websites (available by following links about the datasets), information should be provided that describes where the data came from, how the data was collected, and how the data is currently being used for scientific investigations. (If students deal with raw data they can get an appreciation of the errors it might contain.) One final recommendation from the workshop was to make it clear to the user when they are looking at time series data and when they are looking at spatial data.

8
Insights on existing and potential data in the tool in GeoMapApp Workshop participants provided some additional suggestions on how to use datasets in GeoMapApp. The recommendations include:
• Examining individual RIDGE petrology sampling sites to link with biological data • Displaying all earthquakes from when a sensor was available. Colors generally show
depth, but there needs to be a scale. On the global map all the earthquakes are not plotted. The user should be able to define time and space for plotting of earthquake data. Currently, the user can choose look at a range of depths and earthquake magnitudes. One recommendation is to have users create profiles from magnitude (point) data. Learners could then visualize a subducting plate at a convergence boundary.
• One participant requested metadata information that answered the question “Is the earthquake depth from ocean floor or sea-level?”
• Using the mask can show you where there is high resolution data and when the data is low resolution.
4. Recommendations for Designing Data Rich Activities 4.1. Best Practices for Building Data Access Tools Both the scientist (data provider) and educator need to define data for their use. Some educators feel a satellite image is data, just as a scientist feels raw millivolt readings from a data logger is data (Manduca and Mogk, 2002). In many instances the data provider does not have a clear picture of what an educator needs and wants in terms of Earth system data. This gap can be bridged if educators and scientists can work together to create educational modules. There are three primary Internet-based methods in which data can be delivered to the end user, in this case defined as the learner. The first approach is browser-based pull technology. Here the learner generally chooses the data, which is then downloaded to their computer for processing. While inherently simple, several obstacles are encountered while obtaining the data. Generally, locating the data and parsing the desired data is too time consuming for the educator. In addition, data access pages all too often have cryptic acronyms describing the data, which requires insider knowledge about the data to decipher. The primary advantage to this method is for the data provider. The data provider merely needs to make their data available via search or file access without providing any further information. A second method is browser-based push technology. Here the user searches, displays, and conducts analysis of data within a browser window, where the data and software reside on the remote server. (This interface is popular among county assessors, whom use the technology for public mapping of property information; http://maps.merrick.com/website/weld/viewer.htm?Title=Weld%20County%2C%20Colorado). With this technology, the learner need only be familiar with the tools contained within the software. This method simplifies the need for the user to have knowledge about where to find data. In many cases, the tools for conducting analysis are pre-defined (such as zoom) and limit the learner’s ability to perform complex analysis.

9
The third method for data delivery is the client-server approach. Here the learner accesses data from within the visualization and analysis software, which is running on their computer. Data is delivered through a selection from a menu, emulating the typical directory structure found on most operating systems. The advantage here lies with the educator. This method makes transparent the need for “middleware” (software necessary for getting the data ready for a visualization and analysis program, such as Excel or Access). Thus, the learner doesn’t need to know how to use required middleware. Moreover, the user doesn’t have to search for data sources, as data sources compatible with the client software are made available through a “menu” or library. Finally, the learner doesn’t have to familiarize him or herself with data type (e.g., .hdf, .txt, .shp), as the data made available to them is already compatible with the client-server application. An example of a client-server software designed for educator use is MyWorld (http://www.worldwatcher.northwestern.edu/myworld/index.html). MyWorld allows the learner to quickly conduct data analysis on ESRI grid, polygonal, and point data. Learners can also create new data libraries by importing data from Thematic Real-time Environmental Distributed Data Services (THREDDS; http://my.unidata.ucar.edu/content/projects/THREDDS/index.html). For both data providers and educators, there are fundamental considerations regarding the knowledge of the learner. For example, the leaner should not be exposed to undefined acronyms. If acronyms are used, each should be defined and linked (possibly) to a glossary. The learner should be able to easily search for data. Command line searching and special Boolean characters should not be needed for searching. Geographical search methods are easier for users (see USGS Earthquake information at http://earthquake.usgs.gov/). Often, data is presented without units (for easier numeric manipulation). All data should be sent to the leaner with complete metadata information, including units, known errors, data collection methods, etc…) Data providers might consider separate portals for researcher vs. learner data access. NASA provides an example of “public” vs. “scientist”, but the public is only provided with limited data types. Data should be presented to the learner in context (e.g., visual image of a ridge, providing a link to the topographic data associated with the ridge profile). One final note, data providers and educators should think about data beyond a package of numbers, but as a package of information for doing science, linked closely to visualization tools. 4.2. Designing Data Rich Activities Educators have five primary goals for using data in the classroom: (Manduca and Mogk, 2002)
• Prepare students to address real-world problems, • Prepare students to develop their ability to use scientific methods, • Prepare students to critically evaluate data and interpretations, • Prepare students to develop their scientific, technical, quantitative and communication
skills, and • Prepare students to use data to further learning about science.
There are five guiding principles for designing data-rich activities:
1. Start with what students know and build from their curiosity,
10
2. Provide opportunities for students to construct ideas individuals and collaboratively,
3. Allow students time to explore and become oriented with both the technology and the data,
4. Design visualizations-rich learning activities with inquiry in mind, and 5. Provide resources for students to connect the content of visualizations to
alternative representations and develop skills to enable image analysis. Educators and data providers have to realize that understanding images are not automatic and inborn. Images contain information about a particular viewpoint, in which the learners may not be able to orient themselves. Data visualization can be utilized to help learners orient themselves and thus improve learning (www.nap.edu/html/howpeople1/ch9.html). Data access and visualization tools provide scaffolding opportunities for learning about data analysis. Learners need to learn how to use a tool as well as how to do analysis. All too often, educators teach students how to make graphs with data that is irrelevant. Push and client-server data access methods can provide the learner with an opportunity to construct both analysis skills and content within the context of the data (see the International Research Institute for Climate Prediction Climate Data Library at http://iridl.ldeo.columbia.edu/). Push and client server technologies could also include mechanisms for the sharing of data and results from analysis by building local and global communities beyond the classroom (See GLOBE website at http://www.globe.gov). In summary, designers of data rich activities can provide the context (orientation) for visualizing data, tools for conducting analysis, and utilize the internet for communicating results. In addition, a primary concern from educators that use data-rich activities is technical support. Local school technology experts might be unfamiliar with scientific software and unable to assist teachers and students in troubleshooting. Moreover, teachers need additional support in scientifically interpreting correctly visualized data. Therefore, developers of data-rich activities must consider the needs to teachers, providing communication methods for teacher support and professional development. 4.3. Recommendations GeoMapApp provides students with an immediate opportunity to explore familiar territory. Students can zoom in onto their local area, noting familiar landmarks, such as mountain peaks and local river systems. With GeoMapApp, students can
• Develop basic spatial pattern recognition skills. • Develop skills on the translating symbols, which is often a difficult skill in learning about
topographic maps. (For example, students often struggle with interpreting a “V” shape contour along a stream as an indication of stream flow direction.)
• Develop decision making skills in determining how to display data to answer questions. Students can discover data trends in time and in space.
How to ease the process of learning to use data

11
Designers of data-rich activities should start with the familiar data types (familiar images of mountain elevation, for example). In describing data, use process oriented names or labels (e.g., “decreasing mantle temperature”). Aim for a balance between “fundamental truths” and the current research topics (unanswered questions) in order to impress on students how much is yet to be discovered. Begin investigations with context. Where are you (the learner) in time? Where are you in space? What is the context for the problem to be studied? Introduce the leaner with one data type (e.g., digital elevation model data), and then add additional data types to the visualization or study, remembering to maintain the context. Build experiences gradually from the small spatial scale (familiar) to the larger (regional) spatial scale to global scale as much as possible. Ask students to articulate what they think is happening in the processes they are studying early and often. As a hands on activity, have students think about the processes in the real world in the context of looking at the data (e.g., building a wax model of a mid-ocean ridge in the context of RIDGE data). Keep in mind that using data can be confusing rather than illuminating if scaffolding experiences that introduce real world variability are not considered (Kimble, 2004). “Clean,” contrived lab exercises can confuse students who then have to work with “messy” real data. Lab experiences need to prepare students to work with noise in data. Data can be used to help students begin to construct ideas about relationships (e.g., earthquakes, volcanoes = plate boundaries). This leaves the teacher to use direct instruction as a means of filling in the knowledge gaps. Generally, students enjoy collecting data and using tools. However, processing the numbers is more difficult, as many students don’t know what to do with the data in order to address a scientific question. One way to help students work with numbers is to have students become specialists in one aspect of the data (e.g., data type, or specific statistics like mean, range, etc…) Have students then present that information and its implications for what the data can show in order to create in a broader context. 5. Insights in Using RODES data for Developing Data Rich Activities This section specifically examines both datasets currently available (as of the workshop) in GeoMapApp or datasets that should be included in GeoMapApp. Workshop participants in breakout groups were asked to provide insights in using the data for creating activities. There were several common insights and recommendations for data visualization and design considerations:
• Adding geopolitical reference to where the mouse is located on the map would be helpful (Note: an inset map was added to GeoMapApp post workshop).
• Participants would like a “hand” symbol/icon to move the image, replacing the scroll bars at the margin.

12
• Under grid rendering tool, users are provided with a default sun aspect. If the user made changes, there isn’t any way to return to the shading. The same is true for the colorscheme range selection.
• When using the zoom tool, a bounding box needs to be included. • Users would also like to be able to enter a latitude and longitude as a means of “zooming
to a select location. This would be great for students who want to “zoom to their own backyard.”
• Saving user defined “places” is an excellent feature. • The map scale is hard to read with black tick marks and needs a light background color. • Users like the option of loading their own data. • A potential misconception that needs to be highlighted in teacher use pages is the “sun
illumination” feature under grid rendering. Students might actually think the Sun light reaches the ocean floor.
• There should be some sort of feedback to the user that the system is thinking (e.g., a spinning wheel).
5.1. Geochemistry A detailed petrology database (PETDB) exists in GeoMapApp. For educators the interface is a bit complex and requires additional metadata (beyond the web link) for the novice to intermediate user. The workshop participants offered some comments and suggestions on the data interface:
• Users would like to have graduated colorscheme based on density. • Users need different symbols/colors for different rock types when displayed on the map,
in order to spatially distinguish between rock types. This occurred when asking the question one might ask students, “What is the ocean mostly made up of?”
• Users would like the option for a brief pop up information window describing how the data is collected and recommendations for displaying the data.
• Data display seems arbitrary. The user should be able to define the data table display as alphabetical, chronological, by date, or sort by author.
The geochemistry breakout group suggested a few interesting scientific investigations: The user might want to be able to plot sampling positions of rock samples with a specific chemistry or different chemistry in different colors (in other words, combine PetDB's ability to extract subsets of rocks with different characteristics with GeoMapApp's ability to geolocate the data). There is a problem with sample locations on GeoMapApp when you zoom in to high resolutions. For some of the samples the location is quite imprecise, either because there were dredges covering a lot of ground, or just poorly navigated. It would be a good option if the size of the symbol might be adjusted to indicate the navigational uncertainty on large scale maps. Thus, the

13
user won’t leap to the conclusion that the sample comes from one little bathymetric feature when in fact it might come from anywhere in the area. The composition of continental rock is different from ocean composition. PETDB should include some continental datasets so that students can explore the differences. Most scientists want to compare rocks from different regions:
• Different tectonic settings • Different locations (e.g. Pacific Ocean vs. Indian Ocean)
Does the chemistry tell you something about how the rock was formed? Users can use isotope ratio data to help identify source differences, such as the interior of the Earth under one ocean vs. another ocean. The question that can be asked is, “How can that be if the interior of the Earth is mixing?” Other questions include, “What are the barriers to mixing? Are there vertical layers of crust, which are subducted that act of barriers to mixing until they are completely consumed (looses all previous solid identity)?” And finally, different chemical substances act differently when subjected to the same Earth process. How has the geochemistry changed through time? What are the trends, if any? What is the relationship between mantle temperature in different places and the distance from a hotspot. 5.2. Human and Physical Geography This breakout session group also offered suggestions on data and design. This group noted that there was nothing in the way of “water data” (e.g., ocean temperatures). This group would like to be able to “sample” historical fluid data from a vent. Along with the sampling, the group would like to obtain biology information related to the vent thermal and chemical data. Thus, the user could ask questions regarding the biogeochemical fluid of vents. 5.2.1 Design Idea Students could write an environmental risk assessment for a country (using the online CIA fact book). The report would include an examination of the country’s topography and plate tectonics. Students could load natural hazards, earthquakes, and volcanoes (volcano data needs to be added to GeoMapApp). To ease use, GeoMapApp should have the capability of customizing a database, which would allow teachers and learners to build in needed information. This functionality needs to be easy – seamless addition of data via the client-server approach (possibly adding THREDDS capability). Example data includes floods, population/demographic, and environmental geology. GeoMapApp needs to allow the user to overlay geopolitical information. The students would be assigned a specific place on the globe with a jigsaw approach to reporting. This idea is interdisciplinary in nature, allowing for an avenue of investigation for geographers, economists, and social scientists. 5.3. Biology
14
The biology breakout group suggested general data types for enhancing GeoMapApp’s data library. These include location metadata, species lists, sizes of animals, temperature and chemical data, and genetic sequences. In addition, the group provided recommendations for investigations:
• Distribution of animals in relation to an environmental gradient o Zonation of species endemic to hydrothermal events. o Macrofaunal assemblages in different chemical micro-habitats (e.g., species
assemblage collected near high H2S measurement vs. species near moderate to low H2S
o Gender differences in habitat utilization at vents (e.g., sex ratio in higher vs. lower temperature (crabs at periphery more likely to be female - Why?)
• Colonization of habitat “islands” – hot vents as islands. o Connect to colonization of a clear cut area.
• Gene flow among different locations – tie into Darwin finches. • Animal behavior in a dynamic environment. • Rates of animal activity as determined from time-lapse photos. • Chemical fluctuations that controls activity. • Contrasting traditional vs. genetic species classification (e.g., different kinds of tube
worms seems to all live together when one kind seems to be there first) o Compare tube worms to earthworms and leaches that are genetically in the same
group o Question if things evolved from thermal vents. Some evidence suggests that tube
worms might have evolved from shallower worms. 5.3.1 Ideas for Using GeoMapApp to Teach Biology
• Create a grid of known hydrothermal vents and be able to zoom in on organisms and/or data table (depth, temperature, description of vent site, known names of area, and any other available data).
• View pictures/time lapse data of vent over time.
• Look at chemical data to see if predictions about hydrothermal vent locations and/or
organisms can be made.
• Look at bathymetry data to see if predictions about hydrothermal vent locations and/or organisms can be made.
• Look at rock formation data to see if predictions about hydrothermal vent locations and/or organisms can be made.
5.4. Geophysical Data The final breakout group focused on providing insights from geology and geophysics. Similar to other groups, suggestions were made for cross-disciplinary examination, with locations

15
georeferenced. For example, students could be conducting an interdisciplinary investigation of data about “their backyard.” Insights in using geophysical data to learn about Earth include:
• Morphology can be examined at different scales – much of the topography can be replicated at the scale of the classroom.
o Scientists have learned a lot about how faulting in oceanic crust occurs by creating wax models.
• Whole Earth geophysical datasets (both land and sea) are new to the scientific community. Thus, only about 2% has been investigated, providing the learner with an opportunity to be the first to examine a particular region using these data.
• The birth of ocean floors by examining new ridges of active spreading. The “birth canal” is a very narrow track (on the order of 100 m wide) with very steep sides. The ocean crust is 6000m thick and new floor flows on top of previous flows (similar to a composite volcano). Seafloor is the youngest closest to the ridge and seafloor age is symmetric around the axis. Students would notice that sediment thickens with distance from spreading axis (with increasing age).
Some questions that could drive the design of activities include:
• Where did the old seafloor go? • Why did the ridge happen where it happened? • Or, even ask questions that we cannot conceive.
With the existing data, the learner could:
• Compare and contrast different ridge areas with different spreading rates • The East Pacific Rise (EPR) site is spreading at about 110 mm per year (smoother flanks
and shallow ridge axis) • The Endeavor site (of the coast of Washington state in Canadian waters) is spreading at
60 mm per year (much larger –in relief - has flank faulting, narrow deep central ridge axis). Locations further out on the newly formed crust are getting buried in sediments (in this case only on the side closer to the continental margins.
The group suggested that with the data, a student could move from observation (shape) to interpretation (process). 6. Progress on Creating Data-Rich Activities Educators participating in the workshop were given direction to complete a data-rich activity. Two groups pursued the opportunity to use the Earth Exploration Toolbook (EET - http://serc.carleton.edu/eet/) as a template for creating their data-rich activities. The first activity (nearly completed at the time of this writing) examines sea-floor morphology. Learners will gain an understanding of
1. How data is gathered about sea-floor depth, 2. How these data provide scientists with an understanding of sea-floor morphology.
16
This activity will serve as an introduction to using GeoMapApp for geophysical exploration. The second activity parallels the first, but applies sea-floor morphology in the context of mid-ocean ridges and plate tectonics. Learners in this activity will
1. Learn how to map, analyze, and synthesize data using GeoMapApp, 2. Make inferences about the symmetry of ocean ridges near spreading centers, 3. Compare spreading rates with their implications on the biological environment.
Both activities are expected to be published on the EET website by early 2006. 7. Summary The primary goal of the workshop was to provide recommendations on data access and design of data rich activities to the RODES community. In terms of recommendations in the development of GeoMapApp, many of the workshop participants’ recommendations for access were received and implemented. Specifically, GeoMapApp now contains an inset map showing the user their current location on Earth. Second, a tool that measures distance along a great circle or straight line produces a profile graph in a separate window (providing the grid tool has been loaded). And finally, for most datasets in GeoMapApp, additional information about the dataset, as queried by the user, is included as a separate window. Scientists in the workshop were provided with new knowledge about what educators want in terms of data access. Educators were provided with new knowledge about what scientists are doing with the data. Both groups were brought together to provide synergy in recommending a design for RODES data-rich activities that allow the learner to conduct authentic investigations. And thus, perhaps the most fundamental result of the workshop, not explicit in the workshop objectives, was the bridging of the communication gap between scientists and educators. 8. References and Resources Bransford, J. D., A. L. Brown, and R. R. Cocking, eds., 1999. How People Learn. Committee on Developments in the Science of Learning Commission on Behavioral and Social Sciences and Education National Research Council. (www.nap.edu/html/howpeople1/ch9.html) DLESE Data Services: http://www.dlese.org/cms/dataservices/. DLESE Data Services RODES Workshop SWIKI: http://swiki.dlese.org/DataSvcsWkshp-04/140. GeoMapApp: http://www.marine-geo.org/geomapapp/ GLOBE: http://www.globe.gov International Research Institute for Climate Prediction: http://iridl.ldeo.columbia.edu/ Kastens, K., 2004. RODES Workshop Presentation, July 2004.

17
Kimble, C. J., 2004. Examination of laboratory and virtual activities on students’ understanding of earthquakes in high enrollment introductory geology classes. Masters of Arts Thesis. University of Northern Colorado. Manduca, C. A. and D. W. Mogk, 2002: Using Data in Undergraduate Science Classrooms. A final report on an interdisciplinary workshop held at Carleton College, April 2002. 40pp. (http://serc.carleton.edu/files/usingdata/UsingData.pdf) MyWorld : http://www.worldwatcher.northwestern.edu/myworld/index.html. Ridge 2000 Education and Outreach: http://www.ridge2000.org/eo/index.html. Ridge 200 Research Project: http://www.marine-geo.org/ridge2000/. Thematic Realtime Environmental Distributed Data Services (THREDDS): http://my.unidata.ucar.edu/content/projects/THREDDS/index.html University of South Carolina Sequence Stratigraphy Website: http://strata.geol.sc.edu/exerices/seismic/EXERCIXE1-SOL-LRG.JPG.
9. Participants RODES Education Workshop
Participants Name Institution Role Thomas, Jeffrey Teacher’s College
Fairfield HS
K-12 teacher Earth Science, Meteorology
Swenson, Sandra [Clark]
Teacher’s College Ramapo College of NJ
Former HS Biology teacher Ed. Tech. Specialist
Levy, Marci Teacher’s College Packer Collegiate Inst.
K-12 teacher Biology
Bemis, Karen Rutgers University Undergrad. Educator hydrothermal plumes, volcanology
Smith, Matt University of Florida Undergrad. Educator, PetrologyToo Shosa, Jennifer Colby College Undergraduate Educator, Geochemistry,
Hydrology, Geology Floyd, Jackie LDEO Undergrad Intro to Earth Science Goddard, Charlotte Oregon State Univ. Grad. Student, petrology Goehring, Liz Penn State University Educ. Coordinator Kyro. Laura MARGINS office, Wash.
U. , St. Louis Educ & Outreach
Ledley, Tamara TERC DLESE Data Services Group Taber, Mike Dept. of Earth Sciences, DLESE Data Services Group
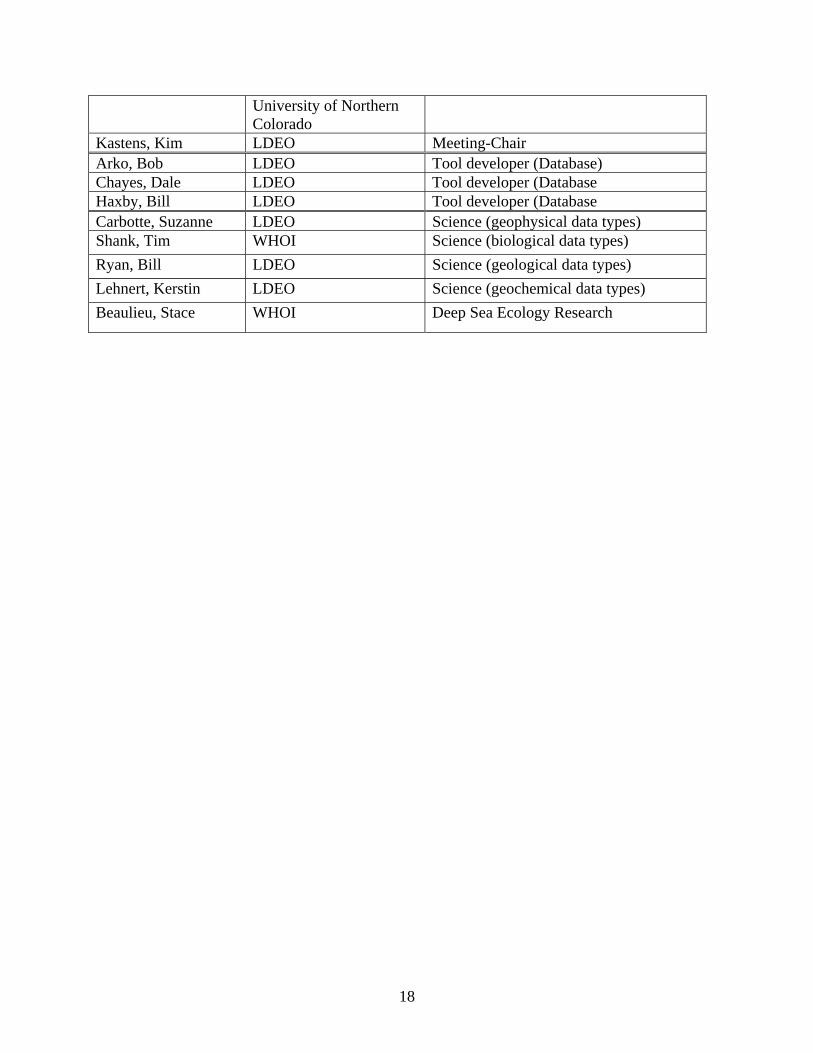
18
University of Northern Colorado
Kastens, Kim LDEO Meeting-Chair Arko, Bob LDEO Tool developer (Database) Chayes, Dale LDEO Tool developer (Database Haxby, Bill LDEO Tool developer (Database Carbotte, Suzanne LDEO Science (geophysical data types) Shank, Tim WHOI Science (biological data types) Ryan, Bill LDEO Science (geological data types) Lehnert, Kerstin LDEO Science (geochemical data types) Beaulieu, Stace WHOI Deep Sea Ecology Research