report of the bureau of commercial fisheries biological ... · zabel-rusa.ell proposal) and in...
TRANSCRIPT
XF WC-A 342 1-2:.! (1970) u.s Fish Wild!. Serv. Circ.
REPORT OF THE BUREAU OF COMMERCIAL FISHERIES BIOLOGICAL LABORATORY,
ST. PETERSBURG BEACH, FLORIDA, Fiscal Year 1969
UNITED STATES DEPARTMENT OF THE INTERIOR
U.S . FISH AND WILDLIFE SERVICE
BUREAU OF COMMERCIAL FISHERIES
Circular 342 \__

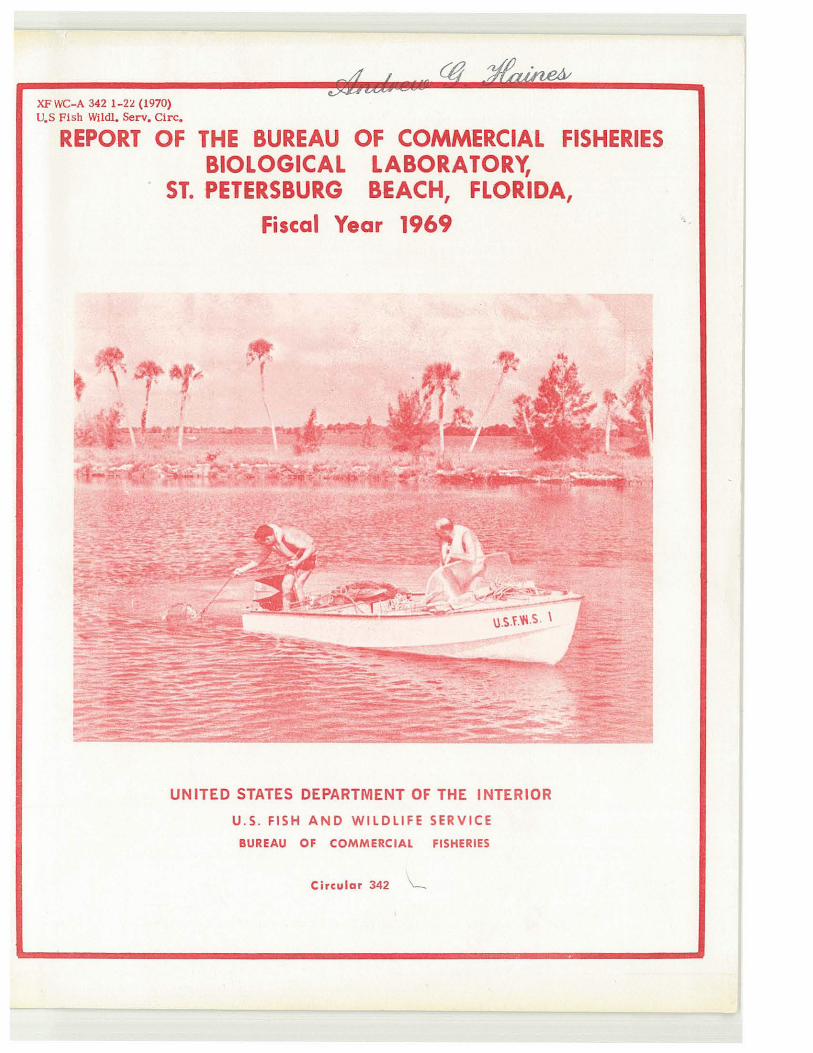
Cover--Biological sampling for Gulf of Mexico estuarine inventory.
UNITED STATES DEPARTMENT OF THE INTERIOR Walter J. Hickel, Secretary Fred J. Russell, Under Secretary
Leslie L. Glasgow, Assistant Secretary for Fish and Wildlife and Parks
U.S. FISH AND WILDLIFE SERVICE Charles H. Meacham, Commissioner
BUREAU OF COMMERCIAL FISHERIES Philip M. Roedel, Director
Report of the Bureau of Commercial Fisheries Biological Laboratory,
St. Petersburg Beach, Florida, Fiscal Year 1969
JAMES E. SYKES, Director
Contribution No. 55, Bureau of Commercial Fisheries
Biological Laboratory, St. Petersburg Beach, Florida 33706
Circular 342
Washington, D.C. August 1970
CONTENTS
Report of the Laboratory Director ••••••••••••••••••••••••
Mission of Laboratory ••••••••••••••••••••••••••••••
Research status and trends •••••••••••••••••••••••••••
Ma riculture. • • • • • • • • • • • • • • • • Gulf of Mexico Estuarine Inventory •
. . . . . . . . • • • • • • • •
• • • . . . . . . . . • • • • • • • • • • •
Training ...•.•.•.•.•.•••..••.•.••••....•••••..•
Presentations . . . . . . . . . . . . . . . . . . . . . . . . . . . . . . . . . . . . Meetings and work conferences ••••••••••••••••••••••••
Estuarine research program •••••••••••••••••••••••••••
Benthic project . ..........•••••.•..••.•.....•...••
Hydrology ••• Echinoderms. . . . . . . . . . . . . . . . . . . . . . . . . . . . . . . . . . . . . . . . . . . . . . . . . . . . . . . . Mollusks • .•.•....••.•..••.•••.•••• . . . . . . • • • • • • Crustaceans •••••••••••••••• Polychaete worms Phoronid worms ••••••
. . . . . . . . . . . . . . . . .... • • • • . . . . . • • • . . • • . . . . . . . . . . . . . • • . . . . .
Southern quahog clam ••••••••••••••••• . . . . • • • . . . . . Lugworm •••••• . . . • • . . . . • • • • • • . . . Sea grass ...........•.....••..••.• . . . . • • • • • • • •
Faunal production project ••••••••••••••••••••••••••••
Pompano aquaculture ••••••••••••••••••••••••••••• Artificial spawning and embryology of pompano ••••••••••••
Gulf of Mexico estuarine inventory project •••••••••••••••••
Area description Biology •••••••
. . . . . . . . . . . . . . . . . . . . . . . . . . . . . . . . . . . . . . . . . • • • • • • • • • • • • • • • • • • • • •
Biology of thread herring program •••••••••••••••••••••••
Red-tide program . ...••....•...•• • .•..•••••..••.••.•
Plankton ecology project •••••••••••••••••••••••••••••
Publications . . . . . . . . . . . . . . . . . . . . . . . . . . . . . . . . . . . . . .
iii
1
1
1
2 2
2
2
2
3
3
3 3 4 5 5 5 7 7 7
11
11 12
13
14 15
18
20
20
22
Report of the Bureau of Commercial Fisheries Biological Laboratory,
St. Petersburg Beach, Florida,
Fiscal Year 1969
ABSTRACT
Highlights of research in fiscal year 1969 included analysis and publication of data related to effects of engineering on the estuarine resource and completion of field work on the Florida portion of the cooperative Gulf of Mexico Estuarine Inventory. In addition, data supplied through testimony to the Florida Legislature assisted in the establishment of an aquatic preserve; and after a local hearing in which Laboratory data were presented, a municipality disapproved a potentially damaging engineering project .
REPORT OF THE LABORATORY DIRECTOR James E. Sykes
MISSION OF LABORATORY
It is now understood that estuaries adjacent to the Gulf of Mexico are vital to most of the species that make up the Gulf commercial fishery, which is worth about $123 million annually. That value is growing while damage to the resource in the estuaries is increasing. The research mission of the Laboratory is to provide all the knowledge possible about the relation of marine organisms, marketable and nonmarketable, to their changing environment; to develop necessary techniques for maintaining coastal fishery resources at productive levels despite the inroads of civilization; and to investigate methods of increasing biological yield for benefit of the fishing industry and the public.
RESEARCH STATUS AND TRENDS
The Annual Report of the Laboratory for fiscal year 1968 stated that the results of ecological research had begun to affect the balance of estuarine control between land developers and conservationists of the biological resource. The use of estuarine data supplied by us to municipalities, States, and the Federal Government was beginning to suppress many proposals to develop the coastal zone for the benefit of a few. Such progress continued in fiscal year 1969, as evidenced by State legislative action and a diminishing number of requests for us to supply biological information related to individual engineering proposals.
1
The Florida legislature declared Boca Ciega Bay an aquatic preserve. About 20 percent of the bay has been filled for homesites. Its deterioration has commanded national attention, and it was here that biologists were finally successful in suppressing a dredge-fill proposal of 202 hectares (500 acres) 2 years ago. It is also the bay in which the Corps of Engineers denied its first dredge-fill application on the basis of fish and wildlife values (the Zabel-Rusa.ell proposal) and in which another permit was denied this year. Although Boca Ciega Bay now has only marginally adequate circulation, receives more than 76 million liters (20 million gallons) of domestic pollution per day, and has had its biological production drastically reduced, parts of it continue to be ecologically valuable and worthy of the recent legislative action to prevent further degrading of its natural resources.
In fiscal year 1969 we continued to contribute to the knowledge of estuaries through the cooperative Gulf of Mexico Estuarine Inventory, through publication of research results, and through appearance on programs at local, area, and institutional conferences. Members of the staff were requested to give expert testimony on two noteworthy occasions: before the Florida Legislature on a bill establishing Boca Ciega Bay as an aquatic preserve and before the Town Council of South Pasadena regarding a proposal to fill 2.8 hectares ( 7 acres) of submerged land. Testimony in both instances helped to obtain positive estuarine benefits: The aquatic preserve was established by law, and the Pasadena permit was denied.
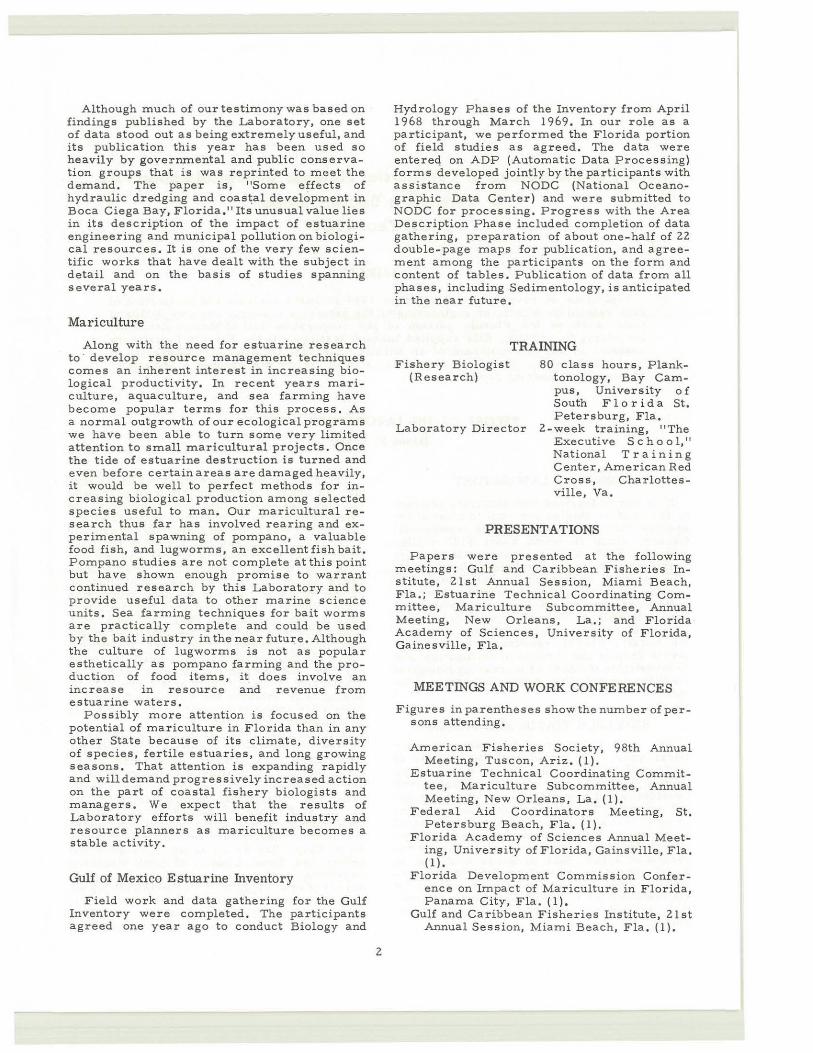
Although much of our testimony was based on findings published by the Laboratory, one set of data stood out as being extremely useful, and its publication this year has been used so heavily by governmental and public conservation groups that is was reprinted to meet the demand. The paper is, "Some effects of hydraulic dredging and coas~al development in Boca Ciega Bay, Florida." Its unusual value lies in its description of the impact of estuarine engineering and municipal pollution on biological resources. It is one of the very few scientific works that have dealt with the subject in detail and on the basis of studies spanning several years.
Mariculture
Along with the need for estuarine research to · develop resource management techniques comes an inherent interest in increasing biological productivity. In recent years mariculture, aquaculture, and sea farming have become popular terms for this process . As a normal outgrowth of our ecological programs we have been able to turn some very limited attention to small maricultural projects. Once the tide of estuarine destruction is turned and even before certain areas are damaged heavily, it would be well to perfect methods for increasing biological production among selected species useful to man. Our maricultural research thus far has involved rearing and experimental spawning of pompano, a valuable food fish, and lugworms, an excellent fish bait. Pompano studies are not complete at this point but have shown enough promise to warrant continued research by this Laboratory and to provide useful data to other marine science units. Sea farming techniques for bait worms are practically complete and could be used by the bait industry in the near futu:t:e. Al though the culture of lugworms is not as popular esthetically as pompano farming and the production of food items, it does involve an increase in resource and revenue from estuarine waters.
Possibly more attention is focused on the potential of mariculture in Florida than in any other State because of its climate, diversity of species, fertile estuaries, and long growing seasons. That attention is expanding rapidly and will demand progressively increased action on the part of coastal fishery biologists and managers. We expect that the results of Laboratory efforts will benefit industry and resource planners as mariculture becomes a stable activity.
Gulf of Mexico Estuarine Inventory
Field work and data gathering for the Gulf Inventory were completed. The participants agreed one year ago to conduct Biology and
2
Hydrology Phases of the Inventory from April 1968 through March 1969. In our role as a participant, we performed the Florida portion of field studies as agreed. The data were entereq on ADP (Automatic Data Processing) forms developed jointly by the participants with assistance from NODC (National Oceanographic Data Center) and were submitted to NODC for processing. Progress with the Area Description Phase included completion of data gathering, preparation of about one-half of 22 double-page maps for publication, and agreement among the participants on the form and content of tables. Publication of data from all phases, including Sedimentology, is anticipated in the near future.
TRAINING Fishery Biologist
(Research)
Laboratory Director
80 class hours, Planktonology, Bay Campus, University of South F 1 or ida St. Peters burg, Fla.
2-week training, "The Executive Schoo 1," National Training Center, American Red Cross, Charlottesville, va.
PRESENT AT IONS
Papers were presented at the following meetings: Gulf and Caribbean F i sheries Institute, 21st Annual Session, Miami Beach, Fla.; Estuarine Technical Coordinating Committee, Mariculture Subcommittee, Annual Meeting, New Orleans, La .; and Florida Academy of Sciences, University of Florida, Gainesville, F la.
MEETINGS AND WORK CONFERENCES
Figures in parentheses show the number of persons attending.
American Fisheries Society, 98th Annual Meeting, Tuscon, Ariz. (1).
Estuarine Technical Coordinating Committee, Mariculture Subcommittee, Annual Meeting, New Orleans, La. (1).
Federal Aid Coordinators Meeting, St. Petersburg Beach, Fla. (1).
Florida Academy of Sciences Annual Meeting, University of Florida, Gains ville, Fla. ( 1).
Florida Development Commission Conference on Impact of Mariculture in Florida, Panama City, Fla. (1).
Gulf and Caribbean Fisheries Institute, 21st Annual Session, Miami Beach, Fla. (1).
Gulf Oceanographic Development Foundation Meeting, University of South Florida Bay Campus, St. Petersburg, Fla. (1).
Gulf of Mexico Estuarine Inventory Subcommittee on Standards, Mobile, A la. (1).
Gulf States Marine Fisheries Commission Meeting, San Antonio, Tex. ( 1),
Gulf States Marine Fisheries Commission Meeting, New Orleans, La. (1) .
Marine Technology Society Conference ("The Decade Ahead"), Miami Beach, Fla. (1) .
Master Plan Inverviews: University ofSouth Florida Bay Campus, St. Petersburg, Fla. (1); Florida State University, Tallahassee, Fla. (1); and New College, Sarasota, Fla. ( 1 ).
National Estuarine Center conferences and meetings as follows: Galveston, Tex.; Miami, Fla.; Washington, D.C.; Sandy Hook, N.J.; Atlanta, Ga.; Tallahassee, Fla.; Pensacola, Fla.; Ocean Springs, Miss.; and New Orleans, La. (1),
Participation in a study with the Bureau of Sport Fisheries and Wildlife at St. Thomas, Virgin Islands, concerning a proposal to relocate the St. Thomas airport. ( 1),
Standards Subcommittee of the Estuarine Technical Coordinating Committee, Ocean Springs, Miss. (1).
Third Annual Library Workshop, Washington, D.C. (1).
ESTUARINE RESEARCH PROGRAM
BENTHIC PROJECT
John L. Taylor and Carl H. Saloman
This report marks the completion of 6 years of benthic ecological research in Tampa Bay, Fla., and adjoining areas of the eastern Gulf of Mexico. In that period we have been concerned primarily with the occurrence and ecological requirements of bottom-dwelling animals and plants because they are all related to commercial fisheries in numerous ways. Our published reports have added to basic knowledge of organisms that inhabit the estuarine zone and to practical aspects of fishery biology and estuarine conservation.
This year, taxonomic and ecological work centered on echinoderms, mollusks, crustaceans, polychaete, and phoronid worms, and sea grass. Information on animal and plant habitats was based on analysis of sediment and water samples from benthic stations as well as periodic water testing at 30 permanent stations throughout Tampa Bay. We made further studies on the commercially important southern quahog clam, Mercenaria campechiensis, and on two other species of probable economic importance -- the lugworm, Arenicola cristata, and turtle grass, Thalassia testudinum. The lugworm is an excellent fish bait, and in experimental research turtle grass has proven beneficial as a dietary supplement for livestock. In addition to those studies, we made several biological surveys in connection with the dredge - fill applications.
Hydrology
Systematic collection of hydrological data from Tampa Bay was started by BCF (Bureau of Commercial Fisheries) i n 1954, and continuous water testing began at this Laboratory in 1962. In 1966, we established 30 permanent
3
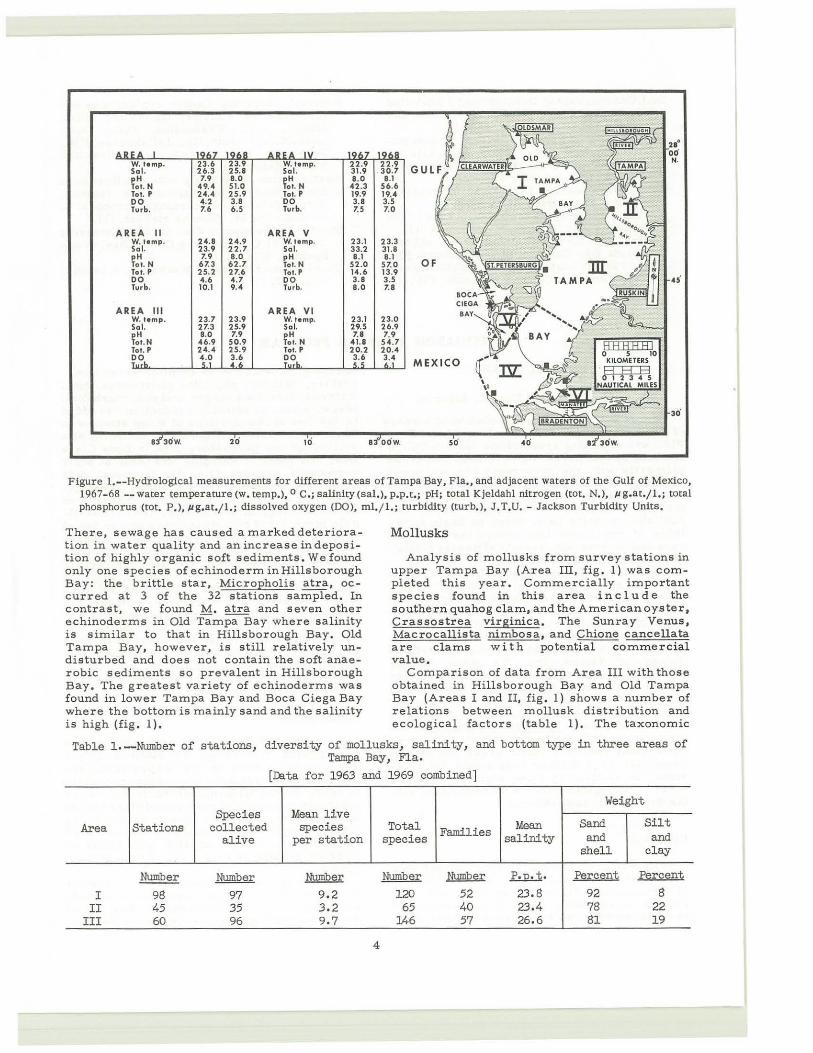
hydrological stations to monitor water temperature, salinity, pH, total phosphorus, total nitrogen, dissolved oxygen, and water turbidity. Measurement of primary production was added to the list of observations at those stations in 1968. Daily water samples are collected at a station off the Laboratory d ock in Boca Ciega Bay, and m onthly samples are taken at other permanent stations (fig. 1). Chemical data taken in conjunction with biological investigations are an integral part of our research on benthic ecology in Tampa Bay. Theyareavailable in published reports and have proven useful to other Federal agencies and local governments in studies of pollution control and controversies concerning coastal engineering projects. F or example, long-term data for phosphorus and nitrogen show that pollution from domestic and industrial sources has reduced the biological and recreational resources in Tampa Bay. Consequently, authorities no longer routinely approve permits for coastal construction in the estuary that would impede tidal circulation, add to the present level of pollution, o r otherwise conflict with public interests.
Echinoderms
We have identified 33 species of echinoderms in 18 genera from Tampa Bay stations. This is three times as many species as previously reported from the estuary. The predominant class is brittle stars (Ophiuroidea) . Echinoderms are notorious predators of oysters and other bottom invertebrates, and they also consume living plant material and detritus. Few fi sh eat adult echinoderms, but young fish and adults of plankton-grazing species eat larval echinoderms.
The occurrence of echinoderms in the bay is controlled mainly by variations in salinity and bottom type. In Hillsborough Bay, pollution is another factor that severely limits them.
W. temp. Sal.
W.temp. Sa l.
pH Tot. N
pH Tot. N
Tot. P Tot. P DO DO Turb. Turb.
AREA II AREA v W.temp. 24.8 24.9 W.temp. 23.1 23.3 Sal. 23.9 22.7 Sal. 33.2 31.8 pH 7.9 8.0 pH 8.1 8.1 Tot. N 67.3 62.7 Tot. N S2.0 S7.0 Tot. P 25.2 27.6 Tot. P 14.6 13.9 DO 4.6 4.7 DO 3.8 3.S 45" Turb. 10.1 9.4 Turb. 8.0 7.8
AREA Ill AREA VI W.temp. 23.7 23.9 W. temp. 23.1 23.0 Sal. 27.3 25.9 Sal. 29.5 26.9
~~. N 8.0 7.9 pH 7.8 7.9 46.9 50.9 Tot. N 41.8 54.7
Tot. P 24.4 25.9 Tot. P 20.2 20.4 DO 4.0 3.6 DO 3.6 3.4
Figure ! .- -Hydrological measurements for different areas of Tampa Bay, Fla. , and adjacent waters of the Gulf of Mexico, 1967-68 --water temperature (w. temp,), o C.; salinity (sal.), p.p.t,; pH; total Kjeldahl nitrogen (tot. N.), J.l g.at.; 1.; total phosphorus (tot. P.), J.tg,at.j l.; dissolved oxygen (00), ml. j l.; turbidity (turb, ), J .T.U.- Jackson Turbidity Units.
There, sewage has caused a marked deterioration in water quality and an increase in deposition of highly organic soft sediments. We found only one species of echinoderm in Hillsborough Bay: the brittle star, Micropholis atra, oc curred at 3 of the 32 stations sampl ed. In contrast, we found M. a tra and seven other echinoderms in Old Tampa Bay where s alinity is similar to that in Hillsborough Bay. Old Tampa B ay, however, is still relatively undisturbed and does not contain the soft anaerobic sediments so prevalent in Hillsborough Bay. The greatest variety of echinoderms was found in lower Tampa Bay and Boca Ciega Bay where the bottom is mainly sand a nd the salinity is high (fig. 1).
Mollusks
Analysis of mollusks from survey stations in upper Tampa Bay (Area III, fig . l) was com pleted this year , Commercially important species found in this area include the southern quahog clam, and t he American oys ter , Crassostrea v i rg1ruca, The Sunray Venus , Macrocallista nimbosa, and Chione cancellata are clams with potential commercial value.
Comparison of da ta from Area III with tho se obtained in Hillsborough Bay and Old T a mpa Bay (Areas I a nd II, f i g. 1) shows a number of relations between mollusk distribution and ecological factors (table 1). T he taxonomic
Table 1.--Number of stations, diversity of mollusks, salinity, and bottom t ype in three areas of Tampa Bay, Fla.
[Data for 1963 and 1969 combined]
Weight Species Mean live
Area Stations collected species Total Mean Sand Silt alive per station species Families salinity and and
shell cl ay
Number Number Number Number Number ~. Percen:t P!:lrC!:1nt
I 98 97 9.2 120 52 23 . 8 92 8 II 45 35 3 . 2 65 40 23.4 78 22
III 60 96 9. 7 146 57 26. 6 81 19
4
diversity in Area III is prmcipally a result of the gradual salinity increase of about 5 p.p.t. between the lower limits of Areas I and II and the seaward limit of Area III. The mollusk assemblage in Area III is composed of most species found in Areas I and II, but some of these seem to be restricted by the increasing salinity and are gradually replaced by forms requiring high salinity.
Crustaceans
Further work on the identification of grass shrimp (Caridea) from the Tampa Bay area added several more species to our faunal list, and we forwarded two new species to the National Museum for description. We now know of 33 species of grass shrimp in the estuary. As their name implies, these small crustaceans inhabit beds of sea grass. They are food for small fish of many species. A commensal caridean, Leptalpheus forceps , was discovered in Tampa Bay this year. This interesting crustacean occupies the burrow of the mud shrimp, Upogebia affinis, and is otherwise known only from North Carolina where it was originally described.
Our study of grass shrimp includes analysis of their quantitative distribution in the estuary and observations on their reproductive biology. During our detailed examination of shrimp, we found that they are prey for animals other than fish. A small percentage of grass shrimp contain the cyst of a parasitic flatworm, and some are parasitized ·by a marine leech.
Polychaete Worms
We have sorted the polychaetes from benthic stations in Tampa Bay and currently are describing them in terms of quantitative distribution. As is true of all benthic invertebrates, they are sensitive to ecological conditions that prevail in various areas of the estuary. Some are strictly limited by salinity and sediment type, whereas others have great tolerance to a broad range of environmental conditions. The group is of economic importance because the adults provide the basic food for many pelagic species. Furthermore, polychaetes help decompose organic detritus, aerate sediments with their burrows, and stabilize sediments with their tubes.
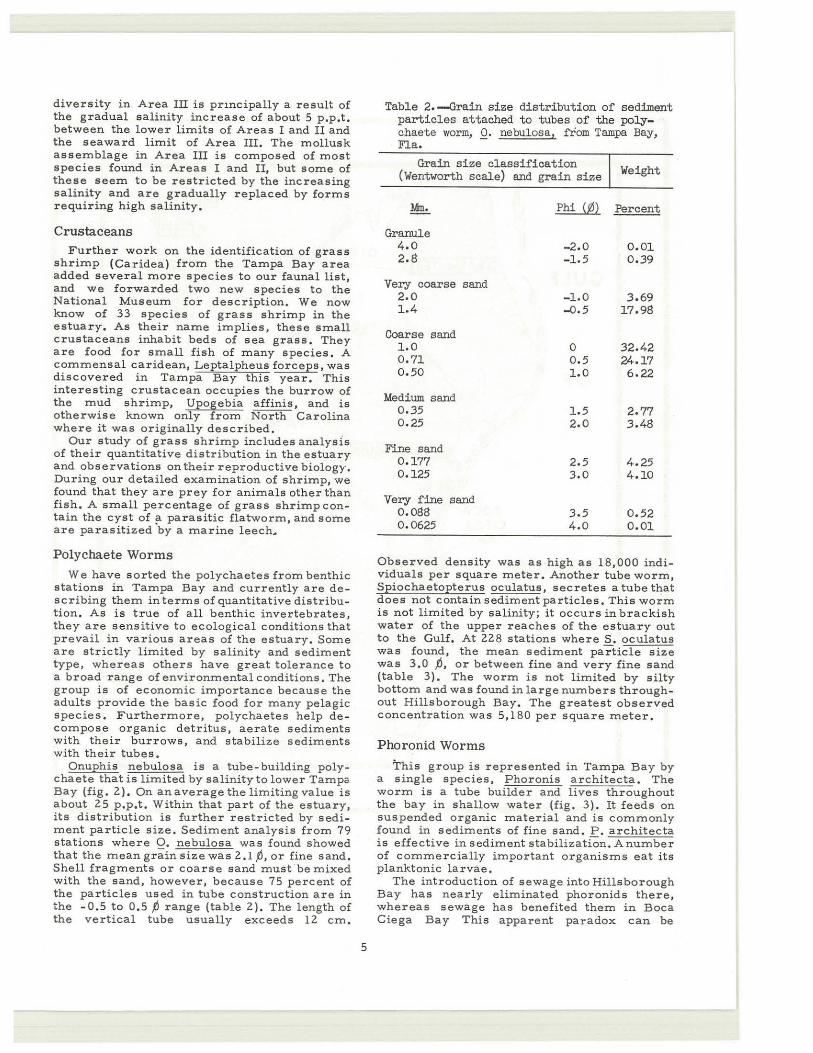
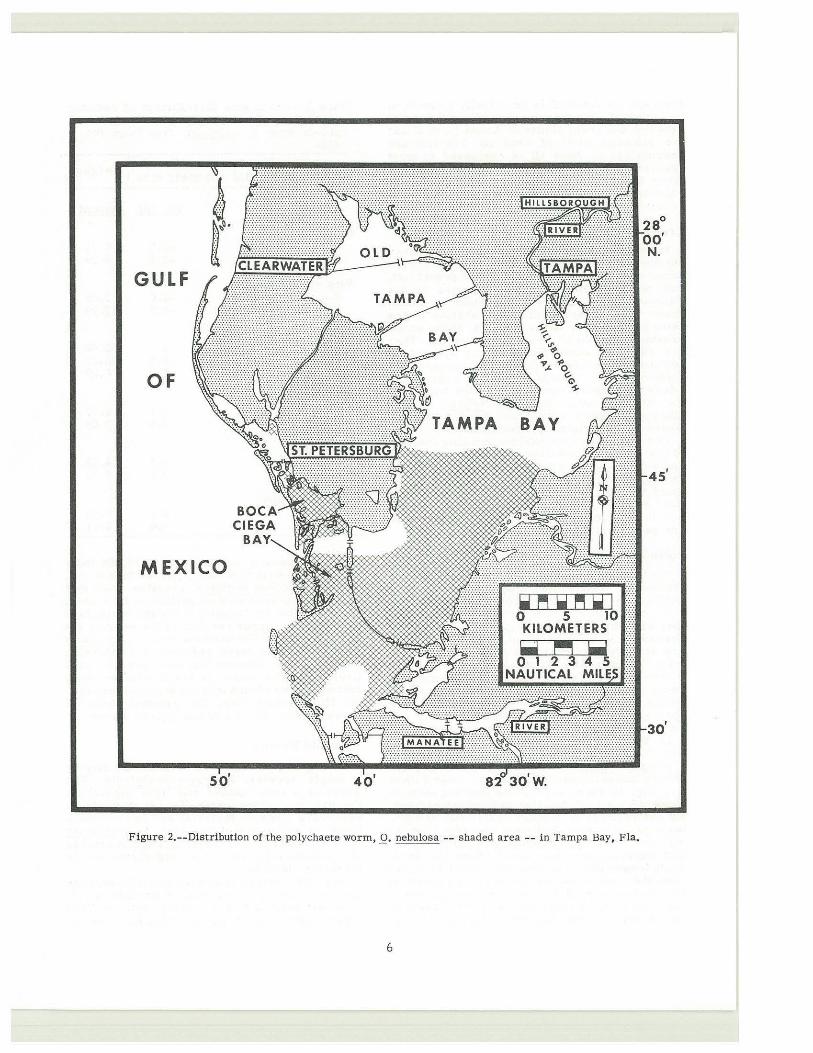
Onuphis nebulosa is a tube- building polychaete that is limited by salinity to lower Tampa Bay (fig. 2). On anaveragethelirnitingvalue is about 25 p .p.t. Within that part of the estuary, its distribution is further restricted by sediment particle size. Sediment analysis from 79 stations where 0. nebulosa was found showed that the mean grain size was 2.1 /J, or fine sand. Shell fragments or coarse sand must be mixed with the sand, however, because 75 percent of the particles used in tube construction are in the -0.5 to 0.5 /J range (table 2). The length of the vertical tube usually exceeds 12 ern.
5
Table 2.--Grain size distribution of sediment particles attached to tubes of the polychaete worm, Q. nebulosa, ftom Tampa Bay, F1.a.
Grain size classification (Wentworth scale) and grain size
Mm. Phi (~}
Granule 4.0 -2.0 2.8 -1.5
Very coarse sand 2.0 -1.0 1.4 -0.5
Coarse sand 1.0 0 0.71 0.5 0.50 1.0
Medium sand 0.35 1.5 0.25 2.0
Fine sand 0.177 2.5 0.125 3.0
Very fine sand 0.088 3. 5 0 . 0625 4.0
Weight
Percent
0.01 0.39
3.69 17.98
32.42 24.17 6.22
2.77 3.48
4.25 4.10
0.52 0 .01
Observed density was as high as 18,000 individuals per square meter. Another tube worm, Spiochaetopterus oculatus, secretes a tube that does not contain sediment particles. This worm is not limited by salinity; it occurs in brackish water of the upper reaches of the estuary out to the Gulf. At 228 stations where S. oculatus was found, the mean sediment particle size was 3.0 /J, or between fine and very fine sand (table 3). The worm is not limited by silty bottom and was found in large numbers throughout Hillsborough Bay. The greatest observed concentration was 5,180 per square meter.
Phoronid Worms
This group is represented in Tampa Bay by a single species, Phoronis architecta. The worm is a tube builder and lives throughout the bay in shallow water (fig. 3) . It feeds on suspended organic material and is commonly found in sediments of fine sand . P. architecta is effective in sediment stabilizatiOn. A number of commercially important organisms eat its planktonic larvae.
The introduction of sewage into Hillsborough Bay has nearly eliminated phoronids there, whereas sewage has benefited them in Boca Ciega Bay This apparent paradox can be
GULF
OF
MEXICO
so'
Figure 2.--Distribution of the polychaete worm, Q. nebulosa -- shaded area -- in Tampa Bay, Fla.
6
28° oo' N.
45'
30'
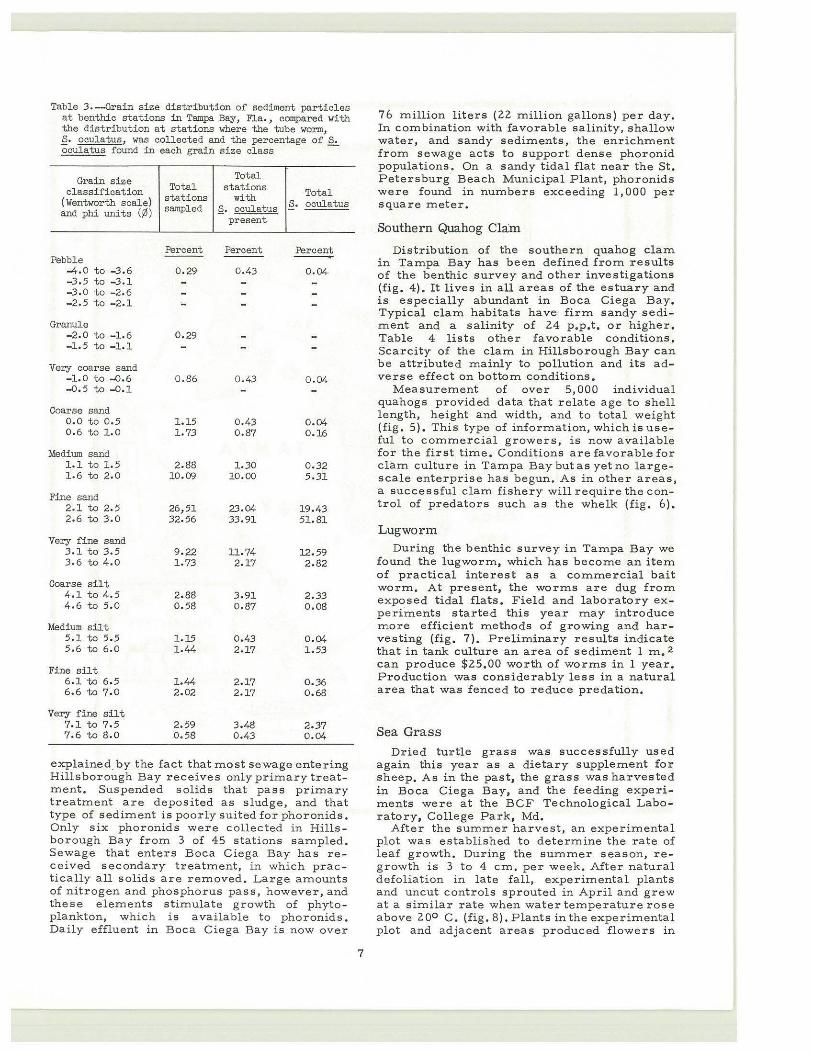
Table 3.--Grain size distribution of sediment particles at benthic stations in Tampa Bay, F1.a., compared with the distribution at stations where the tube worm, _§. oculatus, was collected and the percentage of ~ oculatus found in each grain size class
Grai n size classification
(Wentworth scale) and phi units (¢)
Pebble -4.0 to -3.6 -3.5 to -3.1 -3.0 to - 2.6 -2.5 to - 2.1
Granule -2.0 to -1. 6 - 1.5 to -1.1
Very coarse sand -1.0 to -0.6 -0. 5 to -0.1
Coarse sand o.o to 0.5 0.6 to 1.0
Medium sand 1.1 to 1.5 1.6 to 2.0
Fine sand 2. 1 to 2. 5 2.6 to 3.0
Very fine sand 3.1 to 3.5 3.6 to 4.0
Coarse silt 4 . 1 to 4.5 4.6 to 5.0
Medium silt 5.1 to 5 .5 5.6 to 6 .0
Fine silt 6. 1 to 6.5 6.6 to 7 .0
Very fine silt 7.1 to 7 . 5 7.6 to S.o
Total Total stations
stations with sampled §. oculatus
present
Percent Percent
0.29 0 .43
0.29
0.86 0.43
1. 15 0.43 1.73 0.87
2.SB 1.30 10.09 10.00
26,51 23.04 32.56 33.91
9.22 11. 74 1.73 2. 17
2.SS 3.91 0.58 0.87
1.15 0.43 1.44 2.17
1.44 2.17 2. 02 2.17
2.59 3.48 0.58 0.43
Total S. oculatus
Percent
0.04
0.04
0 .04 0.16
0.32 5.31
19.43 51.Sl
12.59 2.S2
2.33 o.os
0.04 1.53
0.36 0.6S
2.37 0.04
explained. by the fact that most sewage entering Hillsborough Bay receives only primary treatment. Suspended solids that pass p rimary treatment are deposited a s sludge, and that type of sediment is poorly suited for phoronids . Only six phoronids were collected in Hills bo r ough Bay from 3 of 45 stations sampled. Sewage that enters Boca Ciega Bay has received secondary treatment, in which practically all solids are removed. La r ge amounts of nitrogen and phosphorus pass, howeve r, and these elements stimulate growth of phytoplankton, whic h is avail able to phoronids . Daily effluent in Boca Ciega Bay is now over
7
76 million liters {22 million gallons) per day. In combination with favorable salinity, shallow water, and sandy sediments , the enrichment from sewage acts to support dense phoronid populations . On a sandy tidal flat near the St. Petersburg Beach Municipa l Plant, phoronids were found in numbe rs e xceeding 1,000 per square meter .
Southern Quahog Clam
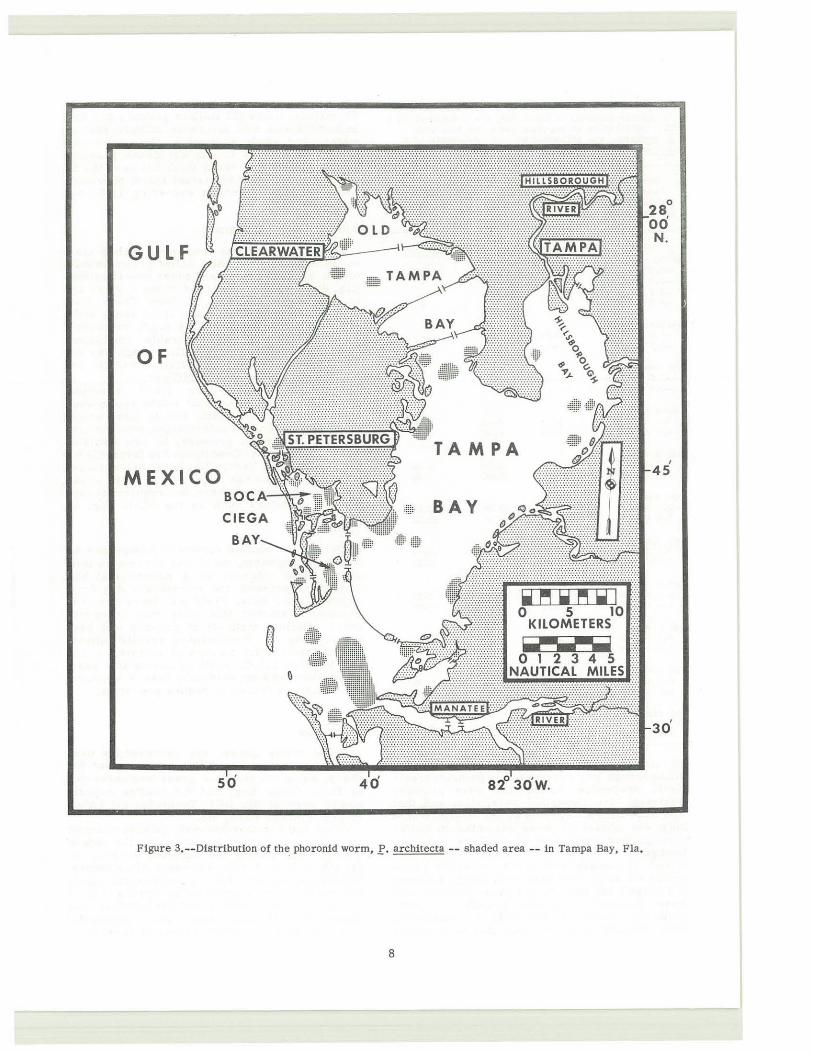
Distribution of the southern quahog clam in Tampa Bay has been defined from results of the benthic survey and other investigations {fig . 4) . It lives in all areas of the estuary and is especially abundant in Boca Ci ega Bay. Typica l clam habitats have firm sandy sediment and a salinity of 24 p . p .t. or h ighe r. Table 4 lists other favorable conditions. Scarcity of the clam in Hillsborough Bay can be attributed mainly t o pollution and its adve rse effect on bottom conditions.
Measurement of over 5,000 individual quahogs provided data that relate age to shell length, height and width, and to total weight (fig. 5). This type of information, which is useful to c ommercial growers, is now available for the first time. Conditions are favorable fo r c lam culture in Tampa Bay but as yet no largescale enterprise has begun. As in other areas, a successful clam fishery will require the control of predators such as the whelk (fig. 6) .
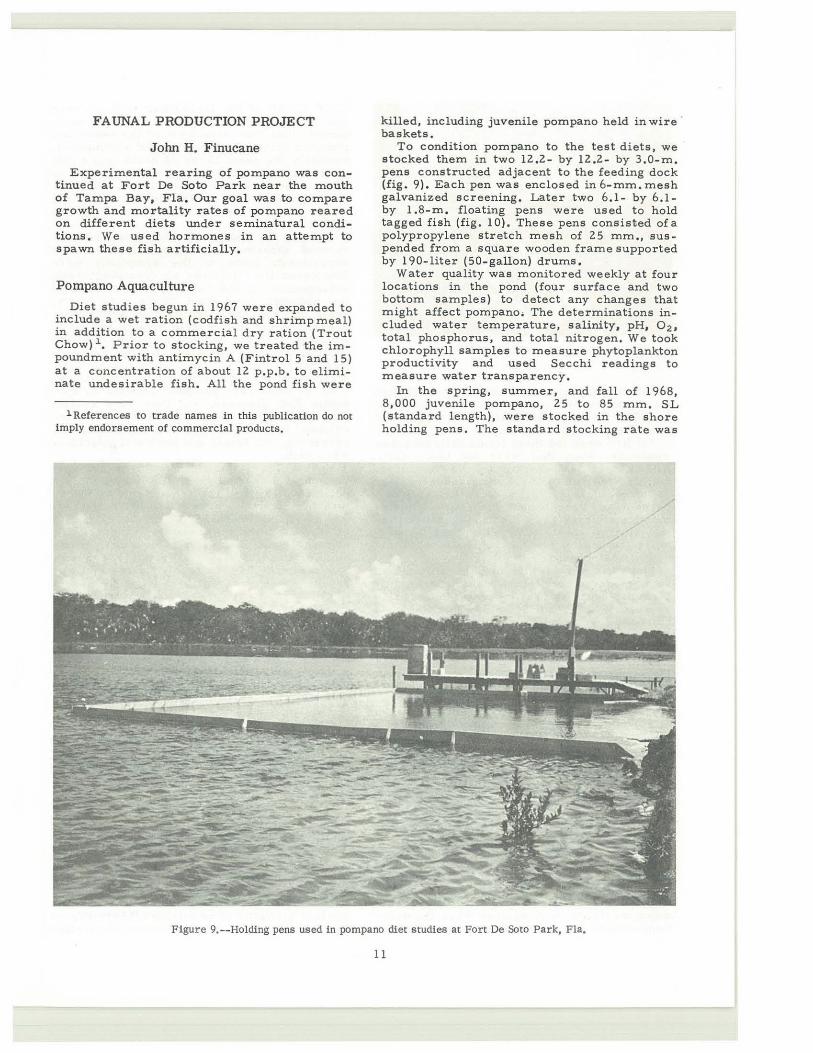
Lugworm During the benthic survey in Tampa Bay we
found the lugworm, which h a s become an item of p r actical interest as a commercial bait worm. At pre s ent, the worms are dug from exposed tidal flats. Field and laboratory experiments started this year may introduce more efficient methods of growing and harvesting {fig. 7). Preliminary results indicate that in tank culture an area of sediment 1 m. 2 can produce $25.00 worth of worms in 1 year. Production was considerably less in a natural area that was fenced to reduce predation.
Sea Grass Dried turtle grass was successfully used
again this year as a dietary supplement for sheep. As in the past, the grass was harvested in Boca Ciega Bay, and the feeding experiments were at the BCF Technological Laboratory, College Park, Md.
After the summer harvest, an experimental plot was established to determine the rate of leaf g rowth. During the summer season, reg row th is 3 to 4 em. per week. After natural defoliation in late fall, experimental plants and uncut controls sprouted in April and g rew at a similar r a t e when water temperature rose above zoo C. {fig. 8 ). Plants in the experimental plot and adjacent areas produced flowers in
GULF
OF
TAMPA
MEXICO BAY
50
Figure 3.--Distribution of the phoronid worm,£'. architecta -- shaded area-- in Tampa Bay, Fla.
8
OF
BAY
MEXICO
~@
50 40 0 ' 82 30 w.
Figure 4.--Distribution of the southern quahog clam -- shaded area -- in Tampa Bay, Fla.
9
28° oo' N.
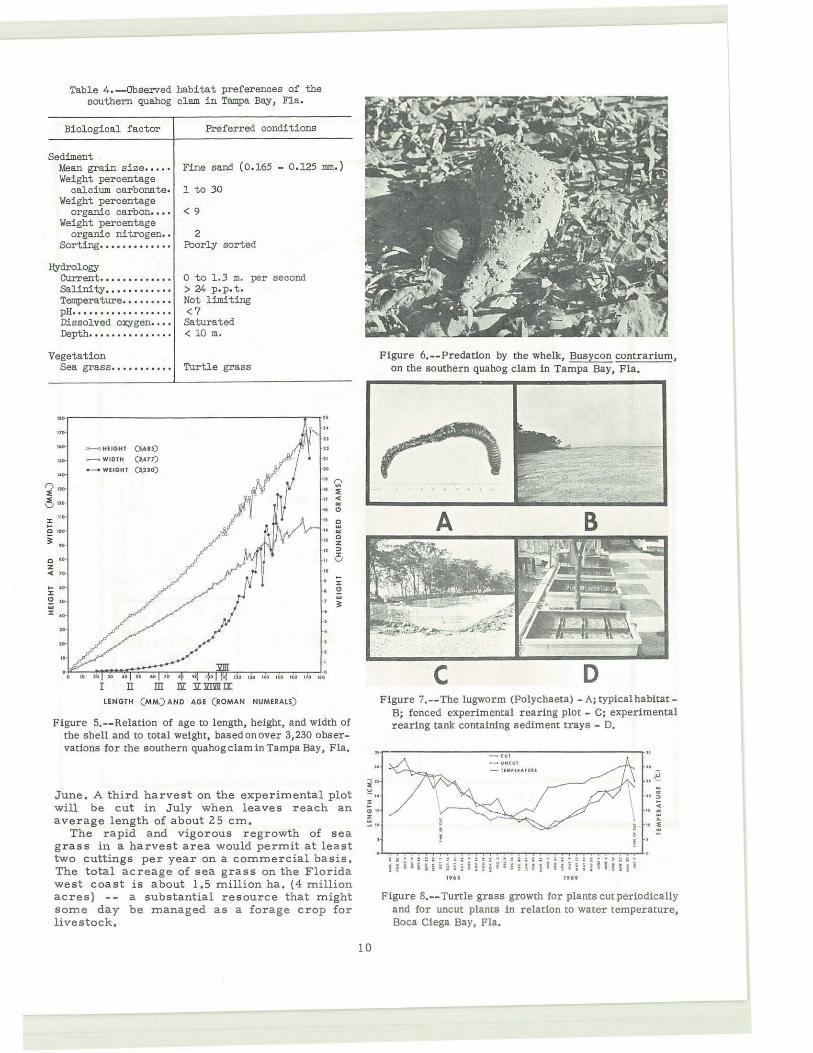
Table 4.--0bserved habitat preferences of the southern quahog clam in Tampa Bay, Fla.
Biological factor
Sediment Mean grain size ••• •• Weight per centage
calcium carbonate. Weight percentage
organic carbon • ••• Weight percentage
organic nitrogen • • Sorting •. ••••• •.• •• .
Hydrology Current ••• • • •• .•• •• • Salinity •.••••.••••. Temperature ••••••• •• pH •••••••••••• •••••• Dissol ved oxygen .. •• Depth ••••••••••••••.
Vegetation
Preferred conditi ons
Fine sand (0.165 - 0.125 mm.)
1 to 30
< 9
2 Poorly sorted
0 to 1.3 m. per second > 24 p.p.t. Not limiting <7 Saturated <10m.
Figure 6.--Predation by the whelk, Busycon contrarium, Sea grass •••• • •••••• Turtle grass on the southern quahog clam in Tampa Bay, Fla.
"' ...
~ 1)0
~120
"' :1: .. 0 100
i .. 0 .. z <( " .. .. :1: g so
:.: .,
"
o--o HEIGHT ( 5,61 5)
- WIDTH ( 3.477)
-WEIGHT ( 3,.230)
I II LENGTH ( MM.) AND AGE (ROMAN NUMERALS)
" Q -II ~
" <( .. " " IS s " "' 0
z " :::> :1:
" v .. :1:
' ~ w , 3:
Figure 5.--Relation of age to length, height, and width of the shell and to total weight, based on over 3,230 observations for the southern quahog clam in Tampa Bay, Fla.
June . A third harvest on the experimental plot will be cut in July when leaves reach an average length of about 25 em.
The rapid and vigorous regrowth of sea grass in a harvest a r ea would perm it at least two cuttings per year on a commercial basis. The total acreage of sea grass on the Florida west coast is about 1,5 million ha. (4 million acres) -- a substantial resource that might some day be managed as a forage crop for livestock.
10
A B
Figure 7.--The lugworm (Polychaeta) - A; typical habitat B; fenced experimental rearing plot - C; experimental rearing tank containing sediment trays - D,
! !i~~iii i i i ii ii~~ i~!~~iiii~~~i i i iii 1968 1949
Figure 8.--Turtle grass growth for plants cut per iodically and for unc ut plants in r elation to water temperatur e , Boca Ciega Bay, Fla.
FAUNAL PRODUCTION PROJECT
Jolm H. Finucane
Experimental rearing of pompano was continued at Fort De Soto Park near the mouth of Tampa Bay, Fla. Our goal was to compare growth and mortality rates of pompano reared on different diets under seminatural conditions. We used hormones in an attempt to spawn these fish artificially.
Pompano Aquaculture
Diet studies begun in 1967 were expanded t o include a wet ration (codfish and s h rimp meal) in addition to a commercial dry ration (Trout Chow ) 1 , Prior to stocking, we treated the impoundment with antimycin A (Fintrol 5 and 15) at a concentration of about 12 p.p.b. to eliminate undesirable fish. All the pond fish were
l References to trade names in this publication do not imply endorsement of commercial products.
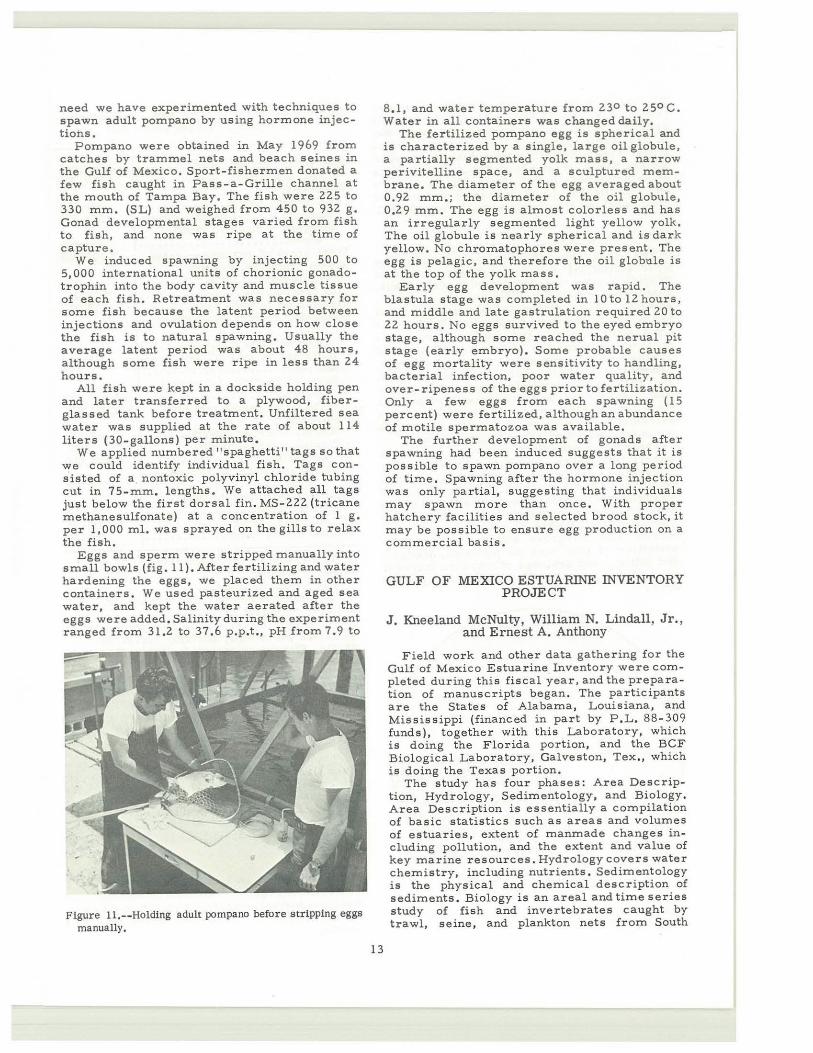
killed, including juvenile pompano held in wire · baskets.
To condition pompano to the test diets, we stocked them in two 12,2- by 12,2- by 3.0-m. pens constructed adjacent to the feeding dock (fig. 9). Each pen was enclosed in6-mm,mesh galvanized screening. Later two 6.1- by 6.1-by 1.8-m, floating pens were used to hold tagged fish (fig. 10). These pens consisted ofa polypropylene stretch mesh of 25 mm., suspended from a square wooden frame supported by 190-liter (50-gallon) drums,
Water quality was monitored weekly at four locations in the pond (four surface and two bottom samples) to detect any changes that might affect pompano, The determinations included water temperature, salinity, pH, 0 2 ,
total phosphorus, and total nitrogen, We took chlorophyll samples to measure phytoplankton productivity and used Secchi readings to measure water transparency.
In the spring, summer, and fall of 1968, 8,00 0 juvenile pompano, 25 to 85 mm, SL (standard length), were stocked in the shore holding pens. The standard stocking rate was
Figure 9.--Holding pens used in pompano diet studies at Fort De Soto Park, Fla.
11

Figure 10. --Floating pens used for holding tagged pompano.
Z, 000 fish per pen. In November, Z, 000 fish were stocked in a 6,1 by 6 . 1-m. enclosure, and ZOO (5-month-old fish} were tagged and released in the floating pens.
All fish were fed three times daily except on weekends, when they were fed twice daily. After water temperature fell in November, feeding was cut to twice daily (once per day on weekends}. All diets were fed at 3 to 5 percent of body weight and were adjusted monthly after weighing the fish. Frozen codfish and shrimp meal were fed without thawing; since the frozen food floated, water contamination was reduced.
Fish that were fed Trout Chow grew faster than those on our other diets. From July through November 1968, pompano increased in average length from 56 to 144 mm. (SL} and gained 18 g . monthly on the dry diet . The average monthly gain in weight was 9 g. less than the 1967 average for the same period; we believe that the decrease in rate of gain was the result of increased stocking density (about ZO,OOO fish per hectare, or 50,000 per acre as compared to about 400 per hectare, or 1000 per acre in 1967}. The largestfishreachedalength of 167 mm. SL and Z35 mm. total length, and a weight of 166 g. in 5 months . The greatest monthly weight gain (35 g . } was in October. Fish on the codfish diet averaged 81 mm. SL in July and lZO mm, in September, The fish on codfish and shrimp meal diets had no significant weight increases because of their high mortality. The best conversion rate was about Z to 1. on the Trout Chow diet ( 1, 000 g. of food to produce 500 g. of fish}.
Mortality of fish on a ll diets was generally progressive. During the first 3 months an estimated 90 percent of those fed on codfish and shrimp died, but only ZO percent of those fed Trout Chow. Fish on the dry ration had their mass mortality in November when the water temperature fell overnight from over Z0° to
lZ
13.9° C . All of the larger fish died, but over 300 of the smaller ones survived. In the same period, less than 8 percent of the remaining pompano being fed on codfish and shrimp died. Probably the main cause of death was a diet deficiency that made the fish more susceptible to a· sudden temperature change. The remammg fish died in December from cold shock when the water temperature dropped to 9.7° C.
Most of the fish on the dry ration had developed abnormalities toward the end of the experiment , Some of the symptoms were discolored liver (blotchy or cream-colored}, enlargement of the kidneys, and swelling of the abdomen from fluid in the body cavity. Some fish also had exophthalmos, and hemorrhages within the muscle tissue and skin. Pompano fed only on codfish and shrimp had most of the same symptoms, but the incidence was lower and the livers were not as badly dis colored as in the fish fed on Trout Chow.
At no time were pompano affected by epidemic fish diseases, and they were usually free of external parasites. A few fish developed bruised mouths from bumping the screening , but fungal and bacterial infections were rare.
Except for water temperature, the environment remained favorable during the experiment. Pompano require a stable temperature for maximum growth and low mortality. Ideally, it should be ZS° C. or above for best growth. Mass mortality occurs at about 10° C., although some fish survive for short periods at this temperature. Small fish (ZS - 65 mm. SL} seem to be reasonably tolerant of reduced temperature and would be those most likely to survive a severe temperature reduction. Successful rearing in central Florida will require heated water in winter or harvesting before critically low temperatures occur.
An entirely satisfactory diet for commercial rearing of pompano has not yet been developed. Although the species can adjust to a variety of foods, none of the diets tested can sustain maximum growth with low mortality.
The future of pompano farming depends on mass production techniques that will help offset the high cost of rearing sites, labor, and food, and the profit motive will continue toremain the major stimulus. Many of the rearing problems will take several years to solve be fore production can be put on a commercial basis.
Artificial Spawning and Embryology of Pompano
If pompano culture is to succeed, methods must be developed to sustain brood stock and progeny from year to year and overcome the present necessity of procuring wild stock from the ocean annually. In our efforts to satisfy that
need we have experimented with techniques to spawn adult pompano by using hormone injections.
Pompano were obtained in May 1969 from catches by trammel nets and beach seines in the Gulf of Mexico. Sport-fishermen donated a few fish caught in Pass-a-Grille channel at the mouth of Tampa Bay. The fish were 225 to 330 mm. (SL) and weighed from 450 to 932 g. Gonad developmental stages varied from fish to fish, and none was ripe at the time of capture.
We induced spawning by injecting 500 to 5, 000 international units of chorionic gonadotrophin into the body cavity and muscle tissue of each fish. Retreatment was necessary for some fish because the latent period between injections and ovulation depends on how close the fish is to natural spawning. Usually the average latent period was about 48 hours, although some fish were ripe in less than 24 hours.
All fish were kept in a dockside holding pen and later transferred to a plywood, fiberglassed tank before treatment, Unfiltered sea water was supplied at the rate of about 114 liters (30-gallons) per minute.
We applied numbered "spaghetti" tags so that we could identify individual fish. Tags consisted of a nontoxic polyvinyl chloride tubing cut in 75-mm. lengths. We attached all tags just below the first dorsal fin. MS-222 (tricane methanesulfonate) at a concentration of 1 g. per 1,000 ml. was sprayed on the gills to relax the fish.
Eggs and sperm were stripped manually into small bowls (fig.ll).Afterfertilizingandwater hardening the eggs, we placed them in other containers. We used pasteurized and aged sea water, and kept the water aerated after the eggs were added. Salinity during the experiment ranged from 31.2 to 37.6 p.p.t., pH from 7.9 to
Figure ll.--Holding adult pompano before stripping eggs manually.
8.1, and water temperature from 230 to 250 C. Water in all containers was changed daily.
The fertilized pompano egg is spherical and is characterized by a single, large oil globule, a partially segmented yolk mass, a narrow perivitelline space, and a sculptured membrane, The diameter of the egg averaged about 0.92 mm.; the diameter of the oil globule, 0.29 mm, The egg is almost colorless and has an irregularly segmented light yellow yolk. The oil globule is nearly spherical and is dark yellow. No chromatophores were present. The egg is pelagic, and therefore the oil globule is at the top of the yolk mass,
Early egg development was rapid. The blastula stage was completed in lOto 12hours, and middle and late gastrulation required 20 to 22 hours. No eggs survived to the eyed embryo stage, although some reached the nerual pit stage (early embryo). Some probable causes of egg mortality were sensitivity to handling, bacterial infection, poor water quality, and over- ripeness of the eggs prior to fertilization. Only a few eggs from each spawning ( 15 percent) were fertilized, although an abundance of motile spermatozoa was available.
The further development of gonads after spawning had been induced suggests that it is possible to spawn pompano over a long period of time. Spawning after the hormone injection was only partial, suggesting that individual s may spawn more than once. With proper hatchery facilities and selected brood stock, it may be possible to ensure egg production on a commercial basis.
13
GULF OF MEXICO ESTUARINE INVENTORY PROJECT
J. Kneeland McNulty, William N. LindaU, Jr. , and Ernest A. Anthony
Field work and other data gathering for the Gulf of Mexico Estuarine Inventory were completed during this fiscal year, and the preparation of manuscripts began. The participants are the States of Alabama, Louisiana, and Mississippi (financed in part by P,L, 88-309 funds), together with this Laboratory, which is doing the Florida portion, and the BCF Biological Laboratory, Galveston, Tex., which is doing the Texas portion.
The study has four phases: Area Description, Hydrology, Sedimentology, and Biology. Area Description is essentially a compilation of basic statistics such as areas and volumes of estuaries, extent of manmade changes including pollution, and the extent and value of key marine resources. Hydrology covers water chemistry, including nutrients. Sedimentology is the physical and chemical description of sediments . Biology is an areal and time series study of fish and invertebrates caught by trawl, seine, and plankton nets from South
Florida to West Louisiana, a distance greater than 1,609 km. (1,000 mile s ). Participants used the same kinds of gea r in the same way in the same period of time over the entire study area. Results were entered on ADP forms, NODC, Washington, D.C., provided one of its employees to help design the data forms and established administrative procedures for card punching and computer analyses atNODC.
Area Description
The Area Description phase provides the first statistical and descriptive overview of Florida's estuaries. Maps depict oyster beds, submer ged vegetation, tidal marsh, mangro ve swamps, areas closed to shellfis hing, filled a r eas, and sources of pollut ion. Tables list dimensions, extent and kinds of manmade changes including the effects of pollution and d r edge-and-fill projects, stream discharges, commercial fishery shore plant installations, and areas of oyster beds, submerged vegetation, tidal marsh, and mangrove swamps. The State and County agencies of Florida have been extremely cooperative in helping to provide the large amount of information required.
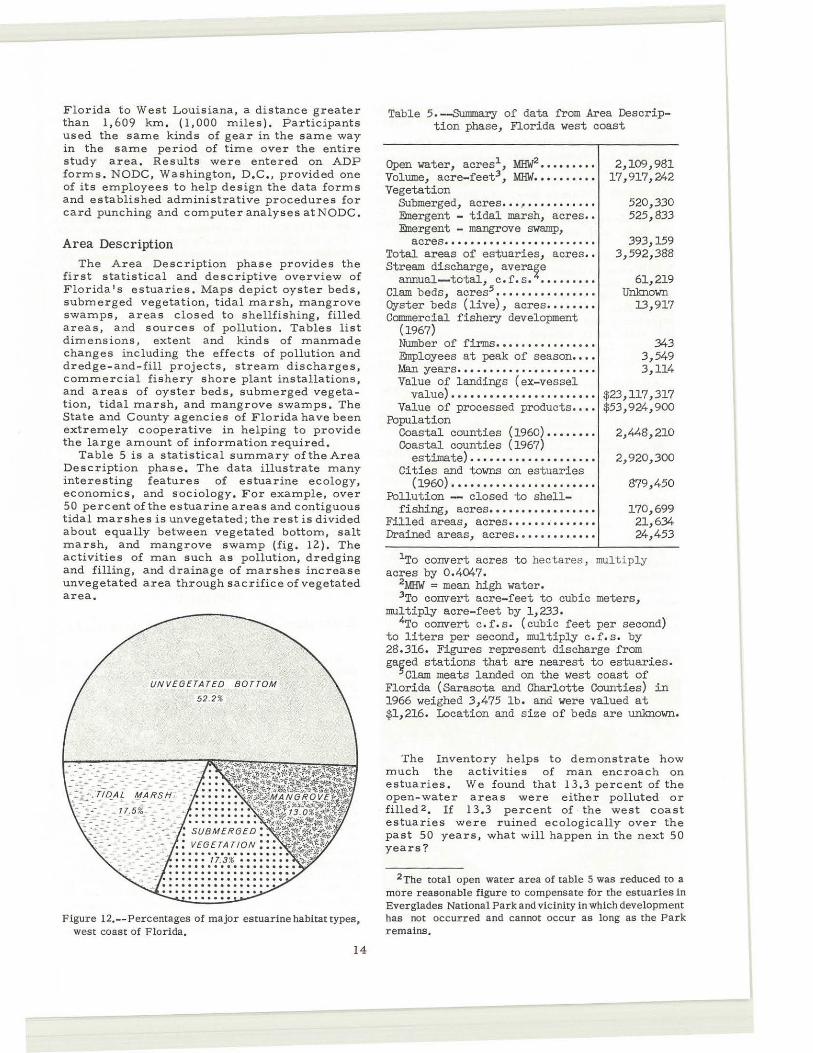
Table 5 i s a statistical summary oftheArea Description phase, The d ata illustrate many interesting features of estuarine ecology, economics , and soci ology, For example, over 50 percent of the estuarine a reas and contiguous tidal m arshe s is unvegetated; the rest is divided a bout equally between vegetated bottom, salt marsh, a nd mangrove swamp (fig. 12). T he activities of man such as pollution, dredging a nd filling, and drainage of marshes increase unvegetated area t h rough sacrifice of vegetated a rea,
UNVEGETATED BOTTOM
52.2%
Figure 12.--Percentages of major estuarine habitat types, west coast of Florida,
14
Table 5. -Summary of data from Area Description phase, Florida west coast
Open water, acres1 , MHW2 •• ••••••• Volume, acre-feet3 , MHW ••• ••••••• Vegetation
Submerged, acres ••• , ••• •••.•.•• Emergent- tidal marsh, acres • • Emergent - mangrove swamp,
acres ....................... . Total areas of estuaries, acres • • Stream di scharge, avera~e
annual--total, c.f.s ••••. • ••• • Clam beds, acres5 •••••••••••••••• Qyster beds (live), acres •••••••• Commercial fishery development
(1967) Number of firms ••••••• • •••.•••• Employees at peak of season •••• Man years ••••••••••••• • •• • •••• • Value of landings (ex-vessel
value) ...................... . Value of processed products •• ••
Population Coast al counties (1960) • ••• •••• Coastal counties (1967)
estimate) ••••••• ••• • • •• ••• ••• Cities and towns on estuaries
(1960) ..... .. . . .. . .......... . Poll ution -- closed to shell-
f ishing, acres •• • ••••••• •• • • ••• Filled areas, acres •••• • • ~ ••••••• Drained areas, acres • • •• • •• •• ••••
2,109,981 17, 917,242
520,330 525,833
393,159 3,592,388
61,219 Unknown
13,917
.343 3,549 3,114
$23, 117,317 $53,924,900
2,448,210
2,920,300
879, 450
170, 699 21,6.34 24, 453
1 To convert acres to hectar es , multi ply acres by 0. 4047.
2MHW = mean high water. 3To convert acre- feet to cubic meters,
multiply acre- feet by 1,233. 4To convert c . f . s , (cubic feet per second)
to l iters per second, multiply c .f. s. by 28.316. Figures represent discharge from gaged stations that are nearest to estuaries.
Sclam meats landed on the west coast of Florida (Sarasota and Charlotte Counties) in 1966 weighed 3,475 lb. and were valued at $1,216. Location and size of beds are unknown.
The Inventory helps to demonstrate how much the activities of man encroach on estuaries, We found that 13,3 percent of the open-water areas wer e either polluted or filled 2, If 13.3 percent of the west c oast estuaries were ruined ecologically over the past 50 years , what will happen in the next 50 yea r s?
2The total open water area of table 5 was reduced to a more reasonable figure to compensate for the estuaries in Ever glades National Parle and vicinity in which development has not occurred and cannot occur as long as the Parle remains.
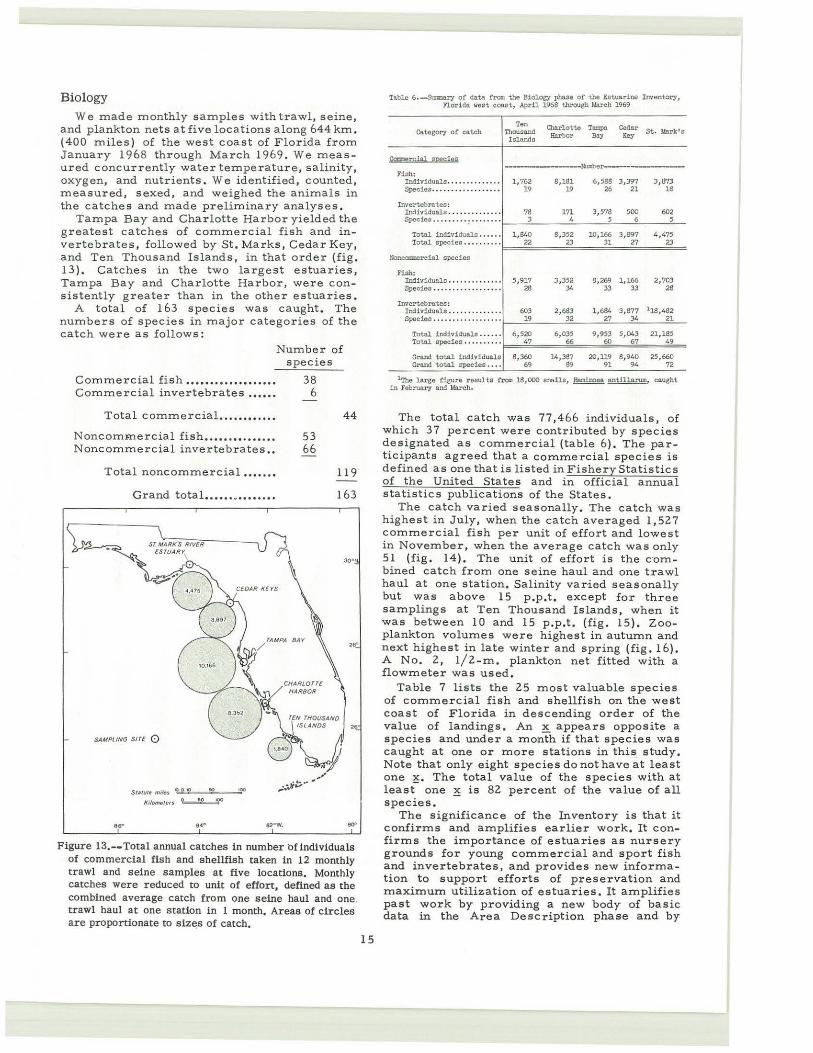
Biology
We made monthly samples with trawl, seine, and plankton nets at five locations along 644 km. (400 miles) o f the west coast of Florida from January 1968 through March 1969. We meas ured concurrently water temperature, salinity, oxygen, and nutrients. We identified, counted, measured, sexed, and weighed the animals in the catches and made preliminary analyses.
Tampa Bay and Charlotte Harbor yielded the greatest catches of commercial fish and invertebrates, followed by St. Marks, Cedar Key, and Ten Thousand Islands, in that order (fig. 13). Catches in the two largest estuaries, Tampa Bay and Charlotte Harbor, were consistently greater than in the other estuaries .
A total of 163 species was caught. The numbers of species in major categories of the catch were as follows:
Commerc ial fish ................ .. . Commercial invertebrates .... ..
Total commercial. .. ..... . .. .
Noncommercial fish ......... .... .. Noncommercial invertebrates ..
Total noncommercial .... ...
Grand total •••••• . ••••• •••
SAMPLING Sl T£ Q
... St•tvte md~s .,,.. • ..,"'=== '-==="'
K11ome1e1s ~
...
Number of species
38 6
53 66
44
119
163
...
Figure 13.-- Total annual catches in number bf individuals of commercial fish and shellfish taken in 12 monthly trawl and seine samples at five locations. Monthly catches were reduced to unit of effort, defined as the combined average catch from one seine haul and one. trawl haul at one station in 1 month. Ar eas of circles are proponionate to siz~s of catch.
15
Table 6 . --Swtms.ry of data from the Biology phase of the Es tuarine Inventory, Florido. west eoaot, April 1968 through M.areh 1969
Ten Charlot te Tnz:lpo Cedar Category of catch Thousand St. Mark's Island a Harbor Bay Key
~r£i8l,!!J2§£i~§ ~\mher---
Fioh: Individuals ... ........... 1,762 8,181 6,588 3,397 3,8?3 Speeiea .... ............ .. 19 19 26 2l 18
Invertebro. tes : lndividuols . ............. 78 171 3, 578 500 602 Species ......... : ........ 3 4 ' 6 '
Total individuals . ..... 1, 840 8,352 10,166 3 , 897 4 , 475 Total opecieo .......... 22 23 31 27 23
}bnca:cercial specie:J
Fish: Individunl a . ............. 5,917 3,352 8,269 1 , 166 2,703 Specieo ••................ 28 34 33 33 28
Invertebrates: 100.1 viduals .............. 603 2,683 1,684 3,877 118,482 Spccieo .................. 19 32 27 34 21
Total individuals ...... 6, 520 6,035 9,9S3 5, 043 21, 18S Total opecieo .......... 47 66 60 67 49
Gra.nd. total 1nd1 viduala 8,360 14,38? 20,ll9 8,940 25,660 Grand. total speci es . ... 69 89 91 94 72
1 Thc large tigurc results 1"rom 18, 000 snallo, ~ ~~ caughi. in Februo.ry and Jl.arch.
The total cat c h was 77,466 individuals, of which 37 percent were contributed by species designated as commercial (table 6) . T he par ticipants agreed that a comme r c ial species is defined as one that is listed in Fishery Statistics of the United States and in official annual statistics publications of the States .
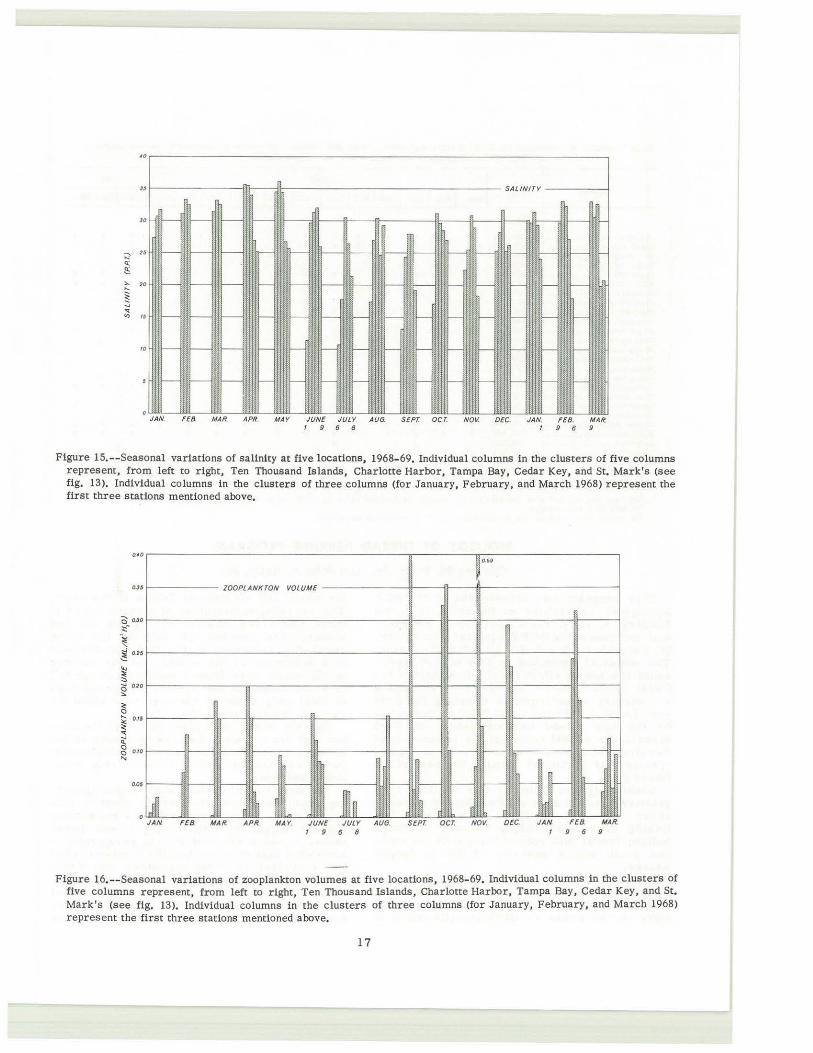
The catch varied seasonally. T he catch was highes t in July, when the catch averaged 1,527 commercial fish per unit of effort and lowest in November, when the average catch was only 51 (fig. 14) . The unit of effort is the c ·om bined catch from one seine haul and one trawl haul at one station. Salinity varied seasonally but was above 15 p .p .t. except for three samplings at Ten Thousand Islands, when it was between 10 and 15 p.p .t. (fig. 15 ), Zooplankton volumes were highest in autumn and next highest in late winter and spring (fig. 16). A No . 2, 1/2 - m, plankton net fitted with a flowmeter was used,
Table 7 lists the 25 most valuable species of commercial fish and shellfish on the west coast of Florida in descending order of the value of landings. An ~ appears opposite a species and under a month if that species was caught at one or more stations in this study. Note that only eight s pecies do not have at least one ~· The total value of the species with at l east one ~ is 82 percent of the value of all species .
The significance of t he Inventory is t hat it confirms and amplifies earlier work. It confirms the importance of estuaries as nursery ground s for young commercial and sport fish and invertebrates, and provides new informa t i on to support efforts of preservation and maximum utilization of estuaries. It amplifies past work by providing a new body of basic data in the Area Description phase and by
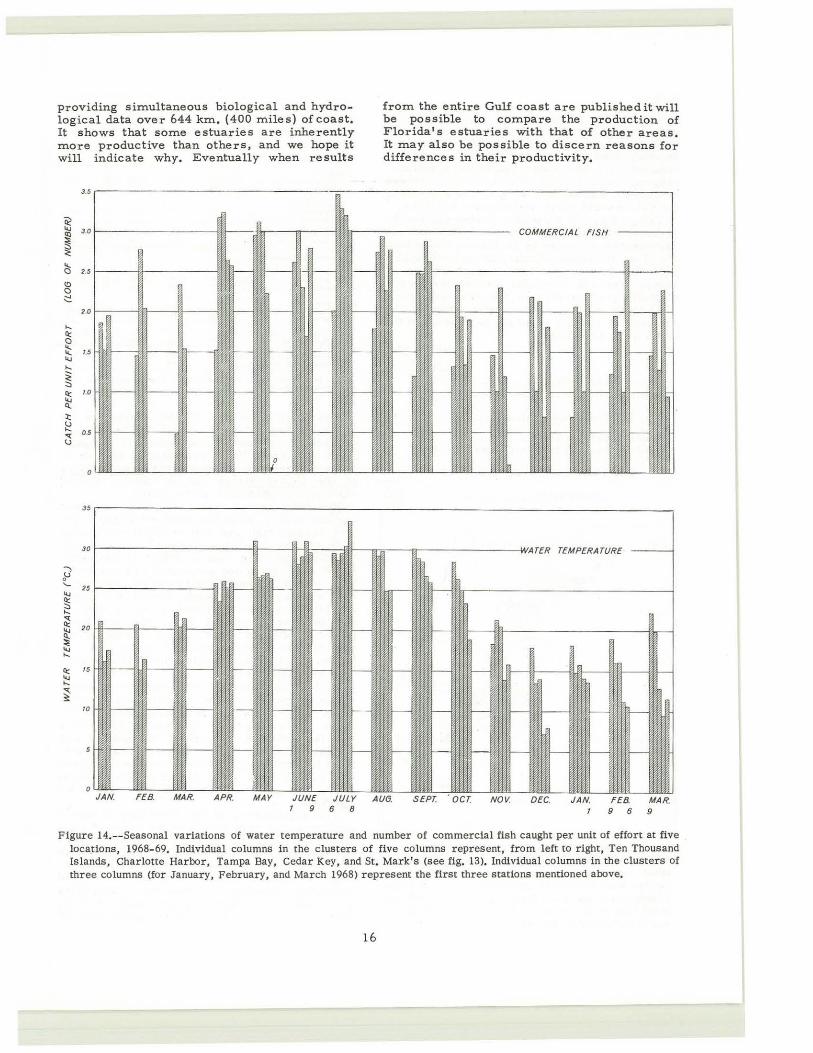
providing simultaneous biological and hydrological data over 644 km. (400 miles) ofcoast. It shows that some estuaries are inherently more productive than others, and we hope it will indicate why. Eventually when results
from the entire Gulf coast are published it will be possible to compare the production of Florida's estuaries with that of other areas. It may also be possible to discern reasons for differences in their productivity.
~sr---------------------------------------=------------------------------------------------------,
~ .... 3 .0 Ill
~ <::
~ 2.5
\!) a -:::
20
,._ Q:: a ::: 1.5 .... ,._ ~ ;:, ll::
lt 10
:t: ~ OS "t (..)
0
35
30
""" }i '- 25 .... ~ ,._ "t
~ 20
.... ,._
ll:: IS .... ,._
~ 10
5
0 APR. MAY JUNE JULY AUG.
1 9 6 8 SEPT. OCT. NOV.
COMMERCIAL F/Sff
DEC. JAN FEB. MAR. 9 6 9
Figure 14.--Seasonal variations of water temperature and number of commercial fish caught per unit of effort at five locations, 1968-69. Individual columns in the clusters of five columns represent, from left to right, Ten Thousand Islands, Charlotte Harbor, Tampa Bay, Cedar Key, and St. Mark's (see fig. 13). Individual columns in the clusters of thr ee columns (for January, February, and Mar ch 1968) represent the first three s tations mentioned above.
16
<0
>O
;:?- 2$
0: ~ ,.. 70
§ ..., "' "' ,.
10
JAN. FEB MAR. APR
SALINITY
~~~ - I--
IM !mil -
mtll MAY JUNE JU£Y AUG. SEPT. OCT. NO~ DEC. JAN. FEB. MAR.
1968 1969
Figure 15.-- Seasonal variations of salinity at five locations, 1968-69. Individual columns in the clusters of five columns represent, from left to right, Ten Thousand Islands, Charlotte Harbor, Tampa Bay, Cedar Key, and St. Mark's (see fig. 13). Individual columns in the clusters of three columns (for January, Februar y, and Mar ch 1968) repr esent the first three stations mentioned above.
0 40 0.5P
ZOOPLANKTON VO£ UME
~ .... 01$
~ "' ~
- r- -j fj ~ J ~ .m~ !
0 010 2
o.os
JAN I'EB MAR APR MAY. JUNE J U£ Y AUG. SEPT. OCT. NOV. DEC. JAN. I'EB. MAR 9 6 8 9 6 9
Figure 16.-- Seasona1 variations of zooplankton volumes at five locations, 1968-69. Individual columns in the clusters of five columns represent, from left to right, Ten Thousand Islands, Charlotte Harbor, Tampa Bay, Cedar Key, and St. Mark's (see fig. 13). Individual columns in the clusters of three columns (for January, February, and March 1968) represent the first three stations mentioned above.
17
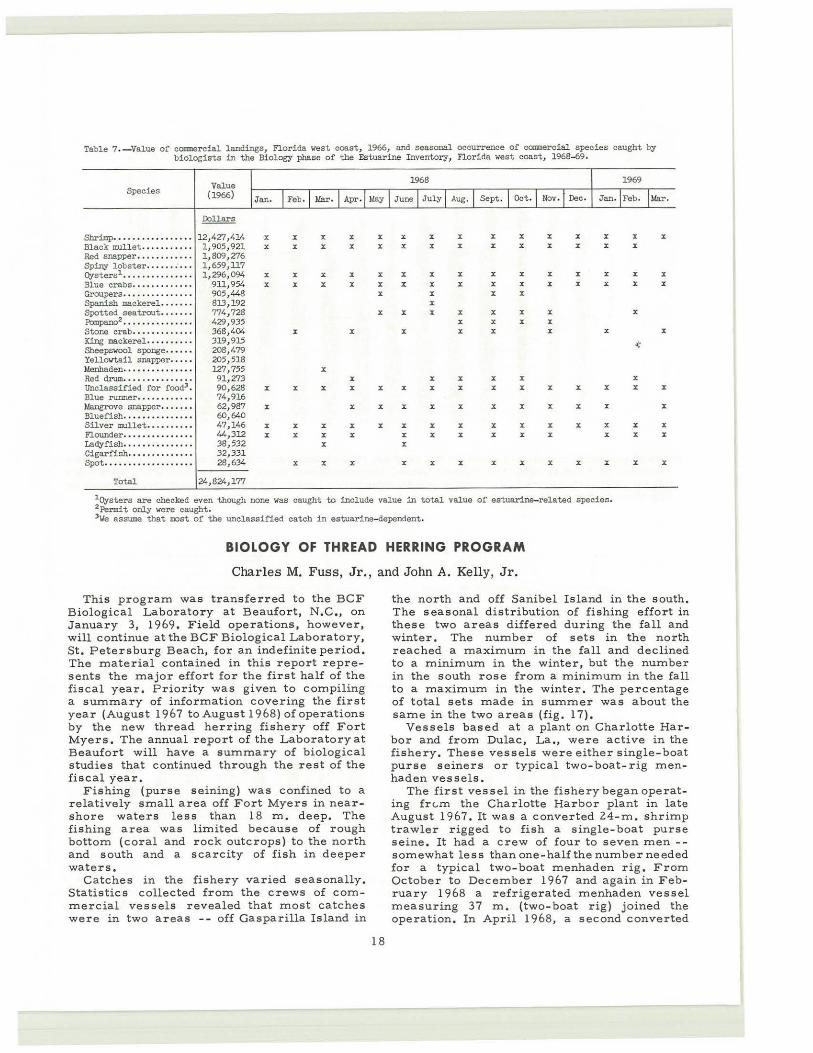
Table 7 . - Value of canmercial landings, Florida vest cosst, 1966, and seasonal occurrence of cOIIIllercisl species caught by biologists in the Biology phase of the Estuarine Inventory, Florida vest coast, 1968-69.
Vslue 1968 1969
Species (1966) Jan. I Feb., Mar. I Apr. , May I June I July I Aug. , Sept. I Oct. , Nov. , Dec. Jan. ,Feb. 11/.ar .
Dollars
Shrimp ••••• • ••••••••••• 12,427,414 X X X X X X X X X X X X X X X
Black mullet ..•••..•••. 1,905,921 X X X X X X X X X X X X X X
Red snapper .•......•••. 1,809,276 Spiny lobster .••..•. ..• l,659,ll7 Oysters1 •••• ••••••••••• 1,296,094 X X X X X X X X X X X X X X X
Blue crabs .•.•••••....• 9ll,954 X X X X X X X X X X X X X X X
Groupers .•...•.••• . .. .• 905,448 X X X X
Spanish mackerel. ••.•• . 813,192 X
Spotted sea trout •.•• ..• 774,728 X X X X X X X X
R:>mpano2 .... . ... .. ..... 429,935 X X X X
Stone crab •..•• .. •••... 368,404 X X X X X X X X
King mackerel •.••..•... 319,915 ~
SheepSilool sponge . •••.. 208, 479 Yellowtail snapper •••.• 205,518 Menhaden ....•.• •.. ••• .. 127,755 X Red drum .... .. . .... .... 91,273 X X X X X X
Unclassified for food3 • 90,628 X X X X X X X X X X X X X X X
Blue runner • • .••••.• ••. 74, 916 Mangrove snapper ... ••.. 62,987 X X X X X X X X X X X X
Bluefish ..••.• .. .. . •. .• 60,640 Silver mullet ••.••.•.•• 47, 146 X X X X X X X X X X X X X X X
Flounder .•..•..••••.•.. 44,312 X X X X X X X X X X X X X
Ladyfish •. . .••. ••••. ••. 38,532 X X
Cigarfish .•.•..•••...•. 32,331 Spot .•••••.•. ··•···•··· 28,634 X X X X X X X X X X X X X
Totsl 24,824,177
10ysters are checked even though none vas caught to include value in total vslue of estuarine- related species. 2Permit only vere caught. 3we assume that most of the unclassified catch in estuarine-dependent.
BIOLOGY OF THREAD HERRING PROGRAM
Charles M. Fuss, Jr., and John A. Kelly, Jr.
This p rogram was transferred to the BCF B iological Laboratory at Beaufort, N . C ., on January 3, 1969. F ield operations, however, will continue at the BCF Biological Laborator y , S t . Pete r sburg Beach, for an indefinite period. The material contained in this r eport represents the major effort for the first half of the fiscal year. Priority was given t o compiling a summary of information covering the first year (August 1967 to August 1968) of operations by the new thread herring fishery off Fort Myers. The annual report of the Laboratory at Beaufort will have a summary of biological studies that continued thr ough the rest of the fi scal year.
Fishing (purse seining) was confined to a relatively small area off F ort Myers in nearshore waters les s than 18 m, deep. The fishing area was limited because of rough bottom (coral and rock outcrops) to the north and south and a scarcity of fish in deeper waters.
Catches in the fishery varied seasonally. Statistics collected from t he crews of com mercial vessels revealed that most catches were in two areas -- off Gaspa r illa Island in
18
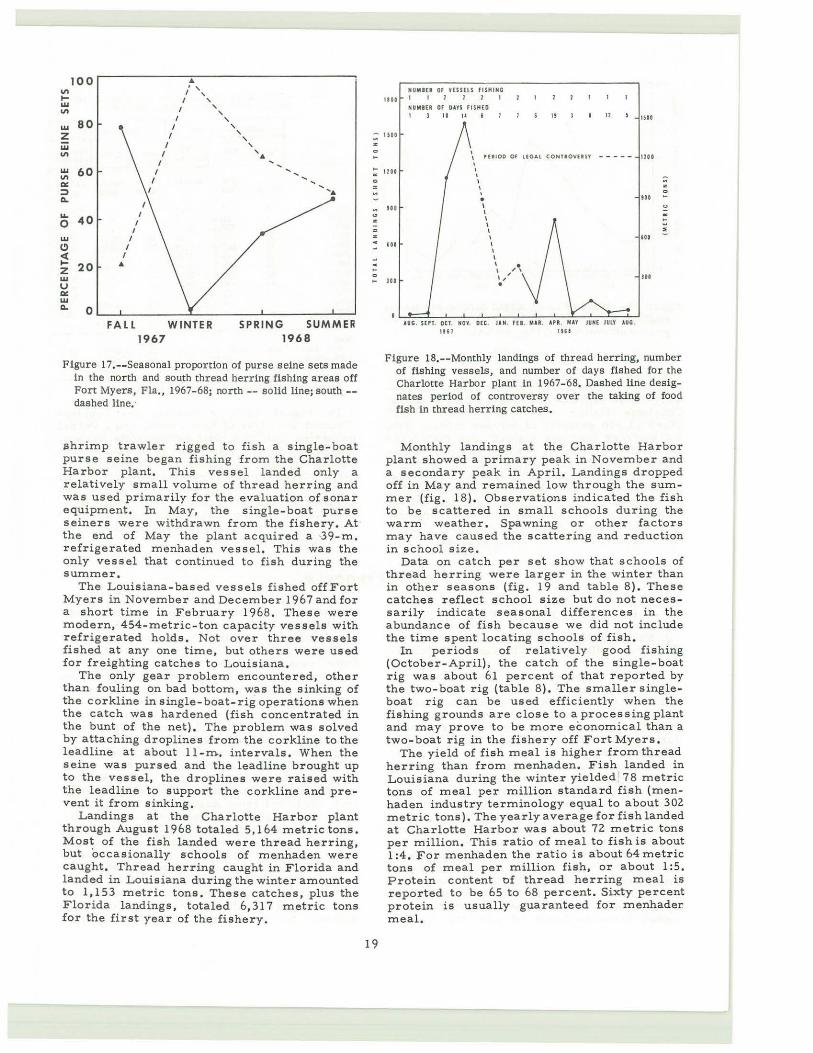
the north and off Sanibel Island in the south. The seasonal distribution of fishing effort in these two areas differed during the fall and winter. The number of sets in the north reached a maximum in the fall and declined t o a minimum in the winter, but the number in the south rose from a m inimum i n the fall to a maximum i n the winter. The percentag e of total sets made in summer was about the same in the two areas (fig. 17).
Vessels based a t a p lant on Charlott e Harbor and from Dulac, La., were active in the fishery , These vessels were either single-boat purse seiners or typical two-boat-rig menhaden vessels.
The first vessel i n t he fishery began operating fr c-m the Charlotte Harbor plant in late Au gust 1967. It was a conve r ted 24-m . shrimp trawler rigged to fish a single-boat purse seine . It had a c rew of four to seven men- somewhat l e ss t han one-half the number needed for a typical two- boat menhaden rig. From October to December 1967 and again in February 1968 a refriger ated menhaden vessel measuring 37 m, (two - boat rig) joined the operation. In April 1968 , a second converted
100 • '' "' I ' .... I ' w
I ' "' ' 80 I ' w I ' z I ' ' w I '
"' I ' • I w 60 I
"' I ~ ;:) '• a.
~ 40 0 w C) <( .... 20 • z w u 110: w a. 0
FALL WINTER SPRING SUMMER 1967 1968
Figure 17 .--Seasonal proportion of purse seine sets made in the north and south thread herring fishing areas off Fort Myers, Fla., 1967-68; north -- solid line; south -dashed line,·
.shrimp trawler rigged to fish a single-boat purse seine began fishing fr om the Charlotte Harbor plant. This vessel landed only a relatively small volume of thread herring and was used primarily for the evaluation of sonar equipment, In May, the single-boat purse seiners were withdrawn from the fishery. At the end of May the plant acquired a 39-m. refrigerated menhaden vessel. This was the only vessel that continued to fish during the summer,
The Louisiana-based vessels fished offFort Mye rs in November and December 1967 and for a short time in February 1968 , These were modern, 454-metric-ton capacity vessels with refrigerated holds, Not over three vessels fished at any one time, but others were used for freighting catches to Louisiana,
The only gear problem encountered, other than fouling on bad bottom, was the sinking of the corkline in single-boat-rig operations when the catch was hardened (fish concentrated in the bunt of the net), The problem was solved by attaching droplines from the cor kline to the l eadline at a bout 11-m. intervals, When the seine was pursed and the leadline brought up to the vessel, the droplines were raised with the leadline to support the corkline and prevent it from sinking.
Landings at the Charlotte Harbor plant through August 1968 totaled 5,164 metric tons, Mos~ of the fish landed were thread herring, but occasionally schools of menhaden were caught, Thread herring caught in Florida and landed in Louisiana during the winter amounted to 1,153 metric tons. These catches, plus the Flo rida landings, totaled 6, 317 metric tons for the first year of the fishery.
1101 NUMBER OF VESSELS fiSHINC I I 2 2 1 I
NUMIER Of DAYS FIS HED 1 3 I 0 I~ 6 II 12 uoo
: IUO z
r f.IOD Of UGA.l CONtiOVUSY - ---- Uti I
: 1210 I I
0
"'
:: z ;; z . . ;; ~
19
... 100
lot
I I I . I I I I I
AUG . S£PT. OCT. NOV. DEC. IUJ
I I I I I o I ' I I,' •
z 0
100
a
,. 100
...
uu
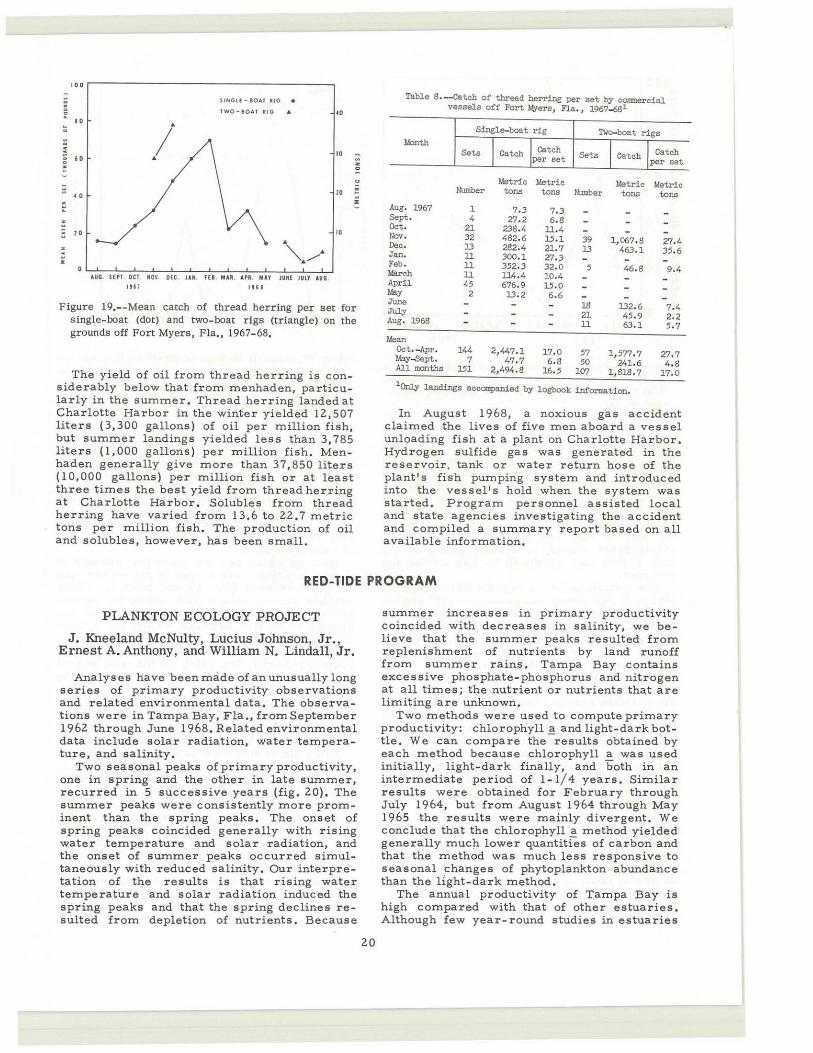
Figure 18,--Monthly landings of thread herring, number of fishing vessels, and number of days fished for the Charlotte Harbor plant in 1967-68, Dashed line designates period of controversy over the taking of food fish in thread herring catches .
Monthly landings at the Charlotte Harbor plant showed a primary pe~k in November and a secondary peak in April. Landings dropped off in May and remained low through the summer (fig. 18). Observations indicated the fish to be scattered in small schools during the warm weather. Spawning or other factors may have caused the scattering and reduction in school size .
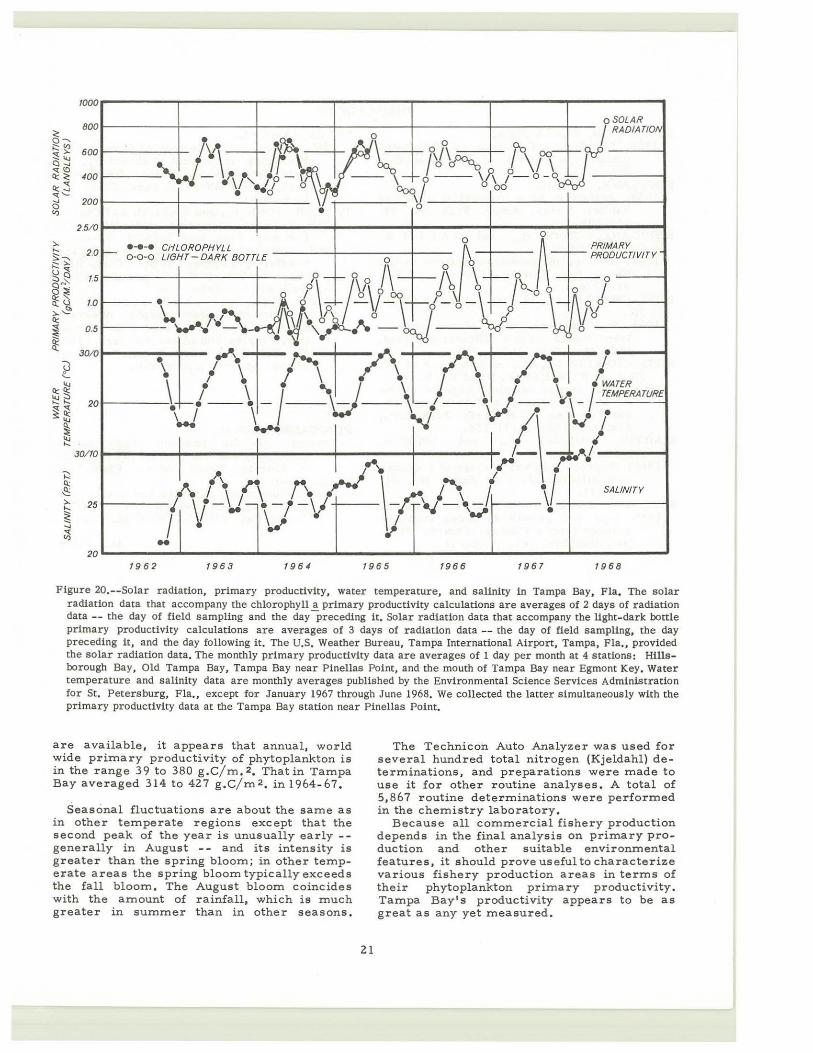
Data on catch per set show that schools of thread herring we re larger in the w i nter than in other seasons (fig . 19 and table 8), These catches reflect school size but do not necessarily indicate seasonal differences in the abundance of fish because we did not include the time spent locating schools of fish.
In periods of relatively good fishing (October-April), the catch of the single-boat rig was about 61 percent of that reported by the two- boat rig (table 8). The smaller singleboat rig can be used efficiently when the fishing grounds are close to a processing plant and may prove to be more economical than a t wo-boat rig in the fishery off Fort Myers .
The yield of fish meal is higher from thread herring than from menhaden. Fish landed in Louisiana during the winter yielded 1 78 metric tons of meal per million standard fish (menhaden industry terminology equal to about 302 metric tons). The yearly average for fish landed at Charlotte Harbor was about 72 metric tons per million. This r atio of meal to fish is about 1:4, For menhaden the ratio is about 64 metric tons of meal per million fish, or about 1:5. Protein content of thread herring meal is reported to be 65 to 68 pe r cent. Sixty percent protein is usually guaranteed for menhader. meal.
0
0
0 ~
0 %
toor-------------------------------------,
10
iO
SINGl f - lOAf IIIG e
TWO- I OA T RIG 10
10
z 0
u
~
40 10 :
"' . %
2 0 10
a
AUG. SEPT. OCT NOV. DEC. JAN. fEI. MAlt APR. MAY JUNE JULY AUG. I UJ '"'
Figure 19.--Mean catch of thread herring per set for single-boat (dot) and two-boat rigs (triangle) on the grounds off Fort Myers, Fla., 1967-68.
The yield of oil from thread herring is considerably below that from menhaden, particularly in the summer, Thread herring landed at Charlotte Harbor in the winter yielded 12,507 liters (3,300 gallons) of oil per million fish, but summer landings yielded less than 3, 785 liters ( 1, 000 gallons) per million fish. Menhaden generally give more than 3 7, 850 liters (10,000 gallons) per million fish or at least three times the best yield from thread herring at Charlotte Harbor. Solubles from thread herring have varied from 13.6 to 22.7 metric tons per million fish. The production of oil and solubles, however, has been small.
Table 8.-Catch of thread herring per set by commercial vessels of f Fort lzyers, Fla., 1967~1
Month
Aug. 1967 Sept. Oct. Nov . Dec. Jan. Feb. March April May June July Aug. 1968
Mean Oct.-Apr. May-Sept. All months
Single- boat rig
Sets I Catch ll Catch per set
Metric ll.etric Number tons tons
l 7 .3 7 .3 4 :n .2 6 .8
21 238. 4 11.4 32 482. 6 15.1 13 282.4 21.7 ll 300. 1 :n.3 ll 352.3 32. 0 ll 114. 4 10.4 45 676.9 15 .0
2 13.2 6. 6
144 2 , 447.1 17. 0 7 47. 7 6.8
151 2,494 . 8 16 . 5
'l\fo-boat rigs
Sets I Catch I Catch per set
Metric !l.etric Number tons t ons
39 1,067. 8 :n.4 13 463. 1 35 .6
5 46. 8 9 . 4
l8 132. 6 7. 4 21 45. 9 2.2 ll 63.1 5 . 7
57 1, 577. 7 :n.? 50 241.6 4 . 8
107 1, 818. 7 17 . 0 1
0nly l andings accompanied by logbook information.
In August 1968, a noxious gas accident claimed the lives of five m en aboard a vessel unloading fish at a plant on Charlotte Harbor, Hydrogen sulfide gas was generated i n the reservoir, tank or water return hose of the plant's fish pumping system and introduced into the vessel's hold when the system was started. Program personnel assisted local and state agencies investigating the accident and compiled a summary rep ort based on all available information.
RED-TIDE PROGRAM
PLANKTON ECOLOGY PROJECT
J. Kneeland McNulty, Lucius Johnson, Jr., Ernest A. Anthony, and William N. Lindall, Jr.
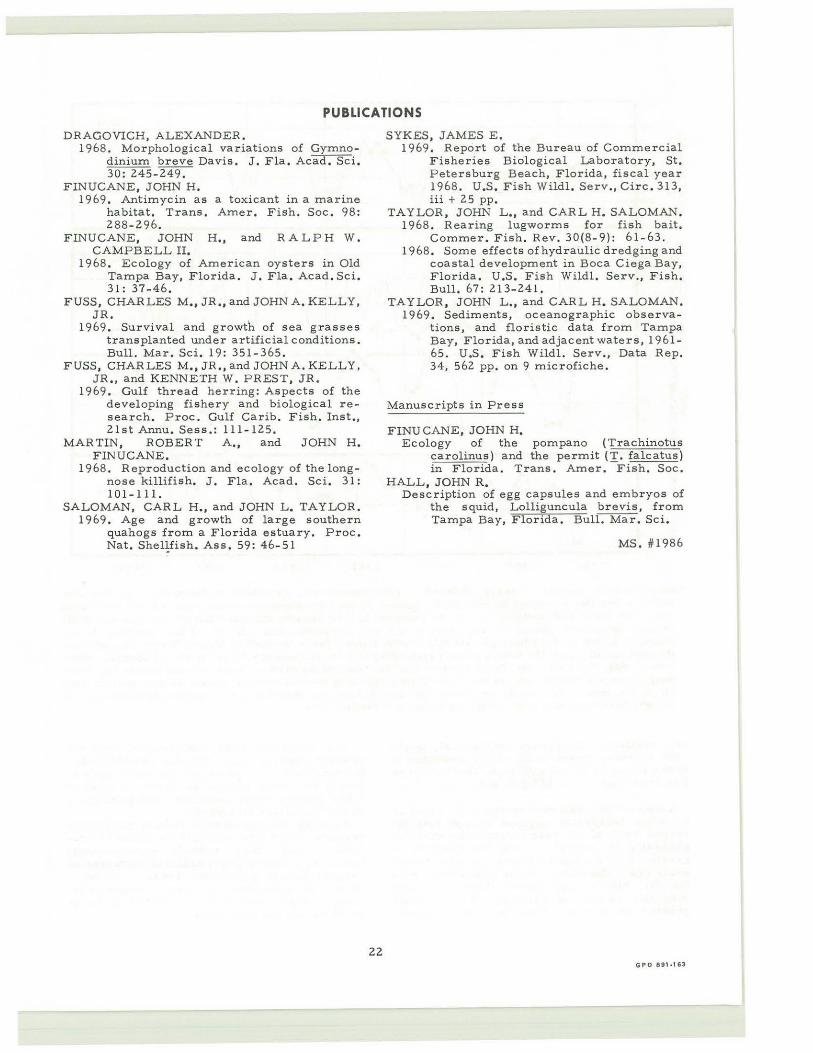
Analyses have been made of an unusually long series of primary productivity observations and related environmental data. The observa tions were in Tampa Bay, Fla., from September 1962 through June 1968. Related environmental data include solar radiation, water temperature, and salinity.
Two seasonal peaks of primary productivity, one in spring and the other in late summer, recurred in 5 successive years (fig. 20). The summer peaks were consistently more prominent than the spring peaks, The onset of spring peaks coincided generally with rising water temperature and solar radiation, and the onset of summer peaks occurred simultaneously with reduced salinity. Our interpretation of the results is that rising water temperature and solar radiation induced the spring peaks and that the spring declines resulted from depletion of nutrients. Because
20
summer increases in primary productivity coincided with decreases in salinity, w e believe that the summer peaks resulted from replenishment of nutrients by land runoff from summer rains. Tampa Bay contai ns excessive phosphate-phosph orus and nitrogen at all times; the nutrient or nutrients that are limiting are unknown.
Two methods w e re used to compute primary productivity: chlorophyll~ and light-dark bottle, We can compare the results obtained by each method because chlorophyll a was used initially, light-dark finally, and both in an intermediate period of 1-1/ 4 years. Similar results were obtained for February through July 1964, but from August 1964 through May 1965 the results were mainly divergent, We conclude that the chlorophyll a method yielded generally mucp. lower quantities of carbon and that the method was much less responsive to seasonal changes of phytoplankton abundance than the 11ght-dark method.
The annual productivity of Tampa Bay is high compared with that of other estuaries. Although few year-round studies in estuaries
1000
oSOLAR
~ o-... j:;:(/)
BOO I 0 I RADIATION
i\l\ i~\ ~~-o'>jo~ ~\/\-t-?t? ..__--~- .·,l'-.lP-~o \ -- ~~J--'l'ol-o-oJJ-----t 600 oq::>. _ ....
a ..... oq:(!) It~ 400 ct3 oq:'--..... 200
• 0 Jf ' ~--------+-----------+------ J 0 Q
"' 2.510
).. .... 2.0 f--':>-... ;::::::.. (.J<{
~~ 1.5 Q"~ o, 8:u. 1.0 )..~ It
~ 0.5
~ 30/0
~ '--....
It~ ~ ... 20 ~~ .... ~ ~
30110
-;::: Q; Q; -..;; ).. 25 .... ~ ..... <{
"' 20
19 6 2 1963 19 6 4 1965 1966 196 7 1968
Figure 20.--Solar radiation, primary productivity, water temperature, and salinity in Tampa Bay, Fla. The solar radiation data that accompany the chlorophyll a primary productivity calculations are averages of 2 days of radiation data -- the day of field sampling and the day -preceding it. Solar radiation data that accompany the light-dark bottle primary productivity calculations are averages of 3 days of radiation data -- the day of field sampling, the day preceding it, and the day following it. The U.S. Weather Bureau, Tampa International Airport, Tampa, Fla., provided the solar radiation data. The monthly primary productivity data are averages of 1 day per month at 4 stations: Hillsborough Bay, Old Tampa Bay, Tampa Bay near Pinellas Point, and the mouth of Tampa Bay near Egmont Key. Water temperature and salinity data are monthly averages published by the Environmental Science Services Administration for St. Petersburg, Fla., except for January 1967 through June 1968. We collected the latter simultaneously with the primary productivity data at the Tampa Bay station near Pinellas Point.
are available, it appears that annual, world wide primary productivity of phytoplankton is in the range 39 to 380 g.C/m. 2, That in Tampa Bay averaged 314 to 427 g.C/m2, in 1964-67,
Seasonal fluctuations are about the same as in other temperate regions except that the second peak of the year is unusually early-generally in August -- and its intensity is greater than the spring bloom; in other temperate areas the spring bloom typically exceeds the fall bloom, The August bloom coincides with the amount of rainfall, which is much greater in summe r than in other seasons,
21
The Technicon Auto Analyzer was used for several hundred total nitrogen (Kjeldahl ) determinations, and preparations were made to use it for other routine analyses . A total of 5,867 routine determinations were performed in the chemistry laboratory.
Because all commercial fishery production depends in the final analysis on primary production and other suitable environmental features, it should prove useful to characterize various fishery production areas in terms of their phytoplankton primary productivity. Tampa Bay's productivity appears to be as great as any yet measured.
PUBLICATIONS
DRAGOVICH, ALEXANDER. 1968. Morphological variations of Gymno
dinium breve Davis, J . Fla. Acad, Sci, 30: 245 - 249.
F INUCANE, JOHN H. 19 69. Antimycin as a toxicant in a marine
habitat. Trans , Amer. Fish. Soc . 98: 288-296.
FINUCANE, JOHN H., and RALPH W. CAMPBELL II.
1968. Ecology of American oysters in Old Tampa Bay, Florida. J. Fla. Acad , Sci. 31 : 3 7-46.
FUSS, CHARLES M., JR., a nd JOHN A, KELLY, JR.
1969 . Survival and growth of sea grasses transplanted under artificial conditions. Bull. Mar. Sci. 19: 351-365.
FUSS, CHARLES M,,JR ., andJOHNA.KELLY , JR., and K ENNETH W. PREST, JR.
1969. Gulf thread herring: Aspects of the developing fishery and biological r e search. Proc. Gulf Carib. F ish. Inst., 2 1st Annu. Sess .: 111-125,
MARTIN, ROBERT A ., and JOHN H. FINUCANE.
1968 . Reproduction and ecology of the longnose killifish. J. Fla. Acad. Sci. 31: 101-111.
SALOMAN, CARL H., and JOHN L. TAYLOR . 1969 . Age and g r owth of large southern
quahogs from a Florida estuary. Proc. Nat, Shellfish. Ass. 59: 46-51
22
SYKES, JAMES E . 1969. Report of the Bureau of Commercial
Fisheries Biological Laboratory, St. Petersburg Beach, Florida, fiscal year 1968 . U.S. Fish Wildl. Serv., Circ. 313, iii + 25 pp.
TAYLOR, JOHN L., and CARL H. SALOMAN . 1968 . Rearing lugworm s for fish bait .
Commer. Fish. Rev. 30(8- 9) : 61-63. 1968. Some effects of hydraulic dredging and
coastal development in Boca Ciega Bay, Florida. U.S. Fish Wildl, Serv., Fish, Bull, 67: 213-241.
TAYLOR, JOHN L., and CARL H. SALOMAN. 1969. Sediments , oceanographic observa
tions, and floris t ic data fr om Tampa Bay, Florida, and adjacent waters, 1961-65 . U.S, Fish Wildl. Serv., Data Rep. 34, 562 pp. on 9 mic r ofiche .
Man uscript s in Press
FINUCANE, JOHN H, Ecology of the pompano (Trach inotus
carolinus) and the permit n:. falcatus) in Florida. Trans. Amer. Fish. Soc .
HALL, JOHN R, Description of egg capsules and embryos of
the squid, Lolliguncula brevis , from Tampa Bay, Florida . Bull. Mar . Sci.
MS. #1986
As the Nation's principal conservation agency, the Department of the Interior has basic responsibilities for water, fish, wildlife, mineral, land, park, and recreational resources. Indian and Territorial affairs are other major concerns of America's "Department of Natural Resources. "
The Department works to assure the wisest choice in managing all our resources so each will make its full contribution to a better United States -- now and in the future.
UNITED STATES DEPARTMENT OF THE INTERIOR
U.S. FISH AND WILDLIFE SERVICE BUREAU OF COMMEROAL FISHERIES
WASHINGTON, D.C. 20240
OFFICIA L BUSINESS
Rerum thi s sheer to above address, if you do N 0 T wish to receive thi s material 0, or if change of addres s is needed 0 (indicate change including ZlP Code).
POSTAGE AND FEES PAID U.S. DEPARThfENT OF THE INTERIOR