report name: oilseeds and products update
TRANSCRIPT
THIS REPORT CONTAINS ASSESSMENTS OF COMMODITY AND TRADE ISSUES MADE BY USDA STAFF AND NOT NECESSARILY STATEMENTS OF OFFICIAL U.S. GOVERNMENT POLICY
Required Report: Required - Public Distribution Date: September 01, 2021
Report Number: IN2021-0103
Report Name: Oilseeds and Products Update
Country: India
Post: New Delhi
Report Category: Oilseeds and Products
Prepared By: Ankit Chandra, Agricultural Specialist
Approved By: Mark Rosmann
Report Highlights:
India’s soybean production estimate for marketing year (MY) 2021/22 (October-September) is lowered to 10.8
million metric tons (MMT) on account of delayed and erratic rainfall. Peanut production remains unchanged at
6.2 MMT. On August 25, 2021, the Indian government approved a 1.2 MMT quota for soybean meal derived
from genetically modified soybeans to address high animal feed prices impacting the industry. Cumulative oil
meal exports in the October 2020 to July 2021 period grew 80 percent over the same period last year, with
soybean meal exports alone climbing 168 percent. Peanut oil exports for the current MY are estimated at
260,000 metric tons, primarily to China despite a three percent reduction in total edible oil imports.
Page 2 of 13
GENERAL INFORMATION:
2021 Southwest Monsoon Progress and Kharif (Fall Harvested) Planting
On June 3, 2021, India’s southwest monsoon (June-September) first arrived in Kerala. The Indian
Meteorological Department (IMD) predicted normal rainfall, with 96 to 104 percent of the long period average
(LPA). However, the resulting monsoon has been erratic, with cumulative rainfall from June 1 to July 21 five
percent lower than the LPA, signaling delayed planting. Key soybean growing regions in central and northwest
India experienced reduced rainfall of eight and nine percent respectively, whereas peanut growing regions in
southern India experienced a 20 percent increase. However, prolonged episodes of persistent rainfall in July
were observed in parts of Rajasthan and Madhya Pradesh, while Maharashtra and Gujarat witnessed subdued
rainfall activity. As of August, cumulative rainfall has been two and 11 percent above normal in northwest and
southern India, respectively, while trailing below one percent in central India. Normal rainfall is forecast
through September, increasing expectations of higher farm productivity.
As of August 5, 2021, India’s reservoir levels were measured at 98.43 billion cubic meters, approximately 130
percent above last year’s storage volume and 120 percent of the average storage levels of the last ten years.
According to the Ministry of Agriculture and Farmers Welfare (MoA), planting progress for soybeans as of
August 5 was recorded at 11.5 million hectares (Mha), three percent below the corresponding period last year.
Soybean production area in Madhya Pradesh has seen the maximum decline (Figure 1), owing to the late arrival
and erratic monsoon that delayed sowing.
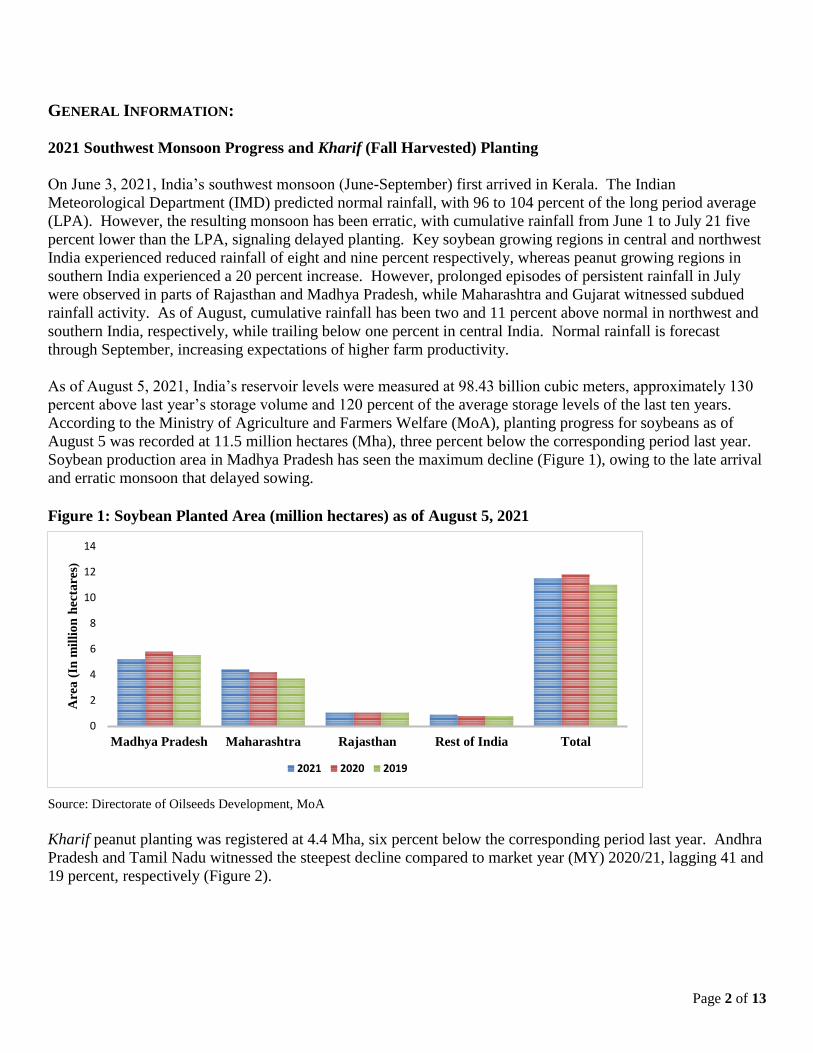
Figure 1: Soybean Planted Area (million hectares) as of August 5, 2021
Source: Directorate of Oilseeds Development, MoA
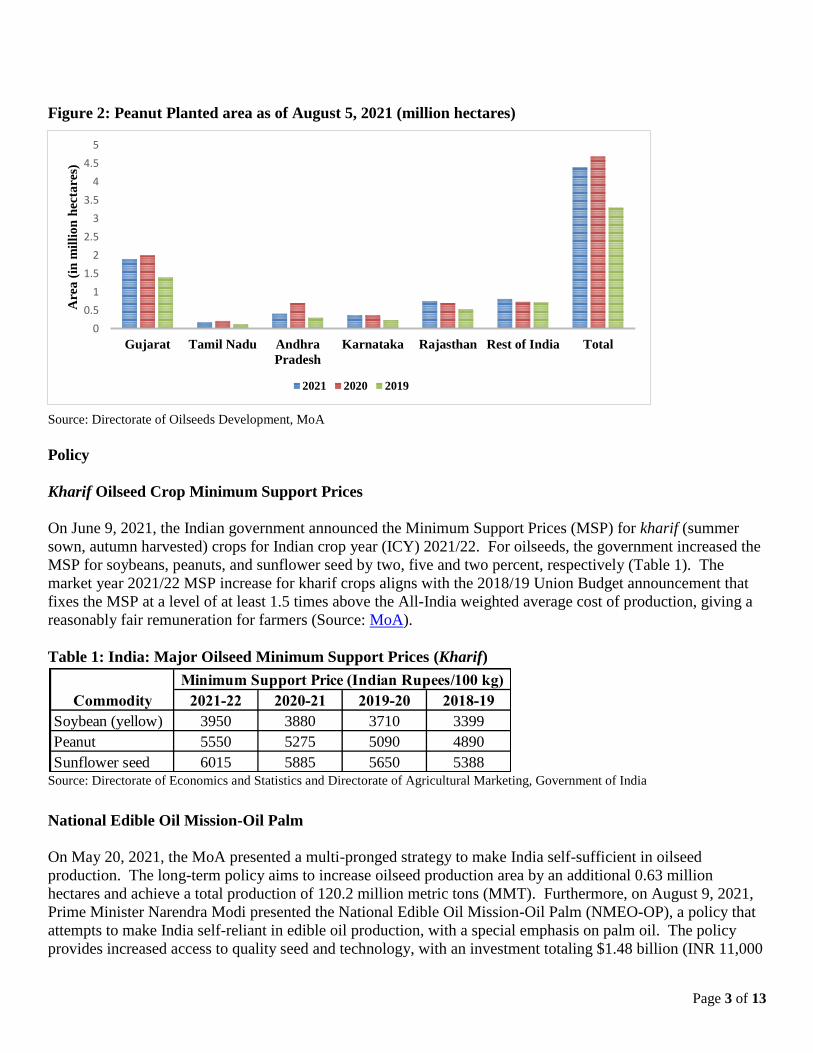
Kharif peanut planting was registered at 4.4 Mha, six percent below the corresponding period last year. Andhra
Pradesh and Tamil Nadu witnessed the steepest decline compared to market year (MY) 2020/21, lagging 41 and
19 percent, respectively (Figure 2).
0
2
4
6
8
10
12
14
Madhya Pradesh Maharashtra Rajasthan Rest of India Total
Are
a (
In m
illi
on
hec
tare
s)
2021 2020 2019
Page 3 of 13
Figure 2: Peanut Planted area as of August 5, 2021 (million hectares)
Source: Directorate of Oilseeds Development, MoA
Policy
Kharif Oilseed Crop Minimum Support Prices
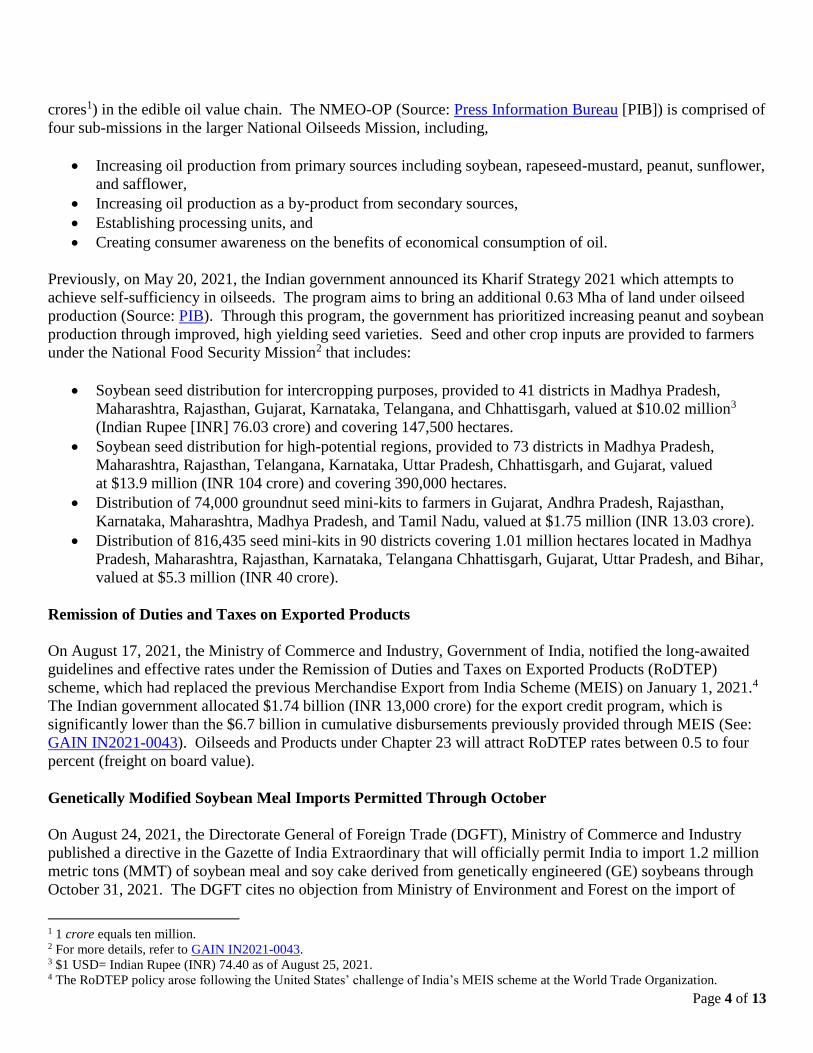
On June 9, 2021, the Indian government announced the Minimum Support Prices (MSP) for kharif (summer
sown, autumn harvested) crops for Indian crop year (ICY) 2021/22. For oilseeds, the government increased the
MSP for soybeans, peanuts, and sunflower seed by two, five and two percent, respectively (Table 1). The
market year 2021/22 MSP increase for kharif crops aligns with the 2018/19 Union Budget announcement that
fixes the MSP at a level of at least 1.5 times above the All-India weighted average cost of production, giving a
reasonably fair remuneration for farmers (Source: MoA).
Table 1: India: Major Oilseed Minimum Support Prices (Kharif)
Source: Directorate of Economics and Statistics and Directorate of Agricultural Marketing, Government of India
National Edible Oil Mission-Oil Palm
On May 20, 2021, the MoA presented a multi-pronged strategy to make India self-sufficient in oilseed
production. The long-term policy aims to increase oilseed production area by an additional 0.63 million
hectares and achieve a total production of 120.2 million metric tons (MMT). Furthermore, on August 9, 2021,
Prime Minister Narendra Modi presented the National Edible Oil Mission-Oil Palm (NMEO-OP), a policy that
attempts to make India self-reliant in edible oil production, with a special emphasis on palm oil. The policy
provides increased access to quality seed and technology, with an investment totaling $1.48 billion (INR 11,000
0
0.5
1
1.5
2
2.5
3
3.5
4
4.5
5
Gujarat Tamil Nadu Andhra
Pradesh
Karnataka Rajasthan Rest of India Total
Are
a (
in m
illi
on
hec
tare
s)
2021 2020 2019
2021-22 2020-21 2019-20 2018-19
Soybean (yellow) 3950 3880 3710 3399
Peanut 5550 5275 5090 4890
Sunflower seed 6015 5885 5650 5388
Minimum Support Price (Indian Rupees/100 kg)
Commodity
Page 4 of 13
crores1) in the edible oil value chain. The NMEO-OP (Source: Press Information Bureau [PIB]) is comprised of
four sub-missions in the larger National Oilseeds Mission, including,
Increasing oil production from primary sources including soybean, rapeseed-mustard, peanut, sunflower,
and safflower,
Increasing oil production as a by-product from secondary sources,
Establishing processing units, and
Creating consumer awareness on the benefits of economical consumption of oil.
Previously, on May 20, 2021, the Indian government announced its Kharif Strategy 2021 which attempts to
achieve self-sufficiency in oilseeds. The program aims to bring an additional 0.63 Mha of land under oilseed
production (Source: PIB). Through this program, the government has prioritized increasing peanut and soybean
production through improved, high yielding seed varieties. Seed and other crop inputs are provided to farmers
under the National Food Security Mission2 that includes:
Soybean seed distribution for intercropping purposes, provided to 41 districts in Madhya Pradesh,
Maharashtra, Rajasthan, Gujarat, Karnataka, Telangana, and Chhattisgarh, valued at $10.02 million3
(Indian Rupee [INR] 76.03 crore) and covering 147,500 hectares.
Soybean seed distribution for high-potential regions, provided to 73 districts in Madhya Pradesh,
Maharashtra, Rajasthan, Telangana, Karnataka, Uttar Pradesh, Chhattisgarh, and Gujarat, valued
at $13.9 million (INR 104 crore) and covering 390,000 hectares.
Distribution of 74,000 groundnut seed mini-kits to farmers in Gujarat, Andhra Pradesh, Rajasthan,
Karnataka, Maharashtra, Madhya Pradesh, and Tamil Nadu, valued at $1.75 million (INR 13.03 crore).
Distribution of 816,435 seed mini-kits in 90 districts covering 1.01 million hectares located in Madhya
Pradesh, Maharashtra, Rajasthan, Karnataka, Telangana Chhattisgarh, Gujarat, Uttar Pradesh, and Bihar,
valued at $5.3 million (INR 40 crore).
Remission of Duties and Taxes on Exported Products
On August 17, 2021, the Ministry of Commerce and Industry, Government of India, notified the long-awaited
guidelines and effective rates under the Remission of Duties and Taxes on Exported Products (RoDTEP)
scheme, which had replaced the previous Merchandise Export from India Scheme (MEIS) on January 1, 2021.4
The Indian government allocated $1.74 billion (INR 13,000 crore) for the export credit program, which is
significantly lower than the $6.7 billion in cumulative disbursements previously provided through MEIS (See:
GAIN IN2021-0043). Oilseeds and Products under Chapter 23 will attract RoDTEP rates between 0.5 to four
percent (freight on board value).
Genetically Modified Soybean Meal Imports Permitted Through October
On August 24, 2021, the Directorate General of Foreign Trade (DGFT), Ministry of Commerce and Industry
published a directive in the Gazette of India Extraordinary that will officially permit India to import 1.2 million
metric tons (MMT) of soybean meal and soy cake derived from genetically engineered (GE) soybeans through
October 31, 2021. The DGFT cites no objection from Ministry of Environment and Forest on the import of
1 1 crore equals ten million. 2 For more details, refer to GAIN IN2021-0043. 3 $1 USD= Indian Rupee (INR) 74.40 as of August 25, 2021. 4 The RoDTEP policy arose following the United States’ challenge of India’s MEIS scheme at the World Trade Organization.
Page 5 of 13
soybean meal derived from GE-soybeans as it does not contain any living modified organism (LMO).
According to the DGFT notification, imports are restricted through two ports—Jawaharlal Nehru Port Trust
(JNPT), Nhava Sheva (India’s largest container port near Mumbai), and LCS Petrapole, a land port on the Indo-
Bangladesh border.
High Animal Feed Prices Driving Change
Soybean meal is the most common protein source5 for all compound feeds for India’s poultry, dairy,
aquaculture, and pork producing sectors. However, in January 2021, Indian domestic soybean meal prices
climbed without warning, and July-August prices have soared to unprecedented highs, increasing 118 percent
from February 2021 (Figure 4), impacting the business viability of poultry, dairy, livestock, and aquaculture
(shrimp) producers, necessitating relief. Beginning March 2021, India’s poultry feed industry began
aggressively petitioning the Indian government for relief, seeking authorization to import soybean meal derived
from GE-soybeans (See GAIN: IN2021-0102).
Larger Objectives
The Indian government’s permitting of GE-soybean meal imports is largely aimed to address the soaring prices
of domestic soybean meal and may push market speculators and traders to release held domestic stocks. As of
August 25, 2021, many soybean meal traders have entered advance-supply contracts for soybean meal from
Bangladesh, estimated at 150,000 metric tons (MT). At the same time, soybean meal domestic prices have gone
down four percent and settled at $1,112/MT as of August 29, 2021.
Impact on U.S. suppliers
While most soybean meal is shipped in bulk, the measure limits GE-soymeal imports to containerized
shipments, affecting potential supplies from major global soybean meal exporters from North and South
America, including Argentina, Brazil, and the United States. This policy will benefit regional suppliers
including Bangladesh, Vietnam and Malaysia and other transshipment sources include the United Arab
Emirates (UAE) and Singapore. However, the current global container shortage, COVID-19 induced supply
chain disruptions in South Asia, as well as Bangladesh’s lower crush capacity, may limit regional soymeal
producers’ ability to supply the full 1.2 MMT quota volume.
5 Soymeal/soy de-oiled cake, the solid substance left after oil is expelled from the seed, forms the 30 percent component of poultry
feed, with corn accounting for the remaining carbohydrate component (70 percent) of the feed ration.
Page 6 of 13
OILSEEDS:
SOYBEANS
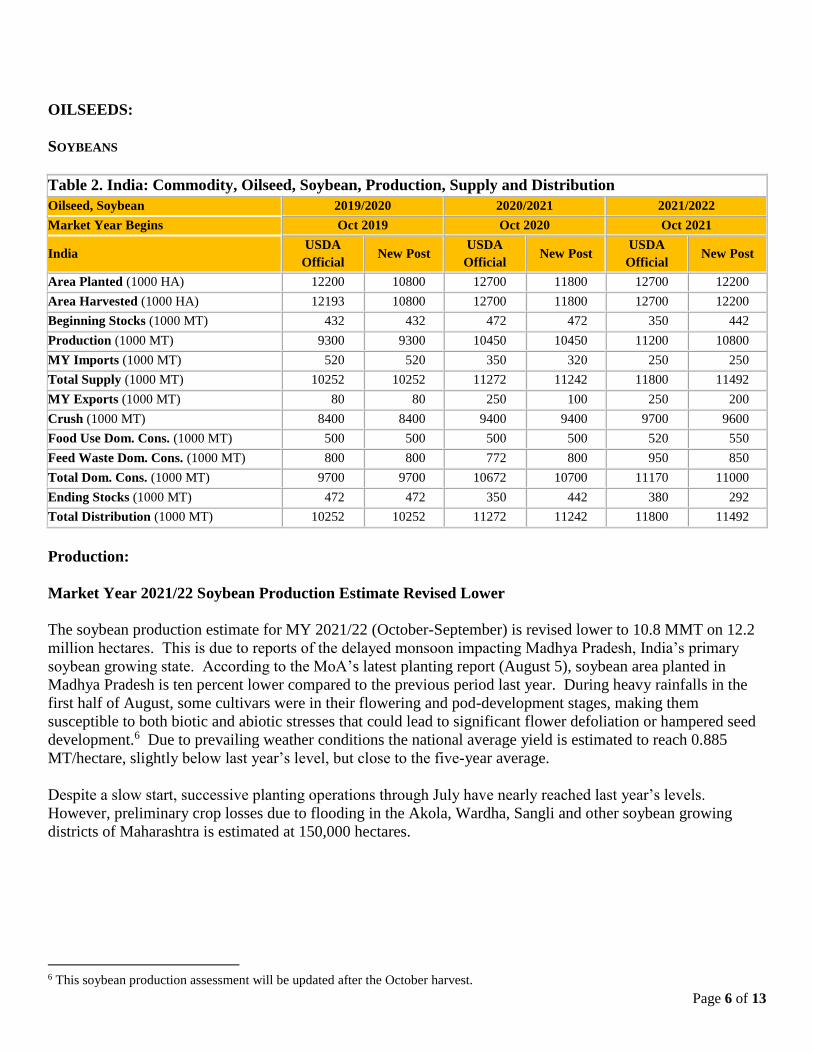
Table 2. India: Commodity, Oilseed, Soybean, Production, Supply and Distribution
Oilseed, Soybean 2019/2020 2020/2021 2021/2022
Market Year Begins Oct 2019 Oct 2020 Oct 2021
India USDA
Official New Post
USDA
Official New Post
USDA
Official New Post
Area Planted (1000 HA) 12200 10800 12700 11800 12700 12200
Area Harvested (1000 HA) 12193 10800 12700 11800 12700 12200
Beginning Stocks (1000 MT) 432 432 472 472 350 442
Production (1000 MT) 9300 9300 10450 10450 11200 10800
MY Imports (1000 MT) 520 520 350 320 250 250
Total Supply (1000 MT) 10252 10252 11272 11242 11800 11492
MY Exports (1000 MT) 80 80 250 100 250 200
Crush (1000 MT) 8400 8400 9400 9400 9700 9600
Food Use Dom. Cons. (1000 MT) 500 500 500 500 520 550
Feed Waste Dom. Cons. (1000 MT) 800 800 772 800 950 850
Total Dom. Cons. (1000 MT) 9700 9700 10672 10700 11170 11000
Ending Stocks (1000 MT) 472 472 350 442 380 292
Total Distribution (1000 MT) 10252 10252 11272 11242 11800 11492
Production:
Market Year 2021/22 Soybean Production Estimate Revised Lower
The soybean production estimate for MY 2021/22 (October-September) is revised lower to 10.8 MMT on 12.2
million hectares. This is due to reports of the delayed monsoon impacting Madhya Pradesh, India’s primary
soybean growing state. According to the MoA’s latest planting report (August 5), soybean area planted in
Madhya Pradesh is ten percent lower compared to the previous period last year. During heavy rainfalls in the
first half of August, some cultivars were in their flowering and pod-development stages, making them
susceptible to both biotic and abiotic stresses that could lead to significant flower defoliation or hampered seed
development.6 Due to prevailing weather conditions the national average yield is estimated to reach 0.885
MT/hectare, slightly below last year’s level, but close to the five-year average.
Despite a slow start, successive planting operations through July have nearly reached last year’s levels.
However, preliminary crop losses due to flooding in the Akola, Wardha, Sangli and other soybean growing
districts of Maharashtra is estimated at 150,000 hectares.
6 This soybean production assessment will be updated after the October harvest.
Page 7 of 13
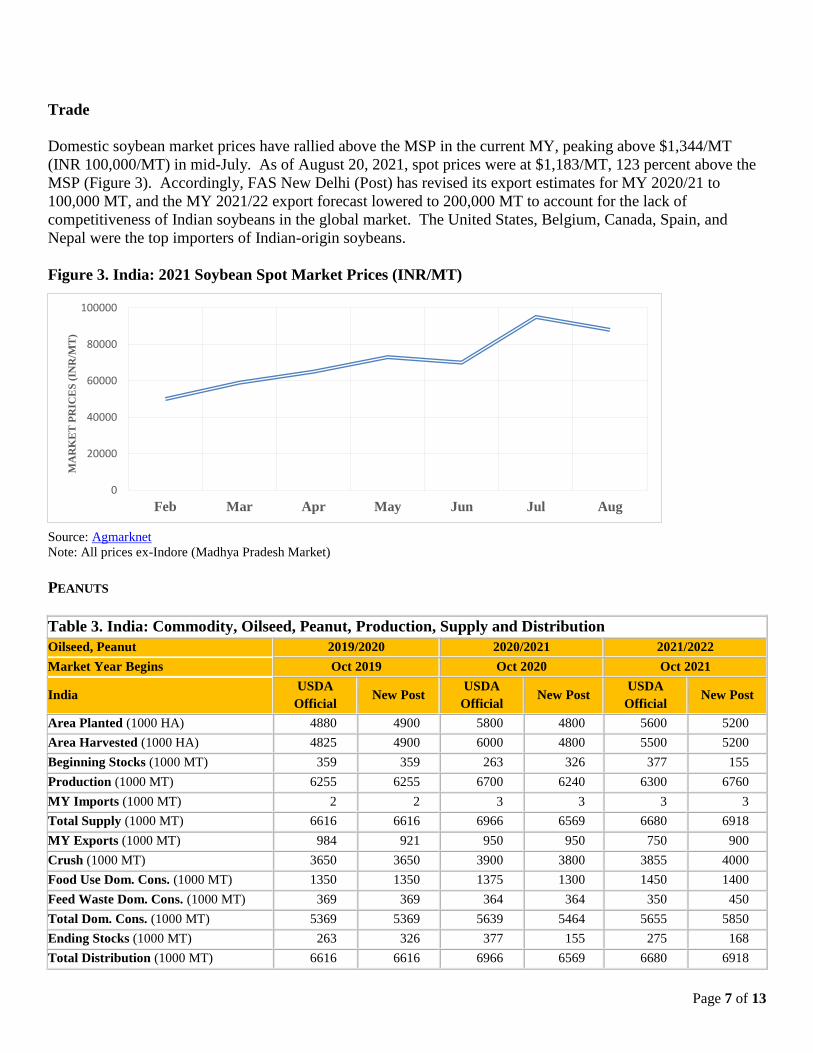
Trade
Domestic soybean market prices have rallied above the MSP in the current MY, peaking above $1,344/MT
(INR 100,000/MT) in mid-July. As of August 20, 2021, spot prices were at $1,183/MT, 123 percent above the
MSP (Figure 3). Accordingly, FAS New Delhi (Post) has revised its export estimates for MY 2020/21 to
100,000 MT, and the MY 2021/22 export forecast lowered to 200,000 MT to account for the lack of
competitiveness of Indian soybeans in the global market. The United States, Belgium, Canada, Spain, and
Nepal were the top importers of Indian-origin soybeans.
Figure 3. India: 2021 Soybean Spot Market Prices (INR/MT)
Source: Agmarknet
Note: All prices ex-Indore (Madhya Pradesh Market)
PEANUTS
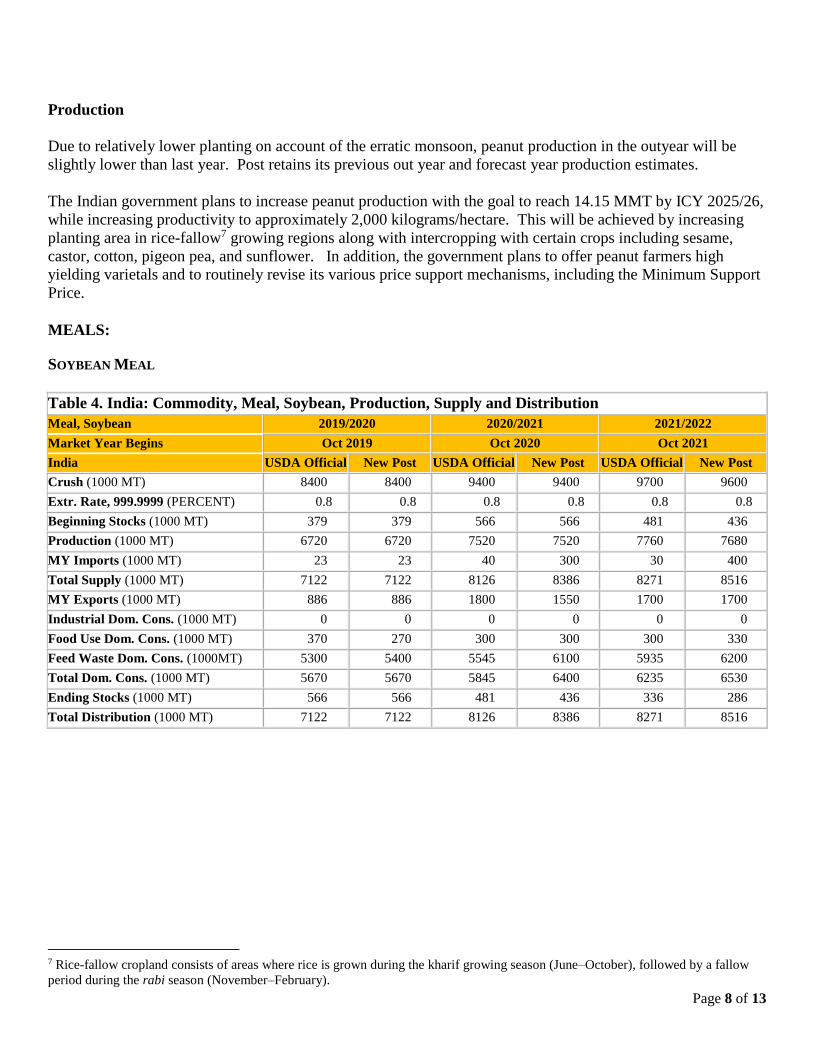
Table 3. India: Commodity, Oilseed, Peanut, Production, Supply and Distribution
Oilseed, Peanut 2019/2020 2020/2021 2021/2022
Market Year Begins Oct 2019 Oct 2020 Oct 2021
India USDA
Official New Post
USDA
Official New Post
USDA
Official New Post
Area Planted (1000 HA) 4880 4900 5800 4800 5600 5200
Area Harvested (1000 HA) 4825 4900 6000 4800 5500 5200
Beginning Stocks (1000 MT) 359 359 263 326 377 155
Production (1000 MT) 6255 6255 6700 6240 6300 6760
MY Imports (1000 MT) 2 2 3 3 3 3
Total Supply (1000 MT) 6616 6616 6966 6569 6680 6918
MY Exports (1000 MT) 984 921 950 950 750 900
Crush (1000 MT) 3650 3650 3900 3800 3855 4000
Food Use Dom. Cons. (1000 MT) 1350 1350 1375 1300 1450 1400
Feed Waste Dom. Cons. (1000 MT) 369 369 364 364 350 450
Total Dom. Cons. (1000 MT) 5369 5369 5639 5464 5655 5850
Ending Stocks (1000 MT) 263 326 377 155 275 168
Total Distribution (1000 MT) 6616 6616 6966 6569 6680 6918
0
20000
40000
60000
80000
100000
Feb Mar Apr May Jun Jul Aug
MA
RK
ET
PR
ICE
S (
INR
/MT
)
Page 8 of 13
Production
Due to relatively lower planting on account of the erratic monsoon, peanut production in the outyear will be
slightly lower than last year. Post retains its previous out year and forecast year production estimates.
The Indian government plans to increase peanut production with the goal to reach 14.15 MMT by ICY 2025/26,
while increasing productivity to approximately 2,000 kilograms/hectare. This will be achieved by increasing
planting area in rice-fallow7 growing regions along with intercropping with certain crops including sesame,
castor, cotton, pigeon pea, and sunflower. In addition, the government plans to offer peanut farmers high
yielding varietals and to routinely revise its various price support mechanisms, including the Minimum Support
Price.
MEALS:
SOYBEAN MEAL
Table 4. India: Commodity, Meal, Soybean, Production, Supply and Distribution
Meal, Soybean 2019/2020 2020/2021 2021/2022
Market Year Begins Oct 2019 Oct 2020 Oct 2021
India USDA Official New Post USDA Official New Post USDA Official New Post
Crush (1000 MT) 8400 8400 9400 9400 9700 9600
Extr. Rate, 999.9999 (PERCENT) 0.8 0.8 0.8 0.8 0.8 0.8
Beginning Stocks (1000 MT) 379 379 566 566 481 436
Production (1000 MT) 6720 6720 7520 7520 7760 7680
MY Imports (1000 MT) 23 23 40 300 30 400
Total Supply (1000 MT) 7122 7122 8126 8386 8271 8516
MY Exports (1000 MT) 886 886 1800 1550 1700 1700
Industrial Dom. Cons. (1000 MT) 0 0 0 0 0 0
Food Use Dom. Cons. (1000 MT) 370 270 300 300 300 330
Feed Waste Dom. Cons. (1000MT) 5300 5400 5545 6100 5935 6200
Total Dom. Cons. (1000 MT) 5670 5670 5845 6400 6235 6530
Ending Stocks (1000 MT) 566 566 481 436 336 286
Total Distribution (1000 MT) 7122 7122 8126 8386 8271 8516
7 Rice-fallow cropland consists of areas where rice is grown during the kharif growing season (June–October), followed by a fallow
period during the rabi season (November–February).
Page 9 of 13
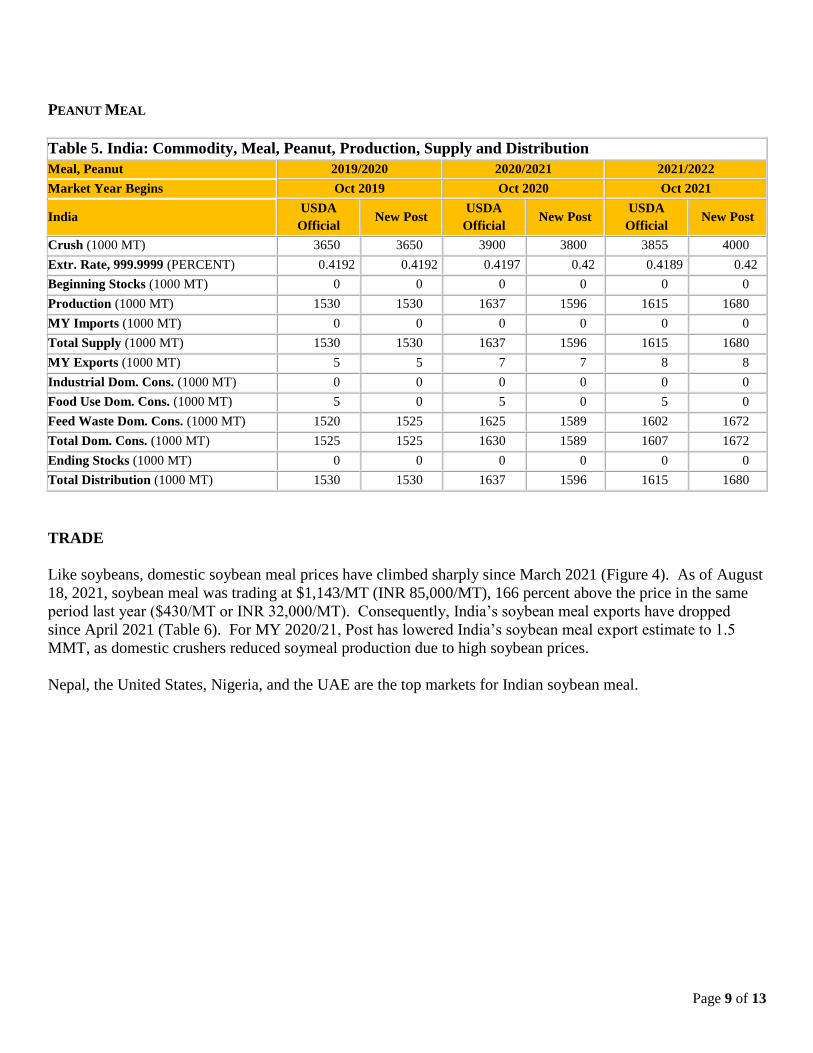
PEANUT MEAL
Table 5. India: Commodity, Meal, Peanut, Production, Supply and Distribution
Meal, Peanut 2019/2020 2020/2021 2021/2022
Market Year Begins Oct 2019 Oct 2020 Oct 2021
India USDA
Official New Post
USDA
Official New Post
USDA
Official New Post
Crush (1000 MT) 3650 3650 3900 3800 3855 4000
Extr. Rate, 999.9999 (PERCENT) 0.4192 0.4192 0.4197 0.42 0.4189 0.42
Beginning Stocks (1000 MT) 0 0 0 0 0 0
Production (1000 MT) 1530 1530 1637 1596 1615 1680
MY Imports (1000 MT) 0 0 0 0 0 0
Total Supply (1000 MT) 1530 1530 1637 1596 1615 1680
MY Exports (1000 MT) 5 5 7 7 8 8
Industrial Dom. Cons. (1000 MT) 0 0 0 0 0 0
Food Use Dom. Cons. (1000 MT) 5 0 5 0 5 0
Feed Waste Dom. Cons. (1000 MT) 1520 1525 1625 1589 1602 1672
Total Dom. Cons. (1000 MT) 1525 1525 1630 1589 1607 1672
Ending Stocks (1000 MT) 0 0 0 0 0 0
Total Distribution (1000 MT) 1530 1530 1637 1596 1615 1680
TRADE
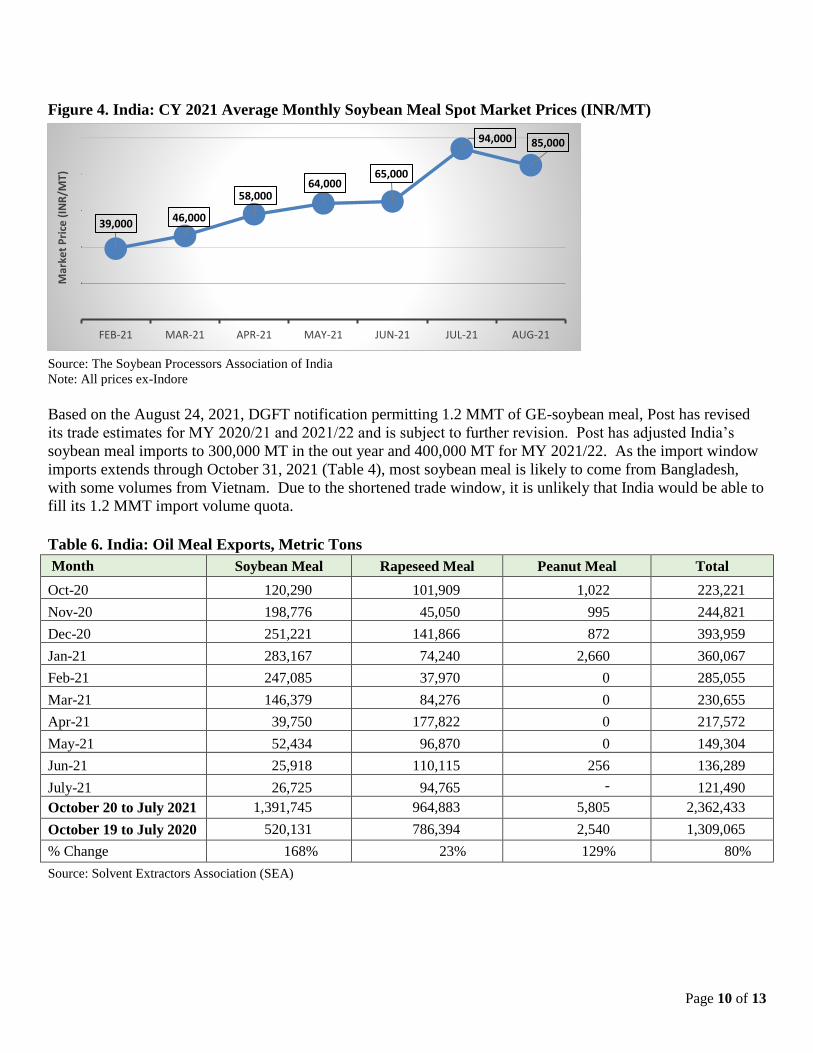
Like soybeans, domestic soybean meal prices have climbed sharply since March 2021 (Figure 4). As of August
18, 2021, soybean meal was trading at $1,143/MT (INR 85,000/MT), 166 percent above the price in the same
period last year ($430/MT or INR 32,000/MT). Consequently, India’s soybean meal exports have dropped
since April 2021 (Table 6). For MY 2020/21, Post has lowered India’s soybean meal export estimate to 1.5
MMT, as domestic crushers reduced soymeal production due to high soybean prices.
Nepal, the United States, Nigeria, and the UAE are the top markets for Indian soybean meal.
Page 10 of 13
Figure 4. India: CY 2021 Average Monthly Soybean Meal Spot Market Prices (INR/MT)
Source: The Soybean Processors Association of India
Note: All prices ex-Indore
Based on the August 24, 2021, DGFT notification permitting 1.2 MMT of GE-soybean meal, Post has revised
its trade estimates for MY 2020/21 and 2021/22 and is subject to further revision. Post has adjusted India’s
soybean meal imports to 300,000 MT in the out year and 400,000 MT for MY 2021/22. As the import window
imports extends through October 31, 2021 (Table 4), most soybean meal is likely to come from Bangladesh,
with some volumes from Vietnam. Due to the shortened trade window, it is unlikely that India would be able to
fill its 1.2 MMT import volume quota.
Table 6. India: Oil Meal Exports, Metric Tons
Month Soybean Meal Rapeseed Meal Peanut Meal Total
Oct-20 120,290 101,909 1,022 223,221
Nov-20 198,776 45,050 995 244,821
Dec-20 251,221 141,866 872 393,959
Jan-21 283,167 74,240 2,660 360,067
Feb-21 247,085 37,970 0 285,055
Mar-21 146,379 84,276 0 230,655
Apr-21 39,750 177,822 0 217,572
May-21 52,434 96,870 0 149,304
Jun-21 25,918 110,115 256 136,289
July-21 26,725 94,765 - 121,490
October 20 to July 2021 1,391,745 964,883 5,805 2,362,433
October 19 to July 2020 520,131 786,394 2,540 1,309,065
% Change 168% 23% 129% 80%
Source: Solvent Extractors Association (SEA)
39,00046,000
58,00064,000
65,000
94,000 85,000
FEB-21 MAR-21 APR-21 MAY-21 JUN-21 JUL-21 AUG-21
Mar
ket
Pri
ce (
INR
/MT)
Page 11 of 13
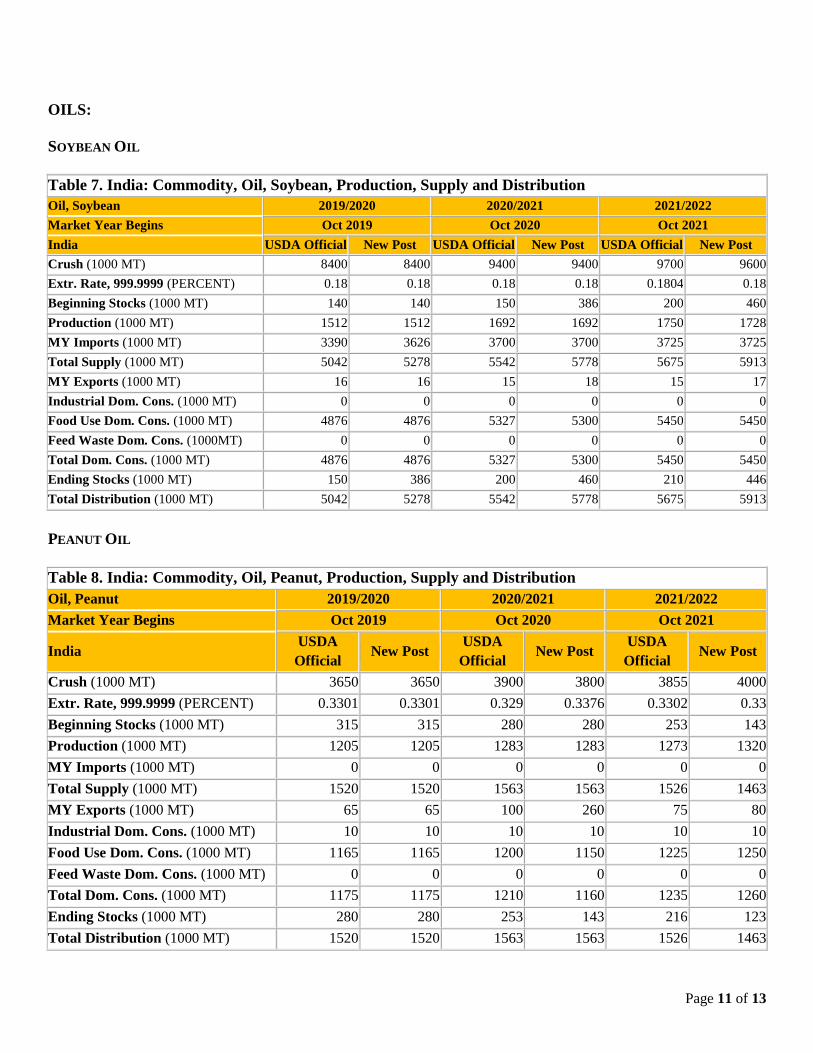
OILS:
SOYBEAN OIL
Table 7. India: Commodity, Oil, Soybean, Production, Supply and Distribution
Oil, Soybean 2019/2020 2020/2021 2021/2022
Market Year Begins Oct 2019 Oct 2020 Oct 2021
India USDA Official New Post USDA Official New Post USDA Official New Post
Crush (1000 MT) 8400 8400 9400 9400 9700 9600
Extr. Rate, 999.9999 (PERCENT) 0.18 0.18 0.18 0.18 0.1804 0.18
Beginning Stocks (1000 MT) 140 140 150 386 200 460
Production (1000 MT) 1512 1512 1692 1692 1750 1728
MY Imports (1000 MT) 3390 3626 3700 3700 3725 3725
Total Supply (1000 MT) 5042 5278 5542 5778 5675 5913
MY Exports (1000 MT) 16 16 15 18 15 17
Industrial Dom. Cons. (1000 MT) 0 0 0 0 0 0
Food Use Dom. Cons. (1000 MT) 4876 4876 5327 5300 5450 5450
Feed Waste Dom. Cons. (1000MT) 0 0 0 0 0 0
Total Dom. Cons. (1000 MT) 4876 4876 5327 5300 5450 5450
Ending Stocks (1000 MT) 150 386 200 460 210 446
Total Distribution (1000 MT) 5042 5278 5542 5778 5675 5913
PEANUT OIL
Table 8. India: Commodity, Oil, Peanut, Production, Supply and Distribution
Oil, Peanut 2019/2020 2020/2021 2021/2022
Market Year Begins Oct 2019 Oct 2020 Oct 2021
India USDA
Official New Post
USDA
Official New Post
USDA
Official New Post
Crush (1000 MT) 3650 3650 3900 3800 3855 4000
Extr. Rate, 999.9999 (PERCENT) 0.3301 0.3301 0.329 0.3376 0.3302 0.33
Beginning Stocks (1000 MT) 315 315 280 280 253 143
Production (1000 MT) 1205 1205 1283 1283 1273 1320
MY Imports (1000 MT) 0 0 0 0 0 0
Total Supply (1000 MT) 1520 1520 1563 1563 1526 1463
MY Exports (1000 MT) 65 65 100 260 75 80
Industrial Dom. Cons. (1000 MT) 10 10 10 10 10 10
Food Use Dom. Cons. (1000 MT) 1165 1165 1200 1150 1225 1250
Feed Waste Dom. Cons. (1000 MT) 0 0 0 0 0 0
Total Dom. Cons. (1000 MT) 1175 1175 1210 1160 1235 1260
Ending Stocks (1000 MT) 280 280 253 143 216 123
Total Distribution (1000 MT) 1520 1520 1563 1563 1526 1463
Page 12 of 13
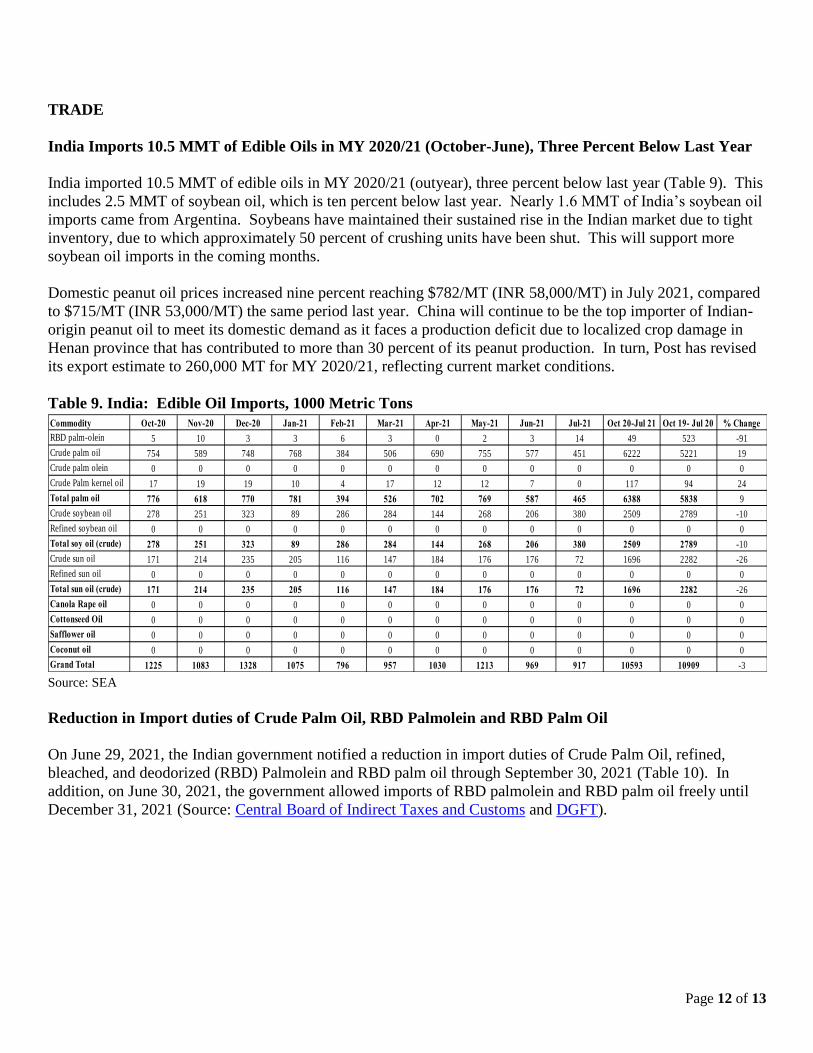
TRADE
India Imports 10.5 MMT of Edible Oils in MY 2020/21 (October-June), Three Percent Below Last Year
India imported 10.5 MMT of edible oils in MY 2020/21 (outyear), three percent below last year (Table 9). This
includes 2.5 MMT of soybean oil, which is ten percent below last year. Nearly 1.6 MMT of India’s soybean oil
imports came from Argentina. Soybeans have maintained their sustained rise in the Indian market due to tight
inventory, due to which approximately 50 percent of crushing units have been shut. This will support more
soybean oil imports in the coming months.
Domestic peanut oil prices increased nine percent reaching $782/MT (INR 58,000/MT) in July 2021, compared
to $715/MT (INR 53,000/MT) the same period last year. China will continue to be the top importer of Indian-
origin peanut oil to meet its domestic demand as it faces a production deficit due to localized crop damage in
Henan province that has contributed to more than 30 percent of its peanut production. In turn, Post has revised
its export estimate to 260,000 MT for MY 2020/21, reflecting current market conditions.
Table 9. India: Edible Oil Imports, 1000 Metric Tons
Source: SEA
Reduction in Import duties of Crude Palm Oil, RBD Palmolein and RBD Palm Oil
On June 29, 2021, the Indian government notified a reduction in import duties of Crude Palm Oil, refined,
bleached, and deodorized (RBD) Palmolein and RBD palm oil through September 30, 2021 (Table 10). In
addition, on June 30, 2021, the government allowed imports of RBD palmolein and RBD palm oil freely until
December 31, 2021 (Source: Central Board of Indirect Taxes and Customs and DGFT).
Commodity Oct-20 Nov-20 Dec-20 Jan-21 Feb-21 Mar-21 Apr-21 May-21 Jun-21 Jul-21 Oct 20-Jul 21 Oct 19- Jul 20 % Change
RBD palm-olein 5 10 3 3 6 3 0 2 3 14 49 523 -91
Crude palm oil 754 589 748 768 384 506 690 755 577 451 6222 5221 19
Crude palm olein 0 0 0 0 0 0 0 0 0 0 0 0 0
Crude Palm kernel oil 17 19 19 10 4 17 12 12 7 0 117 94 24
Total palm oil 776 618 770 781 394 526 702 769 587 465 6388 5838 9
Crude soybean oil 278 251 323 89 286 284 144 268 206 380 2509 2789 -10
Refined soybean oil 0 0 0 0 0 0 0 0 0 0 0 0 0
Total soy oil (crude) 278 251 323 89 286 284 144 268 206 380 2509 2789 -10
Crude sun oil 171 214 235 205 116 147 184 176 176 72 1696 2282 -26
Refined sun oil 0 0 0 0 0 0 0 0 0 0 0 0 0
Total sun oil (crude) 171 214 235 205 116 147 184 176 176 72 1696 2282 -26
Canola Rape oil 0 0 0 0 0 0 0 0 0 0 0 0 0
Cottonseed Oil 0 0 0 0 0 0 0 0 0 0 0 0 0
Safflower oil 0 0 0 0 0 0 0 0 0 0 0 0 0
Coconut oil 0 0 0 0 0 0 0 0 0 0 0 0 0
Grand Total 1225 1083 1328 1075 796 957 1030 1213 969 917 10593 10909 -3
Page 13 of 13
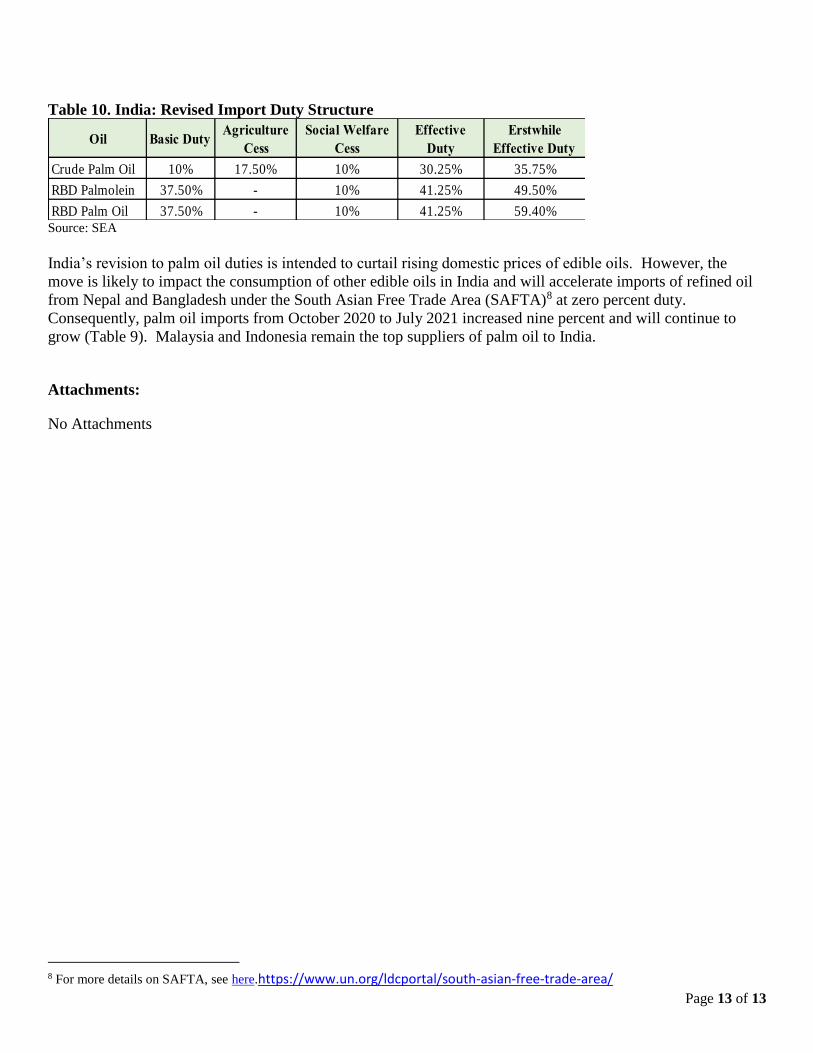
Table 10. India: Revised Import Duty Structure
Source: SEA
India’s revision to palm oil duties is intended to curtail rising domestic prices of edible oils. However, the
move is likely to impact the consumption of other edible oils in India and will accelerate imports of refined oil
from Nepal and Bangladesh under the South Asian Free Trade Area (SAFTA)8 at zero percent duty.
Consequently, palm oil imports from October 2020 to July 2021 increased nine percent and will continue to
grow (Table 9). Malaysia and Indonesia remain the top suppliers of palm oil to India.
Attachments:
No Attachments
8 For more details on SAFTA, see here.https://www.un.org/ldcportal/south-asian-free-trade-area/
Oil Basic DutyAgriculture
Cess
Social Welfare
Cess
Effective
Duty
Erstwhile
Effective Duty
Crude Palm Oil 10% 17.50% 10% 30.25% 35.75%
RBD Palmolein 37.50% - 10% 41.25% 49.50%
RBD Palm Oil 37.50% - 10% 41.25% 59.40%