report ctx 2015
TRANSCRIPT
Arie Sullivan
8/9/2015
ON THE ACTION
MECHANISM OF
CHLOROTOXIN:
APOPTOSIS MSc Research Project

Arie Sullivan
1
Contents
Abstract………………………………………………………………………………………………….2
Introduction…………………………………………………………………………………………….3
Materials and methods………………………………………………………………………….12
Results..…………………………………………………………………………………………………16
Discussion……………………………………………………………………………………………..25
Further investigation…………………………………………………………………………….33
Appendix……………………………………………………………………………………………….34
References…………………………………………………………………………………………….46
Arie Sullivan
2
Abstract.
Scorpion venom is a complex mixture of biologically active compounds, of which some are being
increasingly studied for their therapeutic properties. The family of chlorotoxin (CTX) -like peptides
exhibit insecticidal activity with a yet only little known of its mechanism of action. The primary
activity of CTX is in protection against invertebrate predators, however, CTX’s activity is not
restricted to invertebrates, with growing incoming research reporting CTX binding specificity to
cells of malignant brain tumors, namely glioma. Additionally, studies investigating CTX-based
tissue staining claim CTX-binding extends to tumors of neuroectodermal origin. Deciphering the
mode of action of CTX largely relies on understanding the interactions of CTX at a molecular level,
specifically, ascertaining the exact CTX receptors would provide the parameters in which CTX can
be used safely and therapeutically. Investigations on alternate forms of CTX (BmKCT) report
apoptosis induction in glioma with IC50 values of 0.28µM. It is shown herein that contrary to
expectation, CTX does not reach an IC50 value for any cell line, potentially demonstrating
alternative mechanisms for CTX in its action on tumorous/non-tumorous cell lines. This report
also discloses no apoptogenic properties for CTX as determined by a series of experiments
including statistical analyses of CTX effect on highly migratory cells of neuroectodermal origin,
specifically SHSY5Y; non-migratory breast cancer cell line MCF7; and migratory non-cancerous
human keratinocyte cell line HaCaT. Rather, a new mechanism of action, necrosis induction in
SHSY5Y, is demonstrated for CTX. Moreover, no significant effect on cell line HaCaT expressing
MMP-2, suggests that MMP-2 as a lone CTX target is questionable.
Arie Sullivan
3
Introduction.
Glioma and Neuroblastoma
The glioma family form 65% of primary brain tumors (Wang and Ji, 2005) and include Glioblastoma
multiforme (GBM) and anaplastic astrocytomas, the most aggressive of primary brain tumors
which at best, are accompanied by dismal prognoses (Holland, 2000). Ne uroblastoma (NB),
suspected of originating from neural crest-derived sympathoadrenal progenitor cells, has a high
metastatic potential, and is the most common extracranial tumor in children, accounting for 8-
10% of childhood cancers (Kim et al., 2014; McHugh, 2007).
Despite the progression made over the last decade, a monogenic Mendelian syndrome of
heritable NBs has not been established, moreover, the influences of both epigenetic factors and
of the presumed hereditary components remain to be determined. Genetic factors for a diversity
of human pathologies have been identified by whole exome sequencing yet only recently has it
been applied in ascertaining genetic factors linked to glioma and NB tumorigenesis (Kim et al.,
2015). Thus, efficient therapeutic interventions for both gliomas and NB remain scarce.
NB and glioma cells however, both show an unusual propensity to disperse from the tumor site
with a high metastatic rate, subsequently invading neighboring healthy tissue (Merzak et al.,
1994). As well as sharing metastatic potential, gliomas and NBs have been associated by
embryonic nature, cellular characteristics and tumorigenesis (Kriegstein and Alvarez-Buylla,
2009). Moreover, Notch signaling has been demonstrated to initiate irreversible differenti ation
from Neurogenesis to Gliogenesis by dominant inhibition of BMP-2 in neural crest stem cells
(Morrison et al., 2000). Thus, an investigation into the targeting capacity of CTX to NB would form
a continuation of the research characterizing CTX’s mechanism of action.
Malignant cell invasion
Invasive tumor cells escape surgical removal and geographically circumvent lethal radiation
exposure and chemotherapy (Nakada et al., 2007). This evading ability stems from a unique
capacity of glioma cells to actively migrate through two types of extracellular space in the brain,
the perivascular space present around all blood vessels, and the spaces in between the neurons
and glial cells making up the brain parenchyma and white mater fiber tracts (Paw et al., 2015).
The migration of glioma cells through these extracellular space necessitates particular changes in
cell morphology. Key signaling GTPases that regulate cell morphology and mediate receptor-
initiated signaling in the regulation of glioma invasion are Rho family GTPases including Rac, RhoA
and Cdc42 (Kwiakowska and Symons, 2013).
Arie Sullivan
4
The mechanism of action for NB brain metastasis is not as well -characterized as that of glioma,
but the invasive capacity of many tumor cells necessitates particular mechanisms of action which
can be summarized in three sequential steps. The first step is modification of cell adhesion
property by interaction with the extracellular matrix (ECM) via adhesion proteins such as
integrins, specifically αvβ3 and αvβ6 mediate cell adhesion (Deryugina and Bourdon, 1996). Since
NB is highly metastatic, upregulated expression of αvβ3 is common and has been recognized as a
prognostic indicator for NB (Ribatti et al., 2004). The second step is degradation of the
extracellular matrix (ECM) via proteolytic enzymes such as members of the matrix
metalloproteinase (MMP) family. Importantly, the extracellular space in anatomic arrangements
varies profoundly, such as in the basal lamina between myelinated axons or thin fibrous ECM of
the blood vessel basement membranes (Brown, 2011). This indicates the presence of more than
one matrix ligand and potentially separate mechanisms for invasion, further complicating the
mode of action in translocation of neoplastic cells through host ECM barriers. Finally, a change of
cell shape and volume, is necessitated for migration through the narrow spaces formed from
degradation of the ECM (Kim et al., 2004). This shape shifting ability is mediated via ion flow such
as Cl-, K+ and their respective volume-regulated ion channels (Kim et al., 2004). The ability to
perform all three steps sequentially allows invasive cells to penetrate areas that would otherwise
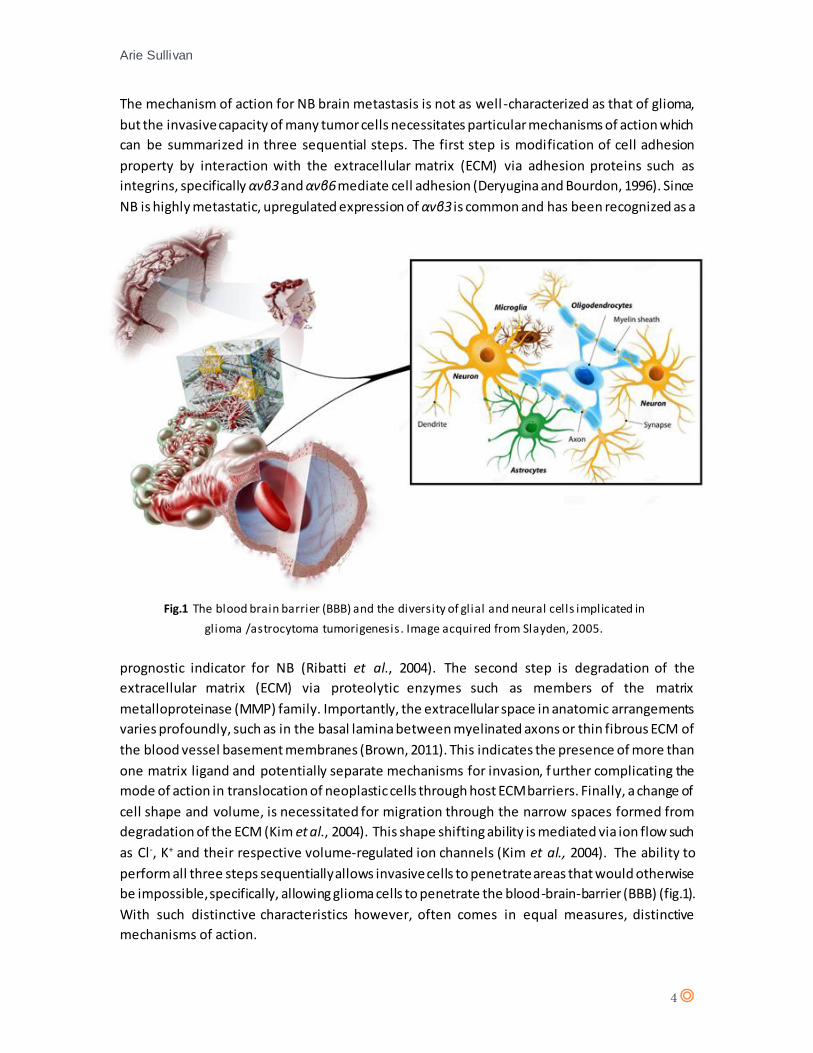
be impossible, specifically, allowing glioma cells to penetrate the blood-brain-barrier (BBB) (fig.1).
With such distinctive characteristics however, often comes in equal measures, distinctive
mechanisms of action.
Fig.1 The blood brain barrier (BBB) and the diversity of glial and neural cells implicated in
glioma /astrocytoma tumorigenesis. Image acquired from Slayden, 2005.
Arie Sullivan
5
Venoms as therapeutics
The first use of scorpion venom as a drug can be traced back to almost 2000 years in China, in
treating apoplexy, epilepsy, spasm, migraines, tetanus and pyocutaneous amongst more (Fan et
al., 2010). Interestingly, these diseases are nowadays categorized as channelopathies, implying
the active component is a key regulator of ion channels (Zhijian et al., 2006; Goudet et al., 2002).
Various other venoms isolated from a number of species have been hailed as possessing
antiproliferative, cytotoxic, apoptogenic, and immunosuppressive properties. They have been
recognized as a rich source for numerous bioactive compounds possessing therapeutic potentials
like enzyme and non-enzyme proteins, ions, free amino acids, and other organic and inorganic
substances.
Studies on the mode of action of cardiotoxin III, isolated from Naja naja atra snake venom, in
human colorectal cancer (colo205) revealed apoptosis induction, confirmed by DNA
fragmentation (Tsai et al., 2006). Spider venom isolated from Macrothele raven has been reported
to affect cell viability in a dose-dependent manner and induce apoptosis and necrosis in breast
cancer (MCF7) cells (Gao et al., 2007). A number of scorpion venom components have been
known to mediate cell proliferation, cell growth and cell cycle (Das Gupta et al., 2007). Specifically,
venom from the scorpion Odontobuthus doriae has been shown to decrease cell viability, induce
reactive nitrogen intermediates, depolarize mitochondria membranes and increase caspase-3
activity and thus, apoptosis in human neuroblastoma (SHSY5Y) cells (Zargan et al., 2011).
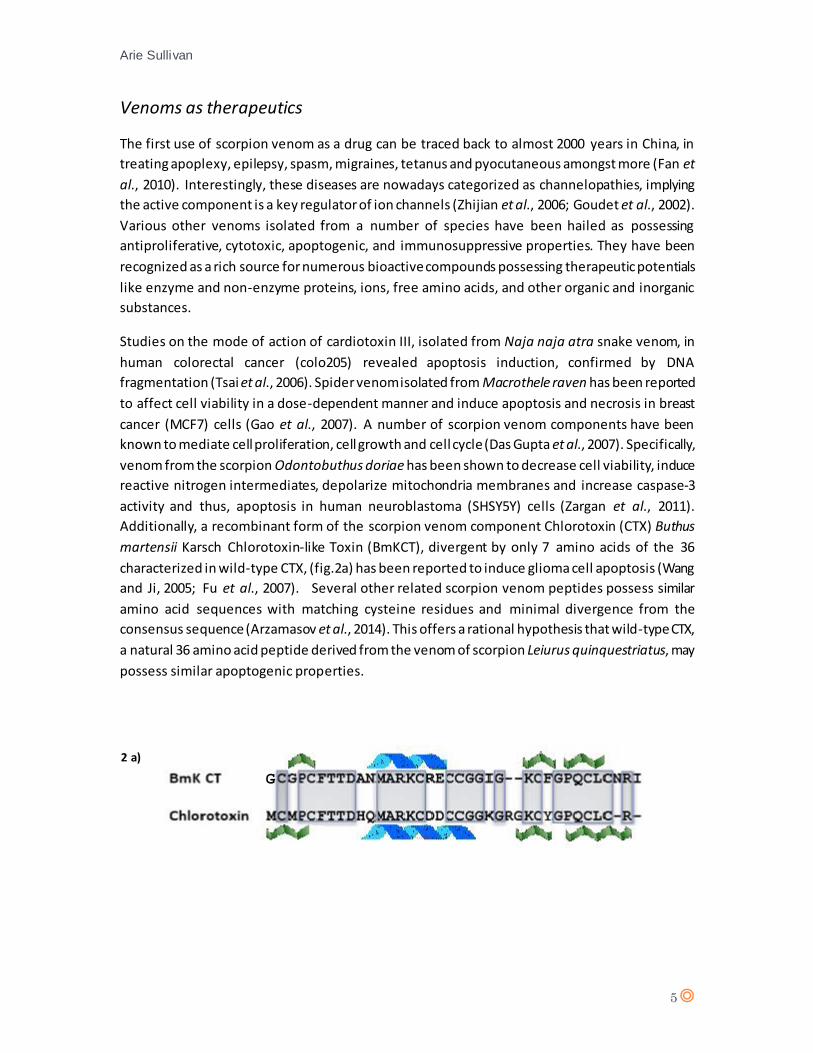
Additionally, a recombinant form of the scorpion venom component Chlorotoxin (CTX) Buthus
martensii Karsch Chlorotoxin-like Toxin (BmKCT), divergent by only 7 amino acids of the 36
characterized in wild-type CTX, (fig.2a) has been reported to induce glioma cell apoptosis (Wang
and Ji, 2005; Fu et al., 2007). Several other related scorpion venom peptides possess similar
amino acid sequences with matching cysteine residues and minimal divergence from the
consensus sequence (Arzamasov et al., 2014). This offers a rational hypothesis that wild-type CTX,
a natural 36 amino acid peptide derived from the venom of scorpion Leiurus quinquestriatus, may
possess similar apoptogenic properties.
2 a)
G
Arie Sullivan
6
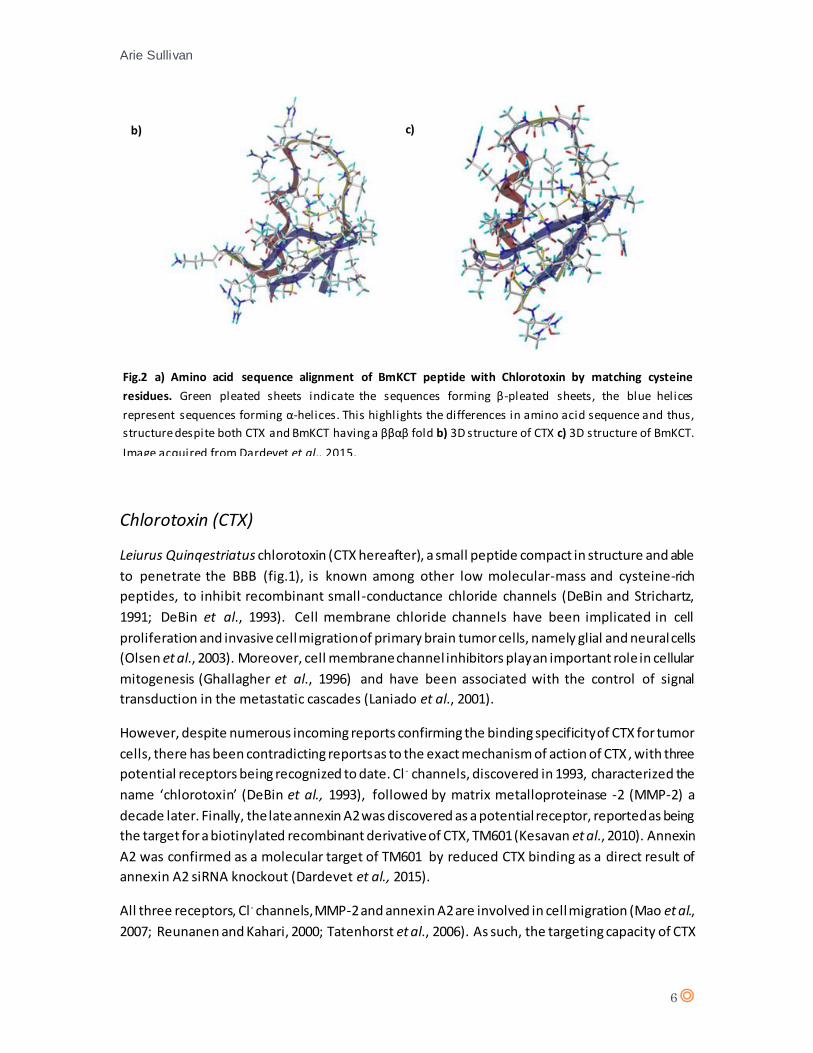
Fig.2 a) Amino acid sequence alignment of BmKCT peptide with Chlorotoxin by matching cysteine
residues. Green pleated sheets indicate the sequences forming β-pleated sheets, the blue helices
represent sequences forming α-helices. This highlights the differences in amino acid sequence and thus,
structure despite both CTX and BmKCT having a ββαβ fold b) 3D structure of CTX c) 3D structure of BmKCT.
Image acquired from Dardevet et al., 2015.
Chlorotoxin (CTX)
Leiurus Quinqestriatus chlorotoxin (CTX hereafter), a small peptide compact in structure and able
to penetrate the BBB (fig.1), is known among other low molecular-mass and cysteine-rich
peptides, to inhibit recombinant small-conductance chloride channels (DeBin and Strichartz,
1991; DeBin et al., 1993). Cell membrane chloride channels have been implicated in cell
proliferation and invasive cell migration of primary brain tumor cells, namely glial and neural cells
(Olsen et al., 2003). Moreover, cell membrane channel inhibitors play an important role in cellular
mitogenesis (Ghallagher et al., 1996) and have been associated with the control of signal
transduction in the metastatic cascades (Laniado et al., 2001).
However, despite numerous incoming reports confirming the binding specificity of CTX for tumor
cells, there has been contradicting reports as to the exact mechanism of action of CTX, with three
potential receptors being recognized to date. Cl - channels, discovered in 1993, characterized the
name ‘chlorotoxin’ (DeBin et al., 1993), followed by matrix metalloproteinase -2 (MMP-2) a
decade later. Finally, the late annexin A2 was discovered as a potential receptor, reported as being
the target for a biotinylated recombinant derivative of CTX, TM601 (Kesavan et al., 2010). Annexin
A2 was confirmed as a molecular target of TM601 by reduced CTX binding as a direct result of
annexin A2 siRNA knockout (Dardevet et al., 2015).
All three receptors, Cl - channels, MMP-2 and annexin A2 are involved in cell migration (Mao et al.,
2007; Reunanen and Kahari, 2000; Tatenhorst et al., 2006). As such, the targeting capacity of CTX
b) c)
Arie Sullivan
7
has been coupled to migrating cancer cells, namely gliomas, melanomas, small cell lung
carcinomas, neuroblastomas, ganglioneuromas, adrenal pheochromocytomas,
medulloblastomas and Ewings’s sarcomas (Lyons et al., 2002). CTX has been demonstrated as a
highly specific marker for these selected tumors in biopsy tissues, frequently associating CTX with
the term ‘tumor paint’ (Butte et al., 2014). However, deciphering the exact mechanism of action
that allows such specific targeting to tumor cells has been met with difficulty since the potential
characterized CTX targets are associated with the migratory capacity of cells, primarily known to
inhibit cell migration. Although it is the constituents involved in the invasive facet of malignant
cells that are recognized as the principal target for CTX, expression of membrane proteins involved
in cell migration is not limited to malignant cells. Cell migration is a natural mechanism vital for
embryonic development and tissue repair, and the potential target receptors for CTX are not only
expressed in highly invasive tumor cells, but also in healthy migratory cell lines such as human
keratinocyte (HaCaT). Thus, despite receptors such as MMP-2, CL- ion channels and annexin A2
having altered expression in selected malignant invasive tumor cells, these do not form an
absolute marker for these cells, and non-specific CTX binding remains a potential concern
necessitating further investigation.
Chlorotoxin as ‘tumor paint’
Migratory neural stem cells and neoplastic cells of neuroectodermal origin, including sensory,
sympathoadrenal, enteric and parasympathetic neurons of the peripheral nervous system,
Schwann cells, melanocytes and endocrine cells all share a common embryonic origin. Similarly,
these share genetic and antigenic phenotypes with gliomas (Lyons et al., 2002). This suggests that
CTX’s specificity as a marker for gliomas may extend to other tumor cells of neuroectodermal
origin. Indeed, histochemical staining of human biopsy tissues demonstrated binding of CTX at a
rate of 90% CTX positive cells in each section, extending to peripheral neuroectodermal tumors
as well as gliomas (Lyons et al., 2002). This ‘tumor painting’ capacity of CTX has provided surgeons
with unprecedented, real-time biophotonic information clearly defining tumor margins and
associated cancer cells (Stroud et al., 2012). Beyond the ‘tumor painting’ ability of CTX via
membrane receptor binding, lies the consequential intracellular signaling partly defining the
‘mechanism of action’ of CTX.
Chloride ion channels
Plasma membrane anion chloride channels are implicated in a number of functions, including
control of excitability in neuron and muscle, cell volume regulation, transepithelial transport and
sensory transduction (Hartzell et al., 2005). Thus far, three classes of structures have been
identified, voltage-gated ion channels (VGIC), postsynaptic Cl - channels; the cystic fibrosis
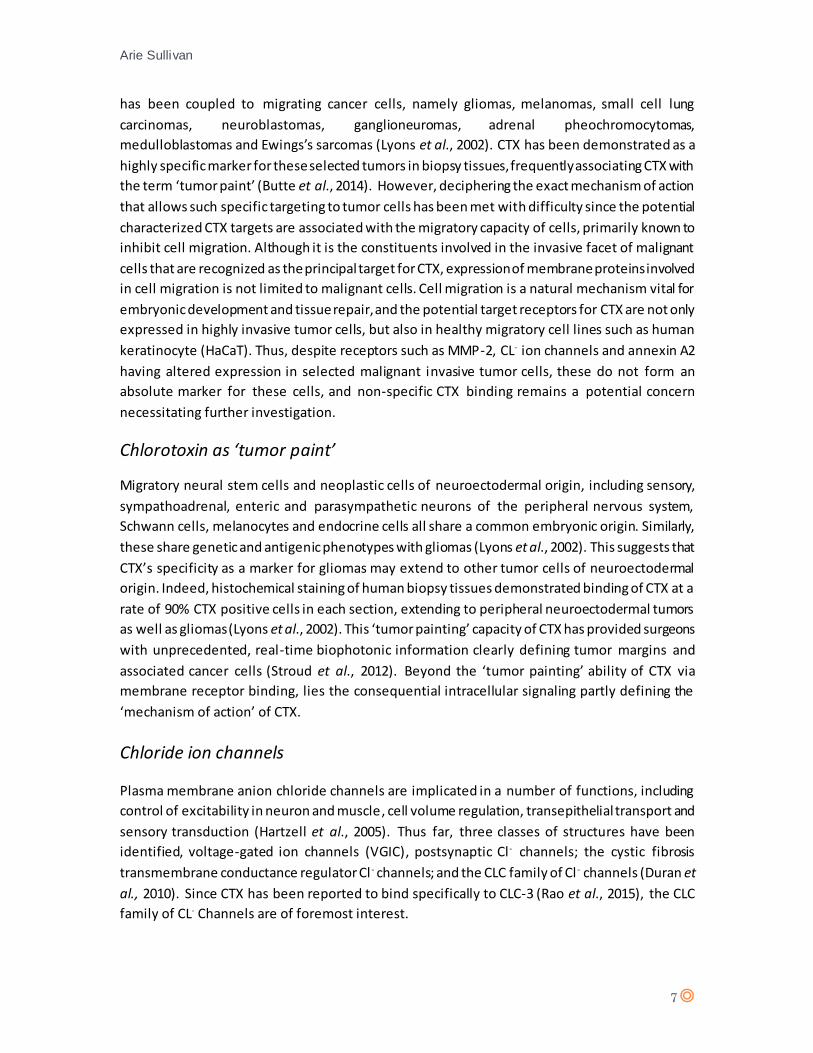
transmembrane conductance regulator Cl - channels; and the CLC family of Cl - channels (Duran et
al., 2010). Since CTX has been reported to bind specifically to CLC-3 (Rao et al., 2015), the CLC
family of CL- Channels are of foremost interest.
Arie Sullivan
8
Fig.3 CLC chloride anion channel a) 3D structure of CLC channel b) mechanism of action of CLC channel.
Images acquired from OPM database and Lisal and Maduke, 2009 respectively.
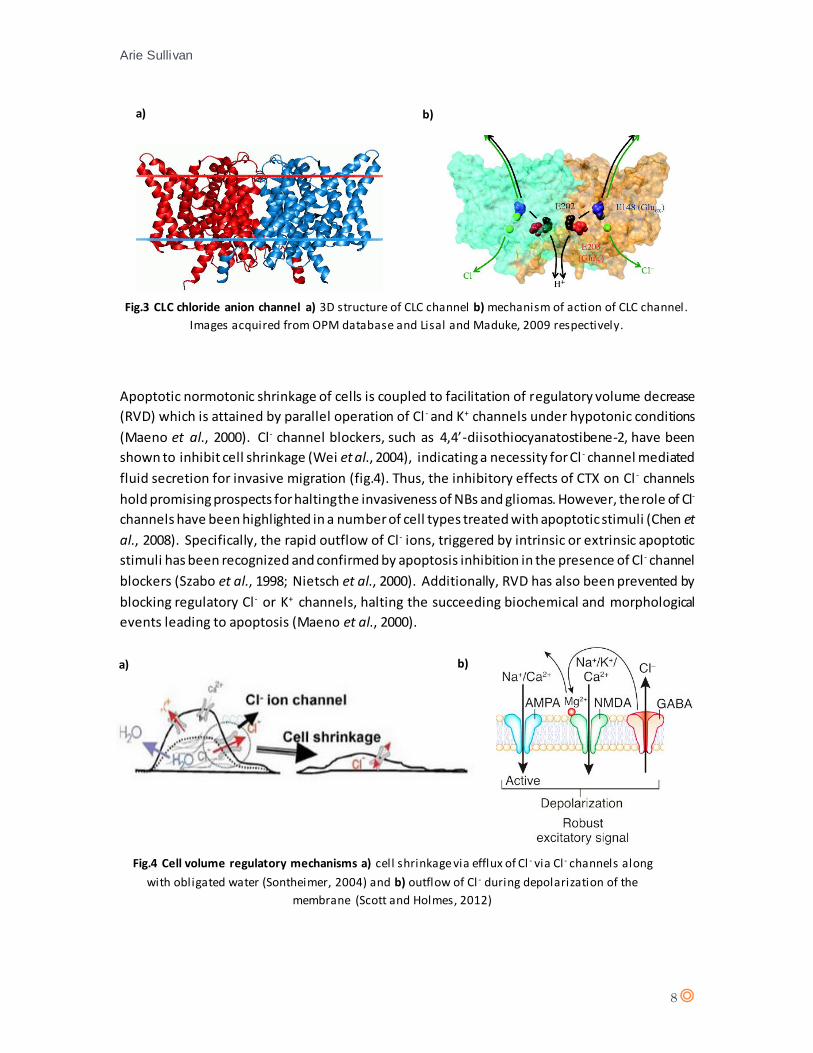
Apoptotic normotonic shrinkage of cells is coupled to facilitation of regulatory volume decrease
(RVD) which is attained by parallel operation of Cl - and K+ channels under hypotonic conditions
(Maeno et al., 2000). Cl- channel blockers, such as 4,4’-diisothiocyanatostibene-2, have been
shown to inhibit cell shrinkage (Wei et al., 2004), indicating a necessity for Cl - channel mediated
fluid secretion for invasive migration (fig.4). Thus, the inhibitory effects of CTX on Cl - channels
hold promising prospects for halting the invasiveness of NBs and gliomas. However, the role of Cl-
channels have been highlighted in a number of cell types treated with apoptotic stimuli (Chen et
al., 2008). Specifically, the rapid outflow of Cl - ions, triggered by intrinsic or extrinsic apoptotic
stimuli has been recognized and confirmed by apoptosis inhibition in the presence of Cl - channel
blockers (Szabo et al., 1998; Nietsch et al., 2000). Additionally, RVD has also been prevented by
blocking regulatory Cl - or K+ channels, halting the succeeding biochemical and morphological
events leading to apoptosis (Maeno et al., 2000).
Fig.4 Cell volume regulatory mechanisms a) cell shrinkage via efflux of Cl - via Cl - channels along
with obligated water (Sontheimer, 2004) and b) outflow of Cl - during depolarization of the
membrane (Scott and Holmes, 2012)
a) b)
a) b)
Arie Sullivan
9
As well as depolarization of the mitochondrial membrane during apoptosis, depolarization of the
plasma membrane (PM) has been reported in a number of papers investigating apoptosis (Nolte
et al., 2004; Mann et al., 2001). Moreover, a correlation between modulation of the membrane
potential and protection against apoptosis has been demonstrated (Nuccitelli et al., 2006),
suggesting a protective mechanism from apoptosis by preventing depolarization of the PM.
Despite additional research being necessitated to establish the exact association between
apoptosis and depolarization of the PM, these reports, at least in part, confirm the implication of
ion channels in the apoptotic process. A further complication is the overexpression of CIC-3
chloride channels in glioma that facilitate outward rectifying currents overwhelm CIC-2 channels
that facilitate inward rectifying currents, causing a net outflow of Cl - and subsequently,
depolarization of the PM (Olsen et al., 2003). Since depolarization of the PM is a necessity to pass
the G2/M checkpoint in the cell cycle (Blackiston et al., 2009), overexpression of CIC-3 channels
strongly favors cell proliferation.
Since CTX has been reported to induce apoptosis (Cheng et al., 2014) and Cl- channels are a
recognized target for CTX, it is perhaps not surprising that there exists contradicting reports as to
the mode of action of CTX. With reports claiming the induction of apoptosis by recombinant CTX,
BmKCT; and Cl- channels being well-characterized receptors for CTX, the claim of apoptosis
induction by CTX when considered alongside reports of CTX Cl - channel inhibition, prompts a need
for further investigation. Further complicating matters, a study by Maertens et al. (2009) revealed
no detection of any change in whole-cell membrane currents by EPC-7 patch clamp amplifier post
CTX treatment, leading to a claim that CTX does not inhibit Cl- channels.
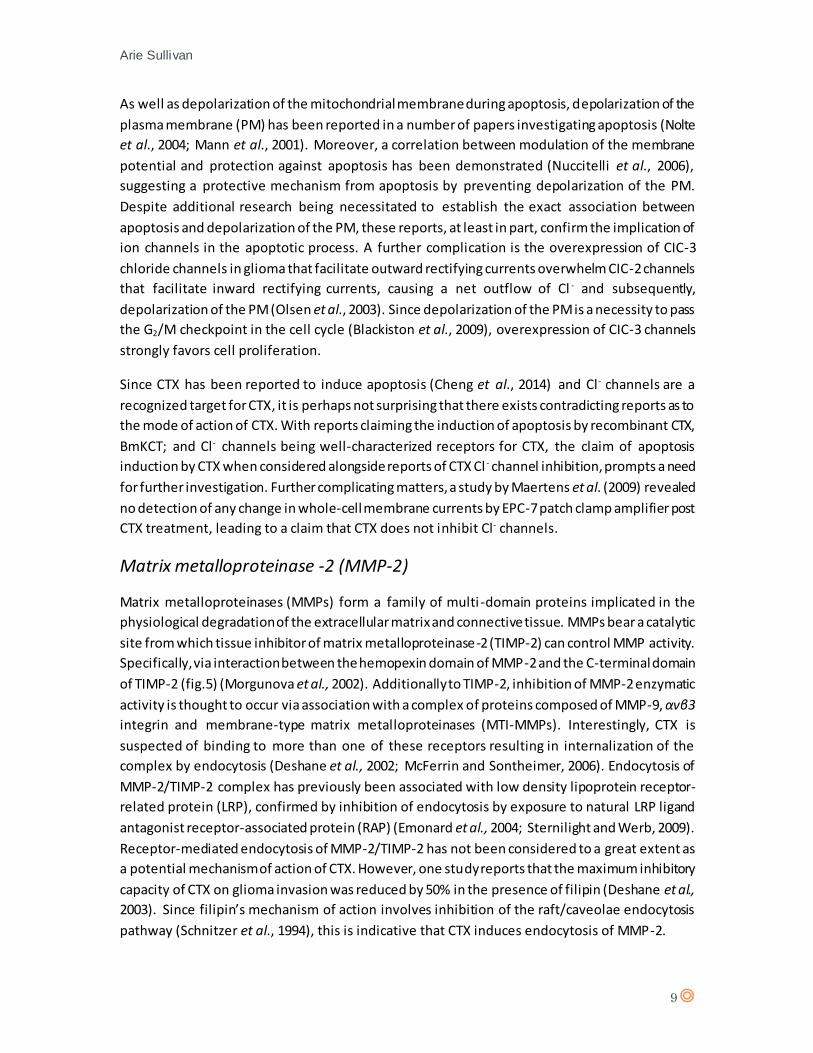
Matrix metalloproteinase -2 (MMP-2)
Matrix metalloproteinases (MMPs) form a family of multi -domain proteins implicated in the
physiological degradation of the extracellular matrix and connective tissue. MMPs bear a catalytic
site from which tissue inhibitor of matrix metalloproteinase-2 (TIMP-2) can control MMP activity.
Specifically, via interaction between the hemopexin domain of MMP-2 and the C-terminal domain
of TIMP-2 (fig.5) (Morgunova et al., 2002). Additionally to TIMP-2, inhibition of MMP-2 enzymatic
activity is thought to occur via association with a complex of proteins composed of MMP-9, αvβ3
integrin and membrane-type matrix metalloproteinases (MTI-MMPs). Interestingly, CTX is
suspected of binding to more than one of these receptors resulting in internalization of the
complex by endocytosis (Deshane et al., 2002; McFerrin and Sontheimer, 2006). Endocytosis of
MMP-2/TIMP-2 complex has previously been associated with low density lipoprotein receptor-
related protein (LRP), confirmed by inhibition of endocytosis by exposure to natural LRP ligand
antagonist receptor-associated protein (RAP) (Emonard et al., 2004; Sternilight and Werb, 2009).
Receptor-mediated endocytosis of MMP-2/TIMP-2 has not been considered to a great extent as
a potential mechanism of action of CTX. However, one study reports that the maximum inhibitory
capacity of CTX on glioma invasion was reduced by 50% in the presence of filipin (Deshane et al.,
2003). Since filipin’s mechanism of action involves inhibition of the raft/caveolae endocytosis
pathway (Schnitzer et al., 1994), this is indicative that CTX induces endocytosis of MMP-2.
Arie Sullivan
10
a)
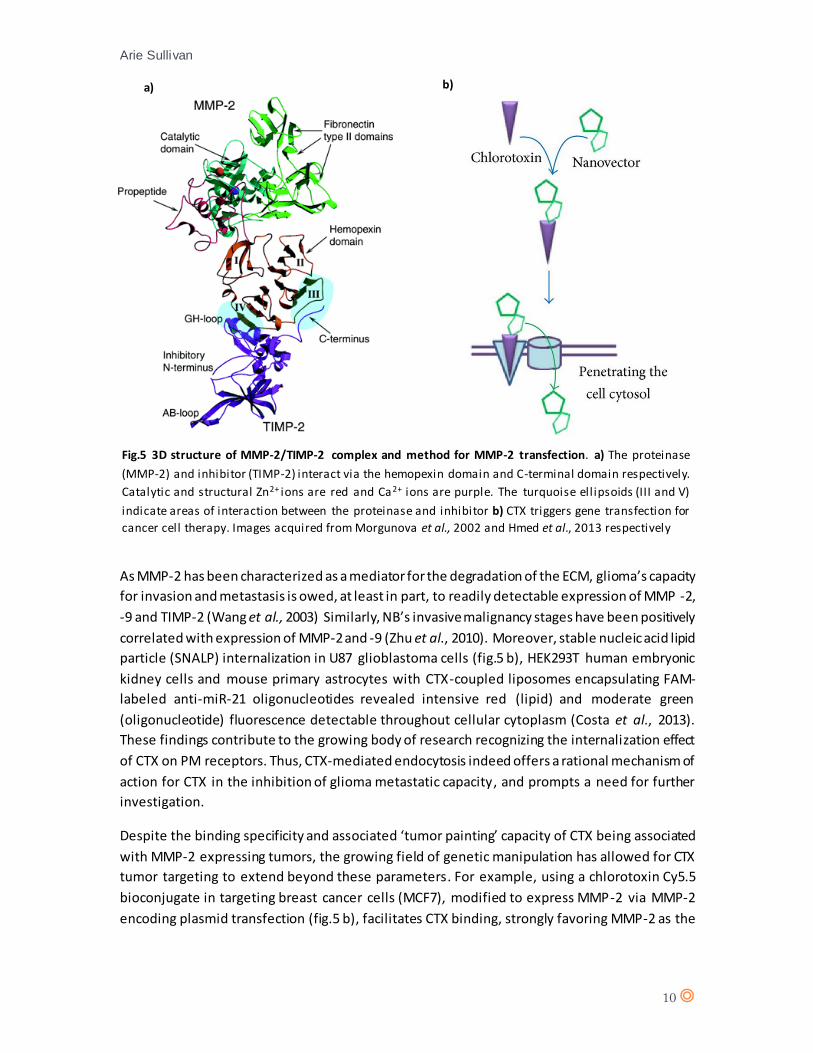
As MMP-2 has been characterized as a mediator for the degradation of the ECM, glioma’s capacity
for invasion and metastasis is owed, at least in part, to readily detectable expression of MMP -2,
-9 and TIMP-2 (Wang et al., 2003) Similarly, NB’s invasive malignancy stages have been positively
correlated with expression of MMP-2 and -9 (Zhu et al., 2010). Moreover, stable nucleic acid lipid
particle (SNALP) internalization in U87 glioblastoma cells (fig.5 b), HEK293T human embryonic
kidney cells and mouse primary astrocytes with CTX-coupled liposomes encapsulating FAM-
labeled anti-miR-21 oligonucleotides revealed intensive red (lipid) and moderate green
(oligonucleotide) fluorescence detectable throughout cellular cytoplasm (Costa et al., 2013).
These findings contribute to the growing body of research recognizing the internalization effect
of CTX on PM receptors. Thus, CTX-mediated endocytosis indeed offers a rational mechanism of
action for CTX in the inhibition of glioma metastatic capacity, and prompts a need for further
investigation.
Despite the binding specificity and associated ‘tumor painting’ capacity of CTX being associated
with MMP-2 expressing tumors, the growing field of genetic manipulation has allowed for CTX
tumor targeting to extend beyond these parameters. For example, using a chlorotoxin Cy5.5
bioconjugate in targeting breast cancer cells (MCF7), modified to express MMP-2 via MMP-2
encoding plasmid transfection (fig.5 b), facilitates CTX binding, strongly favoring MMP-2 as the
Fig.5 3D structure of MMP-2/TIMP-2 complex and method for MMP-2 transfection. a) The proteinase
(MMP-2) and inhibitor (TIMP-2) interact via the hemopexin domain and C-terminal domain respectively.
Catalytic and structural Zn2+ ions are red and Ca2+ ions are purple. The turquoise ell ipsoids (III and V)
indicate areas of interaction between the proteinase and inhibitor b) CTX triggers gene transfection for
cancer cell therapy. Images acquired from Morgunova et al., 2002 and Hmed et al., 2013 respectively
b)
Arie Sullivan
11
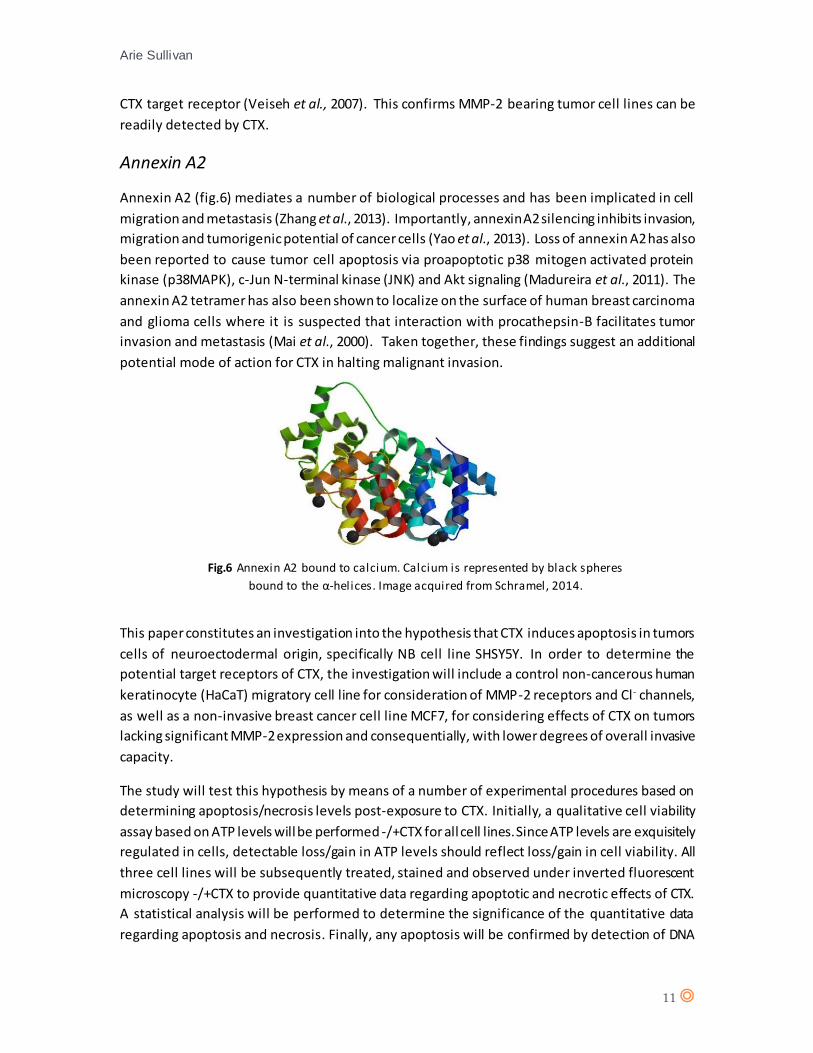
Fig.6 Annexin A2 bound to calcium. Calcium is represented by black spheres
bound to the α-helices. Image acquired from Schramel, 2014.
CTX target receptor (Veiseh et al., 2007). This confirms MMP-2 bearing tumor cell lines can be
readily detected by CTX.
Annexin A2
Annexin A2 (fig.6) mediates a number of biological processes and has been implicated in cell
migration and metastasis (Zhang et al., 2013). Importantly, annexin A2 silencing inhibits invasion,
migration and tumorigenic potential of cancer cells (Yao et al., 2013). Loss of annexin A2 has also
been reported to cause tumor cell apoptosis via proapoptotic p38 mitogen activated protein
kinase (p38MAPK), c-Jun N-terminal kinase (JNK) and Akt signaling (Madureira et al., 2011). The
annexin A2 tetramer has also been shown to localize on the surface of human breast carcinoma
and glioma cells where it is suspected that interaction with procathepsin-B facilitates tumor
invasion and metastasis (Mai et al., 2000). Taken together, these findings suggest an additional
potential mode of action for CTX in halting malignant invasion.
This paper constitutes an investigation into the hypothesis that CTX induces apoptosis in tumors
cells of neuroectodermal origin, specifically NB cell line SHSY5Y. In order to determine the
potential target receptors of CTX, the investigation will include a control non-cancerous human
keratinocyte (HaCaT) migratory cell line for consideration of MMP-2 receptors and Cl- channels,
as well as a non-invasive breast cancer cell line MCF7, for considering effects of CTX on tumors
lacking significant MMP-2 expression and consequentially, with lower degrees of overall invasive
capacity.
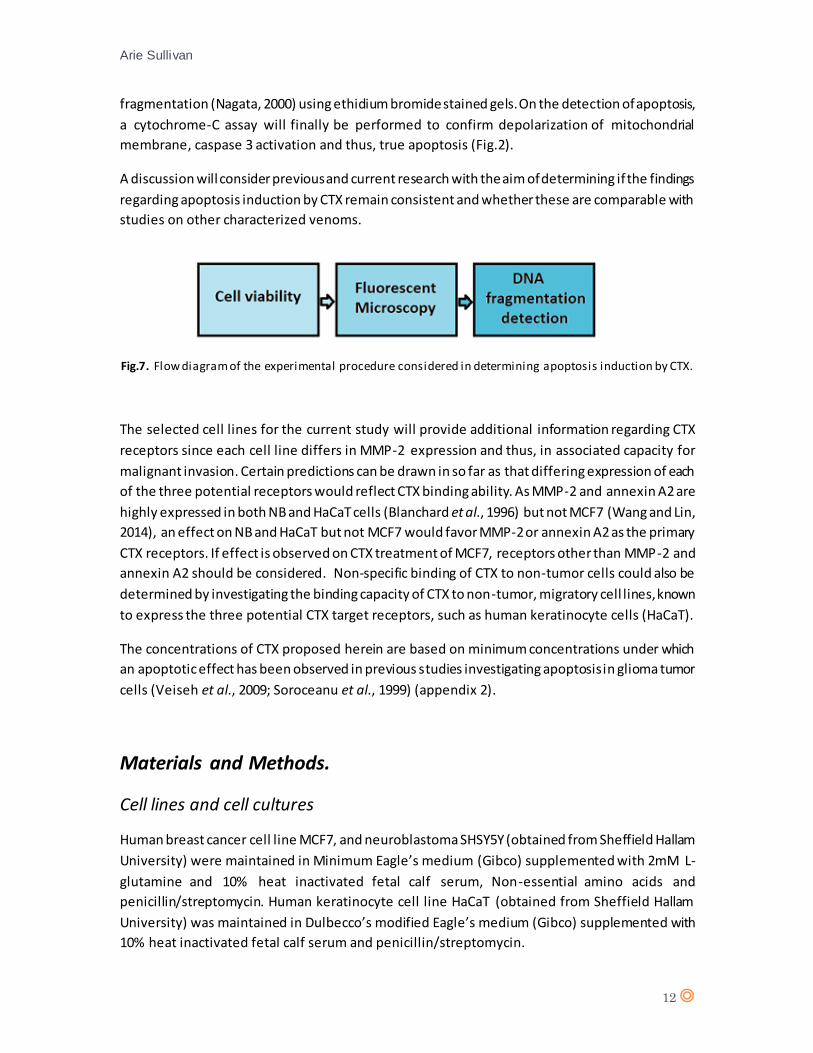
The study will test this hypothesis by means of a number of experimental procedures based on
determining apoptosis/necrosis levels post-exposure to CTX. Initially, a qualitative cell viability
assay based on ATP levels will be performed -/+CTX for all cell lines. Since ATP levels are exquisitely
regulated in cells, detectable loss/gain in ATP levels should reflect loss/gain in cell viability. All
three cell lines will be subsequently treated, stained and observed under inverted fluorescent
microscopy -/+CTX to provide quantitative data regarding apoptotic and necrotic effects of CTX.
A statistical analysis will be performed to determine the significance of the quantitative data
regarding apoptosis and necrosis. Finally, any apoptosis will be confirmed by detection of DNA
Arie Sullivan
12
fragmentation (Nagata, 2000) using ethidium bromide stained gels. On the detection of apoptosis,
a cytochrome-C assay will finally be performed to confirm depolarization of mitochondrial
membrane, caspase 3 activation and thus, true apoptosis (Fig.2).
A discussion will consider previous and current research with the aim of determining if the findings
regarding apoptosis induction by CTX remain consistent and whether these are comparable with
studies on other characterized venoms.
The selected cell lines for the current study will provide additional information regarding CTX
receptors since each cell line differs in MMP-2 expression and thus, in associated capacity for
malignant invasion. Certain predictions can be drawn in so far as that differing expression of each
of the three potential receptors would reflect CTX binding ability. As MMP-2 and annexin A2 are
highly expressed in both NB and HaCaT cells (Blanchard et al., 1996) but not MCF7 (Wang and Lin,
2014), an effect on NB and HaCaT but not MCF7 would favor MMP-2 or annexin A2 as the primary
CTX receptors. If effect is observed on CTX treatment of MCF7, receptors other than MMP-2 and
annexin A2 should be considered. Non-specific binding of CTX to non-tumor cells could also be
determined by investigating the binding capacity of CTX to non-tumor, migratory cell lines, known
to express the three potential CTX target receptors, such as human keratinocyte cells (HaCaT).
The concentrations of CTX proposed herein are based on minimum concentrations under which
an apoptotic effect has been observed in previous studies investigating apoptosis in glioma tumor
cells (Veiseh et al., 2009; Soroceanu et al., 1999) (appendix 2).
Materials and Methods.
Cell lines and cell cultures
Human breast cancer cell line MCF7, and neuroblastoma SHSY5Y (obtained from Sheffield Hallam
University) were maintained in Minimum Eagle’s medium (Gibco) supplemented with 2mM L-
glutamine and 10% heat inactivated fetal calf serum, Non-essential amino acids and
penicillin/streptomycin. Human keratinocyte cell line HaCaT (obtained from Sheffield Hallam
University) was maintained in Dulbecco’s modified Eagle’s medium (Gibco) supplemented with
10% heat inactivated fetal calf serum and penicillin/streptomycin.
Fig.7. Flow diagram of the experimental procedure considered in determining apoptosis induction by CTX.
Arie Sullivan
13
Reagents
All reagents used herein are purchased from Sigma™ unless otherwise stated. CellTiterGlo™ kit
was purchased from Promega™. DNA Ladder Detection kit was purchased from Abcam™.
Chlorotoxin was supplied by the Peptide Institute, Inc.
Bicinchoninic acid (BCA) assay
2mL of bovine serum albumin (BSA) was prepared at a concentration of 2mg/mL and frozen in
100µL aliquots. 10mL of 4% CuSO4 solution was then prepared and stored at 4°C. 60µL of 4%
CuSO4 solution was added to 3mL of BCA stock solution to make a working BCA solution. Two
100µL BSA aliquots (2mg/mL) were thawed and used to prepare five BSA standards ranging from
125, 250, 500, 1000 to 2000mg/mL. 20µL of each BSA standard was sequentially transferred to a
96-well plate in triplicates, followed by the addition of 200µL of the working solution to each well
containing BSA standards. The plate was covered and incubated at room temperature for 45
minutes. The absorbance was subsequently read in a spectrophotometer set at a wavelength of
570nM.
Cell viability assay -/+CTX
A cell viability assay without CTX was performed using Breast cancer cells (MCF7) neuroblastoma
cells (SHSY5Y) and human keratinocyte cells (HaCaT) to generate standard curves and determine
optimum concentration of cells to be used for subsequent assays +CTX. The capacity range of the
CellTiterGlo™ kit is from 0-50,000 cells/well in a 96-wellplate format, this was subsequently
confirmed by the plateau phase which occurs at approximately 40,000 cells/well for both cell lines
MCF7 and SHSY5Y. HaCaT generated a linear standard curve without a plateau phase for up to
50,000 cells. A concentration within the linear luminescence phase for all cell lines was
determined (20,000 cells/well), this will provide the largest variation in luminescence from loss of
cell viability.
An ATP standard curve was also generated for quality control of the viability assay. 1µM ATP was
prepared in culture medium. Ten fold dilutions of ATP were then prepared (1µM to 10nM). A 96-
well plate was sequentially loaded with the varying concenttrations of ATP. A volume of
CelTiterGlo™ reagent equal to the volume of ATP standards in each well was added and the
platewas shaken gently on an orbital shaker for 2 minutes. The plate was then incubated at room
temperature for 10 mimnutes to stabilize the luminescence signal and luminescence was
recorded using a Victor™ multiplate reader. The standard curve for ATP was inset to the cell
viability curves for each cell line (appendix 2a), b) and c)).
A cell viability assay with CTX was performed for MCF7, SHSY5Y, and HaCaT. Cell concentrations
(20,000 cells/well) within the luminescence linear phase of the cell viability assay -CTX (fig.2) were
prepared for both cell lines for optimum detection of change in luminescence. All cell lines were
plated out at 250µL on a 96-well format, with the outer wells containing PBS (appendix 4).
Arie Sullivan
14
Cells in three wells were lysed using CellLytic™ according to protocol for cell lines MCF7, HaCaT
and SHSY5Y and a BCA assay was performed to determine MCF7 and SHSY5Y cell concentration
relative to HaCaT cell concentration (20,000 cells/well) by determining total protein content in
mg.
Two concentrations of CTX (0.25mM and 0.025mM) were prepared from a stock CTX
concentration of 10mg/mL. 2.5µL of 0.25mM CTX was added to wells containing 250µL of cells in
media (20,000 cells/well) producing a 2.5µM CTX treatment. 2.5µL of 25µM was added to wells
containing 250µL of cells in media (20,000 cells/well) producing a 0.25µM CTX treatment. All
treatments were plated out in triplicates on a 96-well plate format for all three cell lines. A –ve
control was prepared by plating 250µL (20,000 cells/well) in 3 wells in triplicate for each cell line.
Luminescence was recorded at time 1 hour and 24 hours, and the results imported into a
Graphpad™ spreadsheet.
Fluorescent microscopy -/+CTX
A series of cell concentrations (31,250 cells/mL - 200,000 cells/mL) were prepared by serial 2-fold
dilutions and plated out (250µL/well) in a 96-well format. The plate was incubated for 24 hours at
37°C to allow cells to adhere. 10µL of Hoechst 33342 stain and 10µL of Propidium Iodide (PI) was
added to 1mL media for detection of live and dead cells respectively. A ll wells containing various
cell concentrations were stained with 10 µL of the prepared dye and incubated in the dark at room
temperature for 30 minutes. All wells were subsequently observed under fluorescent microscopy
to determine the optimum cell concentration for fluorescent microscopy +CTX.
The optimum cell concentration (80,000 cells/mL) was plated out (250µL) in triplicates for each
CTX dilution (2.5µM and 0.25µM) and one triplicate untreated to generate a –ve control, for
observation at time 1 and 24 hours. An additional triplicate was plated out for each cell line for a
BCA assay. The plate was incubated at 37°C for 24 hours to allow cells to adhere before being
treated with CTX. Two concentrations of CTX (0.25mM and 25µM) were prepared from a stock
CTX concentration of 10mg/mL as per above. 2.5µL of 0.25mM CTX was added to wells containing
250µL of cells in media (20,000 cells/well) producing a 2.5µM CTX treatment. 2.5µL of 25µM was
added to wells containing 250µL of cells in media (20,000 cells/well) producing a 0.25µM CTX
treatment. All wells were treated including –ve control. The plate was placed on an orbital shaker
and shaken gently for 10 minutes before returning to the incubator. A Hoechst 33342 and
Propidium Iodide stain was prepared as per above. Following 30 minutes incubation, 10µL of the
stain was added to each well, the plate was incubated in the dark at room temperature for further
30 minutes and all wells were subsequently observed directly under inverted fluorescent
microscopy after a total of 1 hour of exposure to CTX. A BCA assay was performed to compare cell
concentration for each cell line. The plate was returned to 37°C incubation and the process
repeated at time 24 hours. A statistical analysis was subsequently performed to determine the
apoptotic index for each time interval.
Arie Sullivan
15
DNA fragmentation detection -/+CTX
7 X 10⁵ cells for SHSY5Y, MCF7 and HaCaT were gently trypsinized and pelleted by centrifugation
at 1000rpm for 5 minutes. Cells were washed with PBS briefly and re-pelleted by centrifugation
at 1000rpm for 5 minutes, the supernatant was removed carefully using a pipette. Cells were then
lysed with 35µL TE (Tris-HCL/EDTA) buffer with gentle pipetting. 5µL Enzyme A solution was added
and the samples mixed by gentle vortex, all samples were then incubated at 37°C for 10 minutes.
5µL of Enzyme B solution was added to each sample and all samples were incubated at 50°C for
30 minutes. The salt concentration was raised to precipitate nucleic acids out of solution by adding
5µL of Ammonium Acetate Solution to each sample and vortexed to mix well. 50µL of Isopropanol
was added to each sample and vortexed to mix well and all samples were kept at -20°C for 10
minutes. All samples were then centrifuged for 10 minutes to precipitate DNA . All DNA sample’s
viscosity was reduced by passing samples through a 26.5G needle via an insulin syringe to facilitate
sample loading into the gel (Hagberg et al., 2000; Catalani et al., 2013). The electrophoresis tank
was filled with 1 X TAE buffer containing 0.5µg/mL ethidium bromide. The samples were then re-
suspended in DNA suspension buffer and loaded into wells of a 1.2% agarose gel containing
0.5µg/mL ethidium bromide (Fig.4). Electrophoresis was performed at 100V for 1 hour and the
gel visualized under UV and photographed.
7 X 10⁵ cells for SHSY5Y, MCF7 and HaCaT were suspended in 1mL of media and loaded into 3 rear
wells of a 6-well plate to generate a –ve control. 7 X 10⁵ cells for SHSY5Y, MCF7 and HaCaT were
suspended in 1mL of media in 1mL Eppendorf tubes and 1µL of 2.5mM CTX was added to each
tube, generating a final concentration of 2.5µM CTX treatment. All treated cells were placed in
the corresponding 3 front wells of the 6-well plate (appendix 5). The 6-well plate was incubate at
37°C for 24 hours.
Cells in three separate wells were lysed using CellLytic™ according to protocol for cell lines MCF7,
HaCaT and SHSY5Y and a BCA assay was performed to determine MCF7 and SHSY5Y cell
concentration relative to HaCaT cell concentration (700,000 cells/well) by determining total
protein content in mg.
Following incubation at 37°C for 24 hours, cells in all wells were washed in PBS, then gently
trypsinized, pelleted and re-suspended in media. All cells were placed in 1.5mL Eppendorf tubes.
All subsequent steps were followed as per the apoptosis DNA ladder detection protocol -CTX. All
samples were re-suspended in DNA suspension buffer and loaded into wells of a 1.2% agarose gel
containing 0.5µg/mL ethidium bromide. Each CTX-treated sample was loaded adjacent to the
corresponding control (Fig.6). Electrophoresis was performed at 100V for 1 hour and the gel
visualized under UV and photographed.
Arie Sullivan
16
Results.
BCA assay
A set of BSA dilutions (125, 250, 500, 1000 and 2000mg/mL) were prepared for a BCA assay to
generate a standard curve which will serve throughout this investigation to compare cell
concentrations plated out for various experiments by measuring differences in protein
concentration in mg/mL.
Cell viability assay -/+CTX
Initially, optimum cell concentrations to use for cell viability assays were determined by
measuring luminescence generated from serial dilutions of each cell line. This generated standard
curves (appendix 1) which reveal the linear phase of luminescence, thus, the optimum cell
concentration to use for subsequent assays +CTX was chosen within this linear phase, namely
20,000 cells. An ATP standard curve was also generated for quality control. It can be observed
that the highest relative light unit (RLU) value for HaCaT (416462) was significantly higher than
that of MCF7 (9127) and SHSY5Y (7175).
Following the calibration to determine optimum cell concentrations, a cell viability assay was
performed for all cell lines +CTX in which 20,000 cells were plated out per well in a 96-well format
(appendix 3). The cell concentrations plated out for each cell line were compared by BCA assay in
separate wells (appendix 5). The cell concentration was compared to that of the control HaCaT
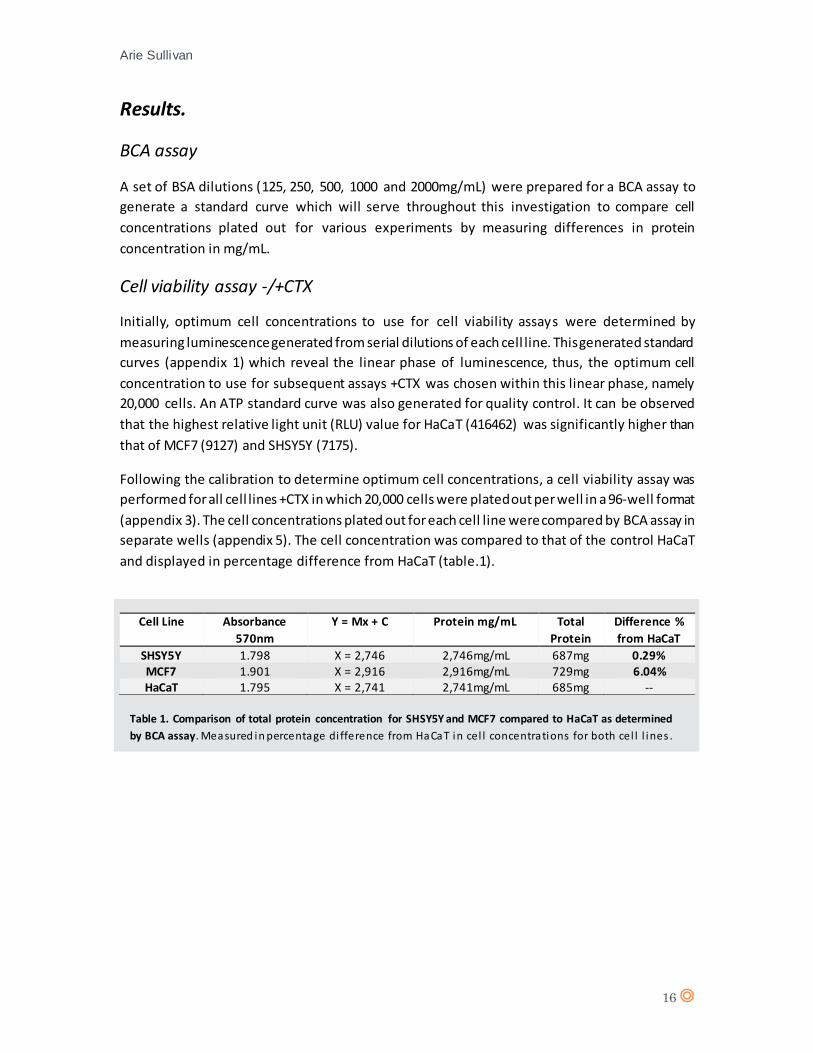
and displayed in percentage difference from HaCaT (table.1).
Cell Line Absorbance
570nm
Y = Mx + C Protein mg/mL Total
Protein
Difference %
from HaCaT
SHSY5Y 1.798 X = 2,746 2,746mg/mL 687mg 0.29% MCF7 1.901 X = 2,916 2,916mg/mL 729mg 6.04% HaCaT 1.795 X = 2,741 2,741mg/mL 685mg --
Table 1. Comparison of total protein concentration for SHSY5Y and MCF7 compared to HaCaT as determined
by BCA assay. Measured in percentage di fference from HaCaT in cel l concentrations for both cel l l ines .
Arie Sullivan
17
a)
b)
c)
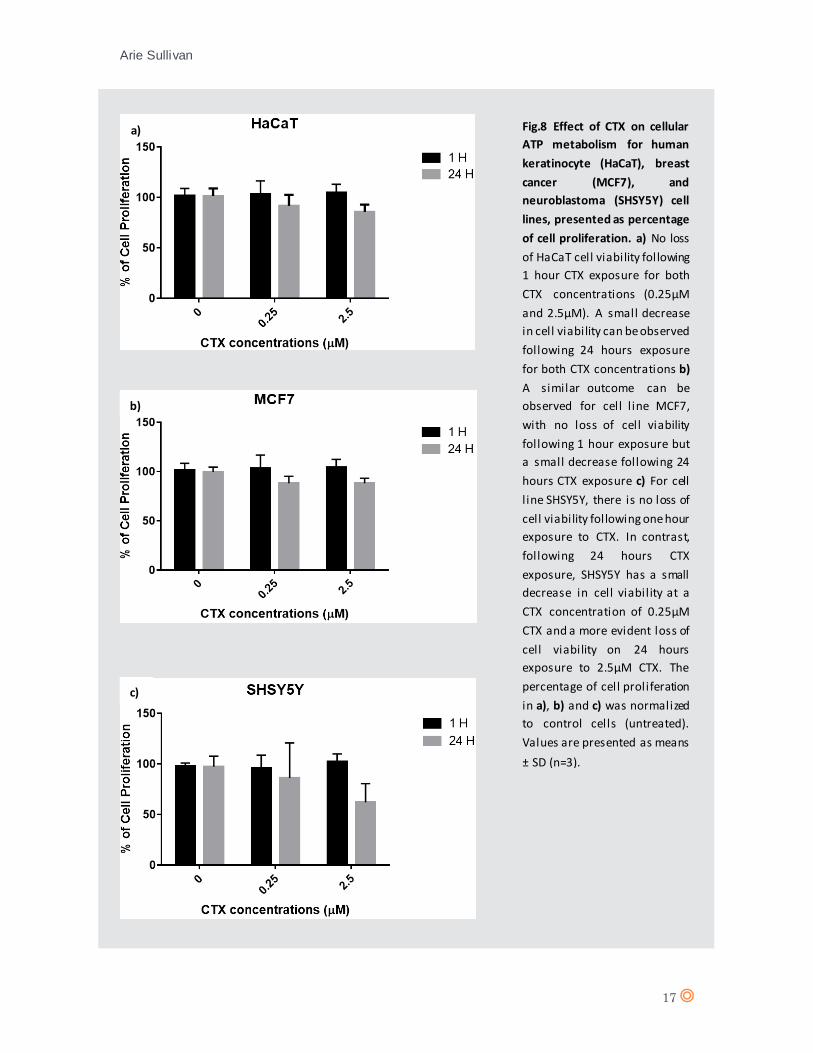
Fig.8 Effect of CTX on cellular
ATP metabolism for human
keratinocyte (HaCaT), breast
cancer (MCF7), and
neuroblastoma (SHSY5Y) cell
lines, presented as percentage
of cell proliferation. a) No loss
of HaCaT cell viability following
1 hour CTX exposure for both
CTX concentrations (0.25µM
and 2.5µM). A small decrease
in cell viability can be observed
following 24 hours exposure
for both CTX concentrations b)
A similar outcome can be
observed for cell l ine MCF7,
with no loss of cell viability
following 1 hour exposure but
a small decrease following 24
hours CTX exposure c) For cell
l ine SHSY5Y, there is no loss of
cell viability following one hour
exposure to CTX. In contrast,
following 24 hours CTX
exposure, SHSY5Y has a small
decrease in cell viability at a
CTX concentration of 0.25µM
CTX and a more evident loss of
cell viability on 24 hours
exposure to 2.5µM CTX. The
percentage of cell proliferation
in a), b) and c) was normalized
to control cells (untreated).
Values are presented as means
± SD (n=3).
Arie Sullivan
18
Fluorescent microscopy -/+CTX
An initial 500,000 cells/mL dilution was prepared from which serial 2-fold dilutions were
performed and plated out in a 96-well format. This will allow to determine optimum cell
concentration for observation of apoptosis and necrosis for all cell lines under inverted
fluorescence microscopy.
A level of necrosis can be observed beyond cell concentrations of 125,000 cells/mL (appendix 6),
thus, the optimum cell concentration for observing effects of CTX was selected at 80,000 cells/mL.
It should be noted that even in low concentrations, SHSY5Y shows a level of necrosis, this should
be taken into account when considering subsequent observations of CTX effects on SHSY5Y.
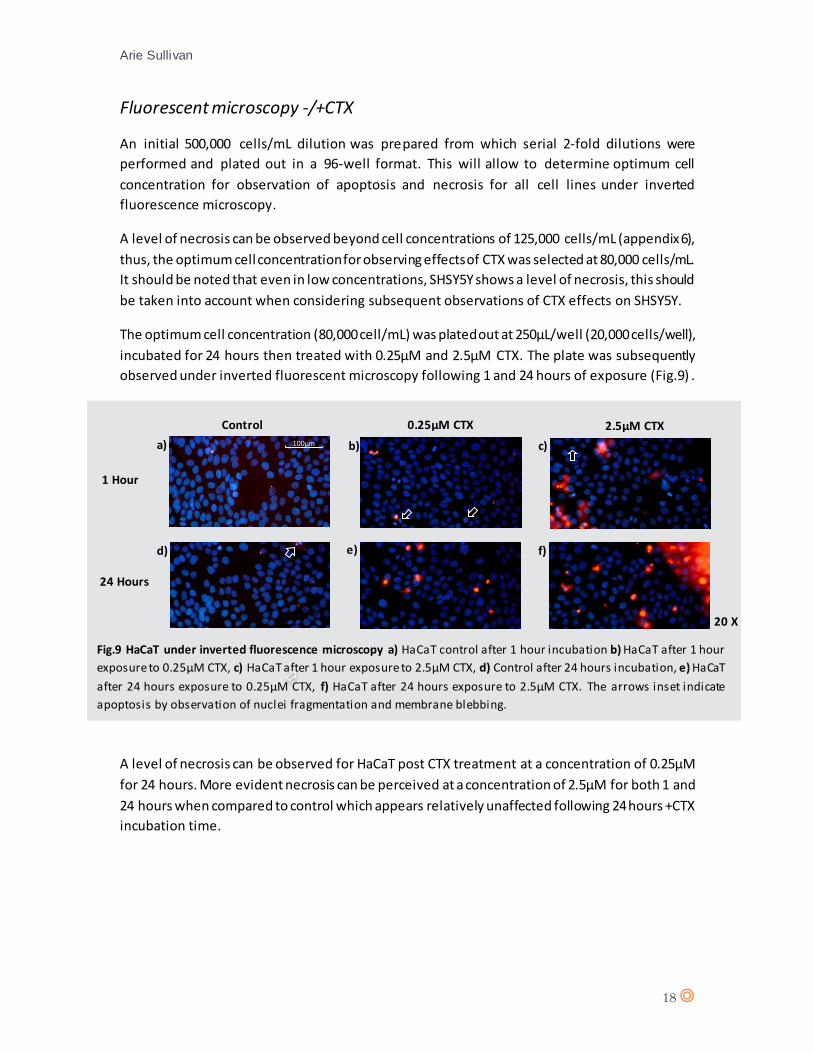
The optimum cell concentration (80,000 cell/mL) was plated out at 250µL/well (20,000 cells/well),
incubated for 24 hours then treated with 0.25µM and 2.5µM CTX. The plate was subsequently
observed under inverted fluorescent microscopy following 1 and 24 hours of exposure (Fig.9) .
A level of necrosis can be observed for HaCaT post CTX treatment at a concentration of 0.25µM
for 24 hours. More evident necrosis can be perceived at a concentration of 2.5µM for both 1 and
24 hours when compared to control which appears relatively unaffected following 24 hours +CTX
incubation time.
100µm
Control 0.25µM CTX 2.5µM CTX
1 Hour
24 Hours
20 X
a) b) c)
d) e) f)
Fig.9 HaCaT under inverted fluorescence microscopy a) HaCaT control after 1 hour incubation b) HaCaT after 1 hour
exposure to 0.25µM CTX, c) HaCaT after 1 hour exposure to 2.5µM CTX, d) Control after 24 hours incubation, e) HaCaT
after 24 hours exposure to 0.25µM CTX, f) HaCaT after 24 hours exposure to 2.5µM CTX. The arrows inset indicate
apoptosis by observation of nuclei fragmentation and membrane blebbing.
100µm
Arie Sullivan
19
1 Hour
a) b
)
c)
d) e) f)
b)
a) b) c)
d) e) f)
1 Hour
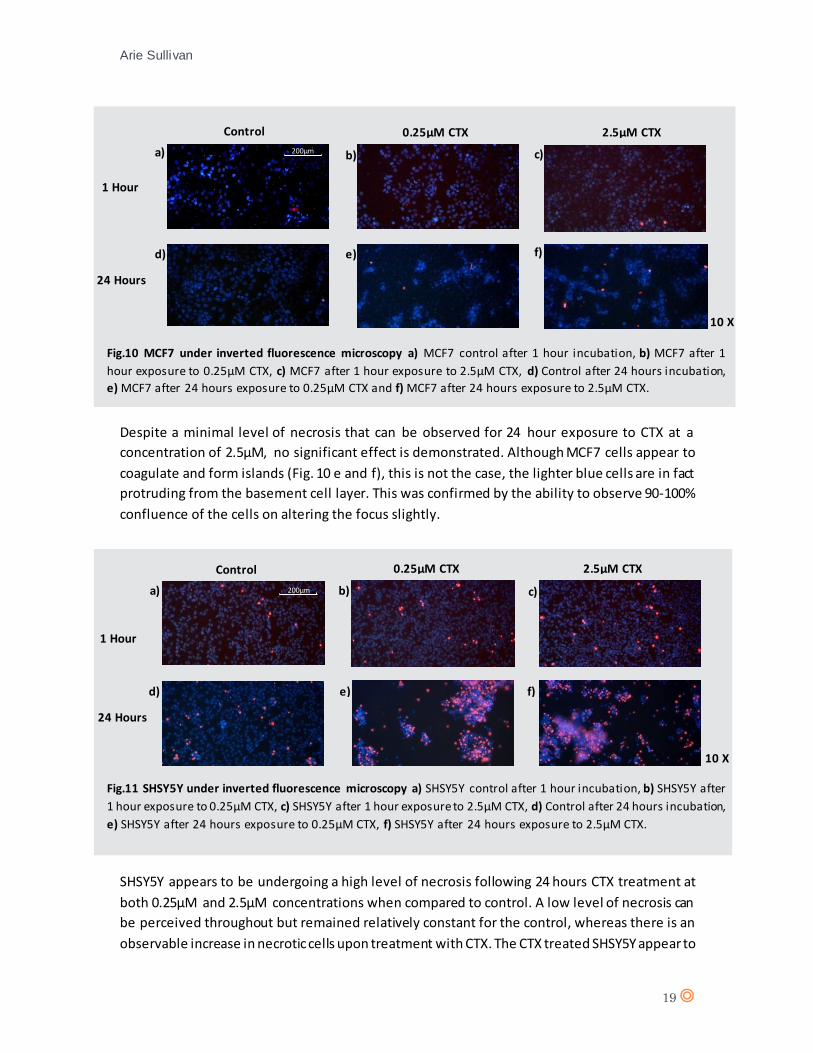
Despite a minimal level of necrosis that can be observed for 24 hour exposure to CTX at a
concentration of 2.5µM, no significant effect is demonstrated. Although MCF7 cells appear to
coagulate and form islands (Fig. 10 e and f), this is not the case, the lighter blue cells are in fact
protruding from the basement cell layer. This was confirmed by the ability to observe 90-100%
confluence of the cells on altering the focus slightly.
SHSY5Y appears to be undergoing a high level of necrosis following 24 hours CTX treatment at
both 0.25µM and 2.5µM concentrations when compared to control. A low level of necrosis can
be perceived throughout but remained relatively constant for the control, whereas there is an
observable increase in necrotic cells upon treatment with CTX. The CTX treated SHSY5Y appear to
200µm
Control 0.25µM CTX 2.5µM CTX
24 Hours
Fig.11 SHSY5Y under inverted fluorescence microscopy a) SHSY5Y control after 1 hour incubation, b) SHSY5Y after
1 hour exposure to 0.25µM CTX, c) SHSY5Y after 1 hour exposure to 2.5µM CTX, d) Control after 24 hours incubation,
e) SHSY5Y after 24 hours exposure to 0.25µM CTX, f) SHSY5Y after 24 hours exposure to 2.5µM CTX.
10 X
10 X
Fig.10 MCF7 under inverted fluorescence microscopy a) MCF7 control after 1 hour incubation, b) MCF7 after 1
hour exposure to 0.25µM CTX, c) MCF7 after 1 hour exposure to 2.5µM CTX, d) Control after 24 hours incubation,
e) MCF7 after 24 hours exposure to 0.25µM CTX and f) MCF7 after 24 hours exposure to 2.5µM CTX.
Control 0.25µM CTX 2.5µM CTX
1 Hour
24 Hours
200µm
1 Hour
a)
a)
b)
b) c)
c)
d) e) f)
d) e) f)
Arie Sullivan
20
a) b) c)
d) e)
f)
f)
c)
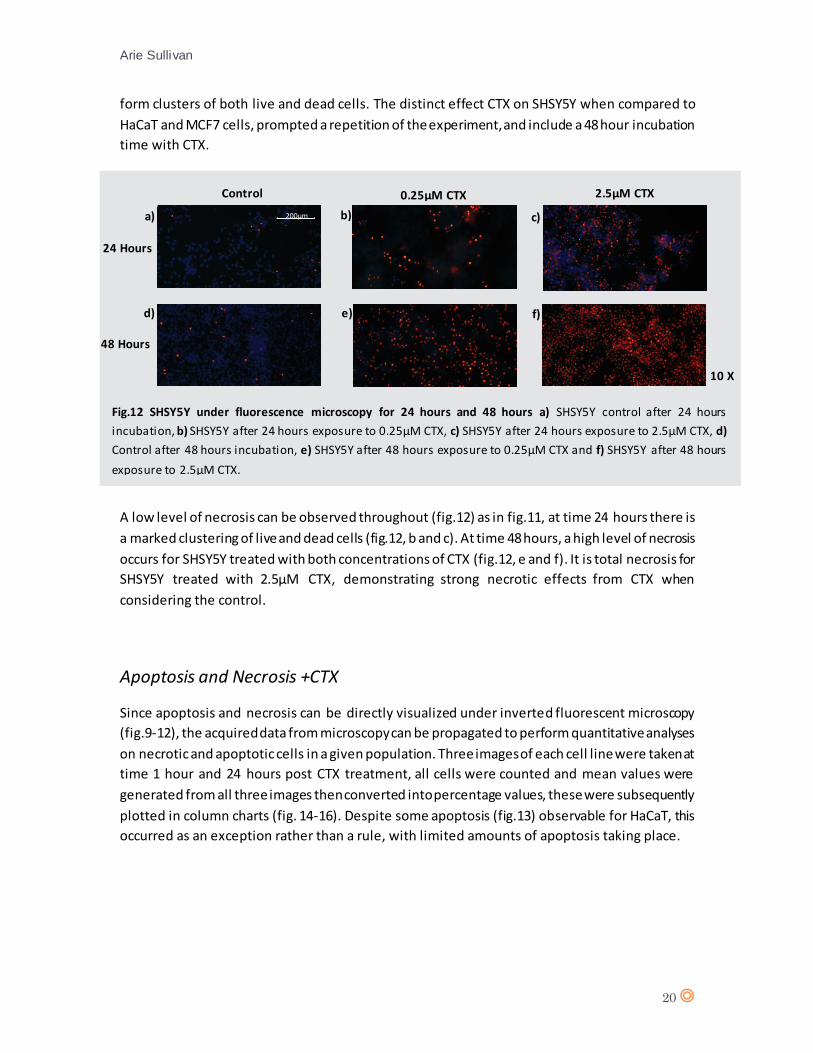
form clusters of both live and dead cells. The distinct effect CTX on SHSY5Y when compared to
HaCaT and MCF7 cells, prompted a repetition of the experiment, and include a 48 hour incubation
time with CTX.
A low level of necrosis can be observed throughout (fig.12) as in fig.11, at time 24 hours there is
a marked clustering of live and dead cells (fig.12, b and c). At time 48 hours, a high level of necrosis
occurs for SHSY5Y treated with both concentrations of CTX (fig.12, e and f). It is total necrosis for
SHSY5Y treated with 2.5µM CTX, demonstrating strong necrotic effects from CTX when
considering the control.
Apoptosis and Necrosis +CTX
Since apoptosis and necrosis can be directly visualized under inverted fluorescent microscopy
(fig.9-12), the acquired data from microscopy can be propagated to perform quantitative analyses
on necrotic and apoptotic cells in a given population. Three images of each cell line were taken at
time 1 hour and 24 hours post CTX treatment, all cells were counted and mean values were
generated from all three images then converted into percentage values, these were subsequently
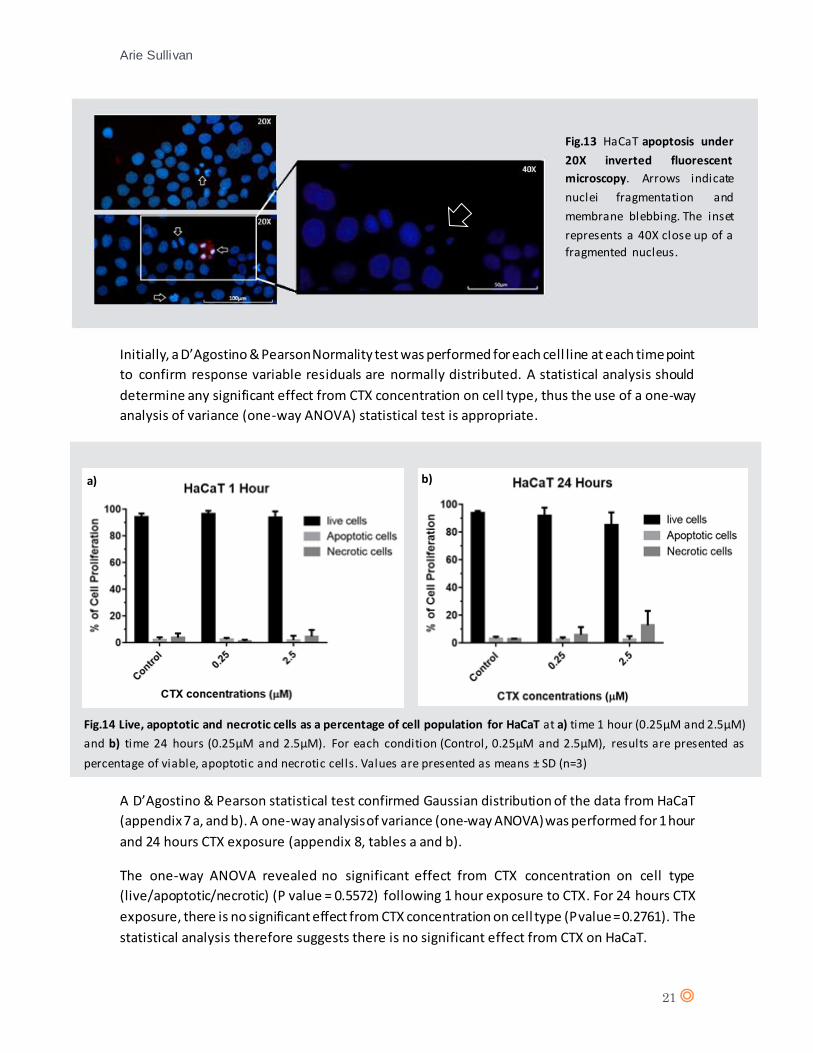
plotted in column charts (fig. 14-16). Despite some apoptosis (fig.13) observable for HaCaT, this
occurred as an exception rather than a rule, with limited amounts of apoptosis taking place.
Control 0.25µM CTX 2.5µM CTX
24 Hours
48 Hours
Fig.12 SHSY5Y under fluorescence microscopy for 24 hours and 48 hours a) SHSY5Y control after 24 hours
incubation, b) SHSY5Y after 24 hours exposure to 0.25µM CTX, c) SHSY5Y after 24 hours exposure to 2.5µM CTX, d)
Control after 48 hours incubation, e) SHSY5Y after 48 hours exposure to 0.25µM CTX and f) SHSY5Y after 48 hours
exposure to 2.5µM CTX.
10 X
200µm a) b) c)
d) e) f)
Arie Sullivan
21
a) b)
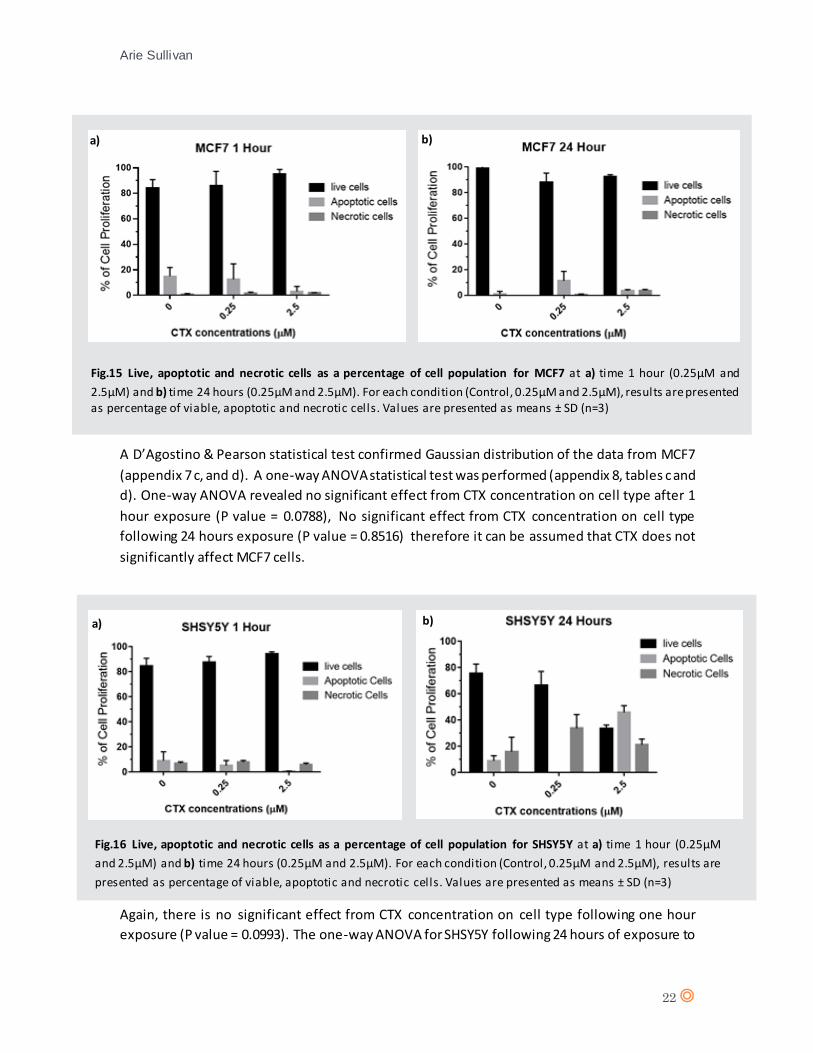
Initially, a D’Agostino & Pearson Normality test was performed for each cell line at each time point
to confirm response variable residuals are normally distributed. A statistical analysis should
determine any significant effect from CTX concentration on cell type, thus the use of a one-way
analysis of variance (one-way ANOVA) statistical test is appropriate.
A D’Agostino & Pearson statistical test confirmed Gaussian distribution of the data from HaCaT
(appendix 7 a, and b). A one-way analysis of variance (one-way ANOVA) was performed for 1 hour
and 24 hours CTX exposure (appendix 8, tables a and b).
The one-way ANOVA revealed no significant effect from CTX concentration on cell type
(live/apoptotic/necrotic) (P value = 0.5572) following 1 hour exposure to CTX. For 24 hours CTX
exposure, there is no significant effect from CTX concentration on cell type (P value = 0.2761). The
statistical analysis therefore suggests there is no significant effect from CTX on HaCaT.
Fig.14 Live, apoptotic and necrotic cells as a percentage of cell population for HaCaT at a) time 1 hour (0.25µM and 2.5µM)
and b) time 24 hours (0.25µM and 2.5µM). For each condition (Control, 0.25µM and 2.5µM), results are presented as
percentage of viable, apoptotic and necrotic cells. Values are presented as means ± SD (n=3)
a) b)
Fig.13 HaCaT apoptosis under
20X inverted fluorescent
microscopy. Arrows indicate
nuclei fragmentation and
membrane blebbing. The inset
represents a 40X close up of a
fragmented nucleus.
Arie Sullivan
22
a) b)
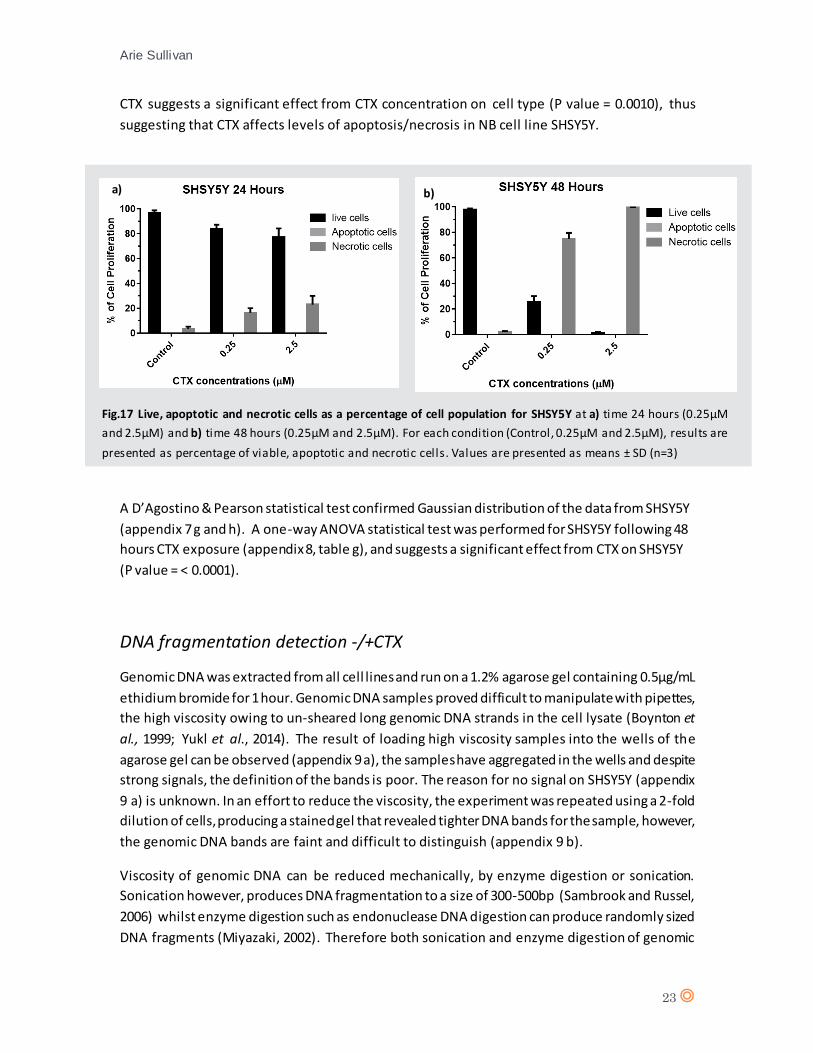
A D’Agostino & Pearson statistical test confirmed Gaussian distribution of the data from MCF7
(appendix 7 c, and d). A one-way ANOVA statistical test was performed (appendix 8, tables c and
d). One-way ANOVA revealed no significant effect from CTX concentration on cell type after 1
hour exposure (P value = 0.0788), No significant effect from CTX concentration on cell type
following 24 hours exposure (P value = 0.8516) therefore it can be assumed that CTX does not
significantly affect MCF7 cells.
A D’Agostino & Pearson statistical test confirmed Gaussian distribution of the data from SHSY5Y
(appendix 7 e, and f). A two-way ANOVA statistical test was performed (appendix 8, table e and
f).
Again, there is no significant effect from CTX concentration on cell type following one hour
exposure (P value = 0.0993). The one-way ANOVA for SHSY5Y following 24 hours of exposure to
Fig.15 Live, apoptotic and necrotic cells as a percentage of cell population for MCF7 at a) time 1 hour (0.25µM and
2.5µM) and b) time 24 hours (0.25µM and 2.5µM). For each condition (Control, 0.25µM and 2.5µM), results are presented as percentage of viable, apoptotic and necrotic cells. Values are presented as means ± SD (n=3)
Fig.16 Live, apoptotic and necrotic cells as a percentage of cell population for SHSY5Y at a) time 1 hour (0.25µM
and 2.5µM) and b) time 24 hours (0.25µM and 2.5µM). For each condition (Control, 0.25µM and 2.5µM), results are
presented as percentage of viable, apoptotic and necrotic cells. Values are presented as means ± SD (n=3)
a) b)
a) b)
Arie Sullivan
23
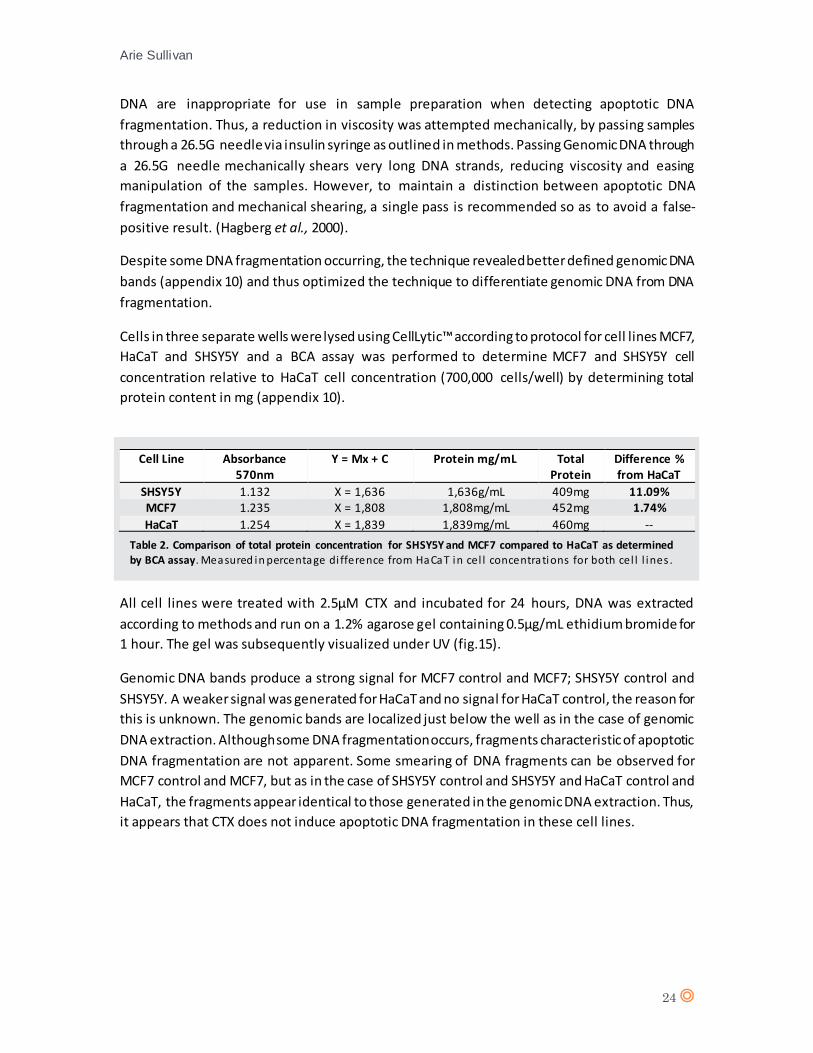
CTX suggests a significant effect from CTX concentration on cell type (P value = 0.0010), thus
suggesting that CTX affects levels of apoptosis/necrosis in NB cell line SHSY5Y.
A D’Agostino & Pearson statistical test confirmed Gaussian distribution of the data from SHSY5Y
(appendix 7 g and h). A one-way ANOVA statistical test was performed for SHSY5Y following 48
hours CTX exposure (appendix 8, table g), and suggests a significant effect from CTX on SHSY5Y
(P value = < 0.0001).
DNA fragmentation detection -/+CTX
Genomic DNA was extracted from all cell lines and run on a 1.2% agarose gel containing 0.5µg/mL
ethidium bromide for 1 hour. Genomic DNA samples proved difficult to manipulate with pipettes,
the high viscosity owing to un-sheared long genomic DNA strands in the cell lysate (Boynton et
al., 1999; Yukl et al., 2014). The result of loading high viscosity samples into the wells of the
agarose gel can be observed (appendix 9 a), the samples have aggregated in the wells and despite
strong signals, the definition of the bands is poor. The reason for no signal on SHSY5Y (appendix
9 a) is unknown. In an effort to reduce the viscosity, the experiment was repeated using a 2-fold
dilution of cells, producing a stained gel that revealed tighter DNA bands for the sample, however,
the genomic DNA bands are faint and difficult to distinguish (appendix 9 b).
Viscosity of genomic DNA can be reduced mechanically, by enzyme digestion or sonication.
Sonication however, produces DNA fragmentation to a size of 300-500bp (Sambrook and Russel,
2006) whilst enzyme digestion such as endonuclease DNA digestion can produce randomly sized
DNA fragments (Miyazaki, 2002). Therefore both sonication and enzyme digestion of genomic
a) b)
Fig.17 Live, apoptotic and necrotic cells as a percentage of cell population for SHSY5Y at a) time 24 hours (0.25µM
and 2.5µM) and b) time 48 hours (0.25µM and 2.5µM). For each condition (Control, 0.25µM and 2.5µM), results are
presented as percentage of viable, apoptotic and necrotic cells. Values are presented as means ± SD (n=3)
Arie Sullivan
24
DNA are inappropriate for use in sample preparation when detecting apoptotic DNA
fragmentation. Thus, a reduction in viscosity was attempted mechanically, by passing samples
through a 26.5G needle via insulin syringe as outlined in methods. Passing Genomic DNA through
a 26.5G needle mechanically shears very long DNA strands, reducing viscosity and easing
manipulation of the samples. However, to maintain a distinction between apoptotic DNA
fragmentation and mechanical shearing, a single pass is recommended so as to avoid a false-
positive result. (Hagberg et al., 2000).
Despite some DNA fragmentation occurring, the technique revealed better defined genomic DNA
bands (appendix 10) and thus optimized the technique to differentiate genomic DNA from DNA
fragmentation.
Cells in three separate wells were lysed using CellLytic™ according to protocol for cell lines MCF7,
HaCaT and SHSY5Y and a BCA assay was performed to determine MCF7 and SHSY5Y cell
concentration relative to HaCaT cell concentration (700,000 cells/well) by determining total
protein content in mg (appendix 10).
All cell lines were treated with 2.5µM CTX and incubated for 24 hours, DNA was extracted
according to methods and run on a 1.2% agarose gel containing 0.5µg/mL ethidium bromide for
1 hour. The gel was subsequently visualized under UV (fig.15).
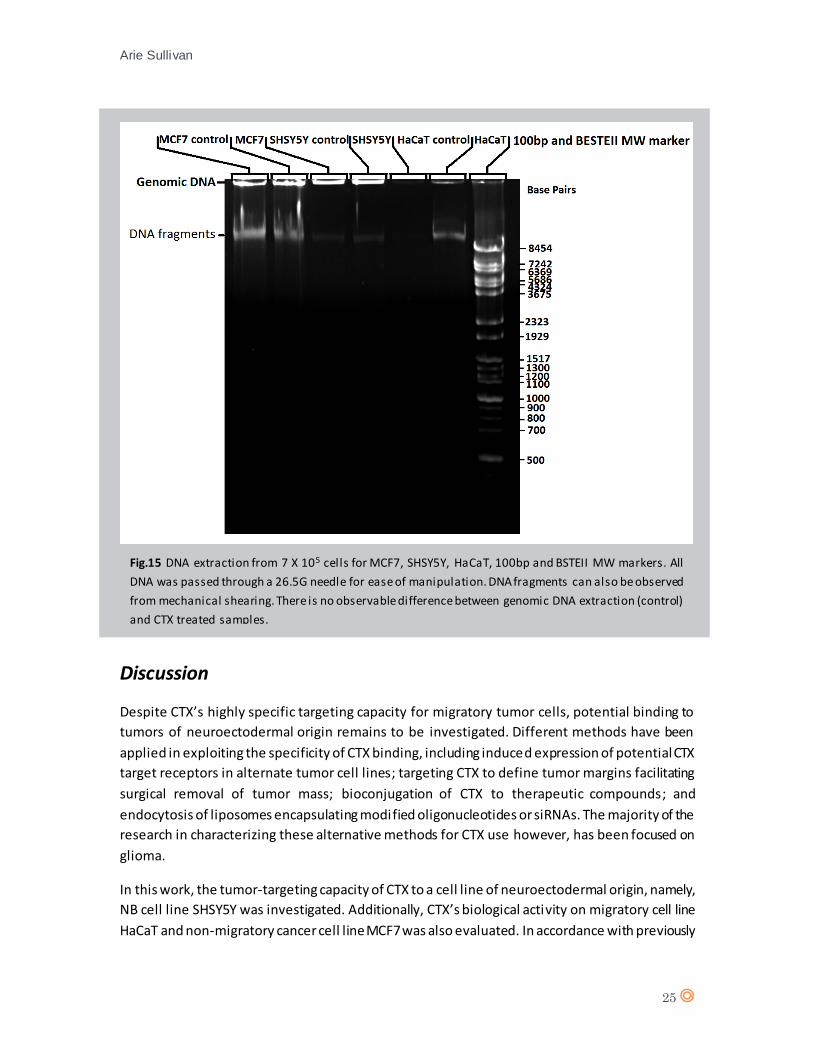
Genomic DNA bands produce a strong signal for MCF7 control and MCF7; SHSY5Y control and
SHSY5Y. A weaker signal was generated for HaCaT and no signal for HaCaT control, the reason for
this is unknown. The genomic bands are localized just below the well as in the case of genomic
DNA extraction. Although some DNA fragmentation occurs, fragments characteristic of apoptotic
DNA fragmentation are not apparent. Some smearing of DNA fragments can be observed for
MCF7 control and MCF7, but as in the case of SHSY5Y control and SHSY5Y and HaCaT control and
HaCaT, the fragments appear identical to those generated in the genomic DNA extraction. Thus,
it appears that CTX does not induce apoptotic DNA fragmentation in these cell lines.
Cell Line Absorbance 570nm
Y = Mx + C Protein mg/mL Total Protein
Difference % from HaCaT
SHSY5Y 1.132 X = 1,636 1,636g/mL 409mg 11.09% MCF7 1.235 X = 1,808 1,808mg/mL 452mg 1.74%
HaCaT 1.254 X = 1,839 1,839mg/mL 460mg --
Table 2. Comparison of total protein concentration for SHSY5Y and MCF7 compared to HaCaT as determined
by BCA assay. Measured in percentage di fference from HaCaT in cel l concentrations for both cel l l ines .
Arie Sullivan
25
Discussion
Despite CTX’s highly specific targeting capacity for migratory tumor cells, potential binding to
tumors of neuroectodermal origin remains to be investigated. Different methods have been
applied in exploiting the specificity of CTX binding, including induced expression of potential CTX
target receptors in alternate tumor cell lines; targeting CTX to define tumor margins facilitating
surgical removal of tumor mass; bioconjugation of CTX to therapeutic compounds; and
endocytosis of liposomes encapsulating modified oligonucleotides or siRNAs. The majority of the
research in characterizing these alternative methods for CTX use however, has been focused on
glioma.
In this work, the tumor-targeting capacity of CTX to a cell line of neuroectodermal origin, namely,
NB cell line SHSY5Y was investigated. Additionally, CTX’s biological activity on migratory cell line
HaCaT and non-migratory cancer cell line MCF7 was also evaluated. In accordance with previously
Fig.15 DNA extraction from 7 X 10⁵ cells for MCF7, SHSY5Y, HaCaT, 100bp and BSTEII MW markers. All
DNA was passed through a 26.5G needle for ease of manipulation. DNA fragments can also be observed
from mechanical shearing. There is no observable difference between genomic DNA extraction (control)
and CTX treated samples.
Arie Sullivan
26
reported studies (Wang and Ji, 2005; Fu et al., 2007), the induction of apoptosis following
exposure to CTX delineates a mechanism of action for CTX. The suggested mechanism of action
was herein assessed to determine if it remains consistent across alternate migratory and non-
migratory cell lines.
Three experiments were designed to investigate CTX’s capacity for apoptosis induction, namely,
cell viability, fluorescent microscopy, and DNA fragmentation assays. Taken together, the results
from these experiments provide a reliable platform on which to assess the hypothesis that CTX
induces apoptosis in tumor cell lines of neuroectodermal origin.
Cell viability assay
Since intracellular ATP levels are exquisitely regulated, a correlation between the presence of ATP
and number of viable cells can be established. The homogenous automated high-throughput
screening (HTS) method is based on a ‘glow type’ signal produced at 560nm in the generation of
Oxyluciferin, AMP, PPi and CO2 from d-luciferin, O2 and ATP. The luciferase reaction can be used
directly to quantify the number of metabolically active cells in culture. The effects of CTX on cell
viability was measured by decrease/increase in signal strength, directly reflecting the amount of
ATP present and thus, viable cells. In the calibration of the cell viability assay to determine
optimum cell concentration for subsequent assays, the cancer cell lines MCF7 and SHSY5Y
(appendix a, and b) produced significantly lower signals (9127 RLU and 7175 RLU, respectively)
than the non-cancerous HaCaT cell line (416462 RLU) (appendix 1, c). This can be attributed to
‘the Warbug effect’, whereby the primary source of ATP in cancer cells is switched from
mitochondrial oxidative phosphorylation to aerobic glycolysis (Amoedo et al., 2013). Despite the
inefficiency of aerobic glycolysis in generating ATP, particular cancer-associated mutations allow
cancer cells to metabolize nutrients in a manner more conducive to proliferation than efficient
ATP production (Van der Heiden et al., 2009). Since ATP levels were measured for two cancerous
cell lines, the loss in sensitivity of the assay owing to ‘the Warbug effect’ should be considered.
Particularly, the mechanism favoring cell proliferation over ATP metabolism can lead to the
generation of misleading results if ATP levels are no longer proportional to the number of viable
cells.
Despite this shortcoming, it is possible to assess changes in cell proliferation proportional to loss
or gains in luminescence signal for each cell line independently, converting changes in
luminescence signal into percentage loss or gain to enable comparison. MCF7 and HaCaT did not
show any significant decrease in cell viability following 1 and 24 hours incubation with CTX
(0.25µM and 2.5µM) (fig.8 a, and b). SHSY5Y showed a slight decrease in cell viability following 24
hours exposure to 0.25µM CTX and a moderate decrease following 24 hours exposure to 2.5µM
CTX (fig.8 c), indicating a dose-dependent effect of CTX on SHSY5Y. However, a 50% inhibitory
concentration (IC50) was not reached by either CTX concentration on either cell lines, a contrast
to the IC50 of approximately 0.28µM for BmKCT reported on glioma cell line SHG-44 (Fu et al.,
2007). Comparable studies on scorpion venom component III (SVCIII) revealed cell viability IC 50’s
of 0.39µM and 0.53µM for SVCIII on human leukemia cell lines THP-1 and Jurkat respectively (Song
Arie Sullivan
27
et al., 2012). Taken together, the inhibitory concentrations of these scorpion venoms on cancer
cell lines suggests that either CTX has a lower binding affinity for cancer cells than alternate
scorpion venoms; that the target receptor is not expressed or expression is significantly reduced
in the cell lines used herein; or that CTX possesses a mechanism of action other than inhibition of
cell proliferation. Non-the-less, the data from figure 8-c indicates that CTX does impact SHSY5Y
cell viability when compared to control.
Fluorescent Microscopy
The effect of CTX on all cell lines was further assessed by visualizing live cells stained with Hoechst
33342 and dead cells counterstained with PI, 1 and 24 hours post-CTX treatment (fig.9-12).
Visualizing under inverted fluorescent microscopy provides the ability to directly observe the
effects of CTX on cells, thus generating data of a more sensitive nature. All data for each cell line
and each time interval was statistically analyzed by one-way ANOVA to generate P values
reflecting the probability of a significant effect of CTX concentration on cell type.
The data shown in figure 9 and 14 disclose the effect of CTX on HaCaT with little to no necrosis
observed following 1 hour exposure for both 0.25µM and 2.5µM CTX (P value = 0.5572). Following
24 hours exposure, a minor level of necrosis can be observed at a concentration of 0.25µM and a
small level of necrosis at a concentration of 2.5µM (P value = 0.2761). By one-way ANOVA analysis,
there is no significant effect of CTX on HaCaT.
Figure 10 and 15 disclose CTX effect on MCF7 with no significant apoptosis/necrosis throughout
all CTX treatments after 1 hour (P value = 0.0788). Following 24 hours exposure, the one-ANOVA
analysis suggests an interaction between CTX concentration and cell type (P value = 0.8516). One-
way ANOVA reveals no significant effect of CTX on MCF7.
Finally, the effects of CTX concentration on SHSY5Y (fig.11, 12, 16 and 17) following 1 hour
exposure disclose no effect from CTX (P value = 0.0993), suggesting that CTX has no significant
effect on apoptosis/necrosis after 1 hour exposure to CTX. After 24 hours CTX exposure however,
a significant effect from CTX on cell type can be observed (P value = 0.0010). The results for
SHSY5Y prompted an additional test using 0.25µM and 2.5µM CTX treatment for 24 and 48 hours
exposure. In confluence with previous experiments, a high level of necrosis can be observed for
0.25µM CTX, and total necrosis for 2.5µM CTX following 48 hours exposure (P value = < 0.0001).
The column charts generated for SHSY5Y reflect the one-way ANOVA test by an observable
increase in necrotic cells for SHSY5Y following 24 hour exposure to 0.25µM CTX and a marked
increase in both necrotic and apoptotic cells for SHSY5Y following 24 hour exposure to 2.5µM CTX.
It is worth noting the clustering of cells following CTX treatment for SHSY5Y when considered
alongside the control (fig.11 d, e and f). These clusters of inconsistent size and shape have been
observed with SHSY5Y when grown onto nanorough substrates (Brunetti et al., 2010). Similar
clustering has been observed on treating SHSY5Y with between 12.5 and 50mg/mL guarana
(Zeidan-Chulia et al., 2013). Despite the aggregation of SHSY5Y cells being previously attributed
Arie Sullivan
28
to the formation of neurospheres (Moors et al., 2009), this is not likely the case since these are
known to form during growth and are not present within the control group herein. Additionally,
there was no cell aggregation on observation of the cells following 24 and 48 hours CTX exposure,
indicating the previous clustering could have been an anomaly rather than an organized
formation.
Since CTX has shown to be significant in determining necrosis levels in SHSY5Y, and not HaCaT,
the role of MMP-2 alone as the target receptor for CTX can be brought into question since both
these cell lines express MMP-2. As no effect was observed for HaCaT, it can be deduced that it is
not likely that CTX acts alone on MMP-2 but rather, other receptors are implicated.
Despite CTX affecting SHSY5Y cell viability, investigation into apoptogenic capacity of CTX on
SHSY5Y revealed little to no apoptosis, rather, the different approaches into determining the
mechanism of action of CTX revealed a significantly higher capacity to induce necrosis than
apoptosis.
DNA fragmentation
To further test CTX apoptosis induction, a test for DNA fragmentation was performed on all cell
lines following 24 hour 2.5µM CTX exposure (fig. 15) which generated genomic DNA bands but no
apoptotic DNA fragmentation despite a number of repetitions of the experiment under different
conditions. Without the presence of DNA fragmentation, apoptosis is not likely implicated in the
mechanism of action of CTX on SHSY5Y.
Following reports of apoptosis induction on glioma cell line SHG-44 and breast cancer cell line
MCF7 by recombinant Buthus martensii Karsch chlorotoxin (BmKCT) (Fu et al., 2007; Li et al.,
2014), the mechanism of action of Leiurus quinqestriatus chlorotoxin (CTX) was speculated to also
implicate apoptosis, this was not the case. Despite NB having a neuroectodermal origin and
reports claiming 8 positive results of 9 tested for CTX tissue staining (Dardevet et al., 2015), the
report herein indicates CTX does not induce apoptosis, but rather, necrosis. This prompts a need
for further investigation into the differences in components and structure betwee n the two
molecules that result in the ability of one form to induce apoptosis and the other to induce
necrosis. From the amino acid sequence of BmKCT, it is possible to generate its molecular
structure (fig.16) for comparison with CTX.
Arie Sullivan
29
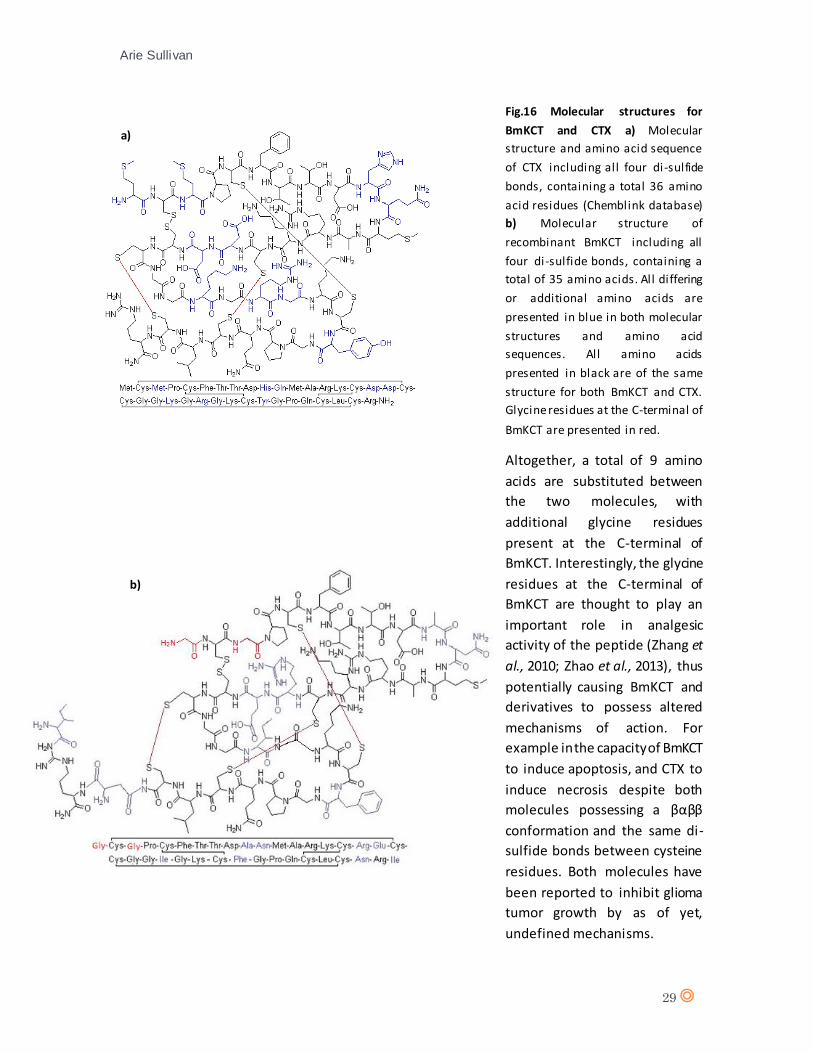
Fig.16 Molecular structures for
BmKCT and CTX a) Molecular
structure and amino acid sequence
of CTX including all four di-sulfide
bonds, containing a total 36 amino
acid residues (Chemblink database)
b) Molecular structure of
recombinant BmKCT including all
four di-sulfide bonds, containing a
total of 35 amino acids. All differing
or additional amino acids are
presented in blue in both molecular
structures and amino acid
sequences. All amino acids
presented in black are of the same
structure for both BmKCT and CTX.
Glycine residues at the C-terminal of
BmKCT are presented in red.
Altogether, a total of 9 amino
acids are substituted between
the two molecules, with
additional glycine residues
present at the C-terminal of
BmKCT. Interestingly, the glycine
residues at the C-terminal of
BmKCT are thought to play an
important role in analgesic
activity of the peptide (Zhang et
al., 2010; Zhao et al., 2013), thus
potentially causing BmKCT and
derivatives to possess altered
mechanisms of action. For
example in the capacity of BmKCT
to induce apoptosis, and CTX to
induce necrosis despite both
molecules possessing a βαββ
conformation and the same di-
sulfide bonds between cysteine
residues. Both molecules have
been reported to inhibit glioma
tumor growth by as of yet,
undefined mechanisms.
a)
b)
Arie Sullivan
30
Glycine receptor (GlyR) Cl- channels belong to a family of ligand-gated ion channel receptors best
known for mediating inhibitory neurotransmission in motor and sensory reflex circuits of the
spinal cord (fig.17) (Webb and Lynch, 2007). Disruption of GlyR expression causes reduced ability
to conduct chloride ions resulting in neurological disorder, hyperekplexia (Andrew and Owen,
1997; Xiong et al., 2014). Flatteringly, ion channels mediating neurological signaling are frequently
the target for potent venoms used to paralyze prey (Cannon, 2006).
Studies have demonstrated that glioma cell-GlyRs do not serve as typical neurotransmitter
receptors, with knockdown of GlyR α1 subunit expression resulting in impaired tumorigenicity
(Forstera et al., 2014). Another report suggests GlyRs could have an influence on radial migration
during late embryonic development (Nimmervoll et al., 2011). Moreover, application of glycine
was shown to impede radial migration in neuronal and non-neuronal cells (Avila et al., 2013;
Dender et al., 2010; Van den Eynden et al., 2009), suggesting GlyR activation causes cell migration
arrest. Since GlyRs are widely distributed throughout the whole cortex, it is thought that they
provide significant contributions in controlling cell migration. Studies on rodent models report
glycine-induced inhibition of cell proliferation, migration and tumor growth by 5% (Rosa et al.,
1999). GlyR activation causing downstream effects on cell migration potentially implicates GlyR in
the invasive capacity of cells, outlining a potential mode of action for BmKCT’s additional C-
terminal glycine residue. However, to date, there are no reports of GlyR channel inhibitors such
as strychnine or choline having the capacity to circumvent glycine-induced migration inhibition.
The presence of such GlyR antagonists would be expected to blunt the effects of glycine and
downstream processes.
Glycine also triggers calcium influx by activating GlyRs and glycine transporters (GlyTs),
depolarizing the plasma membrane. Calcium influx has the potential to trigger apoptosis through
plasma membrane channels (fig.18). Specifically, calcium influx into the mitochondrion induces
permeability transition in the membrane of an adjacent mitochondrion, forming a chain reaction
leading to a significant elevation in cytochrome-c levels initiating downstream caspases and
formation of the apoptosome (Mattson and Chan, 2003). Thus, it could be suggested that the
additional glycine residues at the C-terminal of BmKCT play a pivotal role in the apoptogenic
capacity of BmKCT, perhaps via GlyR Cl - channel activation.
Determining the function of additional glycine residues at the C-terminal of BmKCT may assist in
deciphering amino acid sequence/molecular structure relationship and could be use d to predict
the mechanism of action of related venom components since these post-translationally modified
peptides most often share similar sequence consensus, matching cysteine residues, di -sulfide
bonds and thus, structural conformation (Arzamasov et al., 2014).
Arie Sullivan
31
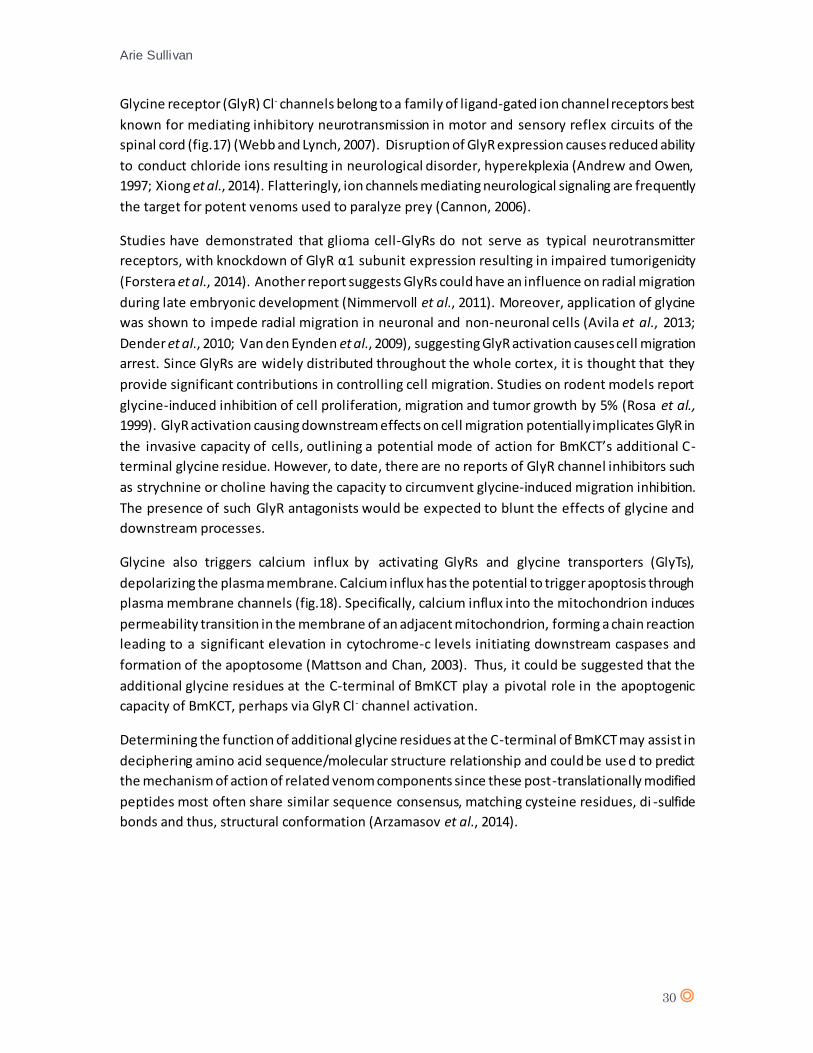
Fig.17 Glycine signaling in macroglial cells. Upon ligand binding, GlyR activation causes chloride efflux leading to cellular
depolarization. The depolarization causes activation of VGCC resulting in calcium influx inducing numerous downstream
effects (cell proliferation, migration and differentiation). Inactivation of the Gl yR may be caused by endocytosis of the
receptor by as of yet unknown mechanisms. Image acquired from Van den Eynden et al., 2009)
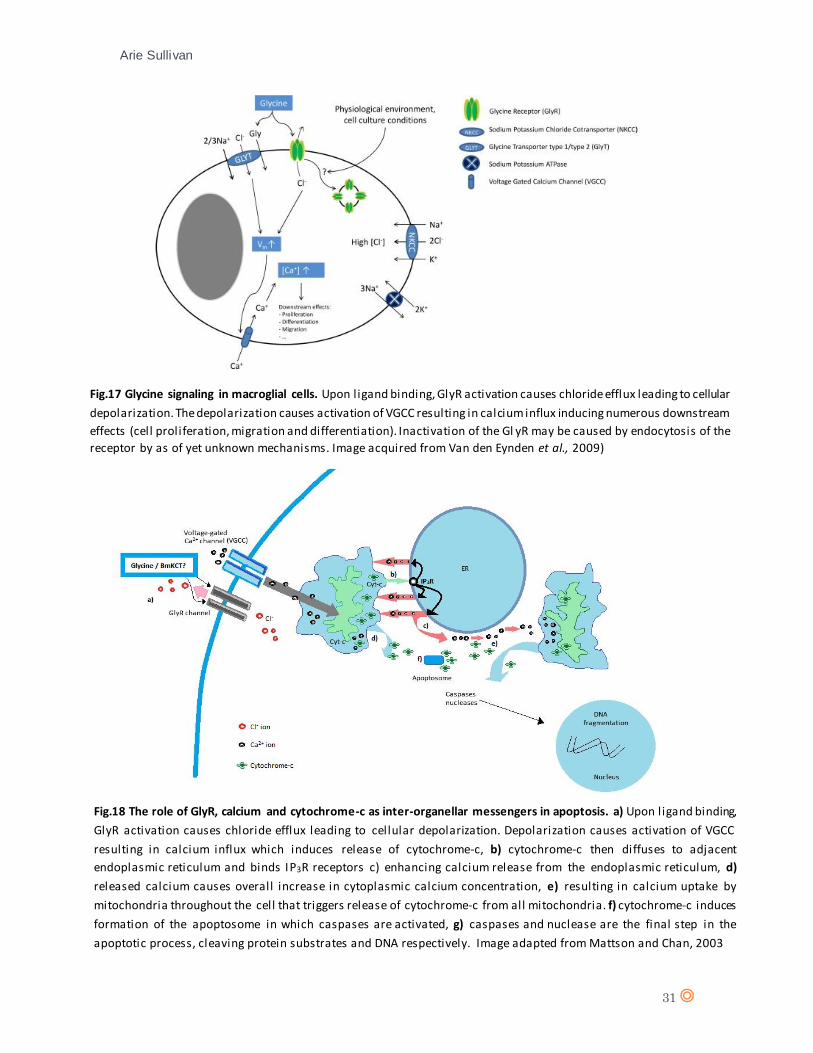
Fig.18 The role of GlyR, calcium and cytochrome-c as inter-organellar messengers in apoptosis. a) Upon ligand binding,
GlyR activation causes chloride efflux leading to cellular depolarization. Depolarization causes activation of VGCC
resulting in calcium influx which induces release of cytochrome-c, b) cytochrome-c then diffuses to adjacent
endoplasmic reticulum and binds IP3R receptors c) enhancing calcium release from the endoplasmic reticulum, d)
released calcium causes overall increase in cytoplasmic calcium concentration, e) resulting in calcium uptake by
mitochondria throughout the cell that triggers release of cytochrome-c from all mitochondria. f) cytochrome-c induces
formation of the apoptosome in which caspases are activated, g) caspases and nuclease are the final step in the
apoptotic process, cleaving protein substrates and DNA respectively. Image adapted from Mattson and Chan, 2003
Arie Sullivan
32
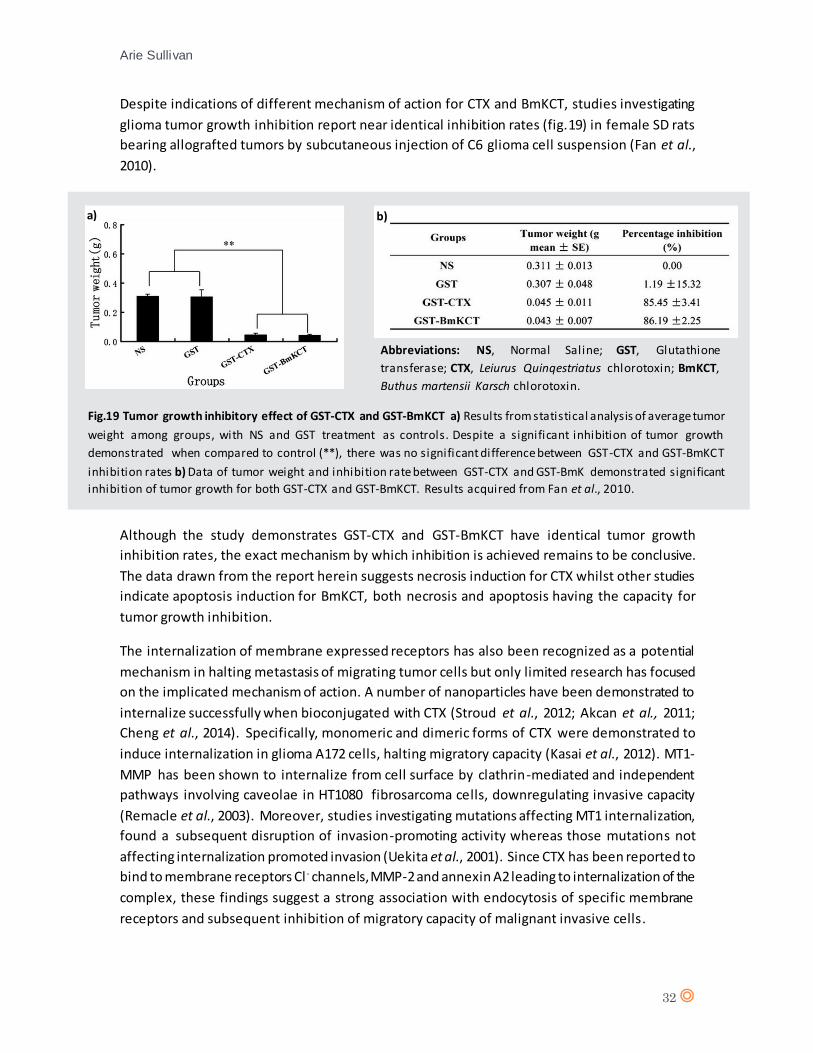
Despite indications of different mechanism of action for CTX and BmKCT, studies investigating
glioma tumor growth inhibition report near identical inhibition rates (fig.19) in female SD rats
bearing allografted tumors by subcutaneous injection of C6 glioma cell suspension (Fan et al.,
2010).
Although the study demonstrates GST-CTX and GST-BmKCT have identical tumor growth
inhibition rates, the exact mechanism by which inhibition is achieved remains to be conclusive.
The data drawn from the report herein suggests necrosis induction for CTX whilst other studies
indicate apoptosis induction for BmKCT, both necrosis and apoptosis having the capacity for
tumor growth inhibition.
The internalization of membrane expressed receptors has also been recognized as a potential
mechanism in halting metastasis of migrating tumor cells but only limited research has focused
on the implicated mechanism of action. A number of nanoparticles have been demonstrated to
internalize successfully when bioconjugated with CTX (Stroud et al., 2012; Akcan et al., 2011;
Cheng et al., 2014). Specifically, monomeric and dimeric forms of CTX were demonstrated to
induce internalization in glioma A172 cells, halting migratory capacity (Kasai et al., 2012). MT1-
MMP has been shown to internalize from cell surface by clathrin-mediated and independent
pathways involving caveolae in HT1080 fibrosarcoma cells, downregulating invasive capacity
(Remacle et al., 2003). Moreover, studies investigating mutations affecting MT1 internalization,
found a subsequent disruption of invasion-promoting activity whereas those mutations not
affecting internalization promoted invasion (Uekita et al., 2001). Since CTX has been reported to
bind to membrane receptors Cl - channels, MMP-2 and annexin A2 leading to internalization of the
complex, these findings suggest a strong association with endocytosis of specific membrane
receptors and subsequent inhibition of migratory capacity of malignant invasive cells.
Fig.19 Tumor growth inhibitory effect of GST-CTX and GST-BmKCT a) Results from statistical analysis of average tumor
weight among groups, with NS and GST treatment as controls. Despite a significant inhibition of tumor growth
demonstrated when compared to control (**), there was no significant difference between GST-CTX and GST-BmKCT
inhibition rates b) Data of tumor weight and inhibition rate between GST-CTX and GST-BmK demonstrated significant
inhibition of tumor growth for both GST-CTX and GST-BmKCT. Results acquired from Fan et al., 2010.
Abbreviations: NS, Normal Saline; GST, Glutathione
transferase; CTX, Leiurus Quinqestriatus chlorotoxin; BmKCT,
Buthus martensii Karsch chlorotoxin.
a) b)
Arie Sullivan
33
Further investigation
Despite increasing reports narrowing the search for potential CTX target receptors, a number of
possibilities remain feasible for the action mechanism of CTX. It is possible to characterize the CTX
target receptor by western blot. Western blot analysis will enable to probe for the target receptor
using an iodinated form of CTX by substitution of tyrosine for iodine at residue 29. The tyrosine
residue at position 29 has been demonstrated as not critical for the function of CTX by intact
activity following tyr29 iodination (Dardevet et al., 2015). The labeling of CTX and binding to protein
of interest on the nitrocellulose membrane should allow to visualize and subsequently determine
the molecular weight of the protein of interest. Alternately circumventing the iodination step,
antibodies can be raised against bound CTX on the nitrocellulose membrane and visualized by
labelled secondary antibody to primary antibody.
However, both CLC-2 and GlyR as target Cl- channels for CTX are indistinguishable by western blot
owing to similar molecular weights of 97kDa and 106kDa (Britton et al., 2000). Internalization of
GlyR causes ubiquitin molecules to induce proteolytic cleavage of the GlyR α1-subunit into a
glycosylated 35kDa N-terminal fragment and a 17kDA COOH-terminal fragment (Lynch, 2004).
This allows for western blot analysis to be used in combination with CTX-bioconjugation mediated
endocytosis to determine which of the two receptors is the true CTX target, as well as ascertaining
whether endocytosis of target membrane proteins is occurring.
CTX-bioconjugated particles showing successful internalization followed by western blot analysis
revealing bands at 35kDa and 17kDa which would indicate receptor-mediated endocytosis of CTX-
target membrane protein GlyR. CTX-bioconjugated particles showing successful internalization
and western blot analysis revealing bands at approximately 100kDa would indicate receptor-
mediated endocytosis of CTX-target membrane protein ClC-2. Finally, CTX-bioconjugated particles
showing failed internalization and western blot analysis revealing bands at approximately 100kDa
would suggest either GlyR or ClC-2 as target membrane proteins and no receptor-mediated
endocytosis.
A further hypothesis to investigate is the ability of CTX as a Cl - channel blocker to prevent
apoptosis. This could be achieved using glioma cell line SHG-44, replicating the conditions under
which apoptosis was observed on BmKCT treatment. The experiment could be repeated in the
presence of CTX, with a speculation that CTX will inhibit apoptosis by Cl - channel inhibition. This
will assist in determining whether CTX is preventing apoptosis.
Recent advances have been made in categorizing and organizing data regarding scorpion toxins.
The construction of molecular databases for scorpion toxins (Srinivasan et al., 2002) forms an
integral part in allowing confluent research to adjoin. Such collaborative databases offer
promising future prospects in deciphering the therapeutic value these numerous compounds
possess.
Arie Sullivan
34
Appendix
1) Standard curves demonstrating the linear phase for a) MCF7, b) SHSY5Y and c) HaCaT to
determine cell concentration for optimum detection of luminescence variance (20,000
cells) d) ATP standard curve for QC.
R² = 0.9992
0
50000
100000
150000
200000
250000
300000
350000
400000
450000
0 10000 20000 30000 40000 50000 60000
Lum
ines
cen
ce (
RLU
)
Cells/well
HaCat
a) b)
)
c)
R² = 1
0
100
200
300
400
500
600
0 0.5 1
RLU
Concentration (µg/mL)
ATP Standard d)
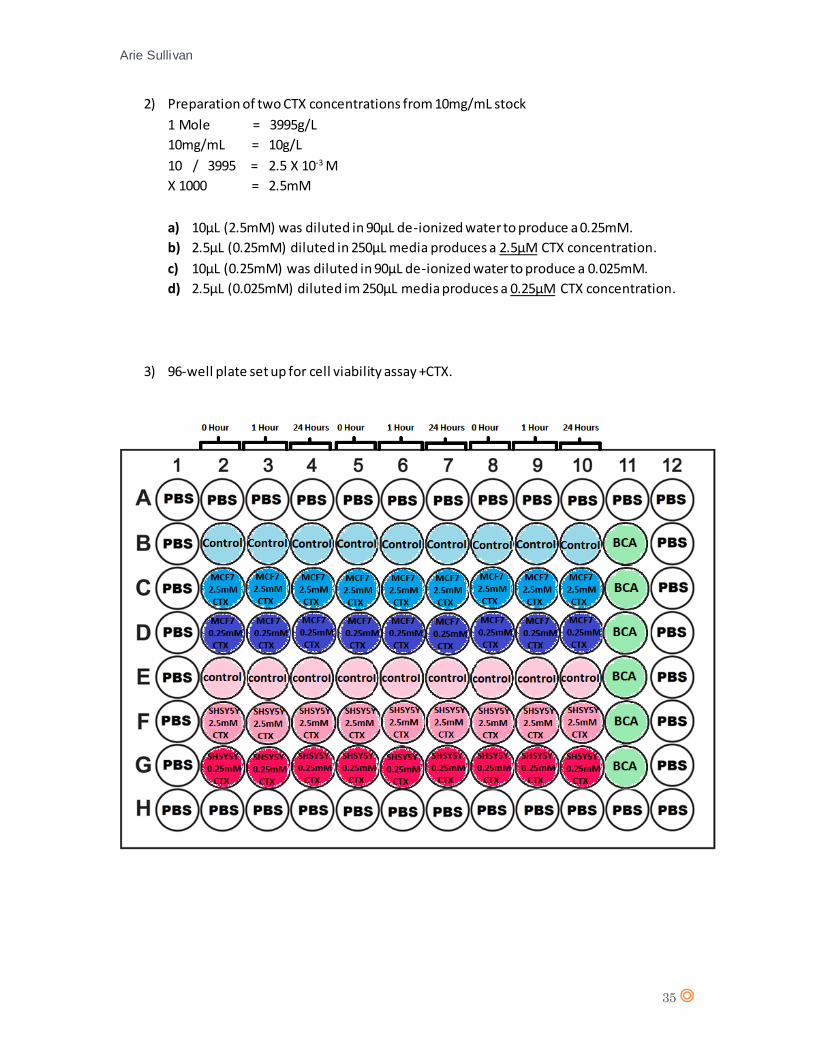
Arie Sullivan
35
2) Preparation of two CTX concentrations from 10mg/mL stock
1 Mole = 3995g/L
10mg/mL = 10g/L
10 / 3995 = 2.5 X 10-3 M
X 1000 = 2.5mM
a) 10µL (2.5mM) was diluted in 90µL de-ionized water to produce a 0.25mM.
b) 2.5µL (0.25mM) diluted in 250µL media produces a 2.5µM CTX concentration.
c) 10µL (0.25mM) was diluted in 90µL de-ionized water to produce a 0.025mM.
d) 2.5µL (0.025mM) diluted im 250µL media produces a 0.25µM CTX concentration.
3) 96-well plate set up for cell viability assay +CTX.
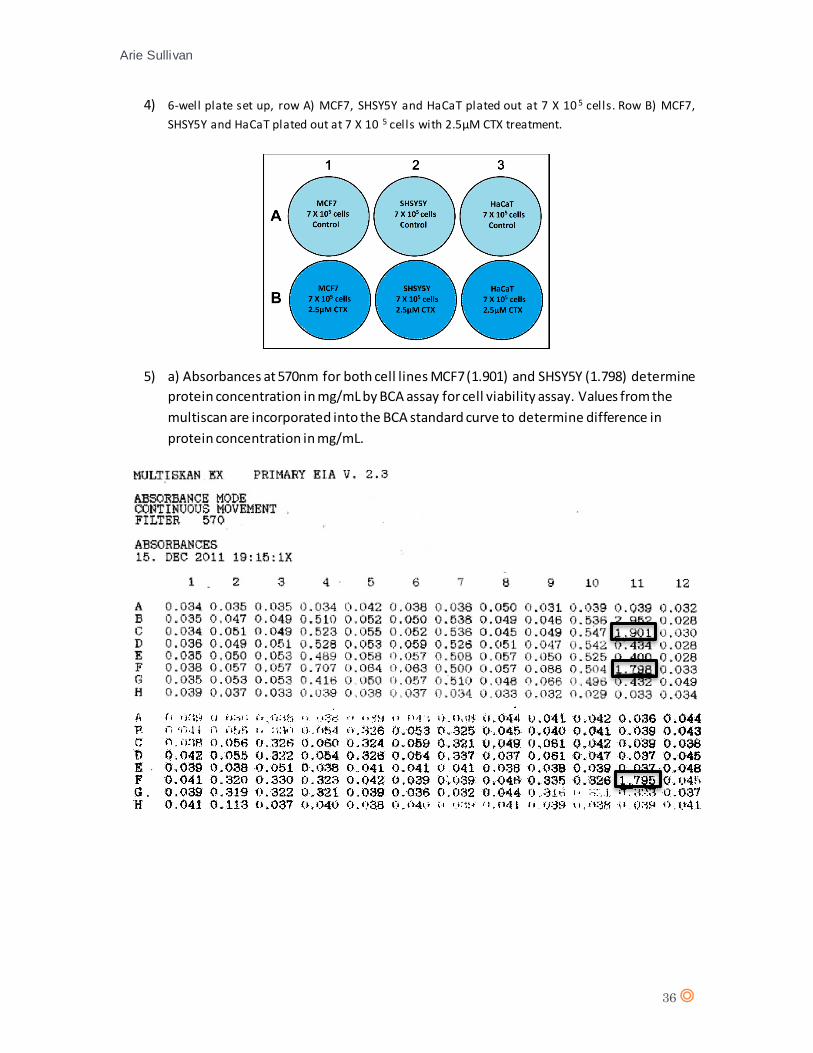
Arie Sullivan
36
4) 6-well plate set up, row A) MCF7, SHSY5Y and HaCaT plated out at 7 X 10 5 cells. Row B) MCF7,
SHSY5Y and HaCaT plated out at 7 X 10 5 cells with 2.5µM CTX treatment.
5) a) Absorbances at 570nm for both cell lines MCF7 (1.901) and SHSY5Y (1.798) determine
protein concentration in mg/mL by BCA assay for cell viability assay. Values from the
multiscan are incorporated into the BCA standard curve to determine difference in
protein concentration in mg/mL.
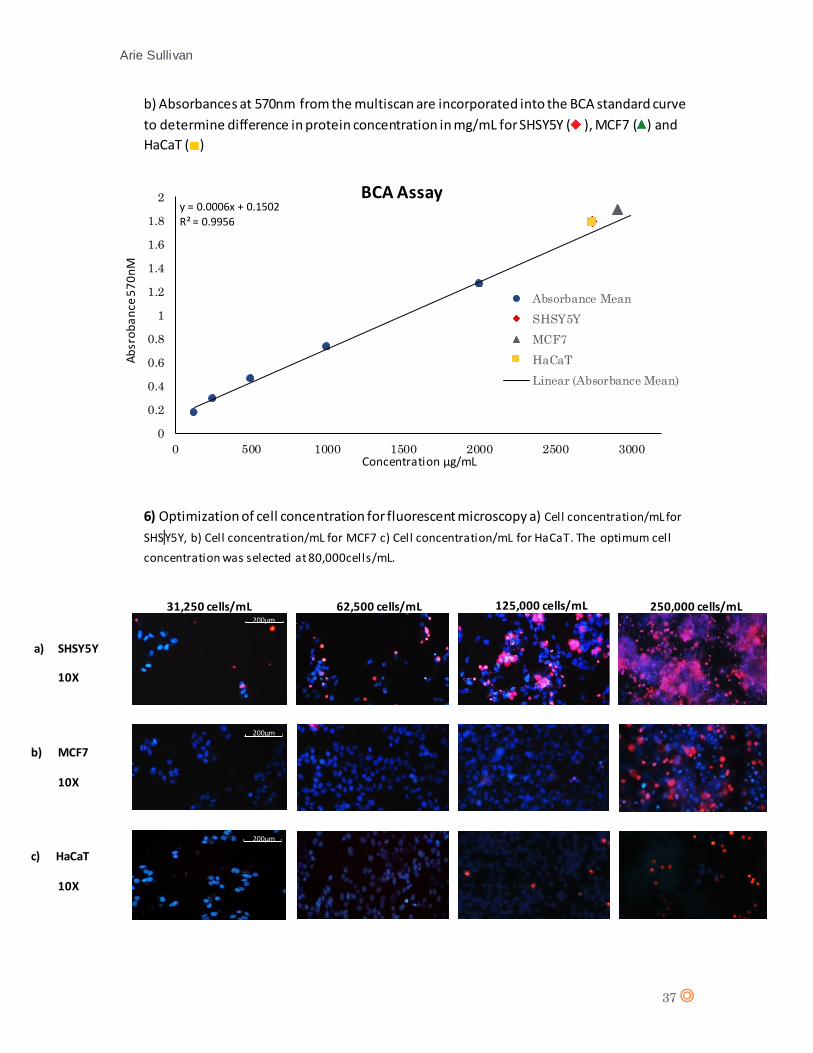
Arie Sullivan
37
b) Absorbances at 570nm from the multiscan are incorporated into the BCA standard curve
to determine difference in protein concentration in mg/mL for SHSY5Y ( ), MCF7 ( ) and
HaCaT ( )
6) Optimization of cell concentration for fluorescent microscopy a) Cell concentration/mL for
SHS Y5Y, b) Cell concentration/mL for MCF7 c) Cell concentration/mL for HaCaT. The optimum cell
concentration was selected at 80,000cells/mL.
y = 0.0006x + 0.1502
R² = 0.9956
0
0.2
0.4
0.6
0.8
1
1.2
1.4
1.6
1.8
2
0 500 1000 1500 2000 2500 3000
Ab
sro
ba
nce
57
0n
M
Concentration µg/mL
BCA Assay
Absorbance Mean
SHSY5Y
MCF7
HaCaT
Linear (Absorbance Mean)
b) MCF7
10X
a) SHSY5Y
10X
c) HaCaT
10X
200µm
200µm
200µm
31,250 cells/mL 62,500 cells/mL 125,000 cells/mL 250,000 cells/mL
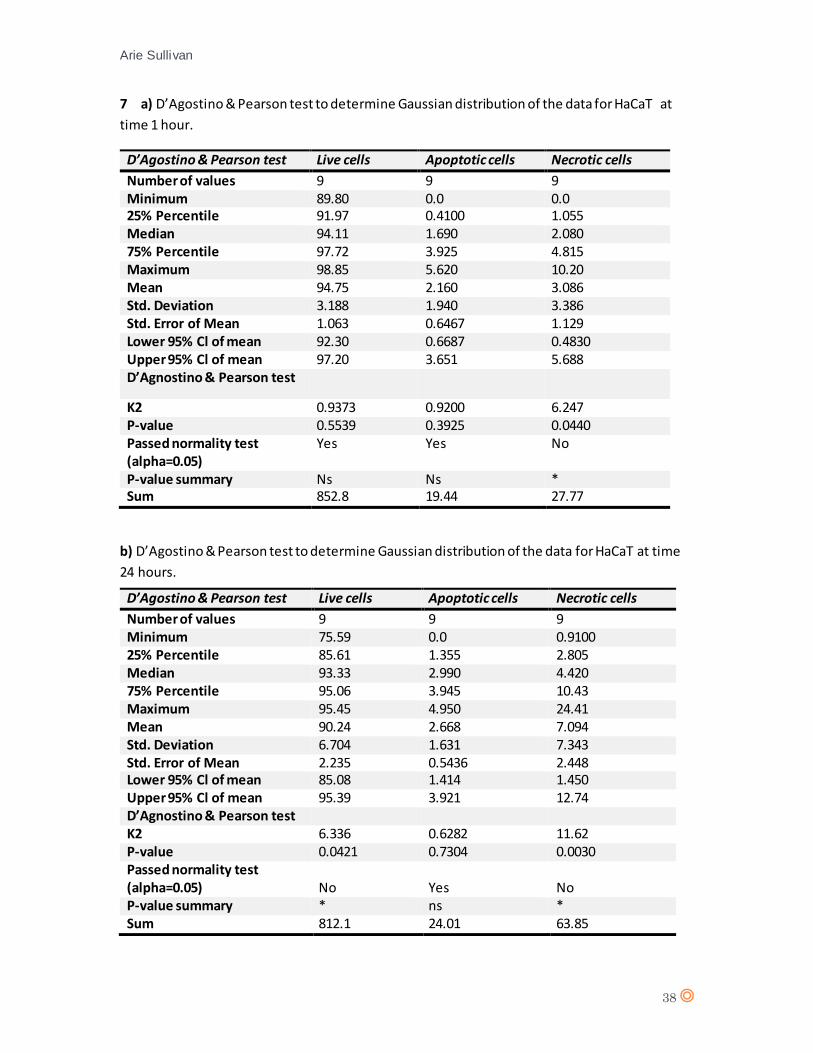
Arie Sullivan
38
7 a) D’Agostino & Pearson test to determine Gaussian distribution of the data for HaCaT at
time 1 hour.
b) D’Agostino & Pearson test to determine Gaussian distribution of the data for HaCaT at time
24 hours.
D’Agostino & Pearson test Live cells Apoptotic cells Necrotic cells
Number of values 9 9 9 Minimum 75.59 0.0 0.9100 25% Percentile 85.61 1.355 2.805 Median 93.33 2.990 4.420 75% Percentile 95.06 3.945 10.43 Maximum 95.45 4.950 24.41 Mean 90.24 2.668 7.094 Std. Deviation 6.704 1.631 7.343 Std. Error of Mean 2.235 0.5436 2.448 Lower 95% Cl of mean 85.08 1.414 1.450 Upper 95% Cl of mean 95.39 3.921 12.74 D’Agnostino & Pearson test K2 6.336 0.6282 11.62 P-value 0.0421 0.7304 0.0030 Passed normality test (alpha=0.05) No Yes No P-value summary * ns * Sum 812.1 24.01 63.85
D’Agostino & Pearson test Live cells Apoptotic cells Necrotic cells
Number of values 9 9 9 Minimum 89.80 0.0 0.0 25% Percentile 91.97 0.4100 1.055 Median 94.11 1.690 2.080 75% Percentile 97.72 3.925 4.815 Maximum 98.85 5.620 10.20 Mean 94.75 2.160 3.086 Std. Deviation 3.188 1.940 3.386 Std. Error of Mean 1.063 0.6467 1.129 Lower 95% Cl of mean 92.30 0.6687 0.4830 Upper 95% Cl of mean 97.20 3.651 5.688 D’Agnostino & Pearson test
K2 0.9373 0.9200 6.247 P-value 0.5539 0.3925 0.0440 Passed normality test (alpha=0.05)
Yes Yes No
P-value summary Ns Ns * Sum 852.8 19.44 27.77
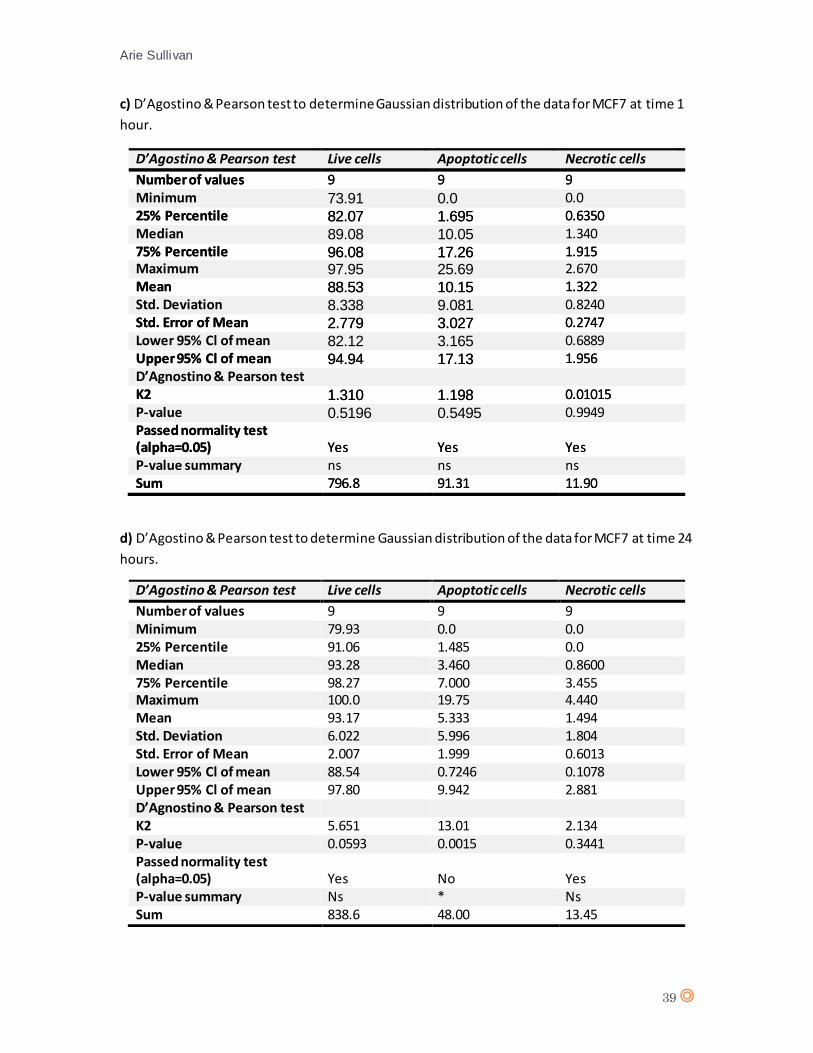
Arie Sullivan
39
c) D’Agostino & Pearson test to determine Gaussian distribution of the data for MCF7 at time 1
hour.
d) D’Agostino & Pearson test to determine Gaussian distribution of the data for MCF7 at time 24
hours.
D’Agnostino & Pearson test Live cells Apoptotic cells Necrotic cells
Number of values 9 9 9 Minimum 73.91 0.0 0.0 25% Percentile 82.07 1.695 0.6350 Median 89.08 10.05 1.340 75% Percentile 96.08 17.26 1.915 Maximum 97.95 25.69 2.670 Mean 88.53 10.15 1.322 Std. Deviation 8.338 9.081 0.8240 Std. Error of Mean 2.779 3.027 0.2747 Lower 95% Cl of mean 82.12 3.165 0.6889 Upper 95% Cl of mean 94.94 17.13 1.956 D’Agnostino & Pearson test K2 1.310 1.198 0.01015 P-value 0.5196 0.5495 0.9949 Passed normality test (alpha=0.05) Yes Yes Yes P-value summary ns ns ns Sum 796.8 91.31 11.90
D’Agostino & Pearson test Live cells Apoptotic cells Necrotic cells
Number of values 9 9 9 Minimum 79.93 0.0 0.0 25% Percentile 91.06 1.485 0.0 Median 93.28 3.460 0.8600 75% Percentile 98.27 7.000 3.455 Maximum 100.0 19.75 4.440 Mean 93.17 5.333 1.494 Std. Deviation 6.022 5.996 1.804 Std. Error of Mean 2.007 1.999 0.6013 Lower 95% Cl of mean 88.54 0.7246 0.1078 Upper 95% Cl of mean 97.80 9.942 2.881 D’Agnostino & Pearson test K2 5.651 13.01 2.134 P-value 0.0593 0.0015 0.3441 Passed normality test (alpha=0.05) Yes No Yes P-value summary Ns * Ns Sum 838.6 48.00 13.45
D’Agostino & Pearson test Live cells Apoptotic cells Necrotic cells
Number of values 9 9 9 Minimum 73.91 0.0 0.0 25% Percentile 82.07 1.695 0.6350 Median 89.08 10.05 1.340 75% Percentile 96.08 17.26 1.915 Maximum 97.95 25.69 2.670 Mean 88.53 10.15 1.322 Std. Deviation 8.338 9.081 0.8240 Std. Error of Mean 2.779 3.027 0.2747 Lower 95% Cl of mean 82.12 3.165 0.6889 Upper 95% Cl of mean 94.94 17.13 1.956 D’Agnostino & Pearson test K2 1.310 1.198 0.01015 P-value 0.5196 0.5495 0.9949 Passed normality test (alpha=0.05) Yes Yes Yes P-value summary ns ns ns Sum 796.8 91.31 11.90
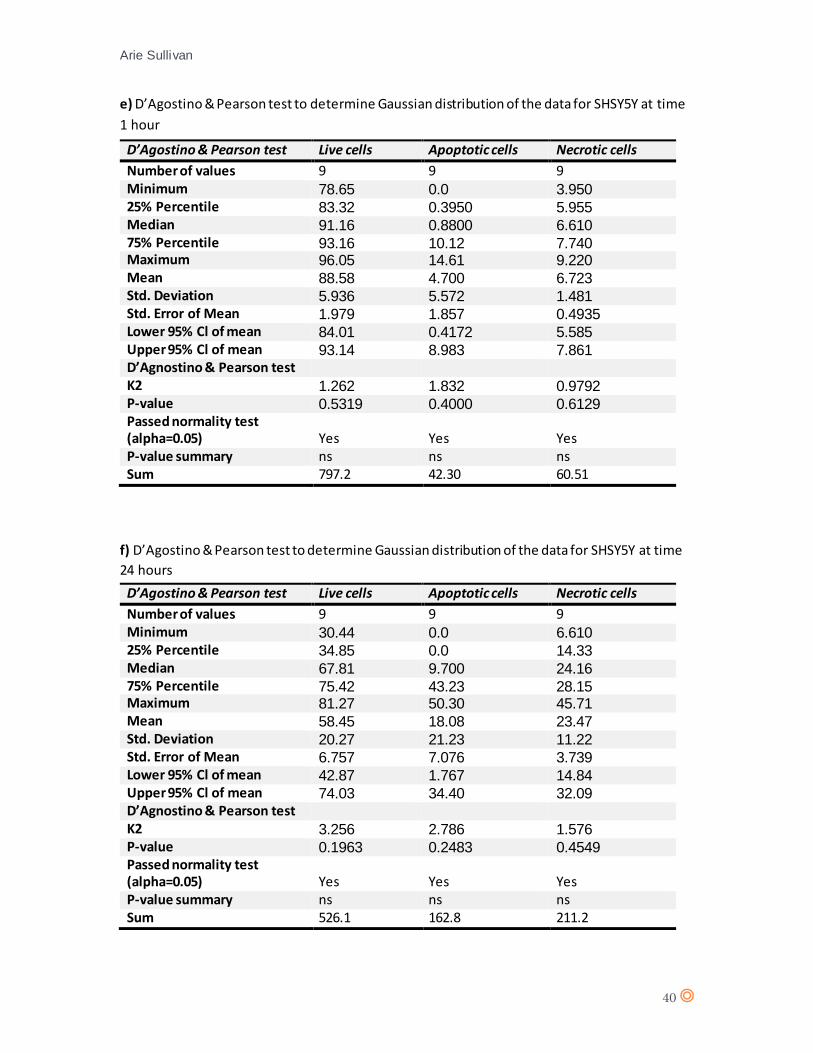
Arie Sullivan
40
e) D’Agostino & Pearson test to determine Gaussian distribution of the data for SHSY5Y at time
1 hour
f) D’Agostino & Pearson test to determine Gaussian distribution of the data for SHSY5Y at time
24 hours
D’Agostino & Pearson test Live cells Apoptotic cells Necrotic cells
Number of values 9 9 9 Minimum 78.65 0.0 3.950 25% Percentile 83.32 0.3950 5.955 Median 91.16 0.8800 6.610 75% Percentile 93.16 10.12 7.740 Maximum 96.05 14.61 9.220 Mean 88.58 4.700 6.723 Std. Deviation 5.936 5.572 1.481 Std. Error of Mean 1.979 1.857 0.4935 Lower 95% Cl of mean 84.01 0.4172 5.585 Upper 95% Cl of mean 93.14 8.983 7.861 D’Agnostino & Pearson test K2 1.262 1.832 0.9792 P-value 0.5319 0.4000 0.6129 Passed normality test (alpha=0.05) Yes Yes Yes P-value summary ns ns ns Sum 797.2 42.30 60.51
D’Agostino & Pearson test Live cells Apoptotic cells Necrotic cells
Number of values 9 9 9 Minimum 30.44 0.0 6.610 25% Percentile 34.85 0.0 14.33 Median 67.81 9.700 24.16 75% Percentile 75.42 43.23 28.15 Maximum 81.27 50.30 45.71 Mean 58.45 18.08 23.47 Std. Deviation 20.27 21.23 11.22 Std. Error of Mean 6.757 7.076 3.739 Lower 95% Cl of mean 42.87 1.767 14.84 Upper 95% Cl of mean 74.03 34.40 32.09 D’Agnostino & Pearson test K2 3.256 2.786 1.576 P-value 0.1963 0.2483 0.4549 Passed normality test (alpha=0.05) Yes Yes Yes P-value summary ns ns ns Sum 526.1 162.8 211.2
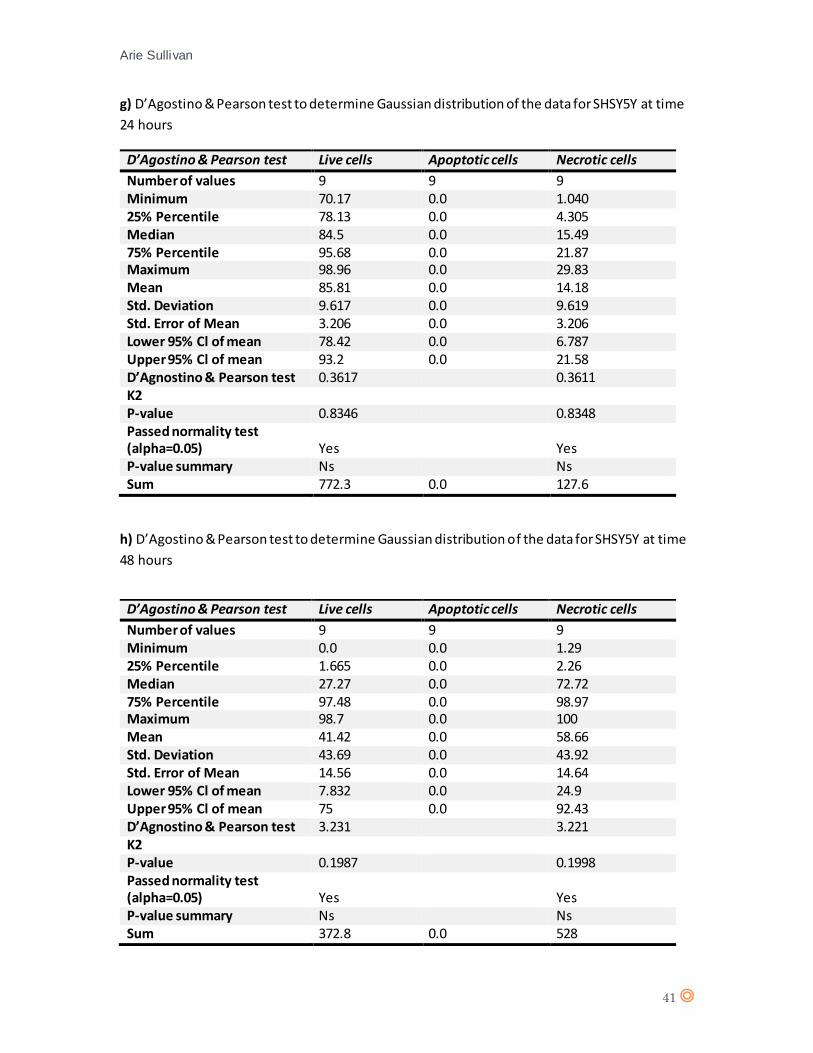
Arie Sullivan
41
g) D’Agostino & Pearson test to determine Gaussian distribution of the data for SHSY5Y at time
24 hours
h) D’Agostino & Pearson test to determine Gaussian distribution of the data for SHSY5Y at time
48 hours
D’Agostino & Pearson test Live cells Apoptotic cells Necrotic cells
Number of values 9 9 9 Minimum 70.17 0.0 1.040 25% Percentile 78.13 0.0 4.305 Median 84.5 0.0 15.49 75% Percentile 95.68 0.0 21.87 Maximum 98.96 0.0 29.83 Mean 85.81 0.0 14.18 Std. Deviation 9.617 0.0 9.619 Std. Error of Mean 3.206 0.0 3.206 Lower 95% Cl of mean 78.42 0.0 6.787 Upper 95% Cl of mean 93.2 0.0 21.58 D’Agnostino & Pearson test 0.3617 0.3611 K2 P-value 0.8346 0.8348 Passed normality test (alpha=0.05) Yes Yes P-value summary Ns Ns Sum 772.3 0.0 127.6
D’Agostino & Pearson test Live cells Apoptotic cells Necrotic cells
Number of values 9 9 9 Minimum 0.0 0.0 1.29 25% Percentile 1.665 0.0 2.26 Median 27.27 0.0 72.72 75% Percentile 97.48 0.0 98.97 Maximum 98.7 0.0 100 Mean 41.42 0.0 58.66 Std. Deviation 43.69 0.0 43.92 Std. Error of Mean 14.56 0.0 14.64 Lower 95% Cl of mean 7.832 0.0 24.9 Upper 95% Cl of mean 75 0.0 92.43 D’Agnostino & Pearson test 3.231 3.221 K2 P-value 0.1987 0.1998 Passed normality test (alpha=0.05) Yes Yes P-value summary Ns Ns Sum 372.8 0.0 528
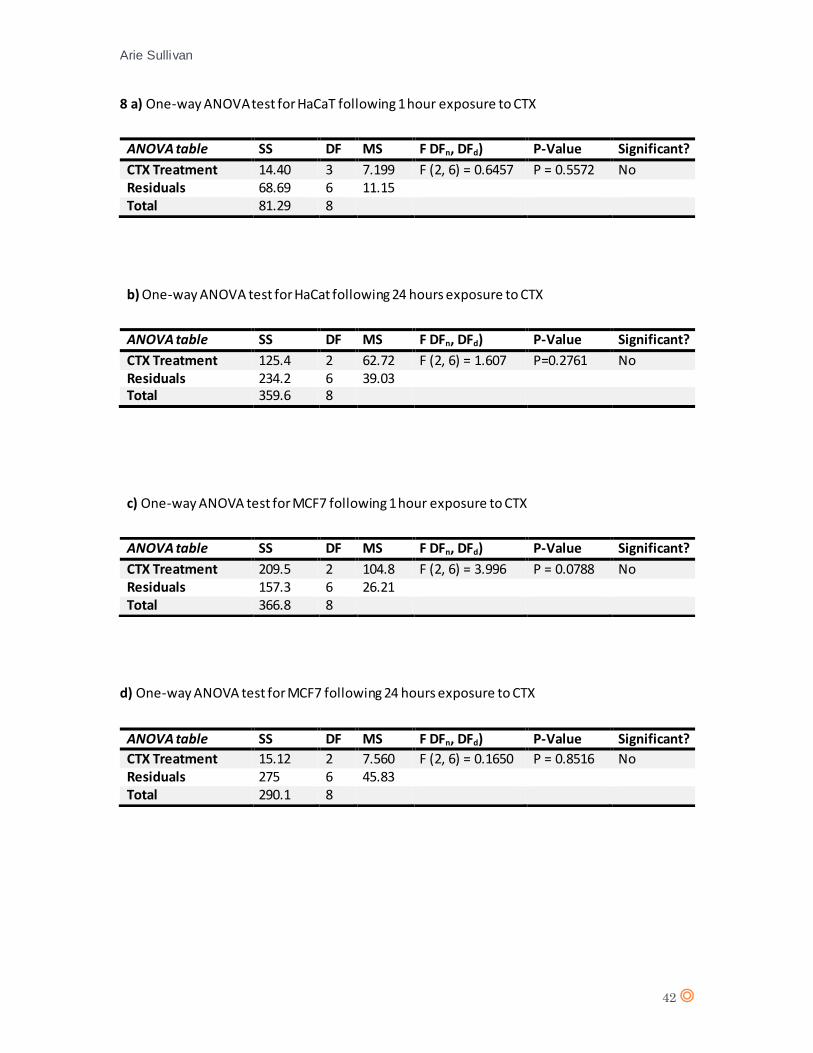
Arie Sullivan
42
8 a) One-way ANOVA test for HaCaT following 1 hour exposure to CTX
b) One-way ANOVA test for HaCat following 24 hours exposure to CTX
c) One-way ANOVA test for MCF7 following 1 hour exposure to CTX
d) One-way ANOVA test for MCF7 following 24 hours exposure to CTX
ANOVA table SS DF MS F DFn, DFd) P-Value Significant?
CTX Treatment 14.40 3 7.199 F (2, 6) = 0.6457 P = 0.5572 No Residuals 68.69 6 11.15 Total 81.29 8
ANOVA table SS DF MS F DFn, DFd) P-Value Significant?
CTX Treatment 125.4 2 62.72 F (2, 6) = 1.607 P=0.2761 No Residuals 234.2 6 39.03 Total 359.6 8
ANOVA table SS DF MS F DFn, DFd) P-Value Significant?
CTX Treatment 209.5 2 104.8 F (2, 6) = 3.996 P = 0.0788 No Residuals 157.3 6 26.21 Total 366.8 8
ANOVA table SS DF MS F DFn, DFd) P-Value Significant?
CTX Treatment 15.12 2 7.560 F (2, 6) = 0.1650 P = 0.8516 No Residuals 275 6 45.83 Total 290.1 8
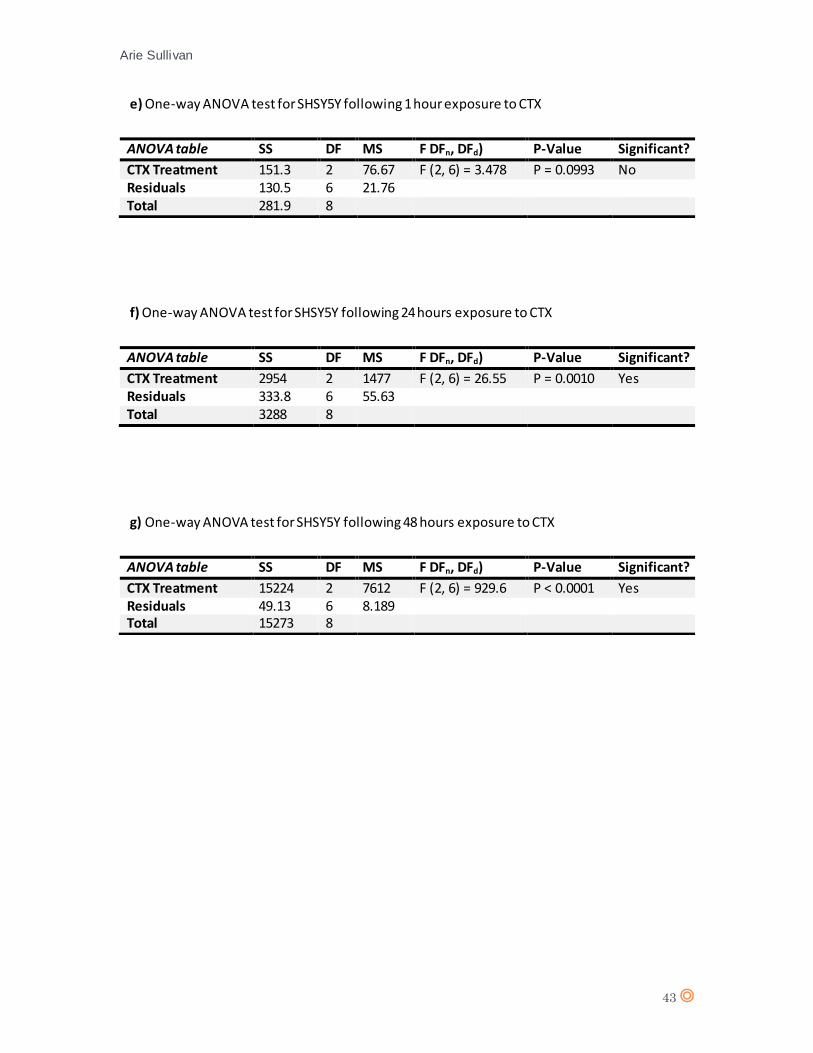
Arie Sullivan
43
e) One-way ANOVA test for SHSY5Y following 1 hour exposure to CTX
f) One-way ANOVA test for SHSY5Y following 24 hours exposure to CTX
g) One-way ANOVA test for SHSY5Y following 48 hours exposure to CTX
ANOVA table SS DF MS F DFn, DFd) P-Value Significant?
CTX Treatment 151.3 2 76.67 F (2, 6) = 3.478 P = 0.0993 No Residuals 130.5 6 21.76 Total 281.9 8
ANOVA table SS DF MS F DFn, DFd) P-Value Significant?
CTX Treatment 2954 2 1477 F (2, 6) = 26.55 P = 0.0010 Yes Residuals 333.8 6 55.63 Total 3288 8
ANOVA table SS DF MS F DFn, DFd) P-Value Significant?
CTX Treatment 15224 2 7612 F (2, 6) = 929.6 P < 0.0001 Yes Residuals 49.13 6 8.189 Total 15273 8
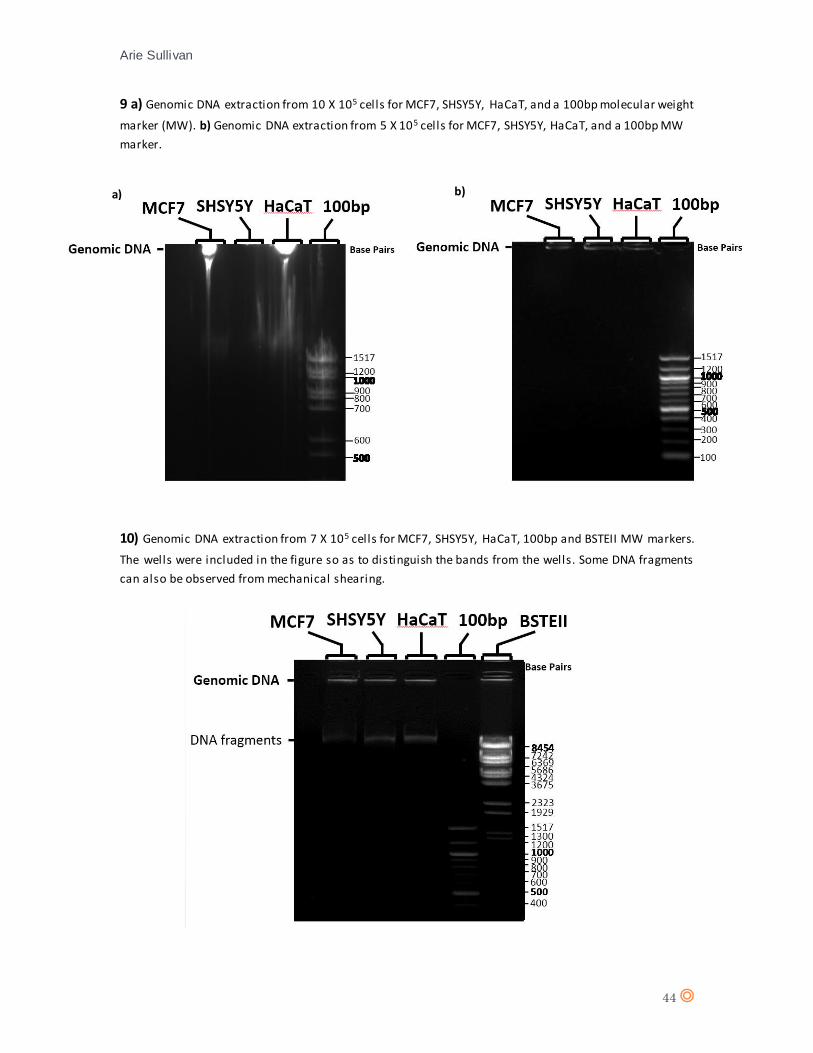
Arie Sullivan
44
9 a) Genomic DNA extraction from 10 X 105 cells for MCF7, SHSY5Y, HaCaT, and a 100bp molecular weight
marker (MW). b) Genomic DNA extraction from 5 X 10⁵ cells for MCF7, SHSY5Y, HaCaT, and a 100bp MW
marker.
10) Genomic DNA extraction from 7 X 10⁵ cells for MCF7, SHSY5Y, HaCaT, 100bp and BSTEII MW markers.
The wells were included in the figure so as to distinguish the bands from the wells. Some DNA fragments
can also be observed from mechanical shearing.
a) b)
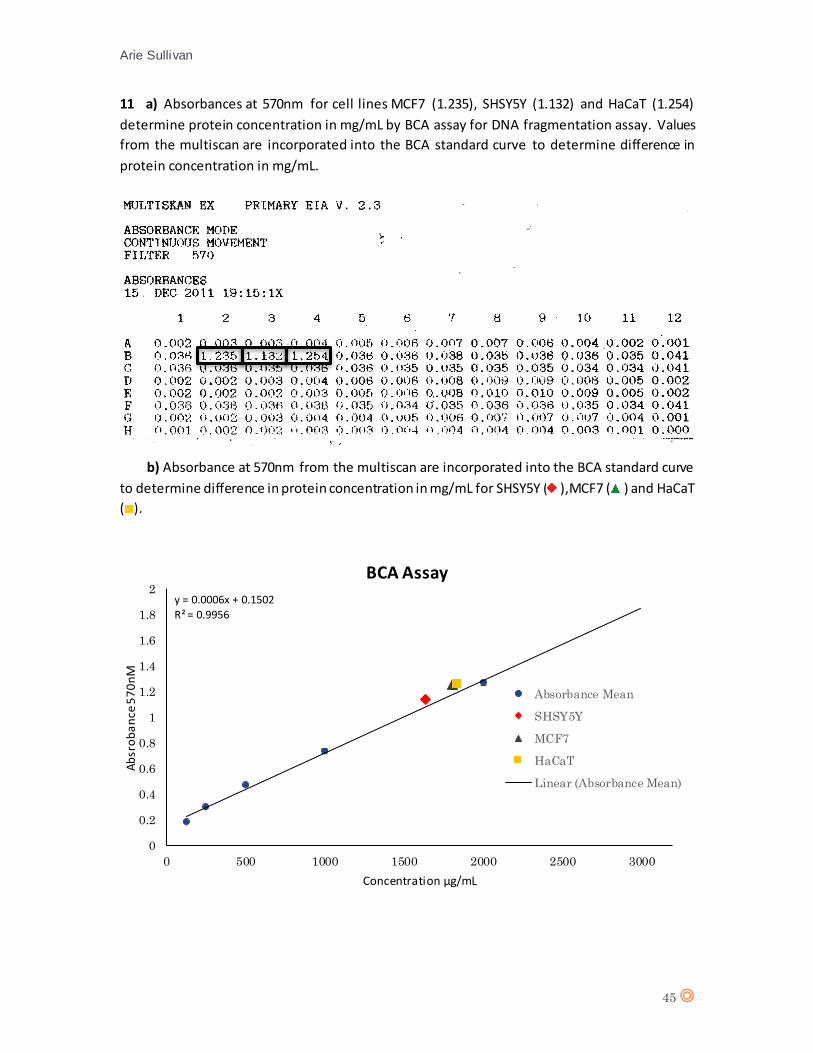
Arie Sullivan
45
11 a) Absorbances at 570nm for cell lines MCF7 (1.235), SHSY5Y (1.132) and HaCaT (1.254)
determine protein concentration in mg/mL by BCA assay for DNA fragmentation assay. Values
from the multiscan are incorporated into the BCA standard curve to determine difference in
protein concentration in mg/mL.
b) Absorbance at 570nm from the multiscan are incorporated into the BCA standard curve
to determine difference in protein concentration in mg/mL for SHSY5Y ( ),MCF7 ( ) and HaCaT
( ).
y = 0.0006x + 0.1502R² = 0.9956
0
0.2
0.4
0.6
0.8
1
1.2
1.4
1.6
1.8
2
0 500 1000 1500 2000 2500 3000
Ab
sro
ba
nce
57
0n
M
Concentration µg/mL
BCA Assay
Absorbance Mean
SHSY5Y
MCF7
HaCaT
Linear (Absorbance Mean)
Arie Sullivan
46
References
AKCAN, M., STROUD, M. R., HANSEN, S. J., CLARK, R. J., DALY, N. L., CRAIK, D. J. and OLSON, J.,
M. (2011) Chemical Re-engineering of Chlorotoxin Improves Bioconjugation Properties for Tumor
Imaging and Targeted Therapy. J. Med. Chem. 54(3), 782-787 DOI: 10.1012/jm101018r
AMOEDO, N. D., VALENCIA, J. P., RODRIGUES, M. F., GALINA, A. and RUMJANEK, F. D. (2013)
How Does the Metabolism of Tumor Cells Differ from that of Normal Cells. Biosci. Rep. 33(6)
e00080 DOI: 10.1042/BSR20130066
ANDREW, M. and OWEN, M. J. (1997) Hyperekplexia: Abnormal Startle Response due to Glycine
Receptor Mutations. Br. J. Psychiatry. 170, 106-108
ARZAMASOV, A. A., VASSILEVSKI, A. A. and GRISHIN, E. V. (2014) Chlorotoxin and Related
Peptides: Short Insect Toxins from Scorpion venom. Russian Journal of Bioorganic Chemistry.
40(4), 359-369 DOI: 10.1134/S1068162014040013
AVILA, A., VIDAL, P.M., DEAR, T. N., HARVEY, R. J., RIGO, J. M. and NGUYEN, L. (2013) Glycine
Receptor α2 Subunit Activation Promotes Cortical Interneuron migration . Cell. Rep. 4(4), 738-750
DOI: 10.1016/j.cellrep.2013.07.016
BLACKISTON, D. J., McLAUGHLIN, K. A. and LEVIN, M. (2009) Bioelectric Controls of Cell
Proliferation: Ion Channels, Membrane Voltage and the Cell Cycle. Cell. Cycle. 8(21), 3527-3536
BLANCHARD, S., BARWISE, J. L., GERKE, V. GOODALL, A., VAUGHAN, P. F. and WALKER, J. H.
(1996) Annexins in the Human Neuroblastoma SH-SY5Y: Demonstration of Relocation of
Annexins II and V to Membranes in Response to Elevation of Intracellular Calcium by Membrane
Depolarization and by the Calcium Ionophore A23187. J. Neurochem. 67(2), 805-813
BOBEK-BILLEWICZ, HEBDA, A., STASIK-PRES, G., MAJCHRZAK, K., ZMUDA, E. and TROJANOWSKA,
A. (2010) Measurement of Glycine in a Brain and Brain Tumors by Means of 1H MRS. Folia.
Neuropathol. 48(3), 130-139
BOYNTOPN, Z. L., KOON, J. J., BRENNAN, E. M., C<LOUART, J. D., HOROWITZ, D. M., GERNGROSS,
T. U. and HUISMAN, G. W. (1999) Reduction of Cell Lysate Viscosity during Processing of Poly(3-
Hydroxyalkanoates) by Chromosomal Integration of the Staphylococcal Nuclease Gene in
Pseudomonas Putida. Appl. Enviorn. Mircobiol. 65(4), 1524-1529
BRITTON, F. C., HATTON, W. J., ROSSOW, C> F., DUAN, D., HUME, J., R. and HORROWITZ, B.
(2000) Molecular Distribution of Volume-regulated Chloride Channels (ClC-2 and ClC-3) in Cardiac
Tissues. Am. J. Physiol. Heart. Circ. Physiol. 279(5), H2225-33
Arie Sullivan
47
BROWN, N. H. (2011) Extracellular Matrix in Development: Insights from Mechanisms Conserved
between Invertebrates and Vertebrates. Cold Spring Harb. Perspect. Biol. 3(12), p: 1005082 DOI:
10.1101/cshperspect.a005082
BRUNETTI, V., MAIORANO, G., RIZELLO, L., SORCE, B., SABELLA, S., CINGOLANI, R. and POMPA, P.
P. (2010) Neurons Sense Nanoscale Roughness with Nanometer Sensitivity . Proc. Natl. Acad.
USA. 107(14), 6264-6269 DOI: 10.1073/pnas.0914456107
BUTTE, P. V., MAMELAK, A., PARRISH-NOVAK, J., DRAZIN, D., SHWEIKEH, F., GANGALUM, P. R.,
CHESNOKOVA, A., LJUBIMOVA, J. Y. and BLACK, K. (2014) Near-Infrared Imaging of Brain Tumors
Using the Tumor Paint BLZ-100 to Achieve Near-Complete Resection of Brain Tumors. Neurosurg.
Focus. 36(2), p: E1 DOI: 10.3171.2013.11.FOCUS13497
CANNON, C. S. (2006) Channelopathies of the Nervous System. Prin. Mol. Med. Pp-1088-1096
CATALANI, S., CARBONARO, V., PALMA, F., ARSHAKYAN, M., GALATI, R., NUVOLI, B., BATTISTELLI,
S., CANESTRARI, F. and BENEDETTI, S. (2013) Metabolism Modifications and Apoptosis Induction
after Cellfood™ Administration to Leukemia Cell Lines. J. Exp. Clin. Cancer. Res. 32(1), p: 63 DOI:
10.1186/1756-9966-32-63
CHEN, M. J., SEPRAMANIAM, S., ARMUGAM, A., CHOY, M. S., MANIKANDAN, J., MELENDEZ, A. J.,
JEYASEELAN, K. and CHEUNG, N. S. (2008) Water Ion Channels: Crucial in the Initiation and
Progression of Apoptosis in Central Nervous System. Curr. Neuropharmacol. 6(2), 102-116 DOI:
10.2174/157015908784533879
CHENG, Y., ZHAO, J., QIAO, W. and CHEN, K. (2014) Recent Advances in Diagnosis and Treatment
of Gliomas Using Chlorotoxin-based Bioconjugates. Am. J. Nucl. Mol. Imaging. 4(5), 384-405
COSTA, P.M., CASDOSO, A. L., MENDOCA, L. S., SERANI, A., CUSTODIA, C., CONCEICAO, M.,
SIMOES, S., MOREIRA, J. N., PEREIRA de ALMEIDA, L. and PEDROSO de LIMA, M. (2013) Tumor-
targeted Chlorotoxin-coupled Nanoparticles for Nucleic Acid Delivery to Glioblastoma Cells: A
Promising System for Glioblastoma Treatment. Mol. Ther. Nucleic Acids. 2, p: e100 DOI:
10.1038/mtna.2013.30
DARDEVET, L., RANI, D., AZIZ, T. A. E., BAZIN, I., SABATIER, J.M., FADI, M., BRAMBILLA, E. and
WAARD, M. D. (2015) Chlorotoxin: A Helpful Natural Scorpion Peptide to Diagnose Glioma and
Fight Tumor Invasion. Toxins. 7(4), 1079-1101 DOI: 10.3390/toxins7041079
DAS GUPTA, S., DEBNATH, A., SAHA, A., GIRI, B., TRIPATHI, G., VEDASIROMONI, J. R. and GOMES,
A. (2007) Indian Black Scorpion (Heterometrus bengalensis Koch) Venom Induced
Antiproliferative and apoptogenic Activity Against Human Leukemic Cell Lines U937 and K562.
Leuk. Res. 31(6), 817-825
DEBIN, J. A. and STRICHARTZ G. R. (1991) Chloride Channel Inhibition by the Venom of the
Scorpion Leiurus Quinquestriatus. Toxicon. 29(11), 1403-1408
Arie Sullivan
48
DEBIN, J. A., MAGGIO, J. E. and STRICHARTZ, G. R. (1993) Purification and Characterization of
Chlorotoxin, a Chloride Channel Ligand from the Venom of the Scorpion . Am. J. Physiol. 264(2 Pt
10:C361-9
DENDER, D. G., HECK, N., RIEDEMANN, T., WHITE, R., KILB, W. and LUHMANN, H. J. (2010)
GABAC Receptors are Functionally Expressed in the Intermediate Zone and Regulate Radial
Migration in the Embryonic Mouse Neocortex . Neuroscience. 167, 124-134 DOI: 10.1016/j.
neuroscience.2010.01.049
DERYUGINA, E.I. and BOURDON, M. A. (1996) Tenascin Mediates Human Glioma Cell Migration
and Modulates Cell Migration on Fibronectin. J. Cell. Sci. 109 (Pt3), 643-652
DESHANE, J., GARNER, C. C. and SONTHEIMER, H. (2002) Chlorotoxin Inhibits Glioma Cell
Invasion via Matrix Metalloproteinase-2. J. Biol. Chem. 278, 4235-4144 DOI:
10.1074/jbc.M205662200
DURAN, C., THOMPSON, C. H., XIAO, Q. and HARTZELL, H. C. (2010) Chloride Channels: Often
Enigmatic, Rarely Predictable. Annu. Rev. Physiol. 72, 95-121.
EMONARD, H., BELLON, G., TROEBERG, L., BERTON, A., ROBINET, A., HENRIET, P., MARBAIX, E.,
KIRKEGAARD, K., PATTHY, L., EECKHOUT, Y., NAGASE, H., HORNEBECK, W., COURTOY, P. J. (2004)
Low Density Lipoprotein Receptor-related Protein Mediates Endocytic Clearance of pro-MMP-
2.TIMP-2 Complex Through a Thrombospondin-independent Mechanism. J. Biol. Chem. 279(52),
54944-54951
FAN, S., SUN, Z., JIANG, D., DAI, C., MA, Y., ZHAO, Z., LIU, H., WU, Y., CAO, Z. and LI, W. (2010)
BmKCT Toxin Inhibits Glioma Proliferation and Tumor Metastasis. Cancer Letters. 291(2), 158-
166 DOI: 10.1016/j.canlet.2009.10.011
FORSTERA, B., DZAYE, O. D., WINKELMANN, A., SEMTNER, M., BENEDETTI, B., MARKOVIC, D. S.,
SYNOWITZ, M., WEND, P., FAHLING, M., JUNIER, M. P., GLASS, R., KETTENMANN, H. and MEIER,
J. C. (2014) Intracellular Glycine Receptor Function Facilitates Glioma Formation in Vivo. J. Cell.
Science. DOI: 10.1242/jcs.146662
GALAGHER, J. D., FAY, M. J., NORTH, W. G., and McCANN, F. V. (1996) Ionic Signals in T47D
Human Breast Cancer Cells. Cell Signal. 8(4), 279-284
GAO, L., YU, S., WU, Y. and SHAN, B. (2007) Effect of Spider Venom on Cell Apoptosis and
Necrosis Rates in MCF-7 Cells. DNA Cell Biol. 26(7), 485-489.
GOUDET, C., CHI, C. W. and TYTGAT, J. (2002) An Overview of Toxins and Genes from the Venom
of the Asian Scorpion Buthus martensii Karsch. Toxicon. 40, 1239-1258
Arie Sullivan
49
HAGBERG, A., BARBANY, G., KROOK, H., SAMIOTAKI, M. and LANDERGREN, U. (2000) Expression
Profiling Accross Many Samples via Manifold-assisted mRNA Processing. Nucleic acids Res.
28(11): e54
HARTZELL, C., PUTZIER, I. and ARREOLA, J. (2005) Calcium-activated Chloride Channels. Annu.
Rev. Physiol. 67, 719-758
HMED, B., SERRIA, H. T. and MOUNIR, Z., K. (2013) Scorpion Peptides: Potential Use for New
Drug Development. J. Toxicol. 2013, 958797 DOI: 10.1155/2013/958797
HONG, S., BI, M., WANG, L., KANG, Z., LING, L. and ZHAO, C. (2014) CLC-3 Channels in Cancer.
Onc. Report.507-514 DOI: 10.3892/or.2014.3615
KASAI, T., NAKAMURA, K., VAIDYANATH, A., CHEN, L., SEKHAR, S., EL-GHLBAN, S., OKADA, M.,
MIZUTANI, A., KUDOH, T., MRAKAMI, H. and SENO, M. (2012) Chlorotoxin Fused to IgG-Fc
Inhibits Glioblastoma Cell Motility via Receptor-mediated Endocytosis. J. Drug. Deliv. 975763
DOI: 10.1155/2012/975763
KESAVAN, K., RATLIFF, J., JOHNSON, E. W., DAHLBERG, W., ASARA, J. M., MISRA, P., FRANGIONI,
J. V. and JACOBY, D. B. (2010) Annexin A2 is a Molecular Target for TM601, a Peptide with
Tumor0targeting and Anti-angiogenic Effects. J. Biol. Chem. 285(7), 4366-4374 DOI:
10.1074/jbc.M109.066092
KIM, H., ZHENG, S., AMINI, S. S., VIRK, S. M., MIKKELSEN, T., BRAT, D. J., GRIMSBY, J., SOUGNEZ,
C., MULLER, F., HU, J., SLOAN, A. E., COHEN, M. L., VAN MEIR, E. G., SCARPACE, L., LAIRD, P. W.,
WEINSTEIN, J. N., LANDER, E. S., GABRIEL, S., GETZ, G., MEYERSON, M., CHIN, L., BARNHOLTZ-
SLOAN, J. S. and VERHAAK, R. G. (2015) Whole-Genome and Multisector Exome Sequencing of
Primary and Post-Treatment Glioblastoma Reveals Patterns of Tumour Evolution. Genome. Res.
25(3), 316-327 doi: 10.1101/gr.180612.114
KIM, M. J., CHENG, G. and AGRAWAL D. K. (2004) Cl- Channels are Expressed in Human Normal
Monocytes: A Functional Role in Migration, Adhesion and Volume Change. Clin. Exp. Immunol.
138(3), 453-459
KIM, Y. S., LEE, H. A., LIM, J. Y., KIM, Y., JUNG, C. H., YOO, S. H. and KIM, Y. (2014) β-Carotene
Inhibits Neuroblastoma Cell Invasion and Metastasis in vitro and in vivo by Decreasing Level of
Hypoxia-inducible Factor-1α. J. Nutr. Biochem. 25(6), 655-664 DOI:
10.1016/j.jnutbio.2014.02.006
KRIEGSTEIN A. and ALVAREZ-BUYLLA, A. (2009) The Glial Nature of Embryonic and Adult Neural
Stem Cells. Annual Review if Neuroscience. 32, 149-184 DOI:
10.1146/annurev.neuro.051508.135600
Arie Sullivan
50
KWIATKOWSKA, A. and SYMONS, M. (2013) Signaling Determinants of Glioma Cell Invasion. Adv.
Exp. Biol. 986, 121-141 DOI: 10.1007/978-94-007-4719-7_7
LANIADO, M. E., FRASER, S. P. and DJAMGOZ, M. B. (2001) Voltage-gated K(+) Channel Activity in
Human Prostate Cancer Cell Lines of Markedly Different Metastatic Potential: Distinguishing
Characteristics of PC-3 and LNcaP cells. Prostate. 46(4), 262-274
LI, W., LI, Y., ZHAO, Y., YUAN, J. and MAO, W. (2014) Inhibition Effects of Scorpion Venom
Extracts (Buthus martensii Krasch) on the Growth of Human Breast Cancer MCF-7 Cells. Afr. J.
Tradit. Complement. Alter. Med. 11(5), 105-110
LISAL, J. and MADUKE, M. (2009) Proton-coupled Gating in Chloride Channels. Roy. Soc. Pub.
364(1514) DOI: 10.1098/rstb.2008.0123
LYNCH, W. J. (2004) Molecular Structure and Function of the Glycine Receptor Chloride Channel.
Physiol. Rev. 84(4), 1051-1095 DOI: 10.1152/physrev.00042.2003
LYONS, S. A., O’NEAL, J. and SONTHEIMER, H. (2002) Chlorotoxin, a Scorpion-Derived Peptide,
Specifically Binds to Gliomas and Tumors of Neuroectodermal Origin . Glia. 39(2), 162-173
MADUREIRA, P. A., HILL, R., MILLER, V. A., GIACOMANTONIO, C., LEE, P. W. and WAISMAN, D. M.
(2011) Annexin A2 is a Novel Cellular Redox Regulatory Protein Involved in Tumorigenesis .
Oncotarget. 2(12), 1075-1093
MAENO, E., ISHIZAKI, Y., KANASEKI, T., HAZAMA, A. and OKADA, Y. (2000) Normotonic Cell
Shrinkage Because Disordered Volume Regulation is an Early Prerequisite to Apoptosis . Proc.
Natl. Acad. Sci. pp: 9487-9492
MAERTENS, C., WEI, L., TYTGAT, J., DROOGMANS, G. and NILIUS, B. (2009) Chlorotoxin does not
Inhibit Volume-regulated, calcium-activated and cyclic AMP-activated chloride channels. B. J.
Pharm. 129(4), 791-801
MAI, J., FINLEY, R. L., WAISMAN, D. M. and SLOANE, B. F. (2000) Human Procathepsin B interacts
with the Annexin II Tetramer on the Surface of Tumor Cells. J. Biol. CHem. 275, 12806-12812
MANN, C. L., BORTHER, C. D., JEWELL, C. M. and CIDLOWSKI, J. A. (2001) Glucocorticoid-induced
Plasma Membrane Depolarizing During Thymocyte Apoptosis: Association with Cell Shrinkage
and Degradation of the Na(+)/K(+) adenosine Triphosphate. Endocrinology. 142(12), 5059-5068.
MAO, J., WANG, L., FAN, A., WANG, J., XU, B., JACOB, T. J. and CHEN, L. (2007) Blockage of
Volume-activated Chloride Channels Inhibits Migration of Nasopharyngeal Carcinoma Cells . Cell.
Physiol. Biochem. 19(5), 249-258
MATTSON, M. P. and CHAN, L. (2003) Calcium Orchestrates Apoptosis. Nature. Cell Biology. 5,
1041-1043 DOI: 10.1038/ncb1203-1041
Arie Sullivan
51
McFERRIN, M. B. and SONTHEIMER, H. (2006) A Role for Ion Channels in Glioma Cell Invasion.
Neuron. Glia. Biol. 2(1), 39-49 DOI: 10.1017/S17440925X06000044
McHUGH, K. (2007) Renal and Adrenal Tumors in Children. Cancer Imaging. 7(1), 41-51 DOI:
10.1102/1470-7330.2007.0007
MERZAK, A., McCREA, S., KOOCHEKPOUR, S. and PILKINGTON, G. J. (1994) Control of Human
Glioma Cell Growth, Migration and Invasion in Vitro by Transforming Growth Factor Beta 1. BR.
J. Cancer. 70(2), 199-203
MIYASAKI, K. (2002) Random DNA Fragmentation with Endonuclease V: Application to DNA
shuffling. Nucleic Acids Res. 30(24), p: e139
MORGUNOVA, E., TUUTILA, A., BERGMANN, U. and TRYGGVASON, K. (2002) Structural Insight
into the Complex Formation of Latent Matrix Metalloproteinase-2 with Tissue Inhibitor of
Metalloproteinase -2. Proc. Natl. Acad. USA. 99(11), 7414-7419
MORRISON, S. J., PEREZ, S. E., QIAO, Z., VERDI, J. M., HICKS, C., WEINMASTER, G. and
ANDERSON, D. J. (2000) Transient Notch activation initiates an Irreversible Switch from
Neurogenesis to Gliogenesis by Neural Crest Stem Cells. Cell. 101, 499-510
MUNSON, J., BONNER, M., FRIED, L., HOFMEKLER, J., ARBISER, J. and BELLAMKONDA, R. (2013)
Identifying New Small Molecule Anti-invasive Compounds for Glioma Treatment. Cell Cycle.
12(14), 2200-2209 DOI: 10.4161/cc.25334
NAGATA, S. (2000) Apoptotic DNA Fragmentation. Exp. Cell. Res. 256(1), 12-18
NAKADA, M., NAKADA, S., DEMUTH, T., RAN, N. L., HOELZINGER, D. B. and BERENS, M. E. (2007)
Molecular Targets of Glioma Invasion. Cell. Mol. Life. Sci. 64(4), 458-478
NIETSCH, H. H. ROE, M. W., FIEKERS, J. F., MOORE, A. L. and LIDOFSKY, S. D. (2000) Activation of
Potassium and Chloride Channels by Tumor Necrosis Alpha. Role in Liver Cell Death. J. Biol.
Chem. 275(27), 20556-20561
NIMMERVOLL, B., DENTER, D. G. SAVA, I., KILB, W. and LUHMANN, H., J. (2011) Glycine
Receptors Influence Radial Migration in the Embryonic Mouse Neocortex . Neuroreport. 22, 509-
513 DOI: 10.1097/WNR.obo13e32834Saafe
NOLTE, F., FRIEDRICH, O., ROJEWSKI, M., FINK, R. H., SCHREZENMEIER, H. and KORPER, S. (2004)
Depolarization of the Plasma Membrane in the Arsenic Trioxide (As2O3)- and anti-CD95-induced
Apoptosis in myeloid cells. FEBS. Lett. 578(1), 85-89
NUCCITELLI, S., CERELLA, C., CORDISO, S., ALBERTINI, M. C., ACCORSI, A., DeNICOLA, M.,
D’ALESSION, M., RADOGNA, F., MAGRINI, A., BERGAMASCHI, A. and GHIBELLI, L. (2006)
Arie Sullivan
52
Hyperpolarization of Plasma Membrane of Tumor Cells Sensitive to Anti-apoptotic Effects of
Magnetic Fields. Ann. N. Y. Acad. Sci. 1090, 217-225
OLSEN, M. L., SCHADE, S., LYONS, S. A., AMARAL, M. D. and SONTHEIMER, H. (2003) Expression
of Voltage-Gated Chloride Channels in Human Glioma Cells. J. Neurosci. 23(13), 5572-5582
PAULUS, W., BAUR, I., BEUTLER, A. S. and REEVES, S. A. (1996) Diffuse Brain Invasion of Glioma
Cells Requires beta 1 Integrins. Lab. Invest. 75(6), pp: 819-826
PAW, I., CARPENTER, R. C., WATABE, K., DEBINSKI, W. and LO, H. W. (2015) Mechanisms
Regulating Glioma Invasion. Cancer Letters. 362(1), 1-7 DOI: 10.1016/j.canlet.2015.03.015
PETRAT, F., BOENGLER, K., SCHULZ, R. and GROOT, H. (2012) Glycine, a Simple Physiological
Compound Protecting by yet Puzzling Mechanism(s) Against Ischemia-Reperfusion Injury: Current
Knowledge. Br. J. Pharmacol. 165(7), 2059-2071 DOI: 10.1111/j.1476-5381.2011.01711.x
RAO, V. R., PEREZ-NEUT, M., KAJA, S. and GENTILE, S. (2015) Voltage-Gated Ion Channels in
Cancer Cell Proliferation. Cancer. 7(2), 849-875 DOI: 10.3390/cancers7020813
REMACLE, A., MURPHY, G. and ROGHI, C. (2003) Membrane type-1matrix Metalloproteinase
(MT1-MMP) is Internalized by two Different Pathways and is Recycled to the Cell Surface. J. Cell.
Sci. 3905-3916
REUNANEN, N. and KAHARI, V. (2000) Matrix Metalloproteinases in Cancer Cell Invasion. Landes.
Bioscience
RIBATTI, D., MARIMPIETRI, D., PASTORINO, F., BRIGNOLE, C., NICO, B., VACCA, A. and PONZONI,
M. (2004) Angiogenesis in Neuroblastoma. Ann. N.Y. Acad. Sci. 1028, 133-142 DOI:
10.1196/annals.1322-014
ROSE, M. L., CATTLEY, R. C., DUNN, C., WONG, V., LI, X. and THHURMAN, R. G. (1999) Dietary
Glycine Prevents the Development of Liver Tumors Caused by the Peroxisome Proliferator WY-
14,643. Carcinogenesis. 20(11), 2075-2081
SAMBROOK, J. and RUSSEL, D. W. (2000) Fragmentation of DNA by Sonication. CSH. Protoc.
2006(4), pii.pdb.prot4538 DOI: 10.1101/pdb.prot4538
SCABO, I., LEPPLE-WIENHUES, A., KABA, K. N., ZORATTI, M., GUBLINS, E. and LANG, F (1998)
Tyrosine Kinase-dependent Apoptosis in T-lymphocytes. Proc. Natl. Acad. Sci. 95(11), 6169-74
SCHNITZER, J. E., OH, P., PINNEY, E. and ALLARD, J. (1994) Filipin-sensitive Caveolae-mediated
Transport in Endothelium: Reduced Transcytosis, Scavenger Endocytosis, and Capillary
Permeability of Select Macromolecules. J. Cell. Biol. 127(5), 1217-1232
SCHRAMEL, S. (2014) Structure – Function of Annexin A2 & A5. Duluth. J. Underg. Res. 108-111
Arie Sullivan
53
SCOTT, R. C. and HOLMES, G. L. (2012) Before Epilepsy Unfolds: Opening up the potassium Door
in Neonatal Seizures. Nature. Med. 18, 1624-1625 DOI: 10.1038/nm.2987
SONG, X., ZHANG, G., SUN, A., GUO, J., TIAN, Z., WANG, H. and LIU, Y. (2012) Scorpion Venom
Component III Inhibits Cell Proliferation by Modulating NF-κB Activation in Human Leukemia
Cells. Exp. Ther. Med.4, 146-150 DOI: 10.3892/etm.2012.548
SONHEIMER, H. (2009) An Unexpected Role for Ion Channels in Brain Tumor Metastasis . Exop.
Biol. Med. 233(7), 779-791 DOI: 10.3181/0711-MR-308
SONTHERIMER, H. (2004) Ion Channels and Amino Acid Transporters Support the Growth and
Invasion of Primary Brain Tumors. Mol. Neurobiol. 29(1), 61-71 DOI: 10.1385/MN:29:1:61
SOROCEANU, L., MANNING, T. J. Jr. and SONTHEIMER, H. Modulation of Glioma Cell Migration
and Invasion Using Cl(-) and K(+) Ion Channel Blockers. J. Neurosci. 19(14), 5942-5954
SRINIVASAN, K.N., GOPALAKRISHNAKONE, P., TAN, P. T., CHEW, K. C., CHENG, B., KINI, R. M.,
KOH, J. L., SEAH, S. H. and BRUSIC, V. (2002) SCORPION, a Molecular Database of Scorpion
Toxins. Toxicon. 40(1), 23-31
STERNLIGHT, M. D. and WERB, Z. (2009) How Matrix Metalloproteinases Regulate Cell Behavior.
Annu. Rev. Cell. Dev. Biol. 17, 463-516 DOI: 10.1146/annurev.cellbio.17.1.463
STROUD, M. R., HANSEN, S. J. and OLSON, J. M. (2012) In Vivo Bio-imaging Using Chlorotoxin-
based Conjugates. Curr. Pharm. Des. 17(38), 4362-4371
SZABO, I., LEPPLE-WIENHUES, A., KABA, K. N., ZORATTI, M., GULBINS, E. and LANG, F. (1998)
Tyrosine Kinase-dependent activation of a chloride channel in CD95-induced Apoptosis in T
Lymphocytes. Proc. Natl. Acad. 95, pp: 6169-6174
TATENHORST, L., RESCHER, U., GERKE, V. and PAULUS, W. (2006) Knockdown of Annexin 2
Decreases Migration of Human Glioma Cells in Vitro. Neuropathol. Appl. Neurobiol. 32(3), 271-
277
TSAI, C. H., YANG, S. H., CHIEN, C. M., LU, M. C., LO, C. S., LIN, Y. H., HU, X. W. and LIN, S. R.
(2006) Mechanism of Cardiotoxin III-induced Apoptosis in Human Colorectal Cancer COLO205
Cells. Clinical and Experimental Pharmacology and Physiology. 33(3), 177-182.
DOI:10.1111/j.1440-1681.2006.04334.x
TYSNES, B. B., LARSEN, L F., NESS, G. O., MAHESPARAN, R., EDVARDSEN, K., GARCIA-CABRERA, I.
and BJERKVIG, R. (1996) Stimulation of Glioma-cell Migration by Laminin and Inhibition by Anti-
alpha3 and anti-beta1 Integrin Antibodies. Int. J. Cancer. 67(6), 777-784
Arie Sullivan
54
UEKITA, T., ITOH, Y., YANA, I., OHNO, H and SEIKI, M. (2001) Cytoplasmic Tail-independent
Internalization of Membrane type 1 Matrix Metalloproteinase is Important for its Invasive-
promoting activity. J. Cell. Biol. 155(7), 1345-1356 DOI: 10.1083/jcb.200108112
VAN den EYNDN, J., ALI, S. S., HORWOOD, N., CARMANS, S., BRONE, B., HELLINGS, N., STEELS, P.,
HARVEY, R. J. and RIGO, J. M. (2009) Glycine and Glycine Receptor Signaling in Non-Neuronal
Cells. Front. Mol. Neurosci. 2, 9 DOI: 10.3389/neuro.02.009.2009
VAN der HEIDEN, M. G., CANTLEY, L. C. and THOMSPON, C. B. (2009) Understanding the
Warburg Effect: The Metabolic Requirements of Cell Proliferation. Science. 324(5930), 1029-
1033 DOI: 10.1126/science.1160809
VEISEH, M., GABIKIAN, P., BAHRAMI< S. B., VEISEH, O., ZHANG, M., HACKMAN< R. C.,
RAVANPAY, A. C., STROUD, M. R., KUSUMA, Y., HANSEN, S. J., KWOK, D., MUNOZ, N. M., SZE, R.
W., GRADY, W. M., GREENBERG, N. M., ELLENBOGEN, R. G. and OLSON, J. M. (2007) Tumor
Paint: A Chlorotoxin:Cy5.5 Bioconjugate for Intraoperative Visualization of Cancer Foci. Cancer.
Res. 67(14), 6882-6888
VEISEH, O., GUNN, J. W., KIEVIT, F., SUN, C. and FANG, C. (2009) Inhibition of Tumor Cell Invasion
with Chlorotoxin-Bound Superparamagnetic Nanoparticles. HHS. Small. 5(2), 256-264 DOI:
10.1002/smll.200800646
VEISEH, O., GUNN, J. W., KIEVIT, F. M., SUN, C., FANG, C., LEE, J. S. and ZHANG, M. (2009)
Inhibition of Tumor-cell Invasion with Chlorotoxin-bound Superparamagnetic Nanoparticles.
Small. 5(2), 256-264 DOI: 10.1002/smll.200800646
WANG, C. Y. and LIN, C. F. (2014) Annexin A2: Its Molecular Regulation and Cellular Expression in
Cancer Development. Disease Markers. Vol 2014, Article ID: 308976
WANG, M., WANG, T., LIU, S., YOSHIDA, D. and Teramoto, A. (2003) The Expression of Matrix
Metalloproteinase-2 and -9 in Human Gliomas of Different Pathological Grades. Brain . Tumor.
PAthol. 20(2), 65-72
WEBB, T. I. and LYNCH, J. W. (2007) Molecular Pharmacology of the Glycine Receptor Chloride
Channel. Curr. Pharm. Des. 13(23), 2350-2367
WEI, L., XIAO, A. Y., JIN, C., YANG, A. LU, Z. Y. and YU, S. P. (2004) Effects of Chloride and
Potassium Channel Blockers on Apoptotic Cell Shrinkage and Apoptosis in cortical Neurons .
Plugers. Arch. 448(3), 325-334
XIONG, W., CHEN, S. R., HE, L., CHENG, K., ZHAO, Y. L., CHEN, H., LI, D. P., HOMANIACS, G. E.,
PEEVER, J., RICE, K. C., WU, L. G., PAN., H. L. and ZHANG, L. (2014) Presynaptic Glycine receptors
as a Potential Therapeutic Target for Hyperekplexia Disease. Nat. Neurosci. 17(2), 232-239 DOI:
10.1038/nn.3615
Arie Sullivan
55
YAO, D. F., ZHANG, H. J., YAO, M., HUANG, H., WANG, L., YAN, M. J., YAN, X. D., GU, X., WU, W.
and LU, S. L. (2013) Annexin A2 Silencing Inhibits invasion, migration, and tumorigenic Potential
of Hepatoma Cells. World. J. Gastroenterol. 19(24), 3792-3801 DOI: 10.3748/wjg.v19.i24.3792
YUKL, S. A., KAISER, P., KIM, P., LI, P. and WONG, J. K. (2014) Advantages of Using the
QIAshredder instead of Restriction digestion to prepare DNA for droplet digital PCR.
Biotechniques. 56(4), 194-196 DOI: 10.2144/000114159
ZARGAN, J., SAJAD, M., UMAR, S., NAIME, M., ALI, S. and KHAN, H. A. (2011) Scorpion
(Odontobuthus doriae) Venom Induces Apoptosis and Inhibits DNA Synthesis in Human
Neuroblastoma Cells. Mol. Cell. Biochem. 348(1-2), 173-181. DOI: 10.1007/s11010-010-0652-x
ZEIDAN-CHULIA, F., GELAIN, D. P., KOLLING, E. A., RYBARCZYK-Filho, J.L., AMBROSI, P., TERRA, S.
R., PIRES, A., S., TEIXEIRAdaROCHA, J. B., BEHR, G. A. and MOREIRA,J. C. F. (2013) Major
Components of Energy Drinks (Caffeine, Taurine, and Guarana) Exert Cytotoxic Effects on Human
Neuronal SH-SY5Y Cells by Decreasing Reactive Oxygen Species Production. Oxid. Med. Cell.
Longev.2013, p: 791795
ZHANG, R., CUI, Y., ZHANG, X., YANG, Z., ZHAO, Y., SONG, Y., WU, C and ZHANG, J. (2010) Soluble
Expression, Purification and the Role of C-terminal Glycine Residues in Scorpion Toxin BmK AGP-
SYPU2. BMB. Rep. 43(12). 801-806 DOI: 10.5483/BMBRep.2010.43.12.801
ZHANG, W., ZHAO, P., XU, X. L., CAI, L., SONG, Z. S., CAO, D. Y., TAO, K. S., ZHOU, W. P., CHEN, Z.
N. and DOU, K. F. (2013) Annexin A2 Promotes the Migration and Invasion of Human
Hepatocellular Carcinoma Cells In Vitro by Regulating the Shedding of CD147-Harboring
Microvesicles from Tumor Cells. PLoS One. 8(8), p: e67268 DOI: 10.1371/journal.pone.0067268
ZHAO, Y. S., ZHANG, R., XU, Y., CUI, Y., LIU, Y.F., SONG, Y. B., ZHANG, H. X. and ZHANG, J. H.
(2013) The Role of Glycine Residues at the C-terminal Peptide Segment in Antinociceptive
Activity: a Molecular Dynamics Simulation. J. Mol. Model. 19)3), 1295-1299 DOI: 10.007/s00894-
012-1666-y
ZHIJIAN, C., FENG, L., YINGLIANG, W., XIN, M. and WENXIN, L. (2006) Genetic Mechanisms of
Scorpion Venom Peptide Diversification. Toxicon. 47, 348-355
ZHU, H., ZHENG, J., XIAO,X., ZHENG, S., DONG, K., LIU, J. and WANG, Y. (2010) Environmental
Endocrine Disruptors Promote Invasion and Metastasis of SK-N-SH Neuroblastoma Cells. Oncol.
Rep. 23(1), 129-139