renewable roundup americas/united states equity research
TRANSCRIPT
DISCLOSURE APPENDIX AT THE BACK OF THIS REPORT CONTAINS IMPORTANT DISCLOSURES, ANALYST CERTIFICATIONS, LEGAL ENTITY DISCLOSURE AND THE STATUS OF NON-US ANALYSTS. US Disclosure: Credit Suisse does and seeks to do business with companies covered in its research reports. As a result, investors should be aware that the Firm may have a conflict of interest that could affect the objectivity of this report. Investors should consider this report as only a single factor in making their investment decision.
24 March 2017Americas/United States
Equity ResearchAlternative Energy
Renewable Roundup COMMENTResearch Analysts
Andrew Hughes212 325 8277
Maheep Mandloi212 325 2345
Things We Learned This WeekPricing declines appear headed towards free-fall levels. Module pricing is now off 4-5% YTD, and, according to our checks, headed towards the low $0.30/W range in the US by 3Q17. Integrated manufacturer/developer stocks are taking the news particularly hard, down 11-18% this week with potentially more pricing and capacity pain in sight over the coming months.■ Running aground. Solar module prices dropped another 0.6% w/w to
$0.34-$0.37/Watt and are now down 4%-5% YTD versus a 2% YTD decline through the end of February. Prices in India are already as low as ~$0.33/W today, and our channel checks this week forecast multi module prices in the US in the low $0.30/watt range by 3Q17. This implies an additional 11-22% decline, and compares to manufacturer guidance for ~$0.35/W US ASPs in 2H17. Module manufacturers are catching a bit of a break as upstream wafer and cell prices have declined at a faster clip (down 6% the past month), which could drive down external sourcing costs.
■ Momentary capacity reprieve. Hanwha finally broke the streak of incremental production capacity announcements on Thursday, but only after Canadian Solar's announcement Tuesday that it would add 3 GW of incremental wafer and 2 GW of incremental cell capacity in 2017. Hanwha is instead opting to swap out existing multi capacity in favor of the mono-PERC flavor du jour. A brief moment of rationality notwithstanding, we have now tracked 5.7 GW of new wafer and 5.2 GW of new cell capacity additions this earnings season alone, in addition to multi-GW plans to convert multi capacity to mono capacity. And the pain will not stop here. Our channel checks are forecasting 15GW of incremental module capacity, 17GW of incremental cell capacity, and 22 GW of incremental wafer capacity added this year. Yikes.
■ There's always next year. GCL is planning to add 1GW of cell and module manufacturing capacity in India with Essel, the Indian government wants more PV manufacturers to setup shop on its home turf, and a Turkish developer plans to add 500 MW fully integrated PV capacity in the next two years. Not to be outdone, LONGi announced a 15/85 JV with Tongwei to establish 50K MT of polysilicon manufacturing capacity in China's Leshan city, equivalent to about 10 GW or 16% of current Tier-1 capacity. The first 25K MT is expected to come online by 2018. The facility is located close to hydropower to keep electricity costs (30-40% of production cost) low.
■ AIC on TAP. We are hosting CSIQ, HQCL, and AZRE at our Asia Investment Conference (AIC) in Hong Kong next week (March 27-30). Please reach out to your sales rep for the latest agenda. In advance of the conference, we have included a list of questions in this note. Please reach out us if you would like to discuss anything further.
24 March 2017
Renewable Roundup 2
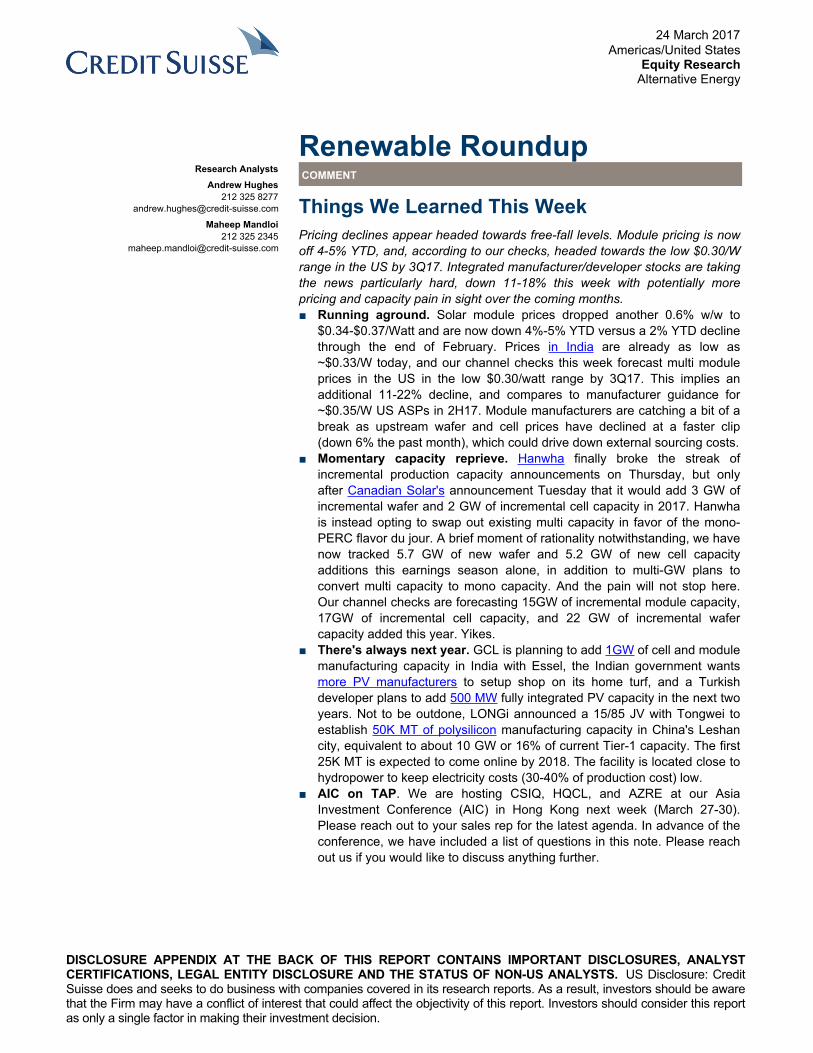
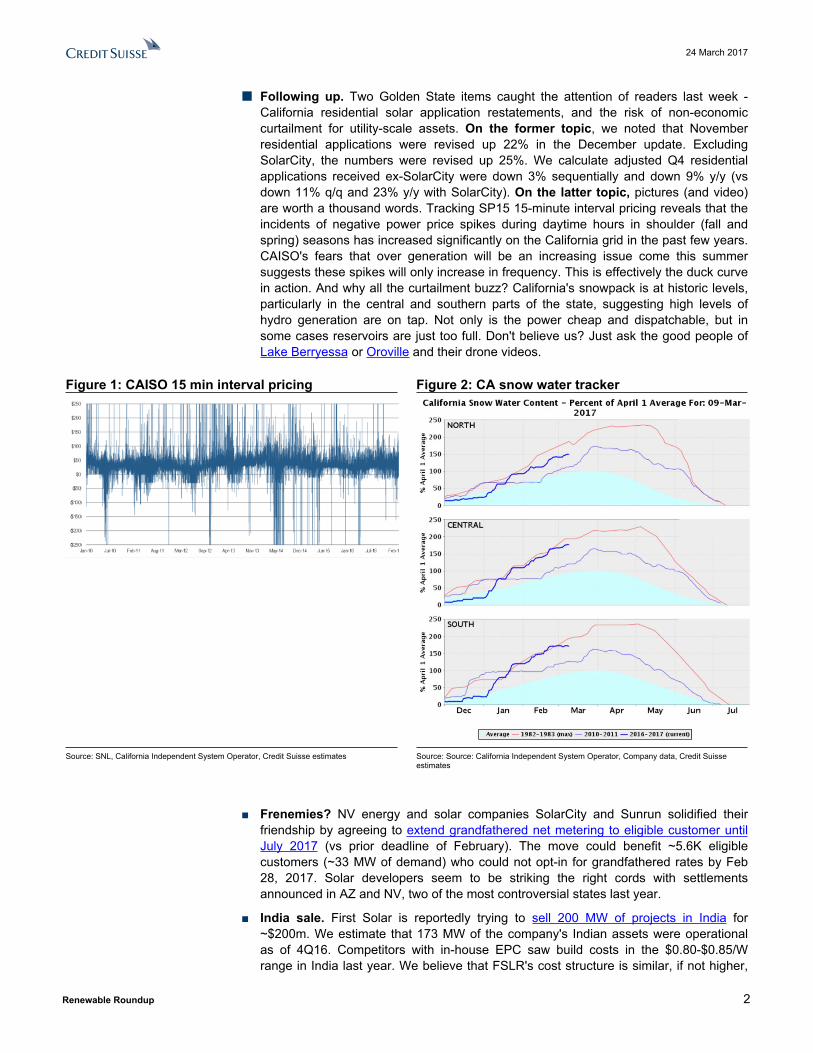
■ Following up. Two Golden State items caught the attention of readers last week - California residential solar application restatements, and the risk of non-economic curtailment for utility-scale assets. On the former topic, we noted that November residential applications were revised up 22% in the December update. Excluding SolarCity, the numbers were revised up 25%. We calculate adjusted Q4 residential applications received ex-SolarCity were down 3% sequentially and down 9% y/y (vs down 11% q/q and 23% y/y with SolarCity). On the latter topic, pictures (and video) are worth a thousand words. Tracking SP15 15-minute interval pricing reveals that the incidents of negative power price spikes during daytime hours in shoulder (fall and spring) seasons has increased significantly on the California grid in the past few years. CAISO's fears that over generation will be an increasing issue come this summer suggests these spikes will only increase in frequency. This is effectively the duck curve in action. And why all the curtailment buzz? California's snowpack is at historic levels, particularly in the central and southern parts of the state, suggesting high levels of hydro generation are on tap. Not only is the power cheap and dispatchable, but in some cases reservoirs are just too full. Don't believe us? Just ask the good people of Lake Berryessa or Oroville and their drone videos.
Figure 1: CAISO 15 min interval pricing Figure 2: CA snow water tracker
Source: SNL, California Independent System Operator, Credit Suisse estimates Source: Source: California Independent System Operator, Company data, Credit Suisse estimates
■ Frenemies? NV energy and solar companies SolarCity and Sunrun solidified their friendship by agreeing to extend grandfathered net metering to eligible customer until July 2017 (vs prior deadline of February). The move could benefit ~5.6K eligible customers (~33 MW of demand) who could not opt-in for grandfathered rates by Feb 28, 2017. Solar developers seem to be striking the right cords with settlements announced in AZ and NV, two of the most controversial states last year.
■ India sale. First Solar is reportedly trying to sell 200 MW of projects in India for ~$200m. We estimate that 173 MW of the company's Indian assets were operational as of 4Q16. Competitors with in-house EPC saw build costs in the $0.80-$0.85/W range in India last year. We believe that FSLR's cost structure is similar, if not higher,
24 March 2017
Renewable Roundup 3
given that any in-house module supply benefits are likely offset by higher outsourced construction costs. The implied sale price of $1/W equates to project level gross margin of ~15%-20% (including modules and components), which is in-line with our expectations of total gross margins for the company in '17 and beyond.
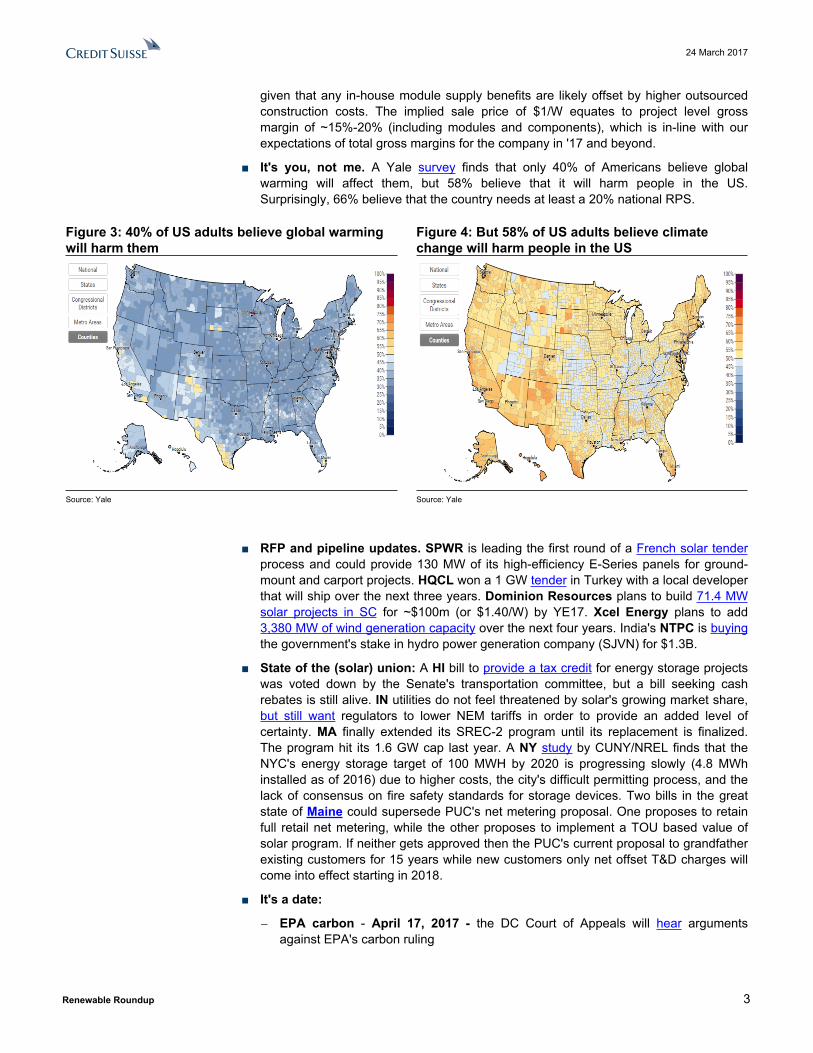
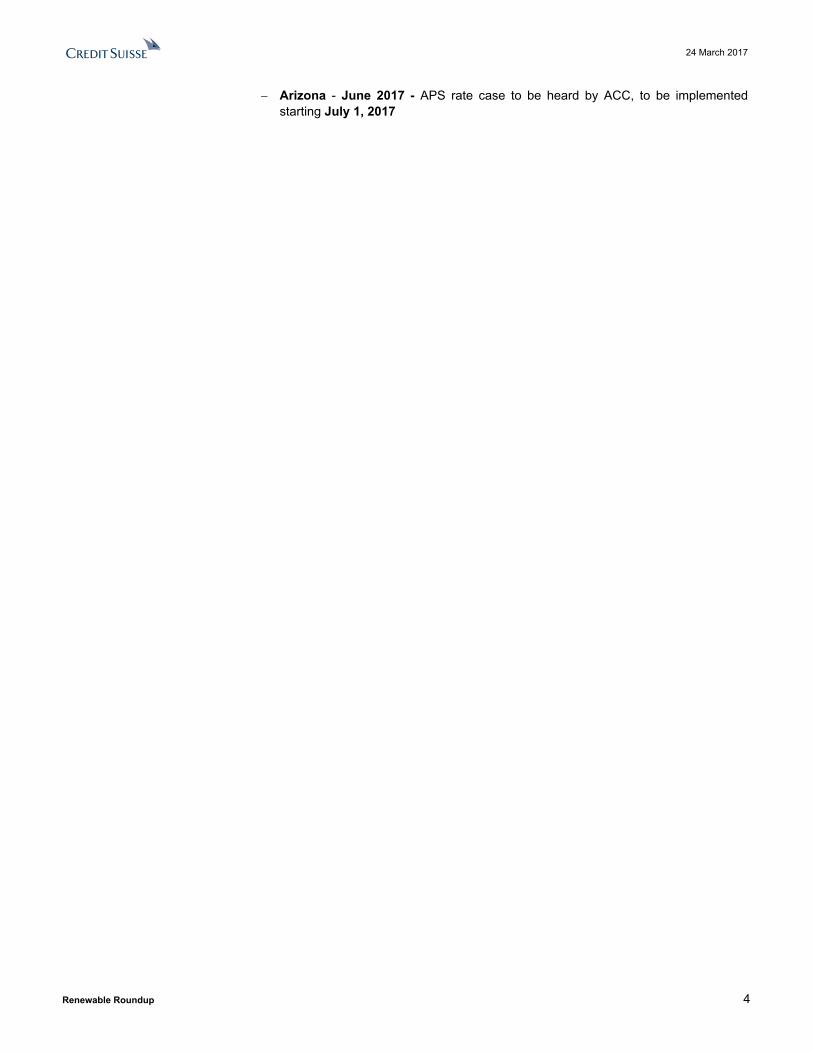
■ It's you, not me. A Yale survey finds that only 40% of Americans believe global warming will affect them, but 58% believe that it will harm people in the US. Surprisingly, 66% believe that the country needs at least a 20% national RPS.
Figure 3: 40% of US adults believe global warming will harm them
Figure 4: But 58% of US adults believe climate change will harm people in the US
Source: Yale Source: Yale
■ RFP and pipeline updates. SPWR is leading the first round of a French solar tender process and could provide 130 MW of its high-efficiency E-Series panels for ground-mount and carport projects. HQCL won a 1 GW tender in Turkey with a local developer that will ship over the next three years. Dominion Resources plans to build 71.4 MW solar projects in SC for ~$100m (or $1.40/W) by YE17. Xcel Energy plans to add 3,380 MW of wind generation capacity over the next four years. India's NTPC is buying the government's stake in hydro power generation company (SJVN) for $1.3B.
■ State of the (solar) union: A HI bill to provide a tax credit for energy storage projects was voted down by the Senate's transportation committee, but a bill seeking cash rebates is still alive. IN utilities do not feel threatened by solar's growing market share, but still want regulators to lower NEM tariffs in order to provide an added level of certainty. MA finally extended its SREC-2 program until its replacement is finalized. The program hit its 1.6 GW cap last year. A NY study by CUNY/NREL finds that the NYC's energy storage target of 100 MWH by 2020 is progressing slowly (4.8 MWh installed as of 2016) due to higher costs, the city's difficult permitting process, and the lack of consensus on fire safety standards for storage devices. Two bills in the great state of Maine could supersede PUC's net metering proposal. One proposes to retain full retail net metering, while the other proposes to implement a TOU based value of solar program. If neither gets approved then the PUC's current proposal to grandfather existing customers for 15 years while new customers only net offset T&D charges will come into effect starting in 2018.
■ It's a date:
− EPA carbon - April 17, 2017 - the DC Court of Appeals will hear arguments against EPA's carbon ruling
24 March 2017
Renewable Roundup 4
− Arizona - June 2017 - APS rate case to be heard by ACC, to be implemented starting July 1, 2017
24 March 2017
Renewable Roundup 5
AIC Question Pack Canadian Solar (CSIQ) and Hanwha Q Cells (HQCL)General
■ How is your business model differentiated from peers?
■ How do you plan to grow earnings power or cash flow in a market where panel prices are expected to decline in excess of 10% in 2017?
Capacity additions and demand
■ The industry collectively seems to be adding more capacity this year, while we expect global demand to decline due to a lower demand in US and China. Why do you think the industry is still adding capacity? When do you think the supply glut clears up?
■ Many manufacturers are increasing the mix of mono silicon manufacturing capacity due to its pricing premium. What is the mix of multi and mono silicon in your fabs? And do you plan to grow either of those in the future?
■ What are your expectations for demand growth in major market like: US, China, India, South America, and Middle East? Any other markets of importance?
Pricing
■ Solar module prices declined 30%+ in 2016. How sharp is the drop for you in 2017 and where do expect module prices to be in 2018/19? Is the bottom of the cycle in sight?
■ Do you expect any downside to pricing assumptions due to recent capacity additions announced by peers?
■ US plans to reduce anti-dumping duties on solar panels imported from Taiwan. How will that affect module prices and demand in US?
Costs and margins
■ How much does a solar module cost to produce today, and how much can it decline in 2017 and 2018? What solar module costs do you expect longer-term (2019)?
■ What are your gross and operating margin expectations for 2H1'17 and 2018?
Downstream
■ Can you describe your downstream strategy? How many projects have you built so far, and what is your project backlog for 2017 and beyond?
■ How are these projects funded, and do you plan to hold them or monetize them at a later stage?
■ Where is PPA pricing at in your various downstream markets? Do you see it settling at all at current levels? And what kind of unlevered project IRRs are you seeing for these projects?
Financials
■ Do you expect to be operating/free/net cash flow positive in 2017?
■ How much capex do you expect for downstream project development, manufacturing capacity expansion and general needs in 2017?
■ What is your current debt and cash? How much debt is due in 2017 and 2018?
■ How much of your 2017 shipment guidance is already booked?
24 March 2017
Renewable Roundup 6
Azure Power (AZRE)Market
■ Can you describe what drives solar demand in India? What is your outlook for 2017 and over the long-term?
■ Who are the major electricity off-takers? What is their motivation to issue solar RFPs?
■ How are PPAs structured, and how do they differ from other countries?
■ How does Azure Power differentiate itself in a crowded and competitive project development marketplace? Who are your main customers and competitors?
■ Many solar and wind project developers face curtailment risk and payment delays from state utilities. What do you think is driving this? Have these issues affected you? How do you take that into account when bidding projects?
Project economics
■ What are your expectations for project IRRs in India, especially given both the decline in PPA pricing and module/system prices?
■ What are the unlevered and levered project returns for Azure Power's contracted project backlog?
■ Who are the counterparties to these contracts? What is their credit rating?
■ How are projects financed? What is your current cost of debt? What opportunities do you see to improve levered returns?
Growth■ What is your current cash position, and how many projects does it support beyond your
current contracted project portfolio?
■ What is your long-term growth target and what are the biggest hurdles to achieving that target?
■ Who are your existing investors? How do you expand that list, especially given limited float?

24 March 2017
Renewable Roundup 7
Appendix: Sector Reference Tables
Figure 5: Global Solar Demand Forecast, GWSolar demand total, MW 2010 2011 2012 2013 2014 2015 2016E 2017E 2018E 2019E 2020EChina 530 2,900 4,200 11,300 10,590 15,130 30,000 20,000 20,000 20,000 21,000US 949 1,750 3,313 4,751 6,201 7,342 10,155 7,470 10,335 14,515 18,161Japan 960 1,200 1,864 6,026 8,564 9,761 7,200 5,500 5,775 6,064 6,367India 22 590 790 1,020 1,108 2,000 4,500 7,000 10,000 12,000 18,000Germany 7,400 7,500 7,634 3,304 1,899 1,000 1,100 1,500 1,500 1,500 1,500France 720 1,500 1,115 654 952 887 700 1,300 1,600 1,600 1,600UK 77 850 960 1,450 2,249 4,174 1,670 500 525 551 579Turkey 1 1 5 6 40 191 250 500 500 500 1,000Rest of Europe 8,473 7,753 4,824 2,523 2,112 2,048 2,500 2,750 3,025 3,328 3,660Saudi Arabia 25 25 25 24 25 100 130 169 220 286Chile 2 6.7 493 346 650 600 600 1,000 1,000Mexico 5 7 18 61 67 100 350 1,200 1,500 2,000 2,500Brazil 5 17 19 22 400 500 1,700 1,870 2,057 2,263Thailand 20 120 230 480 384 250 1,000 1,200 1,400 1,600 1,800Canada 200 300 500 200 810 300 315 331 347 365 383South Africa 300 300 891 300 300 300 300 300 300Australia 385 700 700 610 755 942 942 1,083 1,246 1,370 1,507Taiwan 13 96 105 170 228 500 500 500 500 500 500S. Korea 127 79 295 531 926 1,011 1,200 1,500 1,600 1,800 2,000Others 1,226 1,525 2,395 2,981 6,823 5,949 6,842 8,210 9,441 10,385 11,424Global 21,107 26,900 29,291 36,417 45,138 52,656 70,773 63,274 72,234 81,654 95,830growth rate 166.7% 27.4% 8.9% 24.3% 23.9% 16.7% 34.4% (10.6)% 14.2% 13.0% 17.4%
Source: Credit Suisse estimates
Figure 6: Weekly Solar Spot PricesLast Updated on 3/22/2017Spot ASP PricePoly - spot $/Kg 15.46 ▼ (1.9)% ▼ (4.7)% ▲ 1.5% ▲ 1.5%Wafer multi 156mm $/wafer 0.58 ▼ (2.4)% ▼ (6.5)% ▼ (6.9)% ▼ (6.9)%Cell (China) $/watt 0.19 ▼ (3.0)% ▼ (8.1)% ▼ (9.8)% ▼ (9.8)%Cell (Taiwan) $/watt 0.20 ▼ (3.0)% ▼ (8.0)% ▼ (9.7)% ▼ (9.7)%Module Price $/watt 0.34 ▼ (0.6)% ▼ (2.0)% ▼ (4.7)% ▼ (4.7)%Source: pvinsights.com
Last Updated on 3/22/2017Spot ASP PricePoly - spot $/Kg 16.65 ▼ (0.1)% ▼ (0.9)% ▲ 2.9% ▲ 2.9%Wafer multi 156mm $/wafer 0.62 ▼ (1.6)% ▼ (6.1)% ▼ (1.6)% ▼ (1.6)%Cell (China) $/watt 0.20 - 0.0% ▼ (6.2)% ▼ (6.2)% ▼ (6.2)%Cell (Taiwan) $/watt 0.19 - 0.0% ▼ (6.3)% ▼ (6.3)% ▼ (6.3)%Multi module price $/watt 0.37 ▼ (0.3)% ▼ (1.6)% ▼ (3.7)% ▼ (3.7)%Source: pv.energytrend.com
YTD
YTD
QTD
QTD1-wk 1-mth
1-mth1-wk
Source: Company data, Credit Suisse estimates
24 March 2017
Renewable Roundup 8
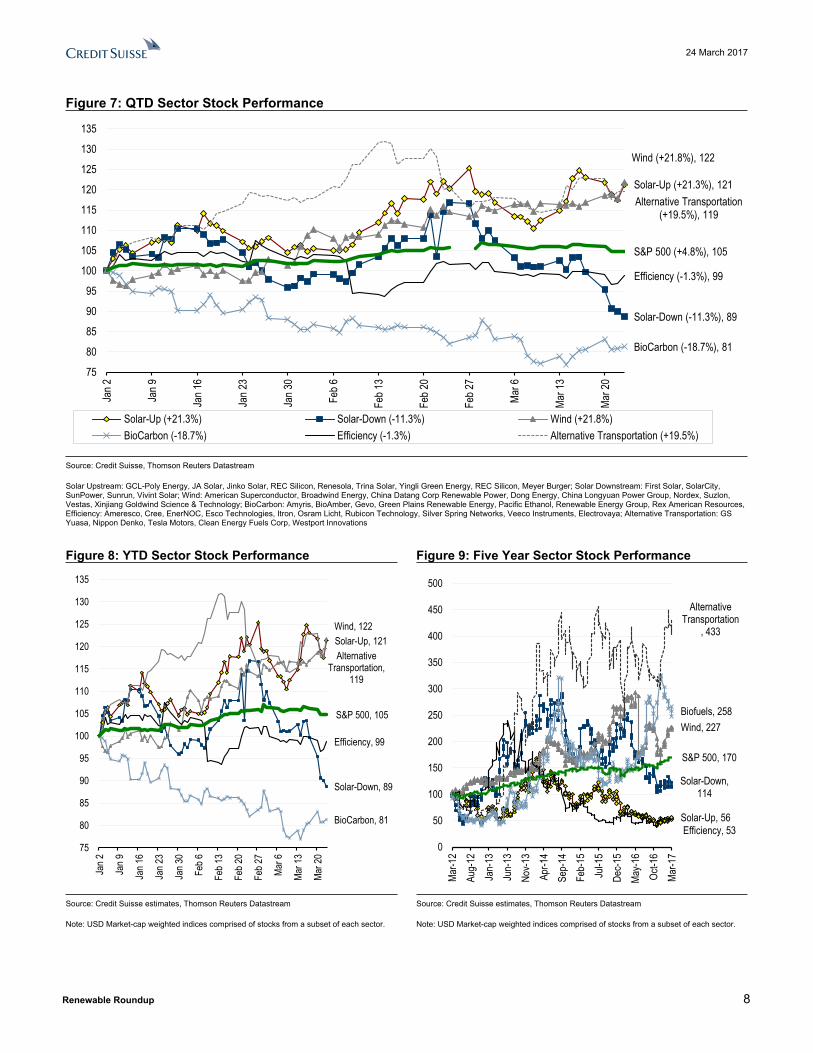
Figure 7: QTD Sector Stock Performance
Solar-Up (+21.3%), 121
Solar-Down (-11.3%), 89
Wind (+21.8%), 122
BioCarbon (-18.7%), 81
Efficiency (-1.3%), 99
Alternative Transportation (+19.5%), 119
S&P 500 (+4.8%), 105
75
80
85
90
95
100
105
110
115
120
125
130
135
Jan 2
Jan 9
Jan 1
6
Jan 2
3
Jan 3
0
Feb 6
Feb 1
3
Feb 2
0
Feb 2
7
Mar 6
Mar 1
3
Mar 2
0
Solar-Up (+21.3%) Solar-Down (-11.3%) Wind (+21.8%)BioCarbon (-18.7%) Efficiency (-1.3%) Alternative Transportation (+19.5%)
Source: Credit Suisse, Thomson Reuters Datastream
Solar Upstream: GCL-Poly Energy, JA Solar, Jinko Solar, REC Silicon, Renesola, Trina Solar, Yingli Green Energy, REC Silicon, Meyer Burger; Solar Downstream: First Solar, SolarCity, SunPower, Sunrun, Vivint Solar; Wind: American Superconductor, Broadwind Energy, China Datang Corp Renewable Power, Dong Energy, China Longyuan Power Group, Nordex, Suzlon, Vestas, Xinjiang Goldwind Science & Technology; BioCarbon: Amyris, BioAmber, Gevo, Green Plains Renewable Energy, Pacific Ethanol, Renewable Energy Group, Rex American Resources, Efficiency: Ameresco, Cree, EnerNOC, Esco Technologies, Itron, Osram Licht, Rubicon Technology, Silver Spring Networks, Veeco Instruments, Electrovaya; Alternative Transportation: GS Yuasa, Nippon Denko, Tesla Motors, Clean Energy Fuels Corp, Westport Innovations
Figure 8: YTD Sector Stock Performance Figure 9: Five Year Sector Stock Performance
Solar-Up, 121
Solar-Down, 89
Wind, 122
BioCarbon, 81
Efficiency, 99
Alternative Transportation,
119
S&P 500, 105
75
80
85
90
95
100
105
110
115
120
125
130
135
Jan 2
Jan 9
Jan 1
6
Jan 2
3
Jan 3
0
Feb 6
Feb 1
3
Feb 2
0
Feb 2
7
Mar 6
Mar 1
3
Mar 2
0
Solar-Up, 56
Solar-Down, 114
Wind, 227Biofuels, 258
Efficiency, 53
Alternative Transportation
, 433
S&P 500, 170
0
50
100
150
200
250
300
350
400
450
500
Mar-1
2Au
g-12
Jan-
13Ju
n-13
Nov-1
3Ap
r-14
Sep-
14Fe
b-15
Jul-1
5De
c-15
May-1
6Oc
t-16
Mar-1
7
Source: Credit Suisse estimates, Thomson Reuters Datastream
Note: USD Market-cap weighted indices comprised of stocks from a subset of each sector.
Source: Credit Suisse estimates, Thomson Reuters Datastream
Note: USD Market-cap weighted indices comprised of stocks from a subset of each sector.
24 March 2017
Renewable Roundup 9
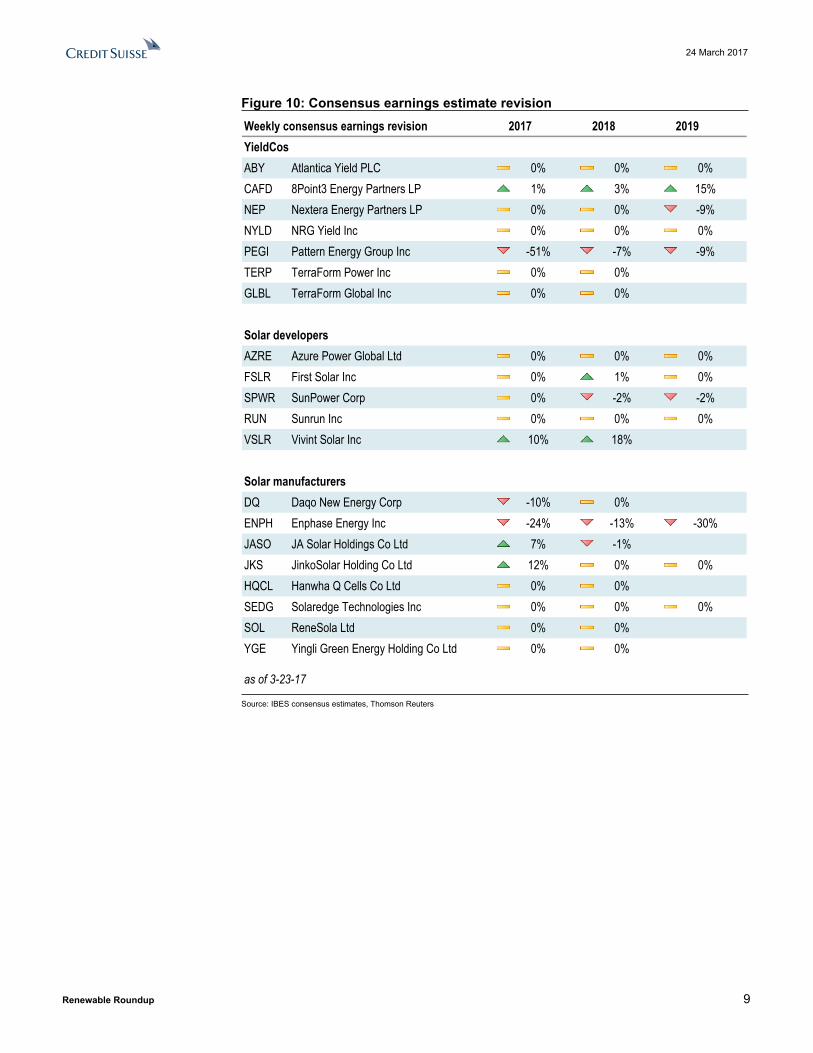
Figure 10: Consensus earnings estimate revisionWeekly consensus earnings revision 2017 2018 2019YieldCosABY Atlantica Yield PLC 0% 0% 0%CAFD 8Point3 Energy Partners LP 1% 3% 15%NEP Nextera Energy Partners LP 0% 0% -9%NYLD NRG Yield Inc 0% 0% 0%PEGI Pattern Energy Group Inc -51% -7% -9%TERP TerraForm Power Inc 0% 0%GLBL TerraForm Global Inc 0% 0%
Solar developersAZRE Azure Power Global Ltd 0% 0% 0%FSLR First Solar Inc 0% 1% 0%SPWR SunPower Corp 0% -2% -2%RUN Sunrun Inc 0% 0% 0%VSLR Vivint Solar Inc 10% 18%
Solar manufacturersDQ Daqo New Energy Corp -10% 0%ENPH Enphase Energy Inc -24% -13% -30%JASO JA Solar Holdings Co Ltd 7% -1%JKS JinkoSolar Holding Co Ltd 12% 0% 0%HQCL Hanwha Q Cells Co Ltd 0% 0%SEDG Solaredge Technologies Inc 0% 0% 0%SOL ReneSola Ltd 0% 0%YGE Yingli Green Energy Holding Co Ltd 0% 0%
as of 3-23-17
Source: IBES consensus estimates, Thomson Reuters
24 March 2017
Renew
able Roundup
10
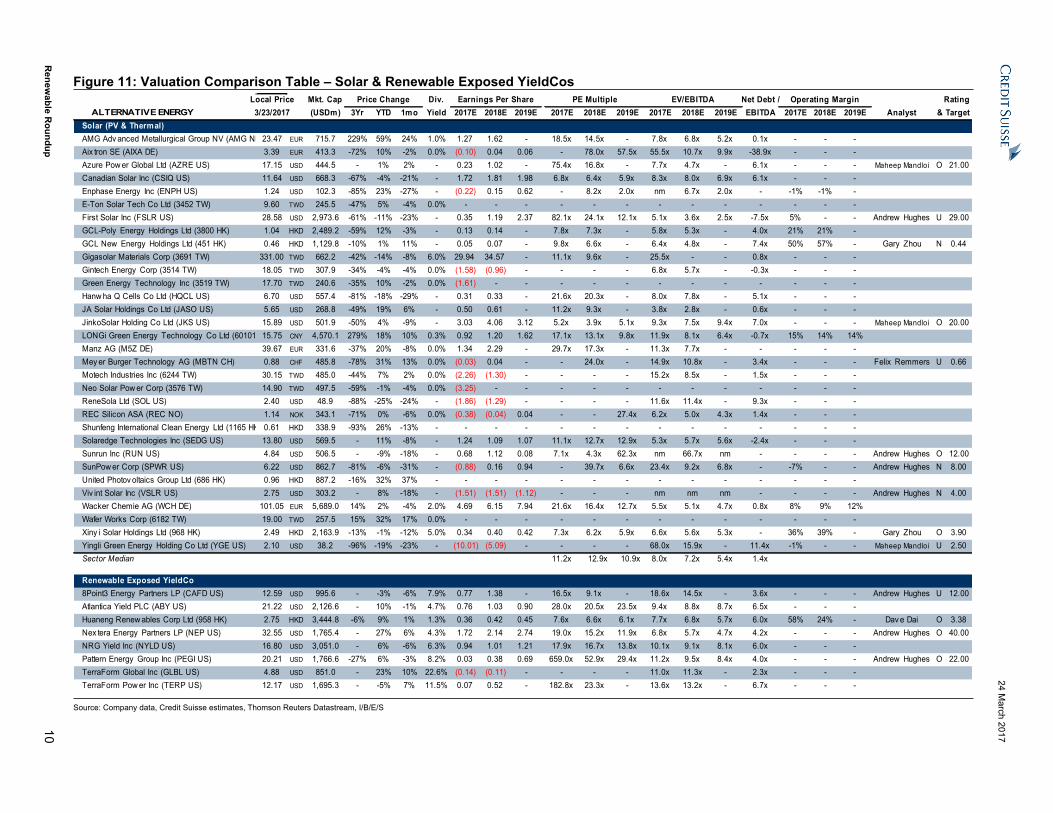
Figure 11: Valuation Comparison Table – Solar & Renewable Exposed YieldCosLocal Price Mkt. Cap Price Change Div. Earnings Per Share PE Multiple EV/EBITDA Net Debt / Operating Margin Rating
ALTERNATIVE ENERGY 3/23/2017 (USDm) 3Yr YTD 1mo Yield 2017E 2018E 2019E 2017E 2018E 2019E 2017E 2018E 2019E EBITDA 2017E 2018E 2019E Analyst & TargetSolar (PV & Thermal)AMG Adv anced Metallurgical Group NV (AMG NL)23.47 EUR 715.7 229% 59% 24% 1.0% 1.27 1.62 - 18.5x 14.5x - 7.8x 6.8x 5.2x 0.1x - - -Aix tron SE (AIXA DE) 3.39 EUR 413.3 -72% 10% -2% 0.0% (0.10) 0.04 0.06 - 78.0x 57.5x 55.5x 10.7x 9.9x -38.9x - - -Azure Pow er Global Ltd (AZRE US) 17.15 USD 444.5 - 1% 2% - 0.23 1.02 - 75.4x 16.8x - 7.7x 4.7x - 6.1x - - - Maheep Mandloi O 21.00Canadian Solar Inc (CSIQ US) 11.64 USD 668.3 -67% -4% -21% - 1.72 1.81 1.98 6.8x 6.4x 5.9x 8.3x 8.0x 6.9x 6.1x - - -Enphase Energy Inc (ENPH US) 1.24 USD 102.3 -85% 23% -27% - (0.22) 0.15 0.62 - 8.2x 2.0x nm 6.7x 2.0x - -1% -1% -E-Ton Solar Tech Co Ltd (3452 TW) 9.60 TWD 245.5 -47% 5% -4% 0.0% - - - - - - - - - - - - -First Solar Inc (FSLR US) 28.58 USD 2,973.6 -61% -11% -23% - 0.35 1.19 2.37 82.1x 24.1x 12.1x 5.1x 3.6x 2.5x -7.5x 5% - - Andrew Hughes U 29.00GCL-Poly Energy Holdings Ltd (3800 HK) 1.04 HKD 2,489.2 -59% 12% -3% - 0.13 0.14 - 7.8x 7.3x - 5.8x 5.3x - 4.0x 21% 21% -GCL New Energy Holdings Ltd (451 HK) 0.46 HKD 1,129.8 -10% 1% 11% - 0.05 0.07 - 9.8x 6.6x - 6.4x 4.8x - 7.4x 50% 57% - Gary Zhou N 0.44Gigasolar Materials Corp (3691 TW) 331.00 TWD 662.2 -42% -14% -8% 6.0% 29.94 34.57 - 11.1x 9.6x - 25.5x - - 0.8x - - -Gintech Energy Corp (3514 TW) 18.05 TWD 307.9 -34% -4% -4% 0.0% (1.58) (0.96) - - - - 6.8x 5.7x - -0.3x - - -Green Energy Technology Inc (3519 TW) 17.70 TWD 240.6 -35% 10% -2% 0.0% (1.61) - - - - - - - - - - - -Hanw ha Q Cells Co Ltd (HQCL US) 6.70 USD 557.4 -81% -18% -29% - 0.31 0.33 - 21.6x 20.3x - 8.0x 7.8x - 5.1x - - -JA Solar Holdings Co Ltd (JASO US) 5.65 USD 268.8 -49% 19% 6% - 0.50 0.61 - 11.2x 9.3x - 3.8x 2.8x - 0.6x - - -JinkoSolar Holding Co Ltd (JKS US) 15.89 USD 501.9 -50% 4% -9% - 3.03 4.06 3.12 5.2x 3.9x 5.1x 9.3x 7.5x 9.4x 7.0x - - - Maheep Mandloi O 20.00LONGi Green Energy Technology Co Ltd (601012 CN)15.75 CNY 4,570.1 279% 18% 10% 0.3% 0.92 1.20 1.62 17.1x 13.1x 9.8x 11.9x 8.1x 6.4x -0.7x 15% 14% 14%Manz AG (M5Z DE) 39.67 EUR 331.6 -37% 20% -8% 0.0% 1.34 2.29 - 29.7x 17.3x - 11.3x 7.7x - - - - -Mey er Burger Technology AG (MBTN CH) 0.88 CHF 485.8 -78% 31% 13% 0.0% (0.03) 0.04 - - 24.0x - 14.9x 10.8x - 3.4x - - - Felix Remmers U 0.66Motech Industries Inc (6244 TW) 30.15 TWD 485.0 -44% 7% 2% 0.0% (2.26) (1.30) - - - - 15.2x 8.5x - 1.5x - - -Neo Solar Pow er Corp (3576 TW) 14.90 TWD 497.5 -59% -1% -4% 0.0% (3.25) - - - - - - - - - - - -ReneSola Ltd (SOL US) 2.40 USD 48.9 -88% -25% -24% - (1.86) (1.29) - - - - 11.6x 11.4x - 9.3x - - -REC Silicon ASA (REC NO) 1.14 NOK 343.1 -71% 0% -6% 0.0% (0.38) (0.04) 0.04 - - 27.4x 6.2x 5.0x 4.3x 1.4x - - -Shunfeng International Clean Energy Ltd (1165 HK) 0.61 HKD 338.9 -93% 26% -13% - - - - - - - - - - - - - -Solaredge Technologies Inc (SEDG US) 13.80 USD 569.5 - 11% -8% - 1.24 1.09 1.07 11.1x 12.7x 12.9x 5.3x 5.7x 5.6x -2.4x - - -Sunrun Inc (RUN US) 4.84 USD 506.5 - -9% -18% - 0.68 1.12 0.08 7.1x 4.3x 62.3x nm 66.7x nm - - - - Andrew Hughes O 12.00SunPow er Corp (SPWR US) 6.22 USD 862.7 -81% -6% -31% - (0.88) 0.16 0.94 - 39.7x 6.6x 23.4x 9.2x 6.8x - -7% - - Andrew Hughes N 8.00United Photov oltaics Group Ltd (686 HK) 0.96 HKD 887.2 -16% 32% 37% - - - - - - - - - - - - - -Viv int Solar Inc (VSLR US) 2.75 USD 303.2 - 8% -18% - (1.51) (1.51) (1.12) - - - nm nm nm - - - - Andrew Hughes N 4.00Wacker Chemie AG (WCH DE) 101.05 EUR 5,689.0 14% 2% -4% 2.0% 4.69 6.15 7.94 21.6x 16.4x 12.7x 5.5x 5.1x 4.7x 0.8x 8% 9% 12%Wafer Works Corp (6182 TW) 19.00 TWD 257.5 15% 32% 17% 0.0% - - - - - - - - - - - - -Xiny i Solar Holdings Ltd (968 HK) 2.49 HKD 2,163.9 -13% -1% -12% 5.0% 0.34 0.40 0.42 7.3x 6.2x 5.9x 6.6x 5.6x 5.3x - 36% 39% - Gary Zhou O 3.90Yingli Green Energy Holding Co Ltd (YGE US) 2.10 USD 38.2 -96% -19% -23% - (10.01) (5.09) - - - - 68.0x 15.9x - 11.4x -1% - - Maheep Mandloi U 2.50Sector Median 11.2x 12.9x 10.9x 8.0x 7.2x 5.4x 1.4x
Renewable Exposed YieldCo8Point3 Energy Partners LP (CAFD US) 12.59 USD 995.6 - -3% -6% 7.9% 0.77 1.38 - 16.5x 9.1x - 18.6x 14.5x - 3.6x - - - Andrew Hughes U 12.00Atlantica Yield PLC (ABY US) 21.22 USD 2,126.6 - 10% -1% 4.7% 0.76 1.03 0.90 28.0x 20.5x 23.5x 9.4x 8.8x 8.7x 6.5x - - -Huaneng Renew ables Corp Ltd (958 HK) 2.75 HKD 3,444.8 -6% 9% 1% 1.3% 0.36 0.42 0.45 7.6x 6.6x 6.1x 7.7x 6.8x 5.7x 6.0x 58% 24% - Dav e Dai O 3.38Nex tera Energy Partners LP (NEP US) 32.55 USD 1,765.4 - 27% 6% 4.3% 1.72 2.14 2.74 19.0x 15.2x 11.9x 6.8x 5.7x 4.7x 4.2x - - - Andrew Hughes O 40.00NRG Yield Inc (NYLD US) 16.80 USD 3,051.0 - 6% -6% 6.3% 0.94 1.01 1.21 17.9x 16.7x 13.8x 10.1x 9.1x 8.1x 6.0x - - -Pattern Energy Group Inc (PEGI US) 20.21 USD 1,766.6 -27% 6% -3% 8.2% 0.03 0.38 0.69 659.0x 52.9x 29.4x 11.2x 9.5x 8.4x 4.0x - - - Andrew Hughes O 22.00TerraForm Global Inc (GLBL US) 4.88 USD 851.0 - 23% 10% 22.6% (0.14) (0.11) - - - - 11.0x 11.3x - 2.3x - - -TerraForm Pow er Inc (TERP US) 12.17 USD 1,695.3 - -5% 7% 11.5% 0.07 0.52 - 182.8x 23.3x - 13.6x 13.2x - 6.7x - - -
Source: Company data, Credit Suisse estimates, Thomson Reuters Datastream, I/B/E/S
24 March 2017
Renew
able Roundup
11
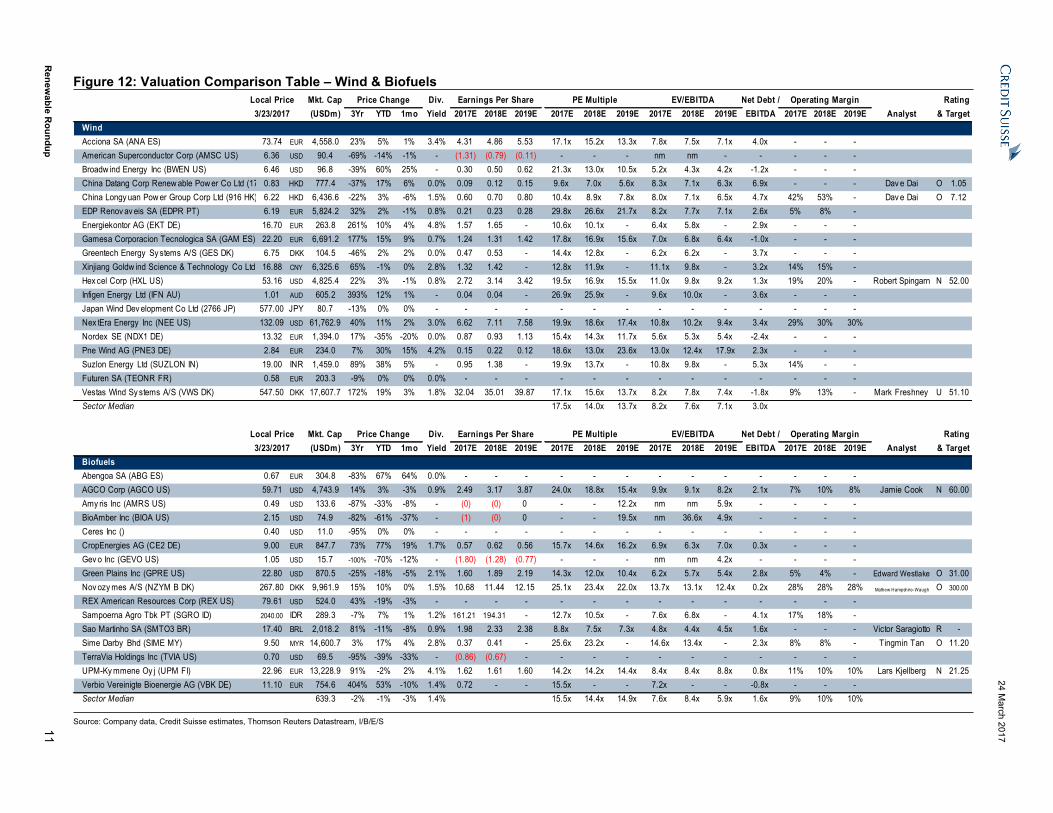
Figure 12: Valuation Comparison Table – Wind & BiofuelsLocal Price Mkt. Cap Price Change Div. Earnings Per Share PE Multiple EV/EBITDA Net Debt / Operating Margin Rating3/23/2017 (USDm) 3Yr YTD 1mo Yield 2017E 2018E 2019E 2017E 2018E 2019E 2017E 2018E 2019E EBITDA 2017E 2018E 2019E Analyst & Target
WindAcciona SA (ANA ES) 73.74 EUR 4,558.0 23% 5% 1% 3.4% 4.31 4.86 5.53 17.1x 15.2x 13.3x 7.8x 7.5x 7.1x 4.0x - - -American Superconductor Corp (AMSC US) 6.36 USD 90.4 -69% -14% -1% - (1.31) (0.79) (0.11) - - - nm nm - - - - -Broadw ind Energy Inc (BWEN US) 6.46 USD 96.8 -39% 60% 25% - 0.30 0.50 0.62 21.3x 13.0x 10.5x 5.2x 4.3x 4.2x -1.2x - - -China Datang Corp Renew able Pow er Co Ltd (1798 HK)0.83 HKD 777.4 -37% 17% 6% 0.0% 0.09 0.12 0.15 9.6x 7.0x 5.6x 8.3x 7.1x 6.3x 6.9x - - - Dav e Dai O 1.05China Longy uan Pow er Group Corp Ltd (916 HK) 6.22 HKD 6,436.6 -22% 3% -6% 1.5% 0.60 0.70 0.80 10.4x 8.9x 7.8x 8.0x 7.1x 6.5x 4.7x 42% 53% - Dav e Dai O 7.12EDP Renov av eis SA (EDPR PT) 6.19 EUR 5,824.2 32% 2% -1% 0.8% 0.21 0.23 0.28 29.8x 26.6x 21.7x 8.2x 7.7x 7.1x 2.6x 5% 8% -Energiekontor AG (EKT DE) 16.70 EUR 263.8 261% 10% 4% 4.8% 1.57 1.65 - 10.6x 10.1x - 6.4x 5.8x - 2.9x - - -Gamesa Corporacion Tecnologica SA (GAM ES) 22.20 EUR 6,691.2 177% 15% 9% 0.7% 1.24 1.31 1.42 17.8x 16.9x 15.6x 7.0x 6.8x 6.4x -1.0x - - -Greentech Energy Sy stems A/S (GES DK) 6.75 DKK 104.5 -46% 2% 2% 0.0% 0.47 0.53 - 14.4x 12.8x - 6.2x 6.2x - 3.7x - - -Xinjiang Goldw ind Science & Technology Co Ltd (002202 CN)16.88 CNY 6,325.6 65% -1% 0% 2.8% 1.32 1.42 - 12.8x 11.9x - 11.1x 9.8x - 3.2x 14% 15% -Hex cel Corp (HXL US) 53.16 USD 4,825.4 22% 3% -1% 0.8% 2.72 3.14 3.42 19.5x 16.9x 15.5x 11.0x 9.8x 9.2x 1.3x 19% 20% - Robert Spingarn N 52.00Infigen Energy Ltd (IFN AU) 1.01 AUD 605.2 393% 12% 1% - 0.04 0.04 - 26.9x 25.9x - 9.6x 10.0x - 3.6x - - -Japan Wind Dev elopment Co Ltd (2766 JP) 577.00 JPY 80.7 -13% 0% 0% - - - - - - - - - - - - - -Nex tEra Energy Inc (NEE US) 132.09 USD 61,762.9 40% 11% 2% 3.0% 6.62 7.11 7.58 19.9x 18.6x 17.4x 10.8x 10.2x 9.4x 3.4x 29% 30% 30%Nordex SE (NDX1 DE) 13.32 EUR 1,394.0 17% -35% -20% 0.0% 0.87 0.93 1.13 15.4x 14.3x 11.7x 5.6x 5.3x 5.4x -2.4x - - -Pne Wind AG (PNE3 DE) 2.84 EUR 234.0 7% 30% 15% 4.2% 0.15 0.22 0.12 18.6x 13.0x 23.6x 13.0x 12.4x 17.9x 2.3x - - -Suzlon Energy Ltd (SUZLON IN) 19.00 INR 1,459.0 89% 38% 5% - 0.95 1.38 - 19.9x 13.7x - 10.8x 9.8x - 5.3x 14% - -Futuren SA (TEONR FR) 0.58 EUR 203.3 -9% 0% 0% 0.0% - - - - - - - - - - - - -Vestas Wind Sy stems A/S (VWS DK) 547.50 DKK 17,607.7 172% 19% 3% 1.8% 32.04 35.01 39.87 17.1x 15.6x 13.7x 8.2x 7.8x 7.4x -1.8x 9% 13% - Mark Freshney U 51.10Sector Median 17.5x 14.0x 13.7x 8.2x 7.6x 7.1x 3.0x
Local Price Mkt. Cap Price Change Div. Earnings Per Share PE Multiple EV/EBITDA Net Debt / Operating Margin Rating3/23/2017 (USDm) 3Yr YTD 1mo Yield 2017E 2018E 2019E 2017E 2018E 2019E 2017E 2018E 2019E EBITDA 2017E 2018E 2019E Analyst & Target
BiofuelsAbengoa SA (ABG ES) 0.67 EUR 304.8 -83% 67% 64% 0.0% - - - - - - - - - - - - -AGCO Corp (AGCO US) 59.71 USD 4,743.9 14% 3% -3% 0.9% 2.49 3.17 3.87 24.0x 18.8x 15.4x 9.9x 9.1x 8.2x 2.1x 7% 10% 8% Jamie Cook N 60.00Amy ris Inc (AMRS US) 0.49 USD 133.6 -87% -33% -8% - (0) (0) 0 - - 12.2x nm nm 5.9x - - - -BioAmber Inc (BIOA US) 2.15 USD 74.9 -82% -61% -37% - (1) (0) 0 - - 19.5x nm 36.6x 4.9x - - - -Ceres Inc () 0.40 USD 11.0 -95% 0% 0% - - - - - - - - - - - - - -CropEnergies AG (CE2 DE) 9.00 EUR 847.7 73% 77% 19% 1.7% 0.57 0.62 0.56 15.7x 14.6x 16.2x 6.9x 6.3x 7.0x 0.3x - - -Gev o Inc (GEVO US) 1.05 USD 15.7 -100% -70% -12% - (1.80) (1.28) (0.77) - - - nm nm 4.2x - - - -Green Plains Inc (GPRE US) 22.80 USD 870.5 -25% -18% -5% 2.1% 1.60 1.89 2.19 14.3x 12.0x 10.4x 6.2x 5.7x 5.4x 2.8x 5% 4% - Edward Westlake O 31.00Nov ozy mes A/S (NZYM B DK) 267.80 DKK 9,961.9 15% 10% 0% 1.5% 10.68 11.44 12.15 25.1x 23.4x 22.0x 13.7x 13.1x 12.4x 0.2x 28% 28% 28% Mathew Hampshire-Waugh O 300.00
REX American Resources Corp (REX US) 79.61 USD 524.0 43% -19% -3% - - - - - - - - - - - - - -Sampoerna Agro Tbk PT (SGRO ID) 2040.00 IDR 289.3 -7% 7% 1% 1.2% 161.21 194.31 - 12.7x 10.5x - 7.6x 6.8x - 4.1x 17% 18% -Sao Martinho SA (SMTO3 BR) 17.40 BRL 2,018.2 81% -11% -8% 0.9% 1.98 2.33 2.38 8.8x 7.5x 7.3x 4.8x 4.4x 4.5x 1.6x - - - Victor Saragiotto R - Sime Darby Bhd (SIME MY) 9.50 MYR 14,600.7 3% 17% 4% 2.8% 0.37 0.41 - 25.6x 23.2x - 14.6x 13.4x - 2.3x 8% 8% - Tingmin Tan O 11.20TerraVia Holdings Inc (TVIA US) 0.70 USD 69.5 -95% -39% -33% - (0.86) (0.67) - - - - - - - - - - -UPM-Ky mmene Oy j (UPM FI) 22.96 EUR 13,228.9 91% -2% 2% 4.1% 1.62 1.61 1.60 14.2x 14.2x 14.4x 8.4x 8.4x 8.8x 0.8x 11% 10% 10% Lars Kjellberg N 21.25Verbio Vereinigte Bioenergie AG (VBK DE) 11.10 EUR 754.6 404% 53% -10% 1.4% 0.72 - - 15.5x - - 7.2x - - -0.8x - - -Sector Median 639.3 -2% -1% -3% 1.4% 15.5x 14.4x 14.9x 7.6x 8.4x 5.9x 1.6x 9% 10% 10%
Source: Company data, Credit Suisse estimates, Thomson Reuters Datastream, I/B/E/S
24 March 2017
Renew
able Roundup
12
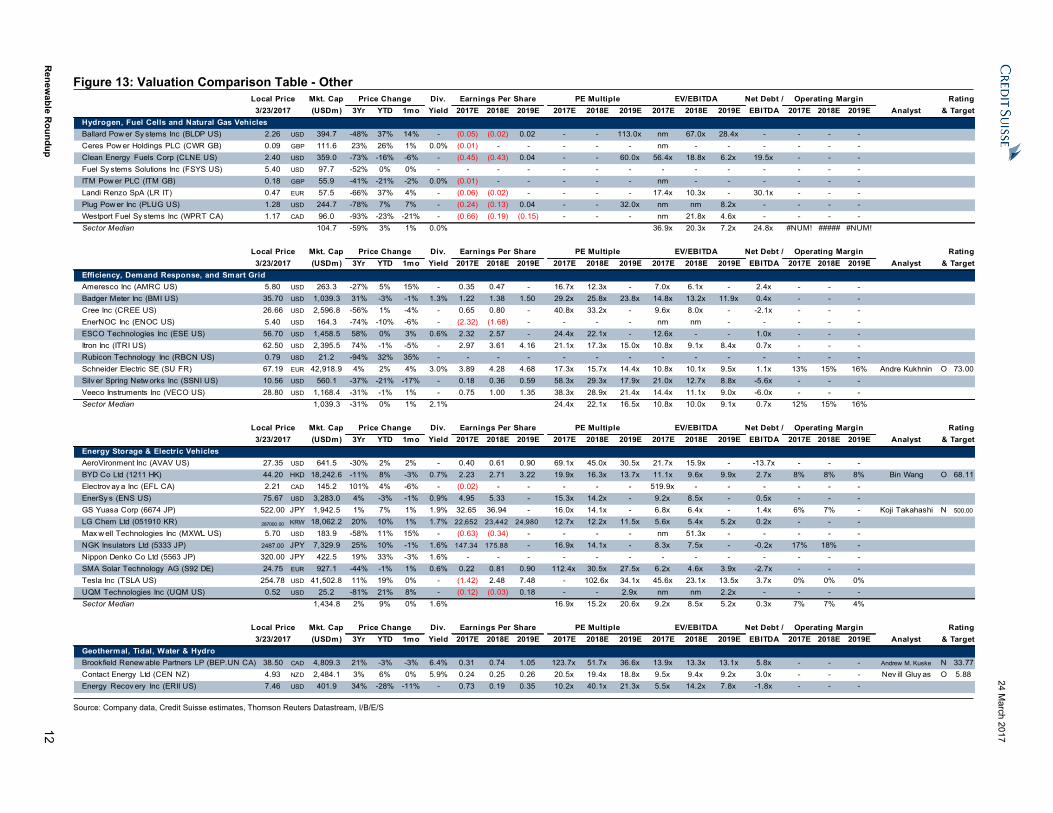
Figure 13: Valuation Comparison Table - OtherLocal Price Mkt. Cap Price Change Div. Earnings Per Share PE Multiple EV/EBITDA Net Debt / Operating Margin Rating3/23/2017 (USDm) 3Yr YTD 1mo Yield 2017E 2018E 2019E 2017E 2018E 2019E 2017E 2018E 2019E EBITDA 2017E 2018E 2019E Analyst & Target
Hydrogen, Fuel Cells and Natural Gas VehiclesBallard Pow er Sy stems Inc (BLDP US) 2.26 USD 394.7 -48% 37% 14% - (0.05) (0.02) 0.02 - - 113.0x nm 67.0x 28.4x - - - -Ceres Pow er Holdings PLC (CWR GB) 0.09 GBP 111.6 23% 26% 1% 0.0% (0.01) - - - - - nm - - - - - -Clean Energy Fuels Corp (CLNE US) 2.40 USD 359.0 -73% -16% -6% - (0.45) (0.43) 0.04 - - 60.0x 56.4x 18.8x 6.2x 19.5x - - -Fuel Sy stems Solutions Inc (FSYS US) 5.40 USD 97.7 -52% 0% 0% - - - - - - - - - - - - - -ITM Pow er PLC (ITM GB) 0.18 GBP 55.9 -41% -21% -2% 0.0% (0.01) - - - - - nm - - - - - -Landi Renzo SpA (LR IT) 0.47 EUR 57.5 -66% 37% 4% - (0.06) (0.02) - - - - 17.4x 10.3x - 30.1x - - -Plug Pow er Inc (PLUG US) 1.28 USD 244.7 -78% 7% 7% - (0.24) (0.13) 0.04 - - 32.0x nm nm 8.2x - - - -Westport Fuel Sy stems Inc (WPRT CA) 1.17 CAD 96.0 -93% -23% -21% - (0.66) (0.19) (0.15) - - - nm 21.8x 4.6x - - - -Sector Median 104.7 -59% 3% 1% 0.0% 36.9x 20.3x 7.2x 24.8x #NUM! ##### #NUM!
Local Price Mkt. Cap Price Change Div. Earnings Per Share PE Multiple EV/EBITDA Net Debt / Operating Margin Rating3/23/2017 (USDm) 3Yr YTD 1mo Yield 2017E 2018E 2019E 2017E 2018E 2019E 2017E 2018E 2019E EBITDA 2017E 2018E 2019E Analyst & Target
Efficiency, Demand Response, and Smart GridAmeresco Inc (AMRC US) 5.80 USD 263.3 -27% 5% 15% - 0.35 0.47 - 16.7x 12.3x - 7.0x 6.1x - 2.4x - - -Badger Meter Inc (BMI US) 35.70 USD 1,039.3 31% -3% -1% 1.3% 1.22 1.38 1.50 29.2x 25.8x 23.8x 14.8x 13.2x 11.9x 0.4x - - -Cree Inc (CREE US) 26.66 USD 2,596.8 -56% 1% -4% - 0.65 0.80 - 40.8x 33.2x - 9.6x 8.0x - -2.1x - - -EnerNOC Inc (ENOC US) 5.40 USD 164.3 -74% -10% -6% - (2.32) (1.68) - - - - nm nm - - - - -ESCO Technologies Inc (ESE US) 56.70 USD 1,458.5 58% 0% 3% 0.6% 2.32 2.57 - 24.4x 22.1x - 12.6x - - 1.0x - - -Itron Inc (ITRI US) 62.50 USD 2,395.5 74% -1% -5% - 2.97 3.61 4.16 21.1x 17.3x 15.0x 10.8x 9.1x 8.4x 0.7x - - -Rubicon Technology Inc (RBCN US) 0.79 USD 21.2 -94% 32% 35% - - - - - - - - - - - - - -Schneider Electric SE (SU FR) 67.19 EUR 42,918.9 4% 2% 4% 3.0% 3.89 4.28 4.68 17.3x 15.7x 14.4x 10.8x 10.1x 9.5x 1.1x 13% 15% 16% Andre Kukhnin O 73.00Silv er Spring Netw orks Inc (SSNI US) 10.56 USD 560.1 -37% -21% -17% - 0.18 0.36 0.59 58.3x 29.3x 17.9x 21.0x 12.7x 8.8x -5.6x - - -Veeco Instruments Inc (VECO US) 28.80 USD 1,168.4 -31% -1% 1% - 0.75 1.00 1.35 38.3x 28.9x 21.4x 14.4x 11.1x 9.0x -6.0x - - -Sector Median 1,039.3 -31% 0% 1% 2.1% 24.4x 22.1x 16.5x 10.8x 10.0x 9.1x 0.7x 12% 15% 16%
Local Price Mkt. Cap Price Change Div. Earnings Per Share PE Multiple EV/EBITDA Net Debt / Operating Margin Rating3/23/2017 (USDm) 3Yr YTD 1mo Yield 2017E 2018E 2019E 2017E 2018E 2019E 2017E 2018E 2019E EBITDA 2017E 2018E 2019E Analyst & Target
Energy Storage & Electric VehiclesAeroVironment Inc (AVAV US) 27.35 USD 641.5 -30% 2% 2% - 0.40 0.61 0.90 69.1x 45.0x 30.5x 21.7x 15.9x - -13.7x - - -BYD Co Ltd (1211 HK) 44.20 HKD 18,242.6 -11% 8% -3% 0.7% 2.23 2.71 3.22 19.9x 16.3x 13.7x 11.1x 9.6x 9.9x 2.7x 8% 8% 8% Bin Wang O 68.11Electrov ay a Inc (EFL CA) 2.21 CAD 145.2 101% 4% -6% - (0.02) - - - - - 519.9x - - - - - -EnerSy s (ENS US) 75.67 USD 3,283.0 4% -3% -1% 0.9% 4.95 5.33 - 15.3x 14.2x - 9.2x 8.5x - 0.5x - - -GS Yuasa Corp (6674 JP) 522.00 JPY 1,942.5 1% 7% 1% 1.9% 32.65 36.94 - 16.0x 14.1x - 6.8x 6.4x - 1.4x 6% 7% - Koji Takahashi N 500.00
LG Chem Ltd (051910 KR) 287000.00 KRW 18,062.2 20% 10% 1% 1.7% 22,652 23,442 24,980 12.7x 12.2x 11.5x 5.6x 5.4x 5.2x 0.2x - - -Max w ell Technologies Inc (MXWL US) 5.70 USD 183.9 -58% 11% 15% - (0.63) (0.34) - - - - nm 51.3x - - - - -NGK Insulators Ltd (5333 JP) 2487.00 JPY 7,329.9 25% 10% -1% 1.6% 147.34 175.88 - 16.9x 14.1x - 8.3x 7.5x - -0.2x 17% 18% -Nippon Denko Co Ltd (5563 JP) 320.00 JPY 422.5 19% 33% -3% 1.6% - - - - - - - - - - - - -SMA Solar Technology AG (S92 DE) 24.75 EUR 927.1 -44% -1% 1% 0.6% 0.22 0.81 0.90 112.4x 30.5x 27.5x 6.2x 4.6x 3.9x -2.7x - - -Tesla Inc (TSLA US) 254.78 USD 41,502.8 11% 19% 0% - (1.42) 2.48 7.48 - 102.6x 34.1x 45.6x 23.1x 13.5x 3.7x 0% 0% 0%UQM Technologies Inc (UQM US) 0.52 USD 25.2 -81% 21% 8% - (0.12) (0.03) 0.18 - - 2.9x nm nm 2.2x - - - -Sector Median 1,434.8 2% 9% 0% 1.6% 16.9x 15.2x 20.6x 9.2x 8.5x 5.2x 0.3x 7% 7% 4%
Local Price Mkt. Cap Price Change Div. Earnings Per Share PE Multiple EV/EBITDA Net Debt / Operating Margin Rating3/23/2017 (USDm) 3Yr YTD 1mo Yield 2017E 2018E 2019E 2017E 2018E 2019E 2017E 2018E 2019E EBITDA 2017E 2018E 2019E Analyst & Target
Geothermal, Tidal, Water & HydroBrookfield Renew able Partners LP (BEP.UN CA) 38.50 CAD 4,809.3 21% -3% -3% 6.4% 0.31 0.74 1.05 123.7x 51.7x 36.6x 13.9x 13.3x 13.1x 5.8x - - - Andrew M. Kuske N 33.77Contact Energy Ltd (CEN NZ) 4.93 NZD 2,484.1 3% 6% 0% 5.9% 0.24 0.25 0.26 20.5x 19.4x 18.8x 9.5x 9.4x 9.2x 3.0x - - - Nev ill Gluy as O 5.88Energy Recov ery Inc (ERII US) 7.46 USD 401.9 34% -28% -11% - 0.73 0.19 0.35 10.2x 40.1x 21.3x 5.5x 14.2x 7.8x -1.8x - - -
Source: Company data, Credit Suisse estimates, Thomson Reuters Datastream, I/B/E/S
24 March 2017
Renewable Roundup 13
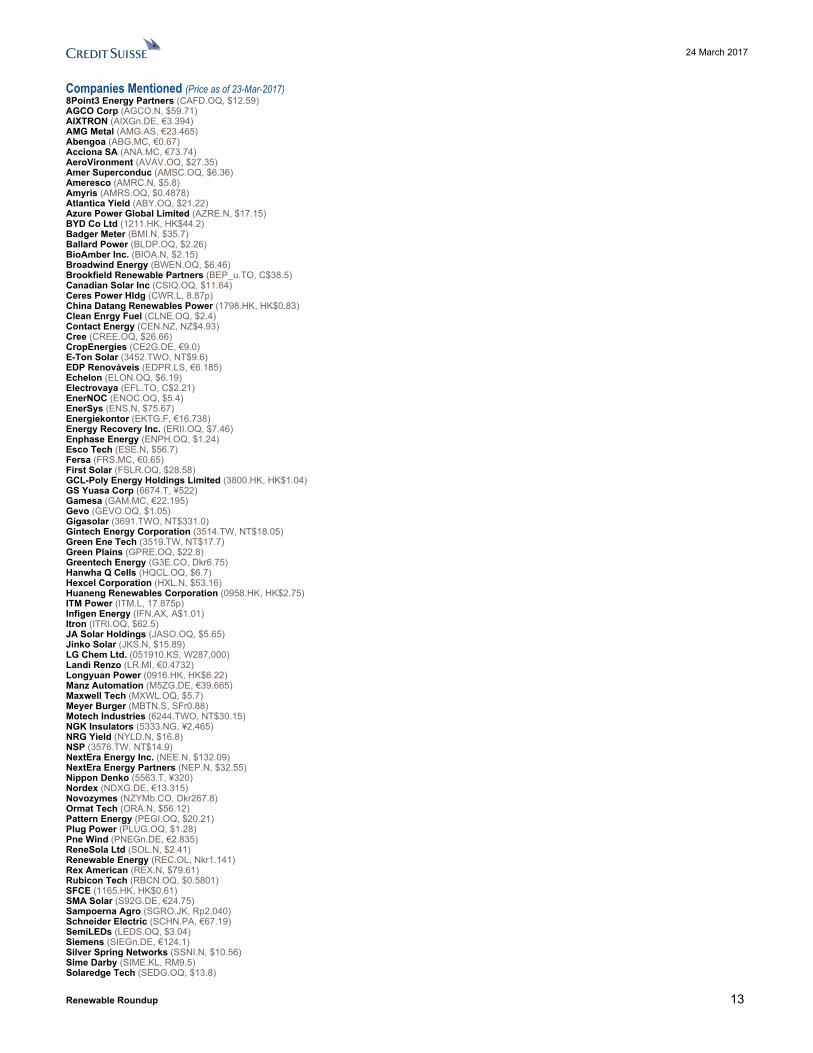
Companies Mentioned (Price as of 23-Mar-2017)8Point3 Energy Partners (CAFD.OQ, $12.59)AGCO Corp (AGCO.N, $59.71)AIXTRON (AIXGn.DE, €3.394)AMG Metal (AMG.AS, €23.465)Abengoa (ABG.MC, €0.67)Acciona SA (ANA.MC, €73.74)AeroVironment (AVAV.OQ, $27.35)Amer Superconduc (AMSC.OQ, $6.36)Ameresco (AMRC.N, $5.8)Amyris (AMRS.OQ, $0.4878)Atlantica Yield (ABY.OQ, $21.22)Azure Power Global Limited (AZRE.N, $17.15)BYD Co Ltd (1211.HK, HK$44.2)Badger Meter (BMI.N, $35.7)Ballard Power (BLDP.OQ, $2.26)BioAmber Inc. (BIOA.N, $2.15)Broadwind Energy (BWEN.OQ, $6.46)Brookfield Renewable Partners (BEP_u.TO, C$38.5)Canadian Solar Inc (CSIQ.OQ, $11.64)Ceres Power Hldg (CWR.L, 8.87p)China Datang Renewables Power (1798.HK, HK$0.83)Clean Enrgy Fuel (CLNE.OQ, $2.4)Contact Energy (CEN.NZ, NZ$4.93)Cree (CREE.OQ, $26.66)CropEnergies (CE2G.DE, €9.0)E-Ton Solar (3452.TWO, NT$9.6)EDP Renováveis (EDPR.LS, €6.185)Echelon (ELON.OQ, $6.19)Electrovaya (EFL.TO, C$2.21)EnerNOC (ENOC.OQ, $5.4)EnerSys (ENS.N, $75.67)Energiekontor (EKTG.F, €16.738)Energy Recovery Inc. (ERII.OQ, $7.46)Enphase Energy (ENPH.OQ, $1.24)Esco Tech (ESE.N, $56.7)Fersa (FRS.MC, €0.65)First Solar (FSLR.OQ, $28.58)GCL-Poly Energy Holdings Limited (3800.HK, HK$1.04)GS Yuasa Corp (6674.T, ¥522)Gamesa (GAM.MC, €22.195)Gevo (GEVO.OQ, $1.05)Gigasolar (3691.TWO, NT$331.0)Gintech Energy Corporation (3514.TW, NT$18.05)Green Ene Tech (3519.TW, NT$17.7)Green Plains (GPRE.OQ, $22.8)Greentech Energy (G3E.CO, Dkr6.75)Hanwha Q Cells (HQCL.OQ, $6.7)Hexcel Corporation (HXL.N, $53.16)Huaneng Renewables Corporation (0958.HK, HK$2.75)ITM Power (ITM.L, 17.875p)Infigen Energy (IFN.AX, A$1.01)Itron (ITRI.OQ, $62.5)JA Solar Holdings (JASO.OQ, $5.65)Jinko Solar (JKS.N, $15.89)LG Chem Ltd. (051910.KS, W287,000)Landi Renzo (LR.MI, €0.4732)Longyuan Power (0916.HK, HK$6.22)Manz Automation (M5ZG.DE, €39.665)Maxwell Tech (MXWL.OQ, $5.7)Meyer Burger (MBTN.S, SFr0.88)Motech Industries (6244.TWO, NT$30.15)NGK Insulators (5333.NG, ¥2,465)NRG Yield (NYLD.N, $16.8)NSP (3576.TW, NT$14.9)NextEra Energy Inc. (NEE.N, $132.09)NextEra Energy Partners (NEP.N, $32.55)Nippon Denko (5563.T, ¥320)Nordex (NDXG.DE, €13.315)Novozymes (NZYMb.CO, Dkr267.8)Ormat Tech (ORA.N, $56.12)Pattern Energy (PEGI.OQ, $20.21)Plug Power (PLUG.OQ, $1.28)Pne Wind (PNEGn.DE, €2.835)ReneSola Ltd (SOL.N, $2.41)Renewable Energy (REC.OL, Nkr1.141)Rex American (REX.N, $79.61)Rubicon Tech (RBCN.OQ, $0.5801)SFCE (1165.HK, HK$0.61)SMA Solar (S92G.DE, €24.75)Sampoerna Agro (SGRO.JK, Rp2,040)Schneider Electric (SCHN.PA, €67.19)SemiLEDs (LEDS.OQ, $3.04)Siemens (SIEGn.DE, €124.1)Silver Spring Networks (SSNI.N, $10.56)Sime Darby (SIME.KL, RM9.5)Solaredge Tech (SEDG.OQ, $13.8)

24 March 2017
Renewable Roundup 14
SunPower Corp. (SPWR.OQ, $6.22)Sunrun (RUN.OQ, $4.84)Suzlon Energy (SUZL.NS, Rs19.0)TerraVia Holdings (TVIA.OQ, $0.7004)Terraform Global (GLBL.OQ, $4.88)Terraform Power (TERP.OQ, $12.17)Tesla Motors Inc. (TSLA.OQ, $254.78)UPM-Kymmene (UPM1V.HE, €22.96)United PV (0686.HK, HK$0.96)Veeco Instrument (VECO.OQ, $28.8)Verbio (VBKG.DE, €11.095)Vestas (VWS.CO, Dkr547.5)Vivint Solar, Inc. (VSLR.N, $2.75)Wacker Chemie (WCHG.DE, €101.05)Wafer Works Corp (6182.TWO, NT$19.0)Xinjiang Goldwind Science & Technology Co., Ltd. (002202.SZ, Rmb16.88)Yingli Green Energy Holding (YGE.N, $2.11)
Disclosure AppendixAnalyst Certification I, Andrew Hughes, certify that (1) the views expressed in this report accurately reflect my personal views about all of the subject companies and securities and (2) no part of my compensation was, is or will be directly or indirectly related to the specific recommendations or views expressed in this report.The analyst(s) responsible for preparing this research report received Compensation that is based upon various factors including Credit Suisse's total revenues, a portion of which are generated by Credit Suisse's investment banking activitiesAs of December 10, 2012 Analysts’ stock rating are defined as follows:Outperform (O) : The stock’s total return is expected to outperform the relevant benchmark* over the next 12 months.Neutral (N) : The stock’s total return is expected to be in line with the relevant benchmark* over the next 12 months.Underperform (U) : The stock’s total return is expected to underperform the relevant benchmark* over the next 12 months. *Relevant benchmark by region: As of 10th December 2012, Japanese ratings are based on a stock’s total return relative to the analyst's coverage universe which consists of all companies covered by the analyst within the relevant sector, with Outperforms representing the most attractive, Neutrals the less attractive, and Underperforms the least attractive investment opportunities. As of 2nd October 2012, U.S. and Canadian as well as European ratings are based on a stock’s total return relative to the analyst's coverage universe which consists of all companies covered by the analyst within the relevant sector, with Outperforms representing the most attractive, Neutrals the less attractive, and Underperforms the least attractive investment opportunities. For Latin American and non-Japan Asia stocks, ratings are based on a stock’s total return relative to the average total return of the relevant country or regional benchmark; prior to 2nd October 2012 U.S. and Canadian ratings were based on (1) a stock’s absolute total return potential to its current share price and (2) the relative attractiveness of a stock’s total return potential within an analyst’s coverage universe. For Australian and New Zealand stocks, the expected total return (ETR) calculation includes 12-month rolling dividend yield. An Outperform rating is assigned where an ETR is greater than or equal to 7.5%; Underperform where an ETR less than or equal to 5%. A Neutral may be assigned where the ETR is between -5% and 15%. The overlapping rating range allows analysts to assign a rating that puts ETR in the context of associated risks. Prior to 18 May 2015, ETR ranges for Outperform and Underperform ratings did not overlap with Neutral thresholds between 15% and 7.5%, which was in operation from 7 July 2011.Restricted (R) : In certain circumstances, Credit Suisse policy and/or applicable law and regulations preclude certain types of communications, including an investment recommendation, during the course of Credit Suisse's engagement in an investment banking transaction and in certain other circumstances.Not Rated (NR) : Credit Suisse Equity Research does not have an investment rating or view on the stock or any other securities related to the company at this time.Not Covered (NC) : Credit Suisse Equity Research does not provide ongoing coverage of the company or offer an investment rating or investment view on the equity security of the company or related products.Volatility Indicator [V] : A stock is defined as volatile if the stock price has moved up or down by 20% or more in a month in at least 8 of the past 24 months or the analyst expects significant volatility going forward.Analysts’ sector weightings are distinct from analysts’ stock ratings and are based on the analyst’s expectations for the fundamentals and/or valuation of the sector* relative to the group’s historic fundamentals and/or valuation:Overweight : The analyst’s expectation for the sector’s fundamentals and/or valuation is favorable over the next 12 months.Market Weight : The analyst’s expectation for the sector’s fundamentals and/or valuation is neutral over the next 12 months.Underweight : The analyst’s expectation for the sector’s fundamentals and/or valuation is cautious over the next 12 months. *An analyst’s coverage sector consists of all companies covered by the analyst within the relevant sector. An analyst may cover multiple sectors.
Credit Suisse's distribution of stock ratings (and banking clients) is:
Global Ratings DistributionRating Versus universe (%) Of which banking clients (%)Outperform/Buy* 45% (64% banking clients)Neutral/Hold* 39% (61% banking clients)Underperform/Sell* 14% (53% banking clients)Restricted 2%*For purposes of the NYSE and FINRA ratings distribution disclosure requirements, our stock ratings of Outperform, Neutral, and Underperform most closely correspond to Buy, Hold, and Sell, respectively; however, the meanings are not the same, as our stock ratings are determined on a relative basis. (Please refer to definitions above.) An investor's decision to buy or sell a security should be based on investment objectives, current holdings, and other individual factors.
24 March 2017
Renewable Roundup 15
Important Global Disclosures Credit Suisse’s research reports are made available to clients through our proprietary research portal on CS PLUS. Credit Suisse research products may also be made available through third-party vendors or alternate electronic means as a convenience. Certain research products are only made available through CS PLUS. The services provided by Credit Suisse’s analysts to clients may depend on a specific client’s preferences regarding the frequency and manner of receiving communications, the client’s risk profile and investment, the size and scope of the overall client relationship with the Firm, as well as legal and regulatory constraints. To access all of Credit Suisse’s research that you are entitled to receive in the most timely manner, please contact your sales representative or go to https://plus.credit-suisse.com . Credit Suisse’s policy is to update research reports as it deems appropriate, based on developments with the subject company, the sector or the market that may have a material impact on the research views or opinions stated herein.Credit Suisse's policy is only to publish investment research that is impartial, independent, clear, fair and not misleading. For more detail please refer to Credit Suisse's Policies for Managing Conflicts of Interest in connection with Investment Research: https://www.credit-suisse.com/sites/disclaimers-ib/en/managing-conflicts.html . Credit Suisse does not provide any tax advice. Any statement herein regarding any US federal tax is not intended or written to be used, and cannot be used, by any taxpayer for the purposes of avoiding any penalties.See the Companies Mentioned section for full company names The subject company (PEGI.OQ, TERP.OQ, GPRE.OQ, MBTN.S, 1798.HK, ABY.OQ, NEE.N, BEP_u.TO, 002202.SZ, CEN.NZ, CAFD.OQ, JKS.N, 6674.T, NYLD.N, SCHN.PA, SIEGn.DE, SPWR.OQ, HXL.N, CSIQ.OQ, UPM1V.HE, TSLA.OQ, YGE.N, JASO.OQ, VSLR.N, NEP.N, 0958.HK, RUN.OQ, WCHG.DE, FSLR.OQ, 0916.HK, GLBL.OQ, SOL.N, SIME.KL, AZRE.N) currently is, or was during the 12-month period preceding the date of distribution of this report, a client of Credit Suisse.Credit Suisse provided investment banking services to the subject company (GPRE.OQ, MBTN.S, 1798.HK, NEE.N, BEP_u.TO, CEN.NZ, JKS.N, NYLD.N, SCHN.PA, SPWR.OQ, CSIQ.OQ, TSLA.OQ, YGE.N, VSLR.N, NEP.N, 0958.HK, RUN.OQ, WCHG.DE, AZRE.N) within the past 12 months.Credit Suisse provided non-investment banking services to the subject company (NEP.N) within the past 12 monthsCredit Suisse has managed or co-managed a public offering of securities for the subject company (MBTN.S, 1798.HK, NEE.N, NYLD.N, SCHN.PA, SPWR.OQ, TSLA.OQ, VSLR.N, WCHG.DE, AZRE.N) within the past 12 months.Credit Suisse has received investment banking related compensation from the subject company (GPRE.OQ, MBTN.S, 1798.HK, NEE.N, BEP_u.TO, CEN.NZ, JKS.N, NYLD.N, SCHN.PA, SPWR.OQ, CSIQ.OQ, TSLA.OQ, YGE.N, VSLR.N, NEP.N, 0958.HK, RUN.OQ, WCHG.DE, AZRE.N) within the past 12 monthsCredit Suisse expects to receive or intends to seek investment banking related compensation from the subject company (PEGI.OQ, TERP.OQ, GPRE.OQ, MBTN.S, 1798.HK, ABY.OQ, NEE.N, BEP_u.TO, 002202.SZ, CEN.NZ, CAFD.OQ, JKS.N, NYLD.N, AGCO.N, 1211.HK, SCHN.PA, SIEGn.DE, SPWR.OQ, HXL.N, CSIQ.OQ, UPM1V.HE, TSLA.OQ, YGE.N, JASO.OQ, VSLR.N, NEP.N, 0958.HK, RUN.OQ, WCHG.DE, FSLR.OQ, 0916.HK, GLBL.OQ, SOL.N, SIME.KL, AZRE.N) within the next 3 months.Credit Suisse has received compensation for products and services other than investment banking services from the subject company (NEP.N) within the past 12 monthsAs of the date of this report, Credit Suisse makes a market in the following subject companies (FSLR.OQ).Credit Suisse may have interest in (SIME.KL)Please visit https://credit-suisse.com/in/researchdisclosure for additional disclosures mandated vide Securities And Exchange Board of India (Research Analysts) Regulations, 2014Credit Suisse may have interest in (SUZL.NS, AZRE.N)As of the end of the preceding month, Credit Suisse beneficially own 1% or more of a class of common equity securities of (TERP.OQ, ABY.OQ, CSIQ.OQ, RUN.OQ, 0916.HK).As of the end of the preceding month, Credit Suisse beneficially own between 1-3% of a class of common equity securities of (MBTN.S).Credit Suisse beneficially holds >0.5% long position of the total issued share capital of the subject company (RUN.OQ).Credit Suisse has a material conflict of interest with the subject company (NEE.N) . Credit Suisse Securities (USA) LLC is serving as lead financial advisors to NextEra Energy.Credit Suisse has a material conflict of interest with the subject company (TSLA.OQ) . Credit Suisse is acting as financial advisor to SolarCity Corporation (SQTY.OQ) on their sale to Tesla Motors Inc (TSLA.OQ).Credit Suisse has a material conflict of interest with the subject company (SIME.KL) . Credit Suisse is Financial Advisor to Sime Darby in relation to its acquisition of Saizen REIT and injection of their Australian industrial assets via an RTO, and Issue Manager to the Enlarged Group (Saizen REIT following the Proposed Acquisition closing), in addition to being one of the placement agents for the compliance placement.For other important disclosures concerning companies featured in this report, including price charts, please visit the website at https://rave.credit-suisse.com/disclosures or call +1 (877) 291-2683. For date and time of production, dissemination and history of recommendation for the subject company(ies) featured in this report, disseminated within the past 12 months, please refer to the link: https://rave.credit-suisse.com/disclosures/view/report?i=291432&v=2sagn81ucdcmuvmo6bq43n9po . Important Regional Disclosures Singapore recipients should contact Credit Suisse AG, Singapore Branch for any matters arising from this research report.The analyst(s) involved in the preparation of this report may participate in events hosted by the subject company, including site visits. Credit Suisse does not accept or permit analysts to accept payment or reimbursement for travel expenses associated with these events.Restrictions on certain Canadian securities are indicated by the following abbreviations: NVS--Non-Voting shares; RVS--Restricted Voting Shares; SVS--Subordinate Voting Shares.Individuals receiving this report from a Canadian investment dealer that is not affiliated with Credit Suisse should be advised that this report may not contain regulatory disclosures the non-affiliated Canadian investment dealer would be required to make if this were its own report.
24 March 2017
Renewable Roundup 16
For Credit Suisse Securities (Canada), Inc.'s policies and procedures regarding the dissemination of equity research, please visit https://www.credit-suisse.com/sites/disclaimers-ib/en/canada-research-policy.html.The following disclosed European company/ies have estimates that comply with IFRS: (SCHN.PA, SIEGn.DE, UPM1V.HE).Credit Suisse has acted as lead manager or syndicate member in a public offering of securities for the subject company (TERP.OQ, GPRE.OQ, MBTN.S, 1798.HK, NEE.N, BEP_u.TO, NYLD.N, SCHN.PA, SPWR.OQ, TSLA.OQ, VSLR.N, NEP.N, 0958.HK, RUN.OQ, WCHG.DE, GLBL.OQ, AZRE.N) within the past 3 years.Principal is not guaranteed in the case of equities because equity prices are variable.Commission is the commission rate or the amount agreed with a customer when setting up an account or at any time after that.Credit Suisse has entered into a strategic partnership with First NZ Capital ("FNZC"). Pursuant to this agreement, (CEN.NZ) is jointly covered by Credit Suisse and First NZ Capital.This research report is authored by:Credit Suisse Securities (USA) LLC ...................................................................................................................Andrew Hughes ; Maheep MandloiImportant disclosures regarding companies or other issuers that are the subject of this report are available on Credit Suisse’s disclosure website at https://rave.credit-suisse.com/disclosures or by calling +1 (877) 291-2683.
24 March 2017
Renewable Roundup 17
This report is produced by subsidiaries and affiliates of Credit Suisse operating under its Global Markets Division. For more information on our structure, please use the following link: https://www.credit-suisse.com/who-we-are This report may contain material that is not directed to, or intended for distribution to or use by, any person or entity who is a citizen or resident of or located in any locality, state, country or other jurisdiction where such distribution, publication, availability or use would be contrary to law or regulation or which would subject Credit Suisse or its affiliates ("CS") to any registration or licensing requirement within such jurisdiction. All material presented in this report, unless specifically indicated otherwise, is under copyright to CS. None of the material, nor its content, nor any copy of it, may be altered in any way, transmitted to, copied or distributed to any other party, without the prior express written permission of CS. All trademarks, service marks and logos used in this report are trademarks or service marks or registered trademarks or service marks of CS or its affiliates.The information, tools and material presented in this report are provided to you for information purposes only and are not to be used or considered as an offer or the solicitation of an offer to sell or to buy or subscribe for securities or other financial instruments. CS may not have taken any steps to ensure that the securities referred to in this report are suitable for any particular investor. CS will not treat recipients of this report as its customers by virtue of their receiving this report. The investments and services contained or referred to in this report may not be suitable for you and it is recommended that you consult an independent investment advisor if you are in doubt about such investments or investment services. Nothing in this report constitutes investment, legal, accounting or tax advice, or a representation that any investment or strategy is suitable or appropriate to your individual circumstances, or otherwise constitutes a personal recommendation to you. CS does not advise on the tax consequences of investments and you are advised to contact an independent tax adviser. Please note in particular that the bases and levels of taxation may change. Information and opinions presented in this report have been obtained or derived from sources believed by CS to be reliable, but CS makes no representation as to their accuracy or completeness. CS accepts no liability for loss arising from the use of the material presented in this report, except that this exclusion of liability does not apply to the extent that such liability arises under specific statutes or regulations applicable to CS. This report is not to be relied upon in substitution for the exercise of independent judgment. CS may have issued, and may in the future issue, other communications that are inconsistent with, and reach different conclusions from, the information presented in this report. Those communications reflect the different assumptions, views and analytical methods of the analysts who prepared them and CS is under no obligation to ensure that such other communications are brought to the attention of any recipient of this report. Some investments referred to in this report will be offered solely by a single entity and in the case of some investments solely by CS, or an associate of CS or CS may be the only market maker in such investments. Past performance should not be taken as an indication or guarantee of future performance, and no representation or warranty, express or implied, is made regarding future performance. Information, opinions and estimates contained in this report reflect a judgment at its original date of publication by CS and are subject to change without notice. The price, value of and income from any of the securities or financial instruments mentioned in this report can fall as well as rise. The value of securities and financial instruments is subject to exchange rate fluctuation that may have a positive or adverse effect on the price or income of such securities or financial instruments. Investors in securities such as ADR's, the values of which are influenced by currency volatility, effectively assume this risk. Structured securities are complex instruments, typically involve a high degree of risk and are intended for sale only to sophisticated investors who are capable of understanding and assuming the risks involved. The market value of any structured security may be affected by changes in economic, financial and political factors (including, but not limited to, spot and forward interest and exchange rates), time to maturity, market conditions and volatility, and the credit quality of any issuer or reference issuer. Any investor interested in purchasing a structured product should conduct their own investigation and analysis of the product and consult with their own professional advisers as to the risks involved in making such a purchase. Some investments discussed in this report may have a high level of volatility. High volatility investments may experience sudden and large falls in their value causing losses when that investment is realised. Those losses may equal your original investment. Indeed, in the case of some investments the potential losses may exceed the amount of initial investment and, in such circumstances, you may be required to pay more money to support those losses. Income yields from investments may fluctuate and, in consequence, initial capital paid to make the investment may be used as part of that income yield. Some investments may not be readily realisable and it may be difficult to sell or realise those investments, similarly it may prove difficult for you to obtain reliable information about the value, or risks, to which such an investment is exposed. This report may provide the addresses of, or contain hyperlinks to, websites. Except to the extent to which the report refers to website material of CS, CS has not reviewed any such site and takes no responsibility for the content contained therein. Such address or hyperlink (including addresses or hyperlinks to CS's own website material) is provided solely for your convenience and information and the content of any such website does not in any way form part of this document. Accessing such website or following such link through this report or CS's website shall be at your own risk.
This report is issued and distributed in European Union (except Switzerland): by Credit Suisse Securities (Europe) Limited, One Cabot Square, London E14 4QJ, England, which is authorised by the Prudential Regulation Authority and regulated by the Financial Conduct Authority and the Prudential Regulation Authority. Germany: Credit Suisse Securities (Europe) Limited Niederlassung Frankfurt am Main regulated by the Bundesanstalt fuer Finanzdienstleistungsaufsicht ("BaFin"). United States and Canada: Credit Suisse Securities (USA) LLC; Switzerland: Credit Suisse AG; Brazil: Banco de Investimentos Credit Suisse (Brasil) S.A or its affiliates; Mexico: Banco Credit Suisse (México), S.A. (transactions related to the securities mentioned in this report will only be effected in compliance with applicable regulation); Japan: by Credit Suisse Securities (Japan) Limited, Financial Instruments Firm, Director-General of Kanto Local Finance Bureau ( Kinsho) No. 66, a member of Japan Securities Dealers Association, The Financial Futures Association of Japan, Japan Investment Advisers Association, Type II Financial Instruments Firms Association; Hong Kong: Credit Suisse (Hong Kong) Limited; Australia: Credit Suisse Equities (Australia) Limited; Thailand: Credit Suisse Securities (Thailand) Limited, regulated by the Office of the Securities and Exchange Commission, Thailand, having registered address at 990 Abdulrahim Place, 27th Floor, Unit 2701, Rama IV Road, Silom, Bangrak, Bangkok10500, Thailand, Tel. +66 2614 6000; Malaysia: Credit Suisse Securities (Malaysia) Sdn Bhd; Singapore: Credit Suisse AG, Singapore Branch; India: Credit Suisse Securities (India) Private Limited (CIN no.U67120MH1996PTC104392) regulated by the Securities and Exchange Board of India as Research Analyst (registration no. INH 000001030) and as Stock Broker (registration no. INB230970637; INF230970637; INB010970631; INF010970631), having registered address at 9th Floor, Ceejay House, Dr.A.B. Road, Worli, Mumbai - 18, India, T- +91-22 6777 3777; South Korea: Credit Suisse Securities (Europe) Limited, Seoul Branch; Taiwan: Credit Suisse AG Taipei Securities Branch; Indonesia: PT Credit Suisse Securities Indonesia; Philippines:Credit Suisse Securities (Philippines ) Inc., and elsewhere in the world by the relevant authorised affiliate of the above.Additional Regional DisclaimersHong Kong: Credit Suisse (Hong Kong) Limited ("CSHK") is licensed and regulated by the Securities and Futures Commission of Hong Kong under the laws of Hong Kong, which differ from Australian laws. CSHKL does not hold an Australian financial services licence (AFSL) and is exempt from the requirement to hold an AFSL under the Corporations Act 2001 (the Act) under Class Order 03/1103 published by the ASIC in respect of financial services provided to Australian wholesale clients (within the meaning of section 761G of the Act). Research on Taiwanese securities produced by Credit Suisse AG, Taipei Securities Branch has been prepared by a registered Senior Business Person. Australia (to the extent services are offered in Australia): Credit Suisse Securities (Europe) Limited (“CSSEL”) and Credit Suisse International (“CSI”) are authorised by the Prudential Regulation Authority and regulated by the Financial Conduct Authority (“FCA”) and the Prudential Regulation Authority under UK laws, which differ from Australian Laws. CSSEL and CSI do not hold an Australian Financial Services Licence (“AFSL”) and are exempt from the requirement to hold an AFSL under the Corporations Act (Cth) 2001 (“Corporations Act”) under Class Order 03/1099 published by the Australian Securities and Investments Commission (“ASIC”), in respect of the financial services provided to Australian wholesale clients (within the meaning of section 761G of the Corporations Act). This material is not for distribution to retail clients and is directed exclusively at Credit Suisse's professional clients and eligible counterparties as defined by the FCA, and wholesale clients as defined under section 761G of the Corporations Act. Credit Suisse (Hong Kong) Limited (“CSHK”) is licensed and regulated by the Securities and Futures Commission of Hong Kong under the laws of Hong Kong, which differ from Australian laws. CSHKL does not hold an AFSL and is exempt from the requirement to hold an AFSL under the Corporations Act under Class Order 03/1103 published by the ASIC in respect of financial services provided to Australian wholesale clients (within the meaning of section 761G of the Corporations Act). Credit Suisse Securities (USA) LLC (CSSU) and Credit Suisse Asset Management LLC (CSAM LLC) are licensed and regulated by the Securities Exchange Commission of the United States under the laws of the United States, which differ from Australian laws. CSSU and CSAM LLC do not hold an AFSL and is exempt from the requirement to hold an AFSL under the Corporations Act under Class Order 03/1100 published by the ASIC in respect of financial services provided to Australian wholesale clients (within the meaning of section 761G of the Corporations Act). Malaysia: Research provided to residents of Malaysia is authorised by the Head of Research for Credit Suisse Securities (Malaysia) Sdn Bhd, to whom they should direct any queries on +603 2723 2020. Singapore: This report has been prepared and issued for distribution in Singapore to institutional investors, accredited investors and expert investors (each as defined under the Financial Advisers Regulations) only, and is also distributed by Credit Suisse AG, Singapore Branch to overseas investors (as defined under the Financial Advisers Regulations). Credit Suisse AG, Singapore Branch may distribute reports produced by its foreign entities or affiliates pursuant to an arrangement under Regulation 32C of the Financial Advisers Regulations. Singapore recipients should contact Credit Suisse AG, Singapore Branch at +65-6212-2000 for matters arising from, or in connection with, this report. By virtue of your status as an institutional investor, accredited investor, expert investor or overseas investor, Credit Suisse AG, Singapore Branch is exempted from complying with certain compliance requirements under the Financial Advisers Act, Chapter 110 of Singapore (the “FAA”), the Financial Advisers Regulations and the relevant Notices and Guidelines issued thereunder, in respect of any financial advisory service which Credit Suisse AG, Singapore Branch may provide to you. UAE: This information is being distributed by Credit Suisse AG (DIFC Branch), duly licensed and regulated by the Dubai Financial Services Authority (“DFSA”). Related financial services or products are only made available to Professional Clients or Market Counterparties, as defined by the DFSA, and are not intended for any other persons. Credit Suisse AG (DIFC Branch) is located on Level 9 East, The Gate Building, DIFC, Dubai, United Arab Emirates. EU: This report has been produced by subsidiaries and affiliates of Credit Suisse operating under its Global Markets Division In jurisdictions where CS is not already registered or licensed to trade in securities, transactions will only be effected in accordance with applicable securities legislation, which will vary from jurisdiction to jurisdiction and may require that the trade be made in accordance with applicable exemptions from registration or licensing requirements. Non-US customers wishing to effect a transaction should contact a CS entity in their local jurisdiction unless governing law permits otherwise. US customers wishing to effect a transaction should do so only by contacting a representative at Credit Suisse Securities (USA) LLC in the US. Please note that this research was originally prepared and issued by CS for distribution to their market professional and institutional investor customers. Recipients who are not market professional or institutional investor customers of CS should seek the advice of their independent financial advisor prior to taking any investment decision based on this report or for any necessary explanation of its contents. This research may relate to investments or services of a person outside of the UK or to other matters which are not authorised by the Prudential Regulation Authority and regulated by the Financial Conduct Authority and the Prudential Regulation Authority or in respect of which the protections of the Prudential Regulation Authority and Financial Conduct Authority for private customers and/or the UK compensation scheme may not be available, and further details as to where this may be the case are available upon request in respect of this report. CS may provide various services to US municipal entities or obligated persons ("municipalities"), including suggesting individual transactions or trades and entering into such transactions. Any services CS provides to municipalities are not viewed as "advice" within the meaning of Section 975 of the Dodd-Frank Wall Street Reform and Consumer Protection Act. CS is providing any such services and related information solely on an arm's length basis and not as an advisor or fiduciary to the municipality. In connection with the provision of the any such services, there is no agreement, direct or indirect, between any municipality (including the officials,management, employees or agents thereof) and CS for CS to provide advice to the municipality. Municipalities should consult with their financial, accounting and legal advisors regarding any such services provided by CS. In addition, CS is not acting for direct or indirect compensation to solicit the municipality on behalf of an unaffiliated broker, dealer, municipal securities dealer, municipal advisor, or investment adviser for the purpose of obtaining or retaining an engagement by the municipality for or in connection with Municipal Financial Products, the issuance of municipal securities, or of an investment adviser to provide investment advisory services to or on behalf of the municipality. If this report is being distributed by a financial institution other than Credit Suisse AG, or its affiliates, that financial institution is solely responsible for distribution. Clients of that institution should contact that institution to effect a transaction in the securities mentioned in this report or require further information. This report does not constitute investment advice by Credit Suisse to the clients of the distributing financial institution, and neither Credit Suisse AG, its affiliates, and their respective officers, directors and employees accept any liability whatsoever for any direct or consequential loss arising from their use of this report or its content. Principal is not guaranteed. Commission is the commission rate or the amount agreed with a customer when setting up an account or at any time after that. Copyright © 2017 CREDIT SUISSE AG and/or its affiliates. All rights reserved. Investment principal on bonds can be eroded depending on sale price or market price. In addition, there are bonds on which investment principal can be eroded due to changes in redemption amounts. Care is required when investing in such instruments. When you purchase non-listed Japanese fixed income securities (Japanese government bonds, Japanese municipal bonds, Japanese government guaranteed bonds, Japanese corporate bonds) from CS as a seller, you will be requested to pay the purchase price only.