renewable energy resources: analysis for the transition … · renewable energy resources: analysis...
TRANSCRIPT

Renewable Energy Resources:
Analysis for the Transition of Future Energy Needs
An Interactive Qualifying Project Report completed in partial fulfillment of the Bachelor
of Science degree at Worcester Polytechnic Institute
Submitted by:
Zuhir Sras
Adam Garcia
Submitted to:
WORCESTER POLYTECHNIC INSTITUTE
Prof. Mayer Humi
March 10, 2017

2
Abstract
This research examines various aspects of energy sources, including analyzing
fossil fuel and renewable energies, their environmental impacts, and their future potentials. It
also looks into future renewable technologies and the need for them based on population and
global energy consumption. Lastly, a few ideas for how to provide clean, renewable energies in
the future are investigated. This report is a summary of renewable energies importance, and
why humanity should put more resources into developing a sustainable future.
3
Contents Abstract ......................................................................................................................................................... 2
Chapter 1: Introduction & Background ......................................................................................................... 5
1.1 Need for Energy .................................................................................................................................. 5
1.1.1 Global Energy Consumption ........................................................................................................ 5
1.1.2 Population .................................................................................................................................... 6
1.2 Pollution .............................................................................................................................................. 8
1.3 Fossil Fuel Reserves ........................................................................................................................... 10
Chapter 2: Fossil Fuels & the Future ........................................................................................................... 13
2. Introduction ........................................................................................................................................ 13
2.1 Coal ................................................................................................................................................... 13
2.2 Natural Gas ....................................................................................................................................... 14
2.3 Oil ...................................................................................................................................................... 15
2.4 Projections ........................................................................................................................................ 17
2.5 Conclusion ......................................................................................................................................... 21
Chapter 3: Renewable Energy ..................................................................................................................... 22
3. Introduction ........................................................................................................................................ 22
3.1 Solar Energy ...................................................................................................................................... 22
3.1.1 Overview .................................................................................................................................... 22
3.1.2 Analysis ...................................................................................................................................... 23
3.2 Nuclear Energy .................................................................................................................................. 36
3.2.1 Overview .................................................................................................................................... 36
3.2.2 Analysis ...................................................................................................................................... 36
3.3 Wind and Tidal Energy ...................................................................................................................... 37
3.3.1 Wind Energy ............................................................................................................................... 37
3.3.2 Wind Potential ........................................................................................................................... 38
3.3.3 Tidal Energy ................................................................................................................................ 39
3.3.4 Tidal Potential ............................................................................................................................ 39
Chapter 4: Futuristic Ideas .......................................................................................................................... 40
4.1 Moon Solar Base ............................................................................................................................... 40
4.1.1 Overview .................................................................................................................................... 40
4.1.2 Concept Validation Plan ‘ ........................................................................................................... 46

4
4.2 Helium 3 ............................................................................................................................................ 50
4.2.1 Overview .................................................................................................................................... 50
4.3 Space Solar Farm ............................................................................................................................... 51
4.3.1 Overview .................................................................................................................................... 51
Chapter 5: Plan Proposition ........................................................................................................................ 53
5.1 Overview ........................................................................................................................................... 53
5.2 Analysis ............................................................................................................................................. 54
5.3 Evaluation ......................................................................................................................................... 56
Chapter 6: Concluding Remarks .................................................................................................................. 59
6.1 Conclusions ....................................................................................................................................... 59
6.2 Recommendations ............................................................................................................................ 60
Bibliography ................................................................................................................................................ 61

5
Chapter 1: Introduction & Background
The global consumption of energy has been on a steady increase during the past few
decades, and it doesn’t look like it’s going to slow down. This increase is due to factors including
population increase, driving and growing economies, and increase of technologies. This need
for energy has to be supplied from some form of energy source. This energy source could be
fossil fuels, since this technology is already trusted, and proven to supply tons of energy to the
global population.
But what about renewable, sustainable and clean energies? These technologies are still
developing, and in the present time, are unable to provide enough energy to supply the human
race with all their needs. What if governments and private entities were to innovate these
technologies into providing a larger percentage of energy to the population in near future?
What could be done? Is there a price tag? Why should we even look into these technologies
instead of focusing more on fossil fuels? This report will delve into these questions, provide
answers that will prove why renewable energies are so important in the upcoming and distant
future, and give some ideas as how to start down a renewable future.
1.1 Need for Energy
1.1.1 Global Energy Consumption
The International Energy Agency is an autonomous intergovernmental organization,
made up of 29 member countries, whose mission is based on energy security, environmental
awareness, economic development and engagement worldwide. They publish the World Energy
Outlook, which is a widely popular and highly respected publication. This publication was used
to facilitate the information in this report.
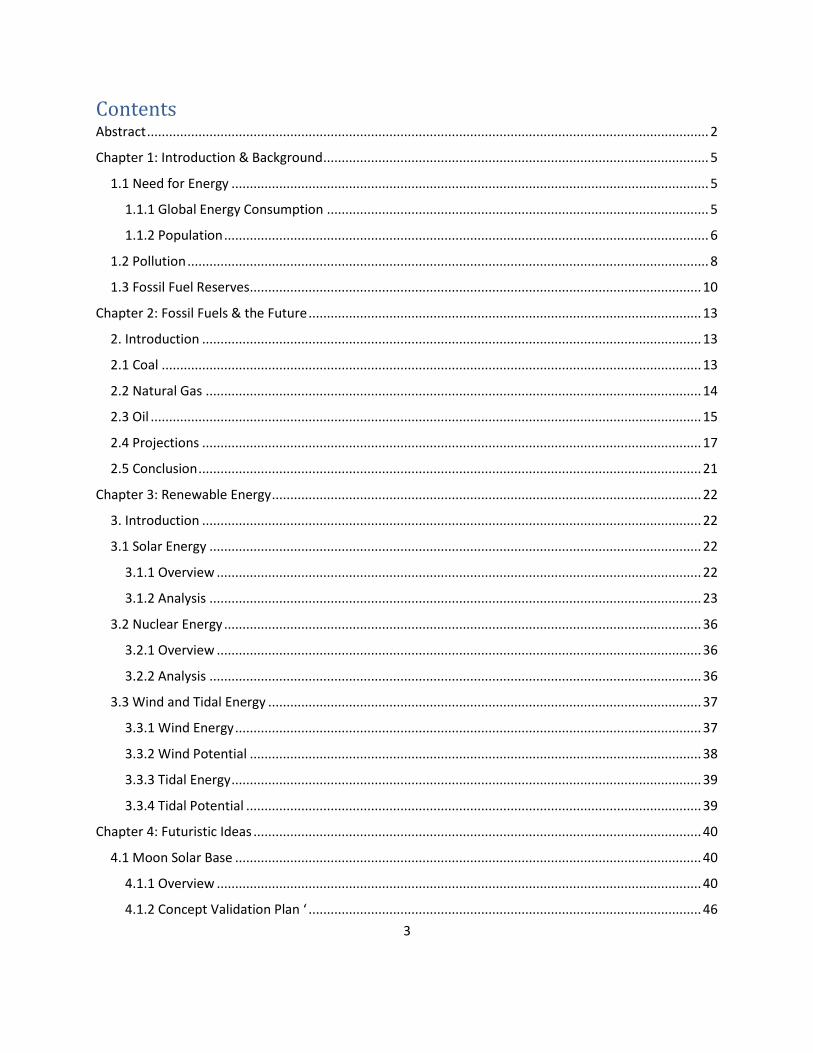
The report examined the global consumption of energy from the year 2000 to 2014, and
created a prediction model to examine what the consumption of energy in Terawatt-hours
could be in the future.
6
Information taken from Worldbank [32]
The trend line is equal to 585.778x-1.158E6. Using this trend line, we can predict the
amount of energy that will be consumed for any given year. Taking a look at the year 2050, the
consumption of energy is calculated to be 42844.9 TWh, a huge increase from today’s
consumption, 22928.448 TWh. The difference is estimated to be around 19916 TWh from 2050
to today, which is almost 2 times the amount of energy consumed today.
1.1.2 Population
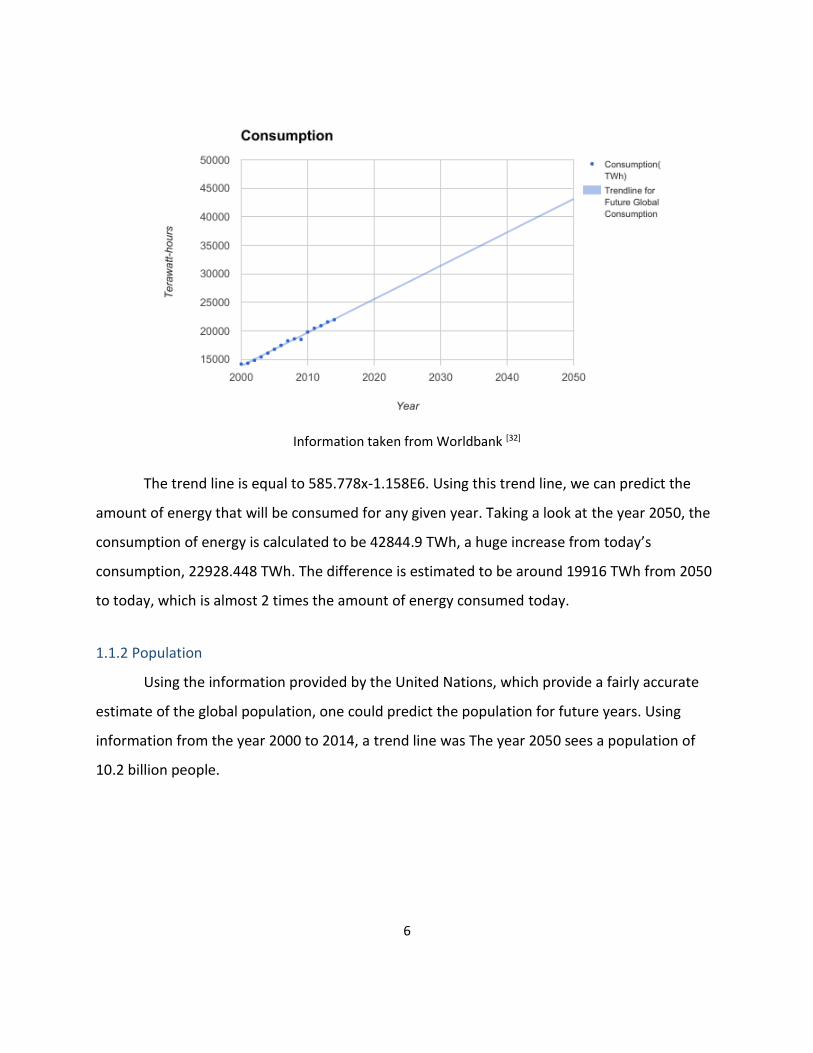
Using the information provided by the United Nations, which provide a fairly accurate
estimate of the global population, one could predict the population for future years. Using
information from the year 2000 to 2014, a trend line was The year 2050 sees a population of
10.2 billion people.
7
Information taken from CIA Factbook [34]
The trendline here is equal to .081x-156.826.
Global population has always been increasing, as the estimated annual growth rate is around
1.06%, as stated by the CIA Factbook.
However, the United Nations survey on global population predicts the amount of people the
world will have in the future, and their information predicts around 9.8 billion for the year
2050.

8
Population prediction by United Nations [35]
Whether the United Nation’s prediction, or our prediction is correct, the increase in
population is still at least 2 billion people, a huge jump in just 33 years.
1.2 Pollution
Pollution is a large reason as why renewable energy sources are needed for the future
of the world. Extracting fossil fuels has led a large amount of environmental impacts. Drilling
and mining strip the surface of resources and can damage nature. Coal miners can get injured
or develop lung diseases, and mines affect surface and subsurface water flows, mines can catch
on fire, collapse or be left abandoned. Oil and gas drilling can leak into the natural world, such
as offshore platforms. Recently, there was even a movie about the an oil rig, called Deepwater
Horizon, where an oil platform caught fire and exploded, killing 11 people and leaking over 4.9
million barrels of oil. This damaged nearby wildlife, thus affecting fishing and other jobs of the

9
people in the Gulf of Mexico. Fracking has been thought to cause chemicals in water sources,
and small earthquakes, as fracking destroys layers of shale rock underneath the ground. Also,
with land oil drilling, they can destroy various areas in nature for drills.
Looking at global warming emission, when fossil fuels are burned, they release carbon
dioxide or methane, which go into the atmosphere and trap heat. This is what many scientists
believe to create global warming, where the ice caps are melting because of the increase in
temperature of the world. Also, the transport of fossil fuels has also been a problem. Whether
it be the pipelines of natural gas breaking/catching on fire, or a container ship spilling over
262,000 barrels of oil of the shores of Alaska.
Burning these fuels causes emissions such as sulfur dioxide, nitrogen oxide, soot, carbon
dioxide and methane to enter the atmosphere. All these have health and environmental
impacts on the world and people around. Also, water from fossil fuel waste, needs to be
discharged somewhere, usually in the nearby lands and water sources.
The amount of ways fossil fuels can affect the world around it should be reasons enough
to push for renewable sources, as renewable have a very low impact on the world and people
around.
The EIA has also predicted the decrease in CO2 from energy production, but the amount
of carbon dioxide produced is still too much.

10
The following graph shows the predicted increase of CO2 emissions using information from the
IEA. One could see that if we do not change current fuel technology, or start increasing the
usage of renewables over fossil fuels, emission levels per year will continue to increase, which
may cause harm the environment through global warming.
1.3 Fossil Fuel Reserves
All fossil fuels have a finite amount, and as energy demands increase, and if technology
doesn’t improve to compete, we will run out eventually. Every year, British Petroleum produces
the BP Statistical Review of World Energy31, which provides “high-quality and globally
consistent data on world energy markets.” They reference the media, the academic world,
governments and energy companies, and the report comes out every June for the previous
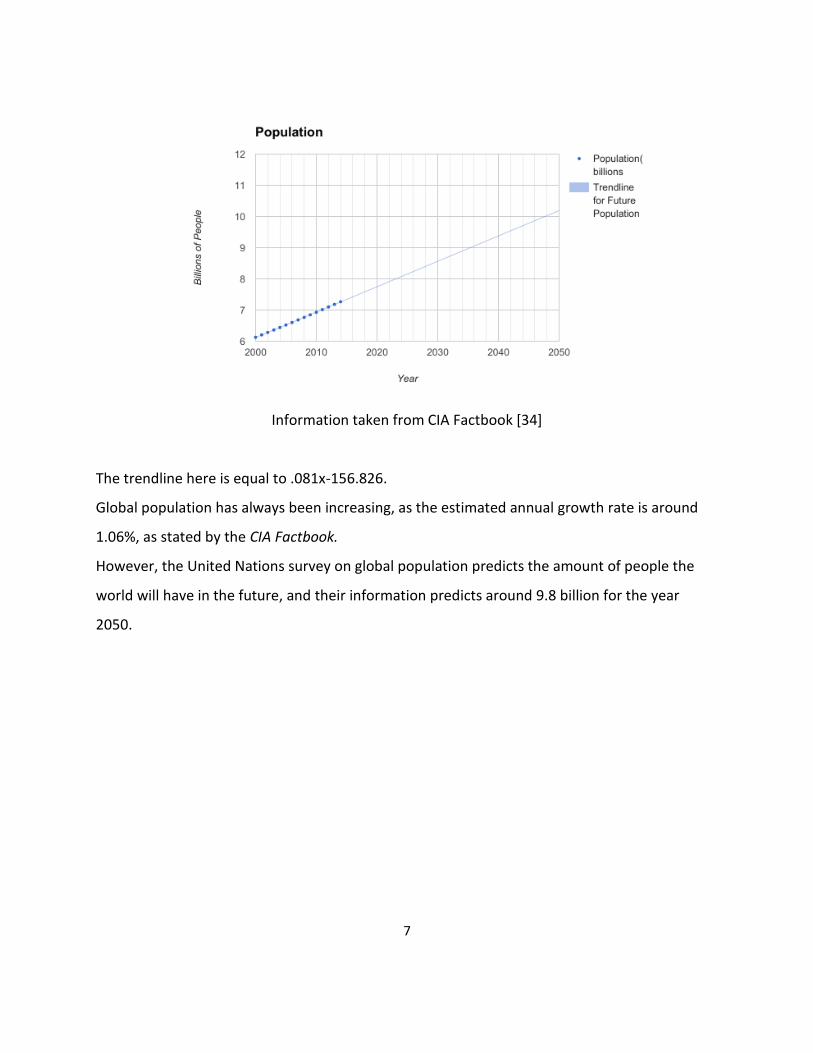
year. The following information was taken from that report. The column Year [End of] means
that the next 4 columns were examined at that year's end. The column World shows the
amount of that fossil fuel in the given unit left globally, while OECD and Non-OECD show the
amount of that fossil fuel per those groups of countries. Reserves/Production/Year gives the
11
amount of years of that fossil fuel predicted to be left, after examining the amount of reserves
proven to be available, over the production of that fossil fuel per year.
Natural Gas [Trillion Cubic Feet]
Year [End of] World OECD Non-OECD Reserves/Production/Year
2015 6599.4 690.8 5908.8 52.8
2014 6606.4 688.2 5918.3 54.1
2013 6557.8 678.3 5979.5 55.1
Oil [Billion Barrels]
Year [End of] World OECD Non-OECD Reserves/Production/Year
2015 1697.6 255.3 1442.3 50.7
2014 1700.1 248.6 1451.5 52.5
2013 1687.9 248.8 1439.1 53.3
Coal [Million tons]
Year [End of] World OECD Non-OECD Reserves/Production/Year
2015 891531 384815 506716 114
2014 891531 384815 506716 110
2013 891531 384815 506716 113
Looking at the last column, one can see that fossil fuels have a limited lifetime. The
amount of years has been decreasing for natural gas and oil, but coal has increased somewhat.
Even so, gas and oil are predicted to last for around another 50 years given current technology,
consumption, and proven reserves.

12
Looking at the increase of population and energy consumption, one can tell there is a
need for more energy sources. Looking at pollution and the diminishing reserves of fossil fuels,
one can tell there needs to be a different, renewable energy source. All of these factors lead to
the fact that the world needs to invest in a clean, sustainable future.

13
Chapter 2: Fossil Fuels & the Future
2. Introduction
In 2015, the United States generated about 4 trillion kilowatt hours, 67% of the
electricity in the United States was produced by fossil fuels,1 as stated from the United States
Energy Information Administration. The other 33% of the country’s generated electricity was
created by nuclear and renewable energy sources. The National Academies of Sciences states
that 81%2 of the energy produced in the United States comes from oil, natural gas, and coal.
Looking at a global scale, in 2013, the 81.2% of the world’s energy was generated by fossil
fuels.3 In 2015, the world consumed on average 95,008 barrels of oil a day,4 which is over 34.6
million barrels of oil consumed in that year.
All of this consumption is set to increase. The U.S. Energy Information Administration
predicts the global energy consumption to increase by 48% by the year 2040. Non-OPEC
countries, such as Russia, China, and India are projected to be the main drivers in this global
growth of consumption. That large increase in consumption means the human race will need to
find a solution that will supply that demand. Renewable energy sources are the solutions that
are needed.
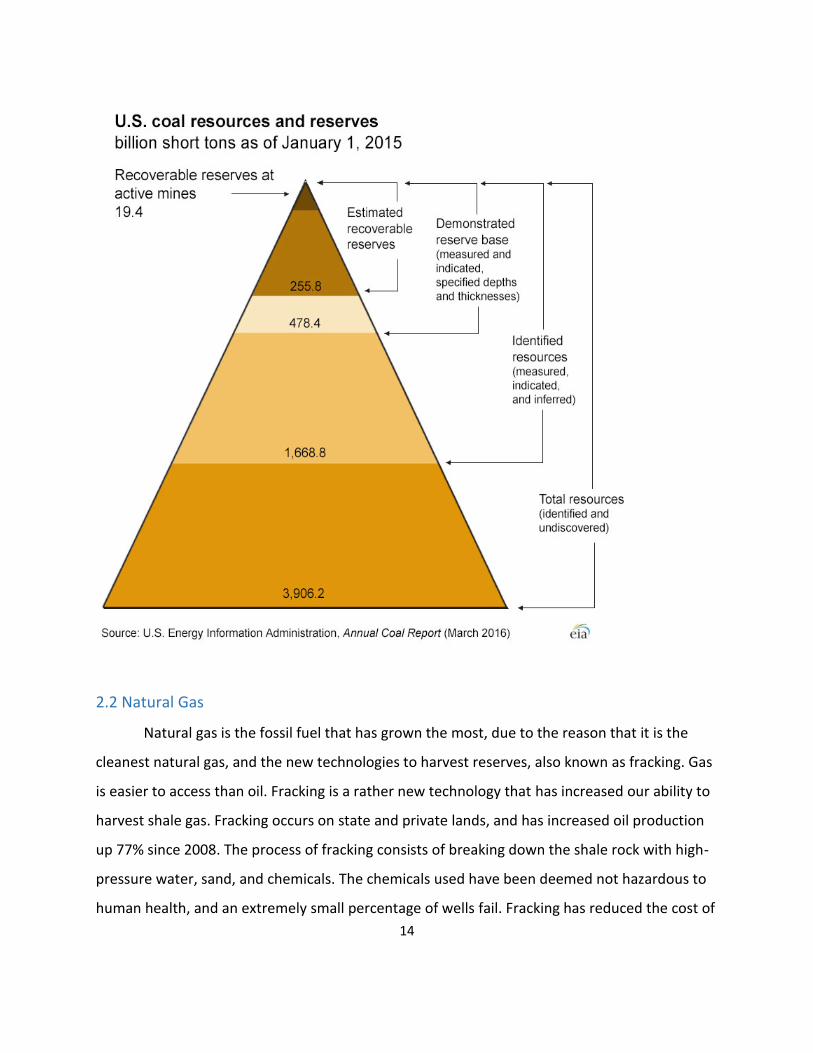
2.1 Coal
Coal was previously the most used energy source on the planet, however it is seen has
the most harmful fossil fuel as it causes the most air pollution. Coal generated around 40% of
the world’s electricity generation in 2015, and is predicted to generate between 29-33% of the
world’s energy consumption in 2040. However, due to the harmful effects on the environment,
coal’s market share is plateauing as major countries are moving towards natural gas, while
smaller countries in need of cheap energy are using more coal. The United States has an
estimated 3.9 trillion short tons of coal that is recoverable or in reserve. The United States has
an estimated 26% of the world’s coal reserves, followed by Russia at 18%, China at 13%, and
Australia at 9%. The following image shows various estimated amounts of coal recoverable, or
thought to be available to be mined.
14
2.2 Natural Gas
Natural gas is the fossil fuel that has grown the most, due to the reason that it is the
cleanest natural gas, and the new technologies to harvest reserves, also known as fracking. Gas
is easier to access than oil. Fracking is a rather new technology that has increased our ability to
harvest shale gas. Fracking occurs on state and private lands, and has increased oil production
up 77% since 2008. The process of fracking consists of breaking down the shale rock with high-
pressure water, sand, and chemicals. The chemicals used have been deemed not hazardous to
human health, and an extremely small percentage of wells fail. Fracking has reduced the cost of

15
barrels of oil by $90. Looking at reserves, natural gas reserves were predicted to be at almost 7
trillion cubic feet by the end of 2015.
2.3 Oil
Most of the world’s transportation needs is powered by oil, and is not really used for
electricity generation. Asia is the major source of oil demand growth, namely China. Oil, or
petroleum, is mixture of hydrocarbons formed by plants and animals from millions of years ago.
In recent history, crude oil is now able to be harvest in the deep ocean using off-shore drilling
techniques, increasing supply. Offshore drilling has greatly increased the amount of oil that can
be harvested, even though about 100 countries worldwide produce crude oil. The proven
amount of barrels of oil in reserve is about 1700 thousand million barrels of oil.

16
BP Proved Oil Reserves by World/Region/Country (Thousand Million barrels) [33]
17
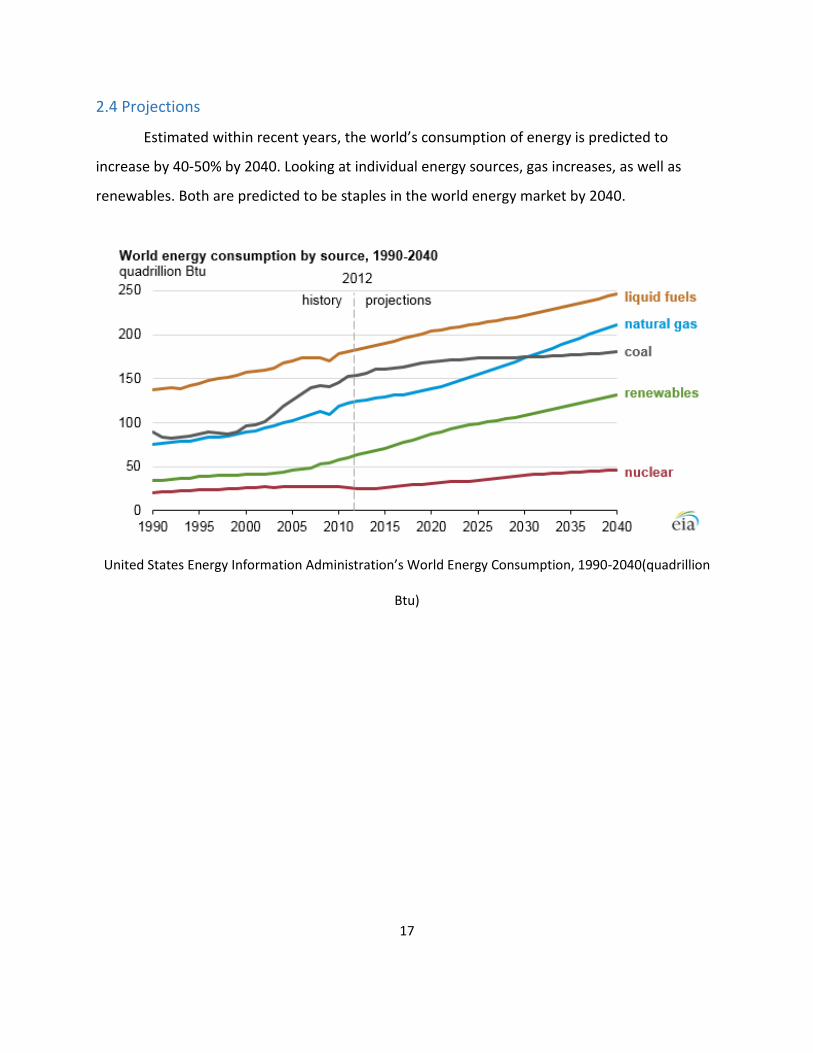
2.4 Projections
Estimated within recent years, the world’s consumption of energy is predicted to
increase by 40-50% by 2040. Looking at individual energy sources, gas increases, as well as
renewables. Both are predicted to be staples in the world energy market by 2040.
United States Energy Information Administration’s World Energy Consumption, 1990-2040(quadrillion
Btu)

18
BP Reserves/Production ratios(billions of barrels)
Looking at the following image, we can see how much proven reserves of coal, natural
gas, and crude oil exist, and the amount of years of extraction remaining until we deplete the
Earth. Gas and oil have a little over 50 years of extraction remaining, which is a very short
amount of time to come up with a renewable energy solution to the energy gap that will be
generated
Proven Reserves of Fossil Fuels/Years Remaining [28]
19
Need for Different Energy Sources
The future of energy consumption depends on a variety of factors, they are
● Population growth
● Economic growth
● Climate and energy policies
● Improvement of technologies
● Unrest in oil producing countries
● OECD vs. Non-OECD countries
● Unknown reserves
● Future of renewables/nuclear energies
Taking a look at population growth, the more people in a region requires more energy
compared to the same region with less people. For a population accelerating in growth, the
demand for energy also increases.
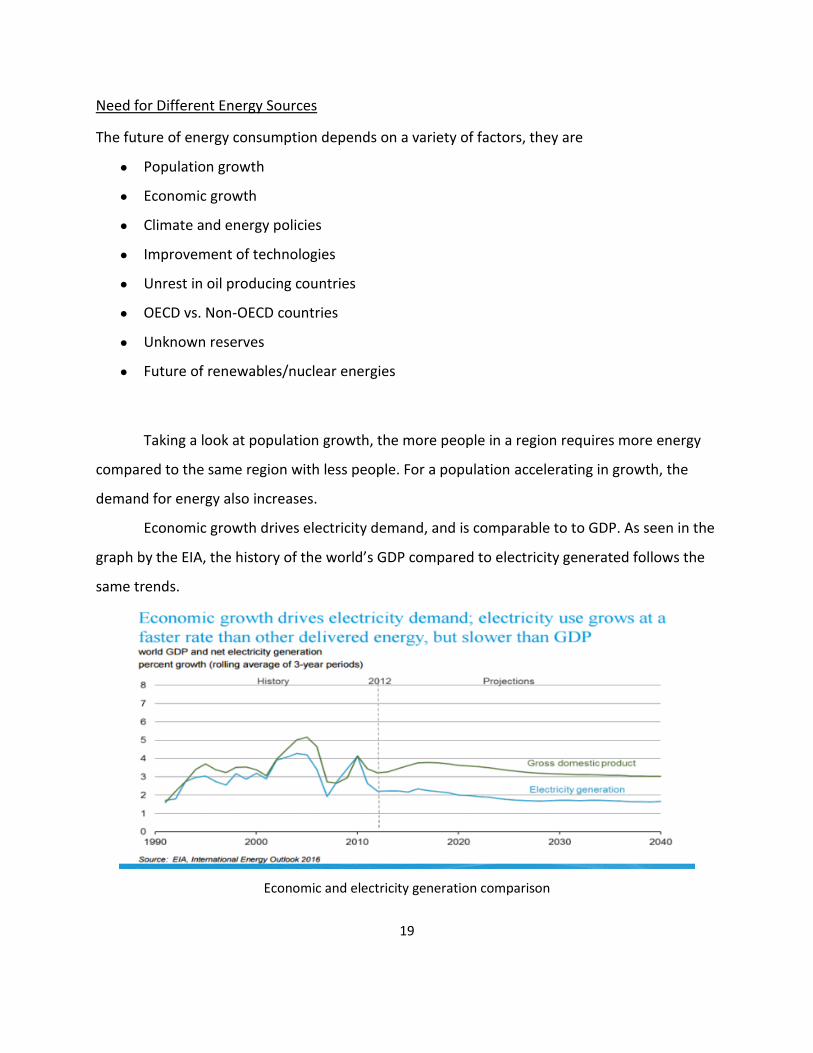
Economic growth drives electricity demand, and is comparable to to GDP. As seen in the
graph by the EIA, the history of the world’s GDP compared to electricity generated follows the
same trends.
Economic and electricity generation comparison

20
Climate and energy policies would affect energy consumption. Depending on laws,
mandates, agreements, countries could reduce or be allowed to increase energy generated
from fossil fuels, focus more on renewable energies, or a variety of those two options.
Technology improvement would lead to more efficient generation of electricity from
resources, such as better miles per gallon with vehicles, or better coal-fueled power plants, or
other options. Also, better technologies could help find a better way to harvest fossil fuels, or
discover ways to tap resources we thought were previously unable to harvest.
Unrest in certain oil-producing countries, such as the Middle East, or South American
countries, would affect the production of fossil fuels. More unrest could cause shortage, or
steep price variations, such as during the oil crisis during the 70’s. This could lead to variations
in fossil fuels being utilized to generate electricity for the world’s needs. Also, countries are at
political risk when harvesting and trading fossil fuels. Russia, for example, is under sanctions.
Most countries’ oil infrastructures are working at maximum capacity, except for some Middle
Eastern countries. As global resources decrease, the Middle East would need to increase
production to help meet the energy gap, but unrest, delays, more infrastructures are needed if
shortfalls are to be avoided.
Non-OECD countries, primarily Russia, China, and India, are huge drivers in the future of
energy usage and demand.
OECD and Non-OECD energy market shares
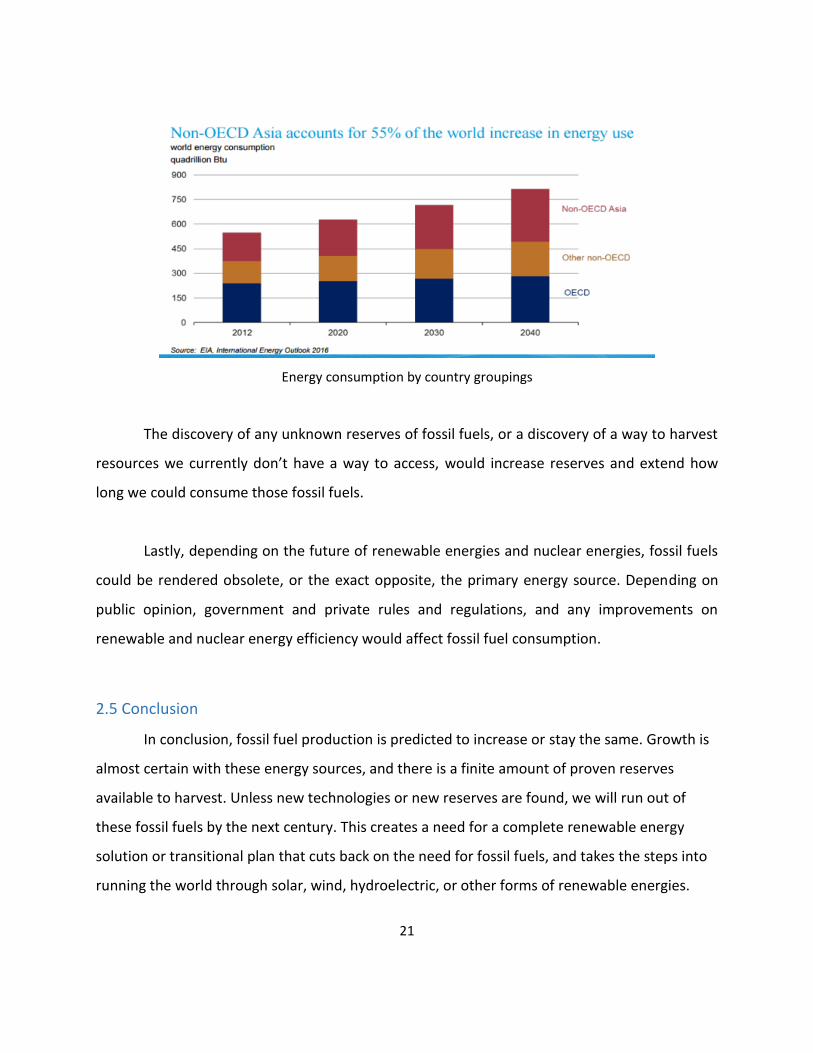
21
Energy consumption by country groupings
The discovery of any unknown reserves of fossil fuels, or a discovery of a way to harvest
resources we currently don’t have a way to access, would increase reserves and extend how
long we could consume those fossil fuels.
Lastly, depending on the future of renewable energies and nuclear energies, fossil fuels
could be rendered obsolete, or the exact opposite, the primary energy source. Depending on
public opinion, government and private rules and regulations, and any improvements on
renewable and nuclear energy efficiency would affect fossil fuel consumption.
2.5 Conclusion
In conclusion, fossil fuel production is predicted to increase or stay the same. Growth is
almost certain with these energy sources, and there is a finite amount of proven reserves
available to harvest. Unless new technologies or new reserves are found, we will run out of
these fossil fuels by the next century. This creates a need for a complete renewable energy
solution or transitional plan that cuts back on the need for fossil fuels, and takes the steps into
running the world through solar, wind, hydroelectric, or other forms of renewable energies.

22
Chapter 3: Renewable Energy
3. Introduction
In this chapter we will take a look at the different sources of renewable energy that are
currently available. We will examine both the renewable energy technologies that are currently
available commercially in today’s market and some of the technologies that are in the testing phase
being developed in laboratories that have high future potential. Furthermore, we will look into the
different sources of solar energy and nuclear energy while providing an in depth analysis that aligns with
the purpose of this project – proposing a plan for the transition of future energy needs.
3.1 Solar Energy
3.1.1 Overview
In this subsection, we will take a look at the different sources of solar energy and the current
technologies that are available both commercially and under development in laboratories’ research
phase. We will examine the potential of the overall solar energy sources while taking into consideration
the constraints and barriers that might limit the mass application of such technologies. In addition, we
will provide detailed analysis of the current use of solar energy sources and try to predict the growth
and capacity of those sources in providing our future energy needs. Finally, we will provide an overview
of the strengths and compromises of this type of renewable energy source.
Every day, the sunlight emitted from the surface of the sun travels at the speed of light across
the vacuum of space for 8 minutes and 20 seconds until it reaches the surface of our beloved home,
planet earth [1]. Sunlight is a crucial element that enabled earth to harbor life, and they carry energy that
comes from a very reliable source - the sun. Solar energy is simply the energy produced using the
sunlight emitted from the surface of the sun that reaches the surface of our planet earth. This energy
can be harvested using different mechanisms and then converted into many forms of energy to best suit
our needs such as electricity and heat. Solar energy is considered an environmentally friendly source of
renewable energy for two main reasons:
● Unlike many other sources of energy, it doesn’t produce greenhouse gases such as
carbon dioxide and other air pollutants.
● When harvesting and storing solar energy in the right manners, it doesn’t have

23
significant negative impacts that could destroy the environment.
The potential of using solar energy to cover our worldwide energy needs is enormous. According
to the U.S. Department of Energy, 173,000 terawatts strike the earth continuously. However, there’re
some compromises to relying on this source of energy that prevent us from solely depending on it. As
we are going to show in our analysis, we can incorporate this source of energy to fulfill a significant
portion of our energy needs, but it has to be complimented with other viable sources of energy.
3.1.2 Analysis
Now it is time to look at different solar energy based technologies and examine them to see
how they could fit into our proposed plan for transitioning our future worldwide energy needs. We will
mainly focus on solar cells as they are the primary mechanism used to harvest solar energy on a mass
level.
Solar (PV) Cells
Generally speaking, solar cells are the cells which we use in order to convert sunlight into
electrical power. Those cells contain semiconductors made of different materials such as silicon. Solar
cells play a big role in the overall solar power generation globally. Nowadays, there are many promising
technologies spawning consistently in order to advance solar cells and increase their conversion
efficiency.
Most of the solar cells used commercially today are silicon-based, where silicon is not the most
efficient material for sunlight energy conversion but is used for its’ commercial viability. On average,
silicon based solar cells have a sunlight to electricity conversion rate of 15%. Most of the solar panels
people use have a conversion efficiency of less than 14% [2]. This is mainly attributed to the band gap
property of Silicon, which prevents the semiconductor from converting high-energy photons in an
efficient manner reducing its’ overall efficiency [3].
One big factor that plays a crucial role in understanding solar cells is the Shockley-Quiessler
limit. The Shockley-Quiessler limit describes the cap efficiency of single-layered solar cells Which is
about 32% for most of the materials involved with solar cell technology. Taking into consideration the
enormous number of different solar cells’ technologies, we will limit our scope to those which we think
that are promising and have a high potential of being used commercially.

24
Promising Technologies:
Step Solar Cells
Overview: A Step solar cell is a new solar cell technology that exposes greater surface area to
the sun’s light in order to increase energy output. This technology is still in research and testing
phase and was developed by a team of researchers from MIT and the Masdar Institute of
Science and Technology [5].
Technology:
● This technology arranges two layers of different sunlight absorbing material in a specific
way that maximizes surface exposure to the sun.
● Typically this kind of technology that uses multiple layers are expensive to produce, but
for this specific type of solar cells researchers came up with a new, low-cost process in
order to achieve commercially viable production cost.
● The materials used in designing the layers are gallium arsenide phosphide and the same
material used in most of solar cells, silicon [6].
● The theoretical efficiency for this technology is 40% with an estimated practical
efficiency of 35% [6]. However, it is important to note that those numbers have not been
verified and based on theoretical calculations.
Figure 1: Step Solar Cell [6]
25
Analysis:
● In order for this technology to be commercially viable, many hurdles must be overcome.
It has a strong implementation potential for very specific uses where cost is not a factor
and efficiency and properties such as weight and tolerance are of a significant
importance such as aerospace and defense applications.
● The biggest barrier for this technology to be commercially viable is cost. Compared to
other multi-layered solar cell technologies it can be offered at a relatively lower price
point due to the unique manufacturing process involved. However, a lot of progress and
innovation is required in order to offer this technology at a reasonable price point for
mass commercial use.
Quantum dot Solar Cells
Overview: Quantum dot solar cells use a different approach that any of the other available
technologies in its’ structure design. Generally speaking, quantum dot solar cells replace bulk
materials used for absorbing sunlight such as silicon which is commonly used in current solar cell
technologies with solar dots. Quantum dots are nano semiconductor particles where they have
different electrical and other properties due to their unique properties [7]. There are many
different technologies that fall under the umbrella of quantum dot solar cells, but we are only
going to review one technology in particular that is commercially promising.
Technology:
● This technology mobilizes the use of a matrix of crystals as opposed to silicon, where it
provides the ability to efficiently harvest a larger amount of sunlight [8].
● This technology is particularly promising due to the low cost of manufacturing involved
and the lightweight associated with it. The manufacturing processes are mainly low
because of the processes that take place don’t require high temperature and pressure
to be completed [9].
● The theoretical efficiency for this technology is 40% with a current lab efficiency of ~ 9%
[9]. However, it is important to note that this technology is still very young and
underdeveloped with very high potential.

26
Figure 2: Quantum Dot Solar Cell [8]
Analysis:
● Compared to all other solar cell technologies, this one is particularly the most
promising one. For the past few years an enormous amount of research has been
done in order to expedite the growth of the quantum dot solar cell technology,
where there’re noticeable improvements accomplished every year.
● The most attractive element with this type of technology is the low production and
maintenance cost and the high possible conversion efficiency.
Transparent Solar Cells
Overview: Transparent solar cells is a new type of solar cell technology that is transparent in
nature and its’ purpose is to provide means to harvest solar energy when applied to different
everyday products and objects such as electronics display screens and building windows. This
technology is still in research and testing phase and was developed by a team of researchers
from MIT [10].

27
Technology:
● This technology is used by deploying very small coating particles on various materials
such as building windows and electronic devices display screens. It is not meant to
function as a standalone technology but rather to operate as a supplementing
technology of other solar cell technologies and to broaden the range of solar cell
technology applications by enabling implementation on everyday objects that
otherwise cannot be used to capture solar energy (windows, screens, etc).
● This technology is primary attractive because it can be deposited on different surfaces
and materials without changing their looks enabling solar energy harvesting
applications on what would be otherwise immoblizable objects for harvesting solar
energy.
● The transparent look of this technology is achieved by manipulating the band gap of
materials in order to prevent them from absorbing the parts of the light that is visible to
the human eyes, which results in a loss of conversion efficiency.
● The current conversion efficiency of this technology is hovering around 2% which is
considered significantly low when compared to other technologies. However, a
conversion efficiency of 5% is very manageable to achieve within the next 10 years.
● The following self explanatory figure illustrates the main components involved in
structuring this technology.
Figure 3: Transparent Solar Cell Components [10]
28
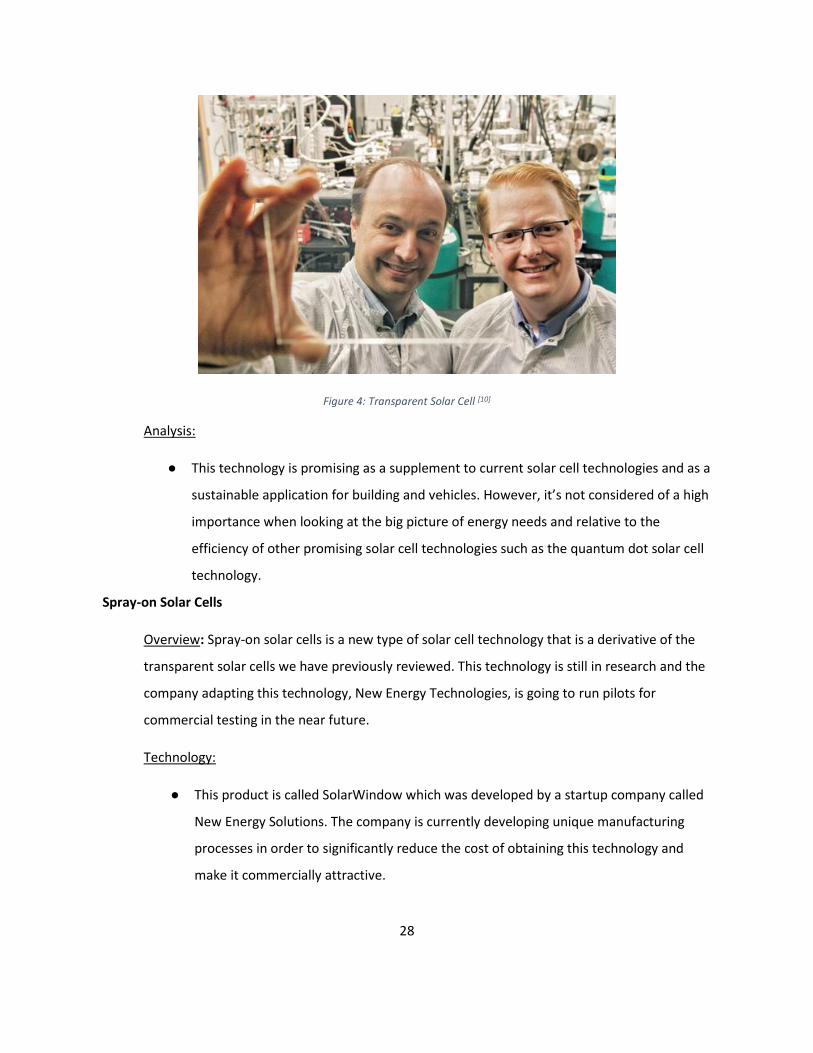
Figure 4: Transparent Solar Cell [10]
Analysis:
● This technology is promising as a supplement to current solar cell technologies and as a
sustainable application for building and vehicles. However, it’s not considered of a high
importance when looking at the big picture of energy needs and relative to the
efficiency of other promising solar cell technologies such as the quantum dot solar cell
technology.
Spray-on Solar Cells
Overview: Spray-on solar cells is a new type of solar cell technology that is a derivative of the
transparent solar cells we have previously reviewed. This technology is still in research and the
company adapting this technology, New Energy Technologies, is going to run pilots for
commercial testing in the near future.
Technology:
● This product is called SolarWindow which was developed by a startup company called
New Energy Solutions. The company is currently developing unique manufacturing
processes in order to significantly reduce the cost of obtaining this technology and
make it commercially attractive.
29
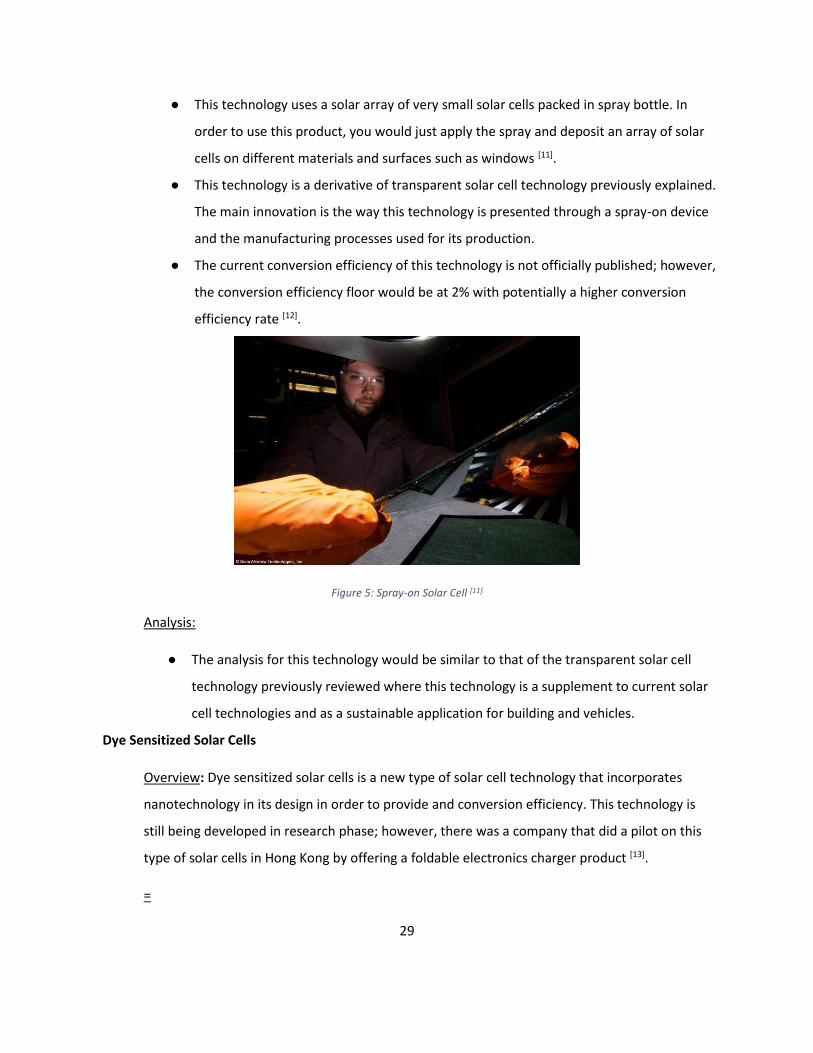
● This technology uses a solar array of very small solar cells packed in spray bottle. In
order to use this product, you would just apply the spray and deposit an array of solar
cells on different materials and surfaces such as windows [11].
● This technology is a derivative of transparent solar cell technology previously explained.
The main innovation is the way this technology is presented through a spray-on device
and the manufacturing processes used for its production.
● The current conversion efficiency of this technology is not officially published; however,
the conversion efficiency floor would be at 2% with potentially a higher conversion
efficiency rate [12].
Figure 5: Spray-on Solar Cell [11]
Analysis:
● The analysis for this technology would be similar to that of the transparent solar cell
technology previously reviewed where this technology is a supplement to current solar
cell technologies and as a sustainable application for building and vehicles.
Dye Sensitized Solar Cells
Overview: Dye sensitized solar cells is a new type of solar cell technology that incorporates
nanotechnology in its design in order to provide and conversion efficiency. This technology is
still being developed in research phase; however, there was a company that did a pilot on this
type of solar cells in Hong Kong by offering a foldable electronics charger product [13].
=

30
Technology:
● This technology has a relatively low manufacturing cost when compared to other solar
cell technologies [13].
● They nanotechnology embedded in this kind of solar cell technology allow a high level
of flexibility which makes it an appealing product in many applications.
● Researchers successfully printed this type of technology on rubber and other materials
[13].
● The current conversion efficiency of this technology is about ~ 14% and is continuously
improving due to research breakthroughs [13].
Figure 6: Dye Sensitized Solar Cell [13]
Analysis:
● This technology is very promising especially in the context of carry on products in
order to recharge different personal electronic devices. However, when looking at it
from a big picture point of view, it is not the most promising technology for a mass
scale implementation.
31
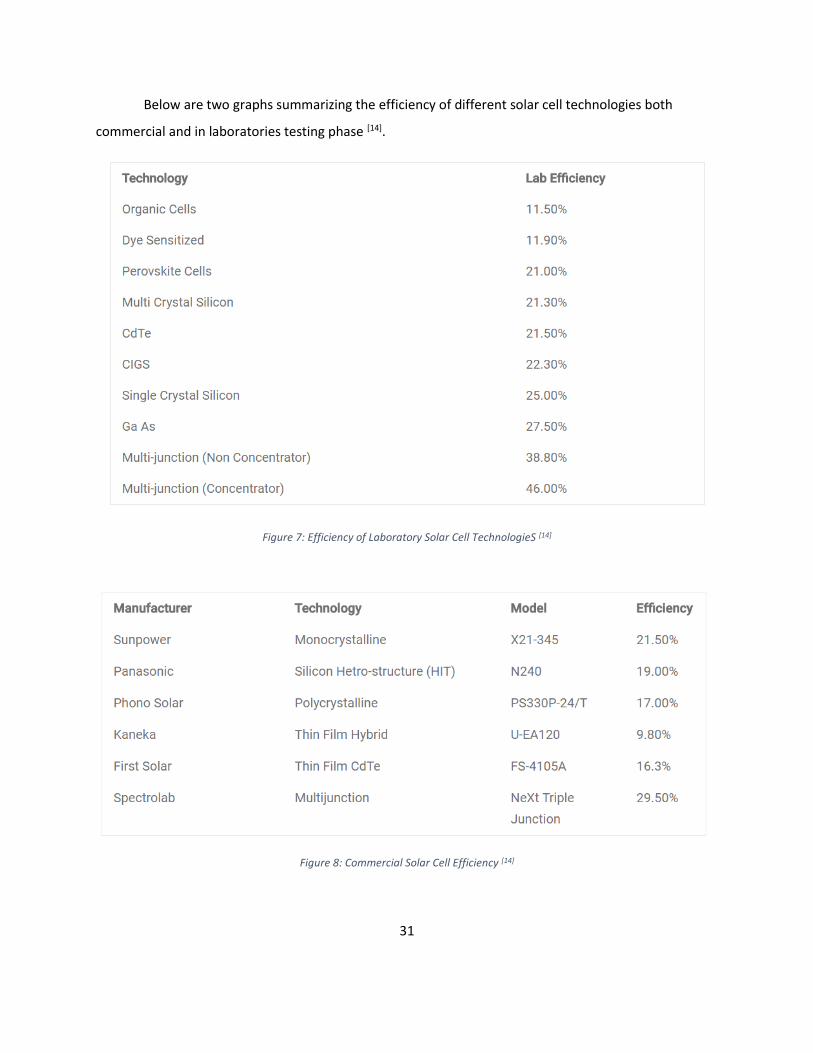
Below are two graphs summarizing the efficiency of different solar cell technologies both
commercial and in laboratories testing phase [14].
Figure 7: Efficiency of Laboratory Solar Cell TechnologieS [14]
Figure 8: Commercial Solar Cell Efficiency [14]
32
3.1.2.1 Strengths
After having reviewed solar energy source and different promising technologies that are
currently under development, we can evaluate this type of renewable energy source and see what
strengths and compromises they have to offer. Below is a summary of the strengths associated with
solar energy sources:
● Unlike many other sources of energy, solar energy doesn’t produce greenhouse gases
such as carbon dioxide and other air pollutants which severely impact the environment
negatively.
● When harvesting and storing solar energy in the right manners, it doesn’t have
significant negative impacts that could destroy the environment.
● Solar energy is a very sustainable type of renewable energy, where know that the sun is
still going to exist for a very long time providing earth with sunlight.
● When compared to other sources of renewable energy, solar energy has a low price
point and can commercially implemented in a more efficient way.
3.1.2.2 Compromises
Solar energy as we explained earlier has a lot of strengths and can successfully fulfill a significant
portion of our energy needs. However, they are some downsides associated with solar energy sources
that prevent us from realistically solely relying on it. The following is summary of the compromises
associated with solar energy:
● The sun is not always available to supply our energy needs when we need them. This is
a big downside to solar energy as it’s not only absent during night, but for a lot of
geographic areas it is not a viable source of energy for days and weeks on end.
● The potential for harvesting solar energy is very high. However, to be efficiently used
and implemented a storing mechanism should be present and there are a lot of barriers
to storing energy that constraint our usage limit for this source of renewable energy.

33
● Solar energy is considered seasonal in most places on earth, where the time of the year
significantly affects the availability of such renewable energy source making the
infrastructure for solar energy unusable for a good portion of the calendar year.
● Harvesting solar energy in an effective and efficient manner requires an enormous cross
sectional area to be covered with solar panels, and this is simply not an option for big
and crowded cities where there is not enough land for this technology to be
implemented.
● In order to implement and use solar energy sources on a mass scale, a massive
infrastructure is required that is not currently in place. The development of the
required infrastructure requires an enormous amount of capital to be invested and long
time line before it can be completed in order to support a significant portion of energy
demands.
3.1.2.3 Potential and Barriers
As you might be thinking at this moment, solar energy has enormous potential when it comes to
fulfilling our continuously growing energy needs. However, there are one variable that is not very
obvious that plays a crucial role when evaluating renewable energy sources, energy storage limits. We
will talk about the energy storage constraint in more depth after we go over the overall potential of
solar energy.
In 2015, the United States generated about roughly 4 trillion kilowatthour of electricity where
only 0.6% share was that of solar energy sources [15]. This is a very low number especially considering the
growth the solar power industry has been experiencing. According to the SEIA, the solar power industry
has been experiencing an annual growth of 60% since 2006 [16]. The following figure showcases this
growth for the solar power industry in the United States.
34
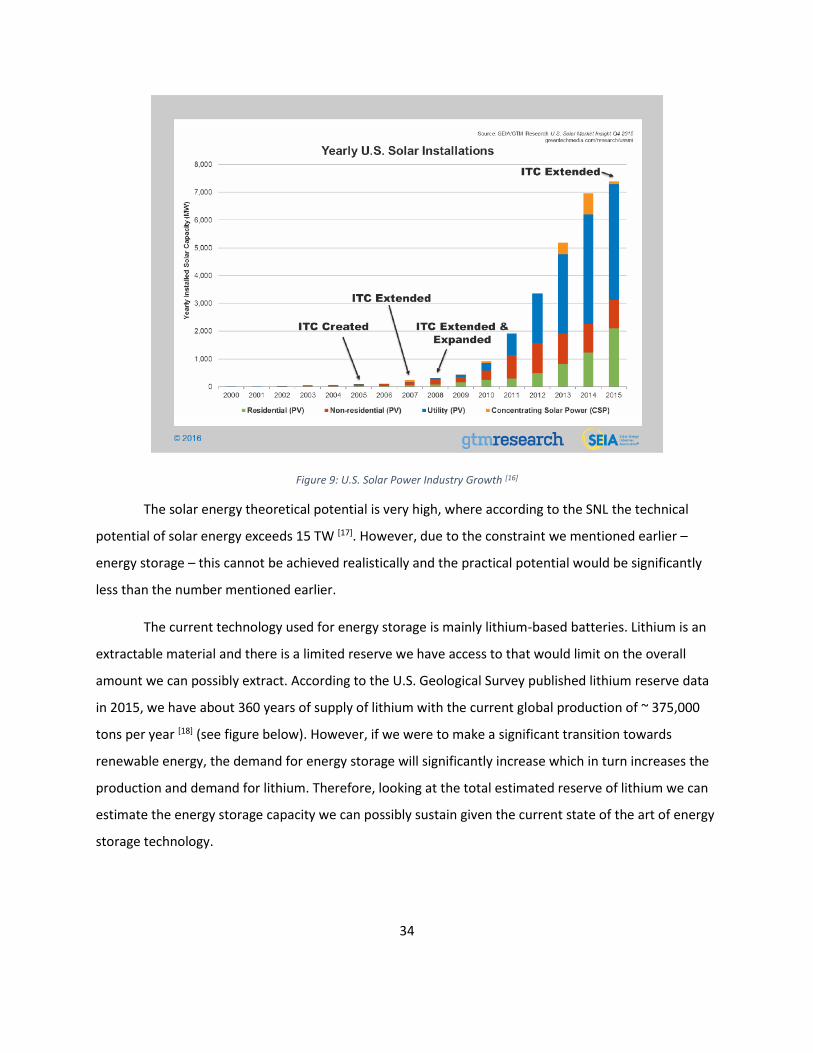
Figure 9: U.S. Solar Power Industry Growth [16]
The solar energy theoretical potential is very high, where according to the SNL the technical
potential of solar energy exceeds 15 TW [17]. However, due to the constraint we mentioned earlier –
energy storage – this cannot be achieved realistically and the practical potential would be significantly
less than the number mentioned earlier.
The current technology used for energy storage is mainly lithium-based batteries. Lithium is an
extractable material and there is a limited reserve we have access to that would limit on the overall
amount we can possibly extract. According to the U.S. Geological Survey published lithium reserve data
in 2015, we have about 360 years of supply of lithium with the current global production of ~ 375,000
tons per year [18] (see figure below). However, if we were to make a significant transition towards
renewable energy, the demand for energy storage will significantly increase which in turn increases the
production and demand for lithium. Therefore, looking at the total estimated reserve of lithium we can
estimate the energy storage capacity we can possibly sustain given the current state of the art of energy
storage technology.

35
Figure 10: Lithium Global Reserve (Metric Tons) [18]
A 65 kilowatthour battery needs about 10 kilogram lithium, and with the consumption rate in
2015 of 40 trillion kilowatthour, we would need about 615 billion of those batteries to store that
amount of energy. With an average of 10 kilogram per battery, that would result in 6153 billion
kilograms of lithium, which is about 0.002% of the global available reserves of lithium just to fulfill and
store the annual energy needs in the United States, and not globally. One thing to note is that we won’t
need to store our entire energy needs, but this was for demonstrating a very big barrier to renewable
energy, as we need to have breakthroughs in energy storage technologies before we can implement
them on a mass scale. Now there are other non-lithium based methods to store energy such as pump
hydroelectric storage, but those are neglected in our analysis due to the fact that they cannot be used
on a mass scale when compared to lithium-based energy storage technologies.
36
3.2 Nuclear Energy
3.2.1 Overview
At a molecular level, atoms are held together using energy. Nuclear energy is the extraction of
the energy stored in the nucleus of atoms achieved by splitting atoms (mainly uranium) which drives
them to release an enormous amount of energy [19]. Nuclear energy can be mobilized in order to
generate electricity that can later be used for our energy consumption needs. The current nuclear
reactors use fission in order to produce energy, where it is used in many countries all over the world.
There is another method that could potentially be used to generate nuclear energy called fusion, which
fuses atoms together as opposed to splitting them in order to release enormous amount of energy even
when compared to fission technology. However, our current progress is far behind to consider fusion as
a realistic method that we could obtain and use in the near future.
3.2.2 Analysis
Nuclear energy is considered a renewable source of energy. However, there are many
downsides to it that overweight its benefits. Over the course of the last few decades, there have been
many accidents associated with nuclear energy and nuclear reactors that negatively impacted the
environment. We are going to review some of the major accidents that have occurred somewhat
recently with this source of energy.
Three Mile Island Accident
The Three Mile Island power station is a reactor which is located near Middletown,
Pennsylvania. On March 28, 1979 a portion of the unit 2 (TMI-2) reactor melted down during operation
at a maximum power [20]. This failure caused the internal section of the system to heat up. This in turn
caused an automatic shutdown of the reactor. This resulted in a severe damage of the reactor’s core as
the operators were unable to respond to the incident in time [20].
This was one of the alarming accidents in the nuclear energy field. The incident resulted in small
radioactive releases, but fortunately they had no visible effects. The accident was primarily due to poor
emergency facility management training.
Currently, the accident’s radioactive waste was removed from the site, and the Department of
Energy’s Idaho National Laboratory acquired the reactor’s core and fuel [20].

37
Davis-Besse Nuclear Power Station
Davis-Besse Nuclear Power Station is a single pressurized water reactor located in Ottawa
County, Ohio, USA [21]. In 2002, a hole in the reactor head that was caused due to corrosion factors was
discovered [21]. Although the corrosion did not lead to an accident, it could have resulted in measurable
damages.
Davis-Besse Nuclear Power Station was shut down by the Nuclear Regulatory Commission (NRC).
The operating company of the nuclear facility, FirstEnergy, was given the largest fine by the NRC and
settled after paying $33 million in fines [21].
3.3 Wind and Tidal Energy
3.3.1 Wind Energy
Wind energy uses the constant air currents to turn turbines, which in turn generate
electricity. The sun’s radiation heats up various areas of the Earth’s atmosphere, which creates
differing air currents and pressure. This happens on a global scale, which in turn creates wind
everywhere across the globe. Wind turbines have a MAXIMUM efficiency of 59%33, which is
limited by factors including air speed, mass and amount, and the turbine itself. Turbines also
rely on lift and drag forces, which are harnessed by the shape of the blades. The blades spin,
rotating a magnetic field inside which induces a current. This current generates power from the
turbine.
Wind turbines have a variety of shapes and sizes. Reading this, you probably are
thinking about the large ones placed in big, open areas to generate the most electricity. The can
be scaled down, depending on who is using it, and they can be in all sorts of designs.
To improve these technologies, they could be higher, larger, and have better magnets.
To reduce costs, they could use cheaper materials, go off-shore, improve the programs running
them, and improving government subsidies for clean energies.

38
MIT Wind Energy Presentation [33]
3.3.2 Wind Potential
Looking at the Global Wind Energy Council’s 2016 Wind Energy Report37, global wind
energy could produce up to 2 terawatts of energy by 2030 if governments follow the Paris
Agreement, cutting CO2 emissions, and increasing jobs and investments. Wind technologies are
very competitive, increasing the drive for innovative systems. This is a very reliable energy
source which could be a huge share of a future renewable energy market.
39
3.3.3 Tidal Energy
There are three different forms of tidal energy36. The first is tidal current, which
included vertical or horizontal turbines that harness the tides of the ocean. The second is tidal
range technologies, which dam up waterways and condense the flow of current, putting
turbines in the systems. The last one is hybrid applications, which combine both of tidal current
and tidal range systems.
3.3.4 Tidal Potential
The potential of tidal energy rely on coastal, tidal range and tidal current. All these
energies have a potential of generating between a few megawatts by tapping coastal currents,
to a few terawatts, looking at the currents of all the oceans on the planet. Tidal currents are
very reliable and predictable, with various cycles already expected, and weather does not affect
it as much as people would think. The barrier to this relatively untapped energy source is the
high upfront costs, and the ecological effects generated by damming waterways. Also, tidal
generators have an efficiency of around 25%, which isn’t as good as other technologies. Lastly,
it’s difficult to connect these generators to the grid, as the distance and environment are a
challenging factor.

40
Chapter 4: Futuristic Ideas
4.1 Moon Solar Base
4.1.1 Overview
Goal: To produce a detailed design concept specifications for a solar energy harvesting plant on the
moon.
Analysis:
Advantages:
● One lunar hemisphere is constantly exposed to sunlight covering an area of 6,800 miles [23].
● If this system placed within the optimal positioning, it could continuously generate and send
13,000 terawatts of power back to earth. This is mainly because there’s no weather or darkness
to restrict electricity production on the moon.
● A good source of non-polluting solar energy.
● Being able to beam down energy to many different places, wherever receivers are set up,
allowing supply of energy to different parts around the world.
Challenges:
● Building this giant solar plant on the moon’s surface using today’s technology presents a
challenge, and this would certainly be a heavy-duty construction job for human beings.
However, this would be more feasible when we develop advanced robots that could perform
construction duties under human supervision.
● Coming up with a way to send the solar energy back down to Earth, either in the form of
microwaves power or laser power.
● Combating the rotation of the Moon and Earth and either storing the energy until orbits are
locked or using a satellite array as a middleman.
● Cost - It’s not economically feasible at this time given today’s technology.
● Construction process - this is a heavy duty job for humans and can only accomplished using the
assistance of robots.

41
Functional Requirements:
● The capacity to efficiently harvest solar energy using solar panels positioned on the moon’s
surface.
● The ability to send the harvested power back to earth efficiently using energy transmission
facilities on the moon that use two kind of technologies
o Laser power transmission facilities.
o Microwave power transmission antennas.
● The ability to receive and convert the transmitted energy on earth [23]
o Microwave power receiving rectennas.
o Laser power receiving facilities.
● The ability to store energy if it cannot be sent back to earth immediately
Physical Constraints:
● Taking today’s technology into consideration and the nature of the work needed in order to
implement the proposed system, it might be considered “ambitious”. However, the proposed
system might be doable if it can be implemented with a relatively reasonable budget.
● Sending all the equipment to run/maintain the facility would be incredibly expensive, and would
take an extended amount of time, need robots to either build/maintain or self replicate solar
panels (like 3D printing)
Design Specifications: Details of design specs for building a solar plant on the moon composed of arrays
of solar panels for harvesting energy and transmitting power to earth.
● Most optimal positioning of the proposed system would be within the circular area around the
moon’s circumference stretching 6,800 miles around the moon by width of 12 miles. Preferably
on the side of the moon that is facing the sun.
● This plant should be able to continuously send energy using transmission facilities positioned on
the side of the moon facing the earth to receiving stations around the globe. This could be
potentially achieved using high density energy lasers and microwave transmission technology.
● Have multiple receivers placed globally to combat Earth’s rotation and also be able to provide
energy to many different locations around the world.

42
Summary:
The proposed system has three main components
● Solar harvesting system which consists of solar panels that comply with the functional
requirements and the design specifications we have covered previously.
● Transmission facilities to send the harvested power back to earth efficiently using two kinds of
technology; microwave power and laser power.
● Energy conversion facilities on earth to receive and convert the transmitted power sent. Those
facilities will consist of microwave power receiving and laser power receiving facilities.
Figure 11: Design Concept Illustration

43
Economical Analysis
Technological Assumption:
● Commercial solar cell efficiency will double by 2050 (from 15% to 30%)
o Alternatively, we can use one of the high efficiency solar cell technologies that we have
reviewed in the previous chapter that would be produced at a relatively higher cost.
● Space transportation technology will be well developed and available at a reasonable price
point.
o Space transportation will mobilize and use friction-free (frictionless) technologies.
o The industry will integrate the use of advanced material science cutting the weight of
the average space shuttles by 80%
▪ The current average weight of space shuttle is 165,000 pounds empty 1,528.200
pounds [24].
▪ The assumed weight of future space shuttles will be 20% of the current average
weight, resulting in an average weight of 33,000 pounds of empty space shuttle.
[24]
▪ Because of automation and the significant reduction in the parts involved in
production, the manufacturing time is assumed to be 5% of today’s average
production time.
● The current average manufacturing time of space shuttles is 5 years [24].
However, this is due to the complexity of the design and the significant
lack of automation in the manufacturing process. The space shuttle
itself takes about 20% of the overall manufacturing time, which is about
1 year.
● Therefore, the assumed manufacturing time of future space shuttle
technology is 2 weeks.
The current average cost of space shuttle production is $1.5 Billion [24],
and the average launch cost is $450 Million.
● The assumed production cost of future space shuttle technology is 5%
of the current average cost of the empty space shuttle component
ONLY. The empty space shuttle cost is 25% of the current cost ($374 M).
44
Therefore, the assumed cost is 18.75 Million. The launch cost is
negligible as future technology will use friction-free technologies.
● The current average cost of a non commercial round trip to the moon is
at 20 M. The assumed cost of one round trip to transport material is 5%
of the current cost, resulting in an average cost of $1 Million.
The current weight-load capacity of space shuttles is about 100,000 pounds [24]. The assumed
capacity of future technology is 5x of the current average weight-load capacity, resulting in 500,000
pounds payload capacity per trip.
The current average weight of solar panels (including equipments and mounting material) is 20
pounds per square meter [25]. The assumed average weight of future solar panels technology (including
equipments and material) is 2.5% of the current average weight, resulting in an average weight of 0.5
pounds/m^2.
The current average cost of advanced robots is $50,000 [26]. The assumed cost of future
advanced robots is 10% of the estimated future average cost, resulting in $5000 average cost per robot.
The average maintenance cost of an advanced robot is 5% of the product cost annually,
resulting in 2,500/year/robot. The assumed maintenance cost is 5% of the current average cost
resulting in $125/ year.
The current average cost of solar panels maintenance is $150/m^2 [25]. The assumed average
cost of future solar panels technology is 5% of the current cost, resulting in $7.5/m^2.
45
Design Cost Estimation
Material Transportation:
● The moon solar station we are designing is projected to cover 6800 miles by 12 miles area with
solar panels in order to produce the estimated power.
● The projected cost of material transportation based on our assumptions is the following:
o Needed material’s weight = 0.5 pounds (weight per m^2) * 211343030000 m^2 (area
needed) = 422696060000 pounds (~422.7 B)
o Total cost = $1 M * (422696060000 pounds / 500000 pounds) = $845.37 Billion
Material Cost:
● The projected cost of material based on our assumptions is the following:
o Needed material’s cost = $107 (cost per m^2) * 211343030000 m^2 (area needed) =
$2.26137 Trillion
● The projected cost of robots assuming the need of 10000 units is the following:
o Total cost = 10000 * $2500 = $25 Million
Maintenance Cost:
● The projected cost of solar maintenance based on our assumptions is the following:
o Needed material’s cost = $7.5 (cost per m^2) * 211343030000 m^2 (area needed) =
$1.585 Trillion
● The projected cost of robots’ maintenance based on our assumptions is the following:
o Total cost = 10000 * $250 = $2.5 Million
Overall Cost:
The overall cost of establishing a solar moon station that covers an enormous area that could
meet over 50% of our worldwide energy consumption needs is the following:
$845.37 Billion + $2.5 Million + $1.585 Trillion + $25 Million + $2.26137 Trillion = $4.6917675
trillion
A few things to note about these calculations are:
● It is assumed that we will not manufacture the solar cells used in harvesting the energy on the
moon base onsite. It would make more sense to send the equipments alone and build facilities
that would manufacture solar cells onsite as opposed to shipping them as it would eliminate a
lot of the cost associated with transportation.
46
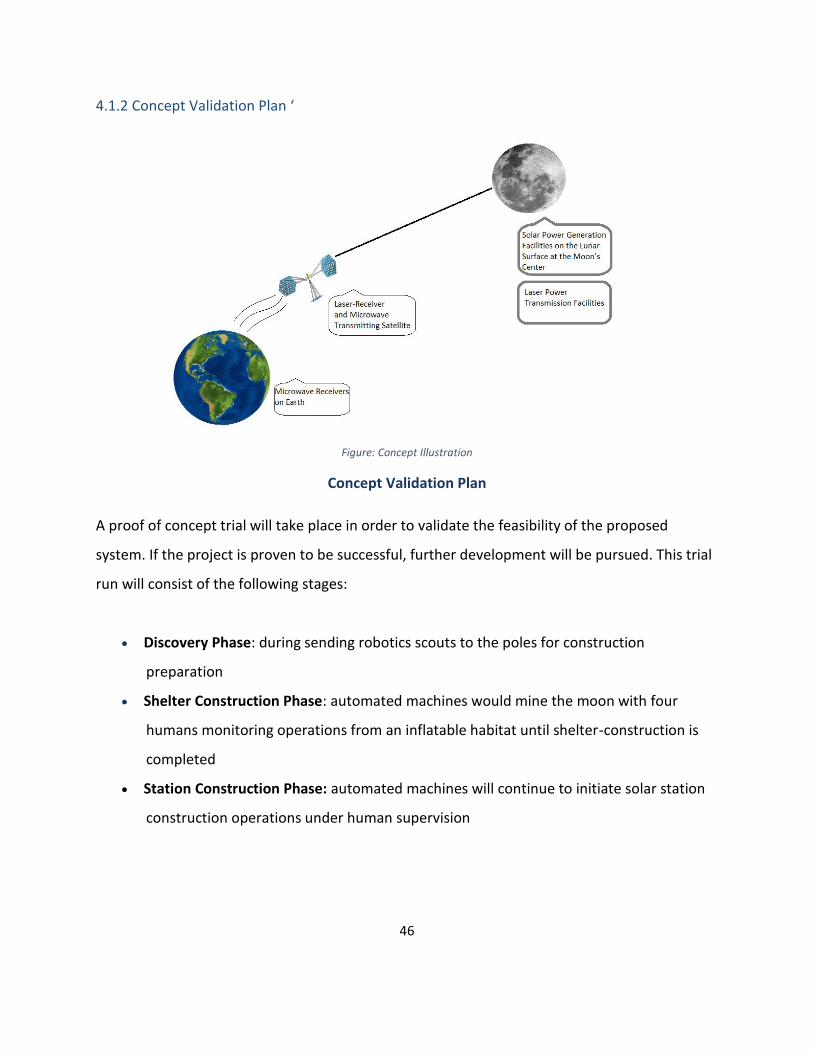
4.1.2 Concept Validation Plan ‘
Figure: Concept Illustration
Concept Validation Plan
A proof of concept trial will take place in order to validate the feasibility of the proposed
system. If the project is proven to be successful, further development will be pursued. This trial
run will consist of the following stages:
Discovery Phase: during sending robotics scouts to the poles for construction
preparation
Shelter Construction Phase: automated machines would mine the moon with four
humans monitoring operations from an inflatable habitat until shelter-construction is
completed
Station Construction Phase: automated machines will continue to initiate solar station
construction operations under human supervision

47
Discover Phase: Two main types of robots will be used;
Spidernaut (6) is a robot that is being designed by a NASA for construction and repair
tasks that would be hard or dangerous for a human. This robot weighs 600 pounds and
the cost is estimated to be around $50 Million [38].
ATHLETE (6) (All-Terrain Hex-Legged Extra-Terrestrial Explorer) is a robotic lunar rover
that is being developed at California Institute of Technology. ATHLETE is a multi-purpose
robot aimed to be used for space exploration. This rover weights about 1875 pounds
and can carry a load of up to 660 pounds. ATHLETE has tools that allow the robot to
perform various tasks such as drilling and many other tool functions. This robot exact
cost is unavailable; however it is estimated to cost ~$100 Million [39].
Total Cost:
Transportation cost: the cost is roughly $20,000 per pound for space launches to the
moon. The total weight of robots needed is 600 x 6 + 1875 x 6 = 14850 pounds. Total
cost = 14850 x $20,000 = $297 million
Equipment cost = 50 x 6 + 100 x 6 = $900 million
Total Cost = $900 million + $297 million = $1.2 billion
Timeline: 1-3 month
Alternative: Transport the robots and equipments needed using L3 route instead of the direct
route which would reduce the cost significantly but take longer time.

48
Shelter Construction Phase
Base Design
A recent study conducted by the National Space Society found that a space base could be
constructed for $38 billion which would house 4 people. The construction work can be
completed within 5-7 years and the base will be equipped with tools that enable humans to
sustain life on a foreign planet.
Lunar Base Illustration [22]
Total Cost: $38 billion
Timeline: 5-7 years

49
Station Construction Phase
Station Specs
Power-generation capacity of 1 GW
Most solar panels are about 500 watts. So 1,000,000,000 divided by 500 is 2,000,000
panels (Include advanced PV Cells)
Each 500 watt panel is about 6 feet square, so we need 0.431 square mile
100 laser-transmitting satellites are needed in order to transmit power. This self-
assembling satellite would cost $50 B - $100 B
Energy Transmission
A receiver could be made that can be deployed easily even in hard-to-reach locations
The energy is being beamed from the moon using laser technology, harvested before it
enters earth’s atmosphere using laser-receiver satellites. Then, the energy is beamed to
the surface using microwave technology.
Alternatively, we can solely use laser technology to transmit energy by only picking a
wavelength that we know will make it through the atmosphere without being absorbed
and is a narrow beam.
Therefore, we can use an IR laser that has a wavelength that’s eye-safe and wouldn’t
cause skin damage as the laser wouldn't be absorbed.
Station Design
New 3D printing technologies can be used manufacture equipments on spot eliminating
the need for transportation and the associated cost.
The base should preferably be located in a valley area in order to provide shield and
protection from solar winds and flying objects.
Total Cost: ~ $54 billion Timeline: 5-7 years
50
4.2 Helium 3
4.2.1 Overview
Helium-3 could potentially provide help us fulfill our energy needs for many years to come.
Many private companies and government agencies are trying to expand to new energy sources. If the
required technology is developed, this process will include mining asteroids for Helium-3 as earth
resources are finite in nature and we will eventually run out of different material reserves if we stay
confined to earth [27].
Helium-3 is a light, non-radioactive isotope of helium with two protons and one neutron [27]. It
can be found in larger quantities on the surface of mars and the moon, where it is deposited by solar
winds. Following this logic, planets or surfaces that are closer to the sun would be richer in Helium-3
since it’s deposited by solar winds. It’s estimated that 25 tons of Helium-3 could power the United
States for an entire year [27]. Because of the massive potential benefits of such advancements in the
energy sector, leading countries such as Russia and China have been heavily researching the possibility
of lunar mining. Researchers have estimated that the moon’s surface soil contains ~109 kg of Helium-3
that is accessible [27].

51
4.3 Space Solar Farm
4.3.1 Overview
For the past few decades, many private organizations and public governments have
been shifting their attention towards new promising ideas that could assist us in solving our
energy consumption needs. One of the most famous recent projects is that of the Aerospace
Exploration Agency (JAXA). This project is somewhat similar to the solar moon station we have
previously discussed in this chapter. This project aims to send giant solar collectors in
geosynchronous orbit which would later transmit energy back to earth using microwave
technology [40].
JAXA is planning to produce and test the first system of this kind by 2030. The
commercial system will be a 1 GW system. This system is a promising research that could very
well turn out into a wild used application in the very near future. The below figure illustrates
the concept design of the system at hand.

52
Space Solar Farm Concept Illustration [40]

53
Chapter 5: Plan Proposition
5.1 Overview
In this chapter we will evaluate the different energy sources and futuristic ideas we have
previously discussed in this paper in order to determine which sources we should invest our
efforts in. In addition, we will provide some analysis that complements our previous analysis in
Chapter 2. Bellow is the current usage rates of different energy sources in the United States.
Current Usage Rate of Various Energy Sources (EIA; U.S. Energy Information Administration)
Coal 33%
Natural Gas 33%
Nuclear 20%
Hydropower 6%
Biomass 1.6%
Geothermal 0.4%
Solar 0.6%
Wind 4.7%
Petroleum 1%
Other gases 1%
Percent share of total U.S. electricity generation by energy source, 2015

54
Barriers to full-transition
Cost-competitiveness; average cost of power sources should be similar to the current
average price of electricity is $0.12/kwh (US)
Transporting electricity is extremely difficult
Current storage solutions are very limited and inefficient
We need to generate about 15 TW of power to fulfill energy needs by 2050
5.2 Analysis
Nuclear Energy:
In 2005 about 440 nuclear plants were constructed and used. In 2016, the number
raised to only 450 nuclear plants operating globally. To fulfill the global energy projected
need by 2050, we would require 14,636 new 1GW by 2050 [41].
This seems very unreasonable and farfetched as many accidents have been associated
with nuclear plants and most countries are trying to move away from this source of
renewable energy.
The estimated global conventional uranium resources are about 17.1 MtU, which can
supply a total of ~88 TW [41].
Potential of Renewable Energy
We will provide estimates for the potential, both technical and theoretical, of different
renewable energy sources taking into consideration:
Human harvesting systems used
Conversion efficiency
So we will take the theoretical potential and multiply it with an estimated efficiency of
conversion processes used.
55
Assumptions:
We assume no conversion rate if energy is in a chemical form.
We assume a 75% efficiency associated with a conversion from electrical to chemical
form
We assume a 33% efficiency associated with a conversion from mechanical form to
electrical form
If energy is in heat form, we need to assume an appropriate efficiency conversion rate
for a conversion into a mechanical form
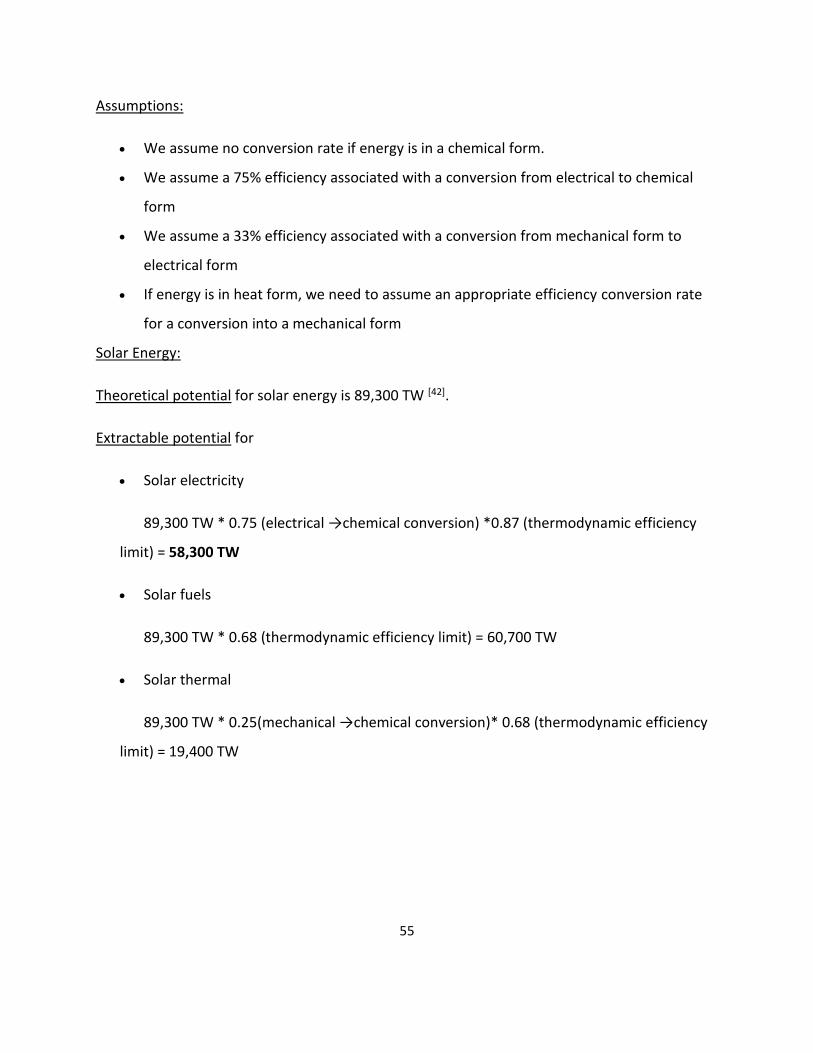
Solar Energy:
Theoretical potential for solar energy is 89,300 TW [42].
Extractable potential for
Solar electricity
89,300 TW * 0.75 (electrical →chemical conversion) *0.87 (thermodynamic efficiency
limit) = 58,300 TW
Solar fuels
89,300 TW * 0.68 (thermodynamic efficiency limit) = 60,700 TW
Solar thermal
89,300 TW * 0.25(mechanical →chemical conversion)* 0.68 (thermodynamic efficiency
limit) = 19,400 TW
56
Ocean Tidal Energy:
The global potential of ocean tidal energy is roughly 2000 TW [43].
A conservative estimation of the tidal stream energy capacity could exceed 120 GW
globally (at a relatively low cost) [43].
Tidal energy could be a very attractive option for some countries in Europe or that are
close to the ocean with big surface exposure area.
5.3 Evaluation
Now we have enough information in order to analyze different sources of energy we
have covered in this paper. We will have to come up with a scale in order to rate those sources.
The following is the criteria that will be used to rate the different energy sources:
Affordability: price-point of energy to the public population
Accessibility: due to some constraints such as geographic location or politics & cultural
influence
Sustainability: whether a specific energy source can satisfy our needs in the long run
Potential: the theoretical or extractable potential of different energy sources

57
Below is a table that uses those criteria in order to conclude the overall ratings of each energy
source. The minimum rating for each criterion is 1, and the maximum rating is 3.
Energy Source
Weight Solar Wind Tidal Nuclear
Affordability 0.2 3 2 2 2.5
Sustainability 0.3 3 2.5 2.5 1
Accessibility 0.2 2.5 2 1.5 2
Potential 0.3 3 1.5 2 1
Total 2.9 1.91 2.05 1.5
Pugh Matrix for Rating Energy Sources
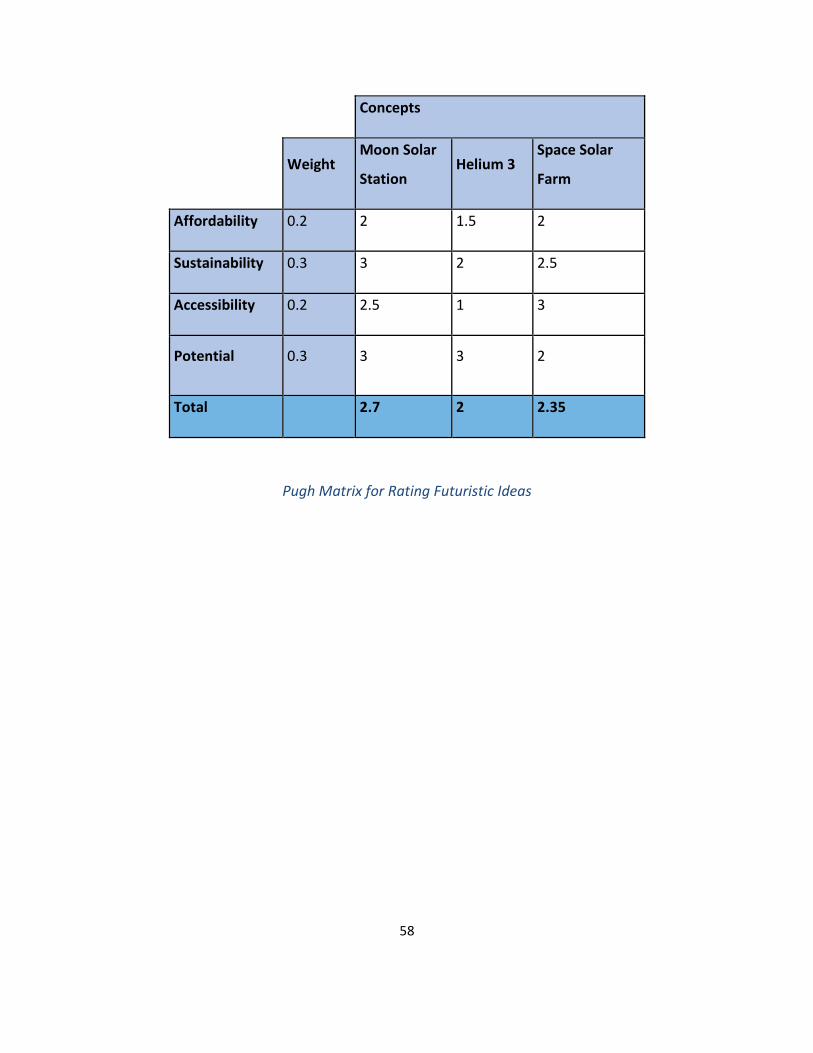
Next, we will examine and evaluate the futuristic ideas we have discussed in the
previous chapter. We will use a similar scale to the previous one in order to conclude our
ratings.
58
Concepts
Weight Moon Solar
Station Helium 3
Space Solar
Farm
Affordability 0.2 2 1.5 2
Sustainability 0.3 3 2 2.5
Accessibility 0.2 2.5 1 3
Potential 0.3 3 3 2
Total 2.7 2 2.35
Pugh Matrix for Rating Futuristic Ideas

59
Chapter 6: Concluding Remarks
6.1 Conclusions
As discussed in this paper, there is a pressing need to transition the fulfillment of
our energy needs towards a more sustainable future. This paper provides an in depth
analysis of different energy sources in order to assist their potential in fulfilling our
current and future energy needs. The main aspects that we focus on are the potential of
different energy sources and their affordability and accessibility to the general public. To
summarize the most promising sources, solar energy; tidal energy and wind energy are
where a lot of our efforts should be concentrated in as they offer the most potential
return.
This report is a summary of current information on energy consumption, energy
sources, and some technologies. This summary explains how the use of fossil fuels is
becoming outdated. Fossil fuels will run out and they harm the environment. The
amount of global consumption of energy is increasing, as well as the human population,
which can only mean a higher demand in energy. Taking this into consideration, one
could see the need for renewable energy sources, as they are cleaner, and sustainable.
The technology may not be available currently, but the demand for it should be.
60
6.2 Recommendations
In this section we will provide brief recommendations for any potential future follow on
work of our paper. The following recommendations were concluded after having done our
analysis.
Relate our analysis with some variable constraints that can differ from one area to
another, considering the following points
o Geographic constraints
o Cultural constraints
o Political constraints
o Economical constraints
In addition, further research into promising technologies can be beneficial. Also,
analyzing the futuristic ideas we have discussed in this paper within the suggested constraints
above could provide an insight.
61
Bibliography
[1] Cain, F. (2013, April 14). How long does it take sunlight to reach the earth? Retrieved December 18,
2016, from Guide to Space, http://www.universetoday.com/15021/how-long-does-it-take-sunlight-to-
reach-the-earth/
[2] How efficient are solar panels? Retrieved December 18, 2016, from
http://www.qrg.northwestern.edu/projects/vss/docs/power/2-how-efficient-are-solar-panels.html
[3] Office, M. N. (2016, August 29). New solar cell is more efficient, costs less than its counterparts.
Retrieved December 18, 2016, from http://news.mit.edu/2016/new-solar-cell-more-efficient-costs-less-
its-counterparts-0829
[4] Irfan, U., & ClimateWire. (2016). Quantum dots and more used to beat efficiency limit of solar cells.
Retrieved December 18, 2016, from https://www.scientificamerican.com/article/quantum-dots-and-
more-use/
[5] Abdul Hadi, S., Fitzgerald, E. A., & Nayfeh, A. (2016). Theoretical efficiency limit for a two-terminal
multi-junction “step-cell” using detailed balance method. Journal of Applied Physics, 119(7), 073104.
doi:10.1063/1.4942223
[6] Office, M. N. (2016, August 29). New solar cell is more efficient, costs less than its counterparts.
Retrieved December 18, 2016, from http://news.mit.edu/2016/new-solar-cell-more-efficient-costs-less-
its-counterparts-0829
[7] Quantum dot (2016). . In Wikipedia. Retrieved from https://en.wikipedia.org/wiki/Quantum_dot
[8] David DeFranza, Planet Green "Understanding Quantum Photovoltaics" 29 August 2012.
HowStuffWorks.com. <http://science.howstuffworks.com/environmental/energy/quantum-
photovoltaics.htm> 18 December 2016
[9] Chuang, C.-H. M. (2014). Improved performance and stability in quantum dot solar cells through
band alignment engineering. Nature Materials, 13(8), 796–801. doi:10.1038/nmat3984
[10] Lunt, R. R., & Bulovic, V. (2011). Transparent, near-infrared organic photovoltaic solar cells for
window and energy-scavenging applications. . Retrieved from
62
https://dspace.mit.edu/handle/1721.1/71948
[11] Zax, D. (2012, October 22). “Spray-on” Photovoltaic windows. Retrieved December 18, 2016, from
https://www.technologyreview.com/s/428366/spray-on-photovoltaic-windows/
[12] Technologies, S. (2015, March 10). SolarWindow™ accelerates product-durability testing. Retrieved
December 18, 2016, from News & Events, http://solarwindow.com/2015/03/solarwindow-accelerates-
product-durability-testing-following-promising-early-results/
[13] Nandakumar, T. (2012, February 6). Solar cells moving down the roof. Retrieved December 18,
2016, from Technology, http://www.thehindu.com/sci-tech/technology/solar-cells-moving-down-the-
roof/article2866019.ece
[14] Haroon, & and, H. (2016, February 2). Synergy files. Retrieved December 18, 2016, from Energy
Efficiency, http://synergyfiles.com/2016/02/most-efficient-solar-cells-in-2016-for-all-categories/
[15] What is U.S. Electricity generation by energy source? - FAQ - U.S. Energy information administration
(EIA). (2016, April 1). Retrieved December 18, 2016, from
https://www.eia.gov/tools/faqs/faq.cfm?id=427&t=3
[16] Association, S. E. I. Solar industry facts and figures. Retrieved December 18, 2016, from
http://www.seia.org/research-resources/solar-industry-data
[17] Retrieved December 18, 2016, from http://www.sandia.gov/~jytsao/Solar%20FAQs.pdf
[18] (2015). Retrieved December 18, 2016, from USGS,
https://minerals.usgs.gov/minerals/pubs/commodity/lithium/mcs-2015-lithi.pdf
[19] Society, N. G. (2011, May 24). Nuclear energy. Retrieved December 18, 2016, from
http://nationalgeographic.org/encyclopedia/nuclear-energy/
[20] NRC: Backgrounder on the Three mile island accident. (2013, February ). Retrieved December 18,
2016, from http://www.nrc.gov/reading-rm/doc-collections/fact-sheets/3mile-isle.html
[21] ORGANIZATIONAL CONTRIBUTIONS TO NUCLEAR POWER PLANT SAFETY. Retrieved December 18,
2016, from KNS.org, http://www.kns.org/jknsfile/v37/JK0370207.pdf
[22] MailOnline, R. G. (2016, March 24). 'We could be living on the moon by 2022': Nasa claims a 'cheap'
63
$10 billion lunar base will be ready for humans in just six years. Retrieved March 13, 2017, from
<http://www.dailymail.co.uk/sciencetech/article-3507665/Could-living-moon-2022-Nasa-scientists-
reveal-plans-build-lunar-base-six-years-10-billion.html>
[23] Space-based solar power (2016). . In Wikipedia. Retrieved from
https://en.wikipedia.org/wiki/Space-based_solar_power
[24] contributors, R. (2016). Space shuttle. In Wikipedia. Retrieved from
https://en.wikipedia.org/wiki/Space_Shuttle
[25] Simone. (2016, December 18). Is my roof suitable for solar panels (and what is the weight of a solar
panel)? Retrieved December 18, 2016, from http://sunmetrix.com/is-my-roof-suitable-for-solar-panels-
and-what-is-the-weight-of-a-solar-panel/
[26] Retrieved December 18, 2016, from http://www.usnews.com/news/articles/2015/02/10/robots-
could-cut-international-labor-costs-16-percent-by-2025-consulting-group-says
[27] Wittenberg, L. J., Santarius, J. F., & Kulcinski, G. L. (1986). ANS / publications / journals / fusion
science and technology / volume 10 / number 2 / pages 167-178. Fusion Science and Technology, 10(2),
167–178. Retrieved from <http://www.ans.org/pubs/journals/fst/a_24972>
[28] What is U.S. electricity generation by energy source? - FAQ - U.S. Energy Information Administration
(EIA) Retrieved from https://www.eia.gov/tools/faqs/faq.cfm?id=427&t=3
[29] The National Academies presents: What You Need to Know About Energy
Retrieved from http://needtoknow.nas.edu/energy/energy-sources/fossil-fuels/
[30] Fossil fuel energy consumption (% of total) | Data, Retrieved from
http://data.worldbank.org/indicator/EG.USE.COMM.FO.ZS
[31] BP Statistical Review of World Energy June 2016
Retrieved from https://www.bp.com/content/dam/bp/pdf/energy-economics/statistical-review-
2016/bp-statistical-review-of-world-energy-2016-full-report.pdf
[32] U.S. Energy Information Administration, International Energy Outlook 2016
Retrieved from http://www.eia.gov/pressroom/presentations/sieminski_05112016.pdf
[33] Presentation on Wind Power, MIT, Retrieved from
<http://web.mit.edu/windenergy/windweek/Presentations/Wind%20Energy%20101.pdf>
64
[34] CIA Factbook, Population Section, Retrieved from <https://www.cia.gov/library/publications/the-
world-factbook/rankorder/2119rank.html>
[35] United Nations Population Division, Retrieved from
http://www.un.org/en/development/desa/population/
[36] Tidal Energy Technology Brief, International Renewable Energy Agency, Retrieved from
http://www.irena.org/DocumentDownloads/Publications/Tidal_Energy_V4_WEB.pdf
[37] Global Wind Energy Council, 2016 Wind Energy Report, Retrieved from
http://www.gwec.net/publications/global-wind-energy-outlook/global-wind-energy-outlook-2016/
[38] "Spidernaut". Spidernaut.jsc.nasa.gov. N.p., 2017. Web. 2 Mar. 2017. Retrieved from
<https://spidernaut.jsc.nasa.gov/>
[39] "The Athlete Rover". N.p., 2017. Web. 2 Mar. 2017. Retrieved from https://www-
robotics.jpl.nasa.gov/systems/system.cfm?System=11
[40] IEEE Spectrum: Technology, Engineering, and Science News. How Japan Plans to Build an Orbital
Solar Farm - IEEE Spectrum. Retrieved from http://spectrum.ieee.org/green-tech/solar/how-japan-
plans-to-build-an-orbital-solar-farm
[41] Welcome to ENS - European Nuclear Society. Nuclear power plants, world-wide. Retrieved from
http://www.euronuclear.org/info/encyclopedia/n/nuclear-power-plant-world-wide.htm
[42] Sandia National Laboratories: Exceptional Service in the National Interest. Retrieved from
http://www.sandia.gov/~jytsao/Solar%20FAQs.pdf
[43] EcoFys: Global Potential Of Renewable Energy Sources: A Literature Assessment. March 2008.