renewable and alternative energy in louisiana - … · 2017-04-11 · renewable and alternative...
TRANSCRIPT
1
Renewable and Alternative Energy in Louisiana
2009 Louisiana Oil and Gas: From SONRIS to Sunset
September 22, 2009
David E. DismukesCenter for Energy StudiesLouisiana State University
US DOE
Center for Energy Studies
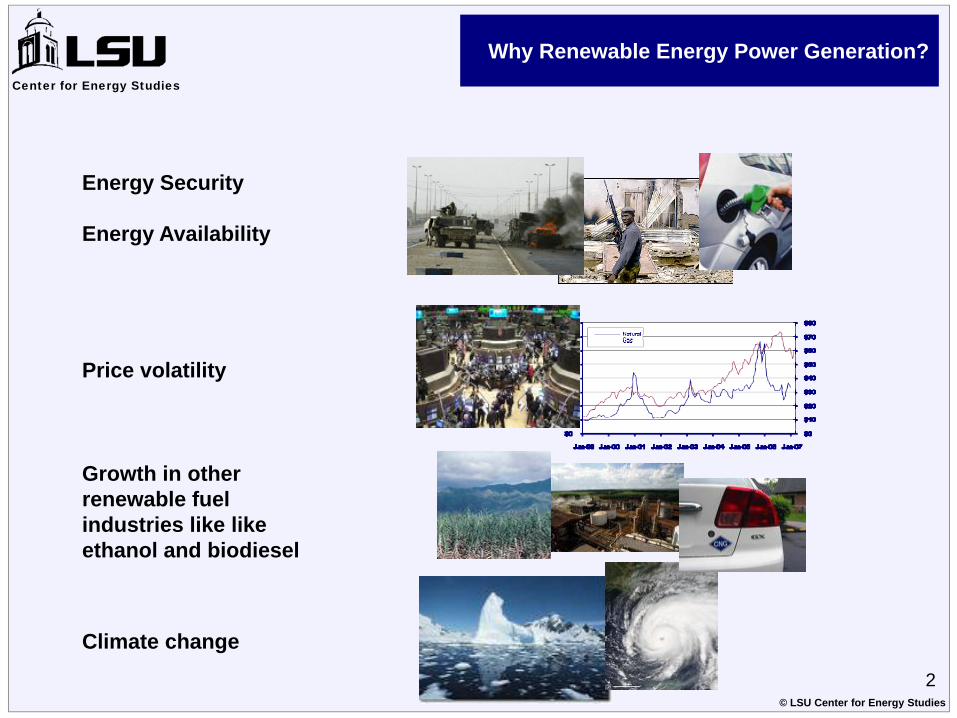
Energy Security
Energy Availability
Price volatility
Growth in other renewable fuel industries like likeethanol and biodiesel
Climate change
Why Renewable Energy Power Generation?Center for Energy Studies
2© LSU Center for Energy Studies
3
Overview ofAlternative Energy Generation
Center for Energy Studies
3© LSU Center for Energy Studies
0
5
10
15
20
25
30
35
40
45
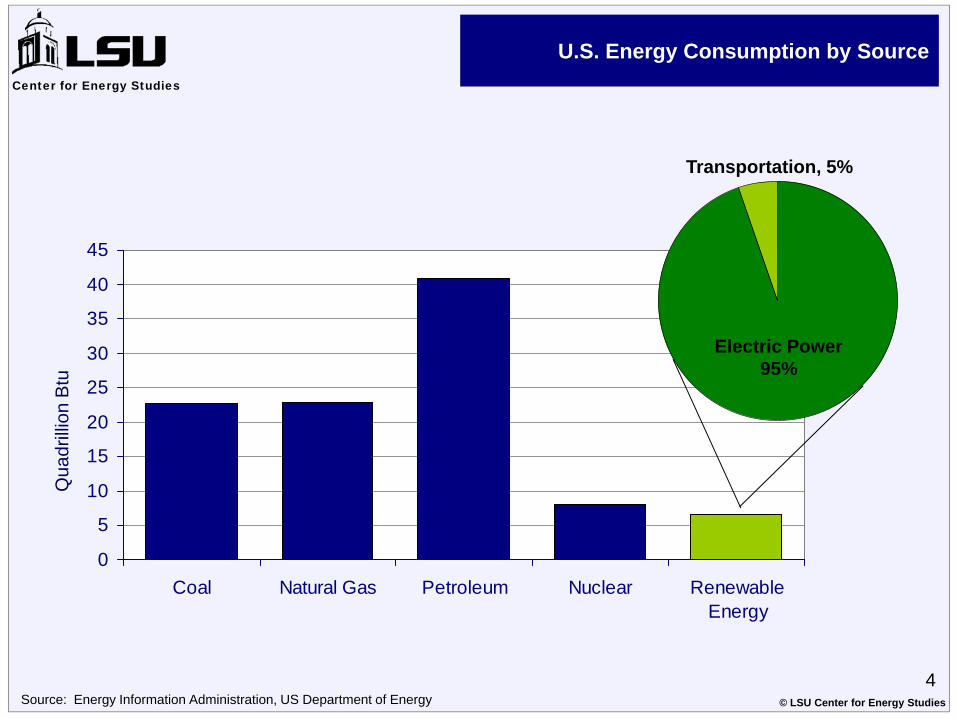
Coal Natural Gas Petroleum Nuclear RenewableEnergy
Qua
drill
ion
Btu
U.S. Energy Consumption by Source
Source: Energy Information Administration, US Department of Energy
Electric Power95%
Transportation, 5%
Center for Energy Studies
4© LSU Center for Energy Studies
5
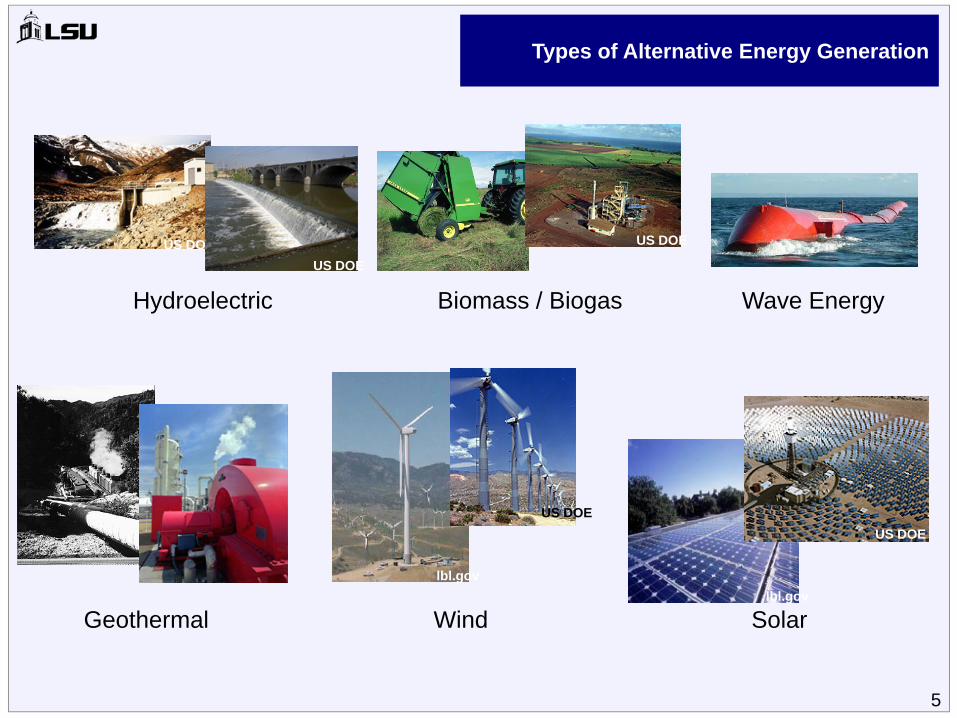
Types of Alternative Energy Generation
lbl.govlbl.gov
Hydroelectric
US DOEUS DOE
Wave Energy
US DOE
US DOE
US DOE
SolarGeothermal Wind
Biomass / Biogas
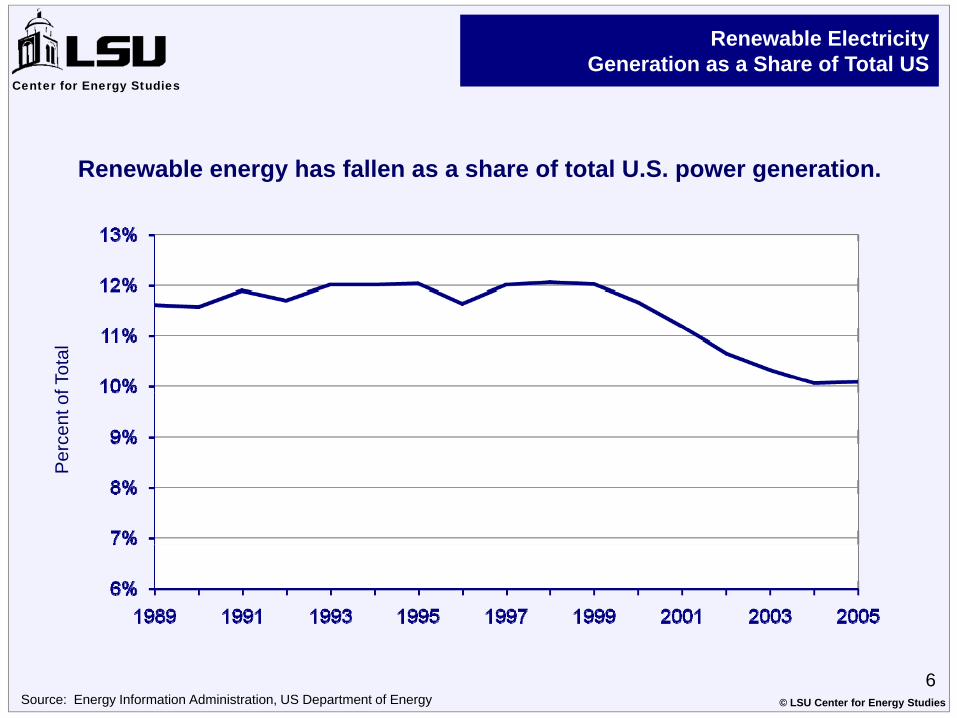
Renewable ElectricityGeneration as a Share of Total US
Source: Energy Information Administration, US Department of Energy
Renewable energy has fallen as a share of total U.S. power generation.
Per
cent
of T
otal
Center for Energy Studies
6© LSU Center for Energy Studies
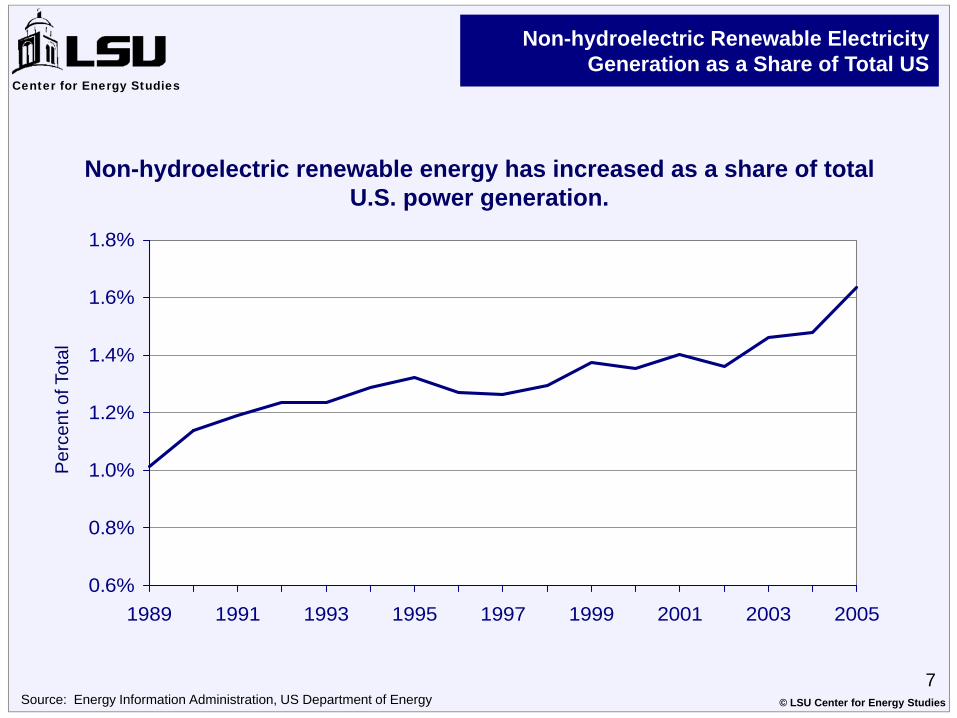
Non-hydroelectric Renewable ElectricityGeneration as a Share of Total US
Source: Energy Information Administration, US Department of Energy
Non-hydroelectric renewable energy has increased as a share of total U.S. power generation.
0.6%
0.8%
1.0%
1.2%
1.4%
1.6%
1.8%
1989 1991 1993 1995 1997 1999 2001 2003 2005
Per
cent
of T
otal
Center for Energy Studies
7© LSU Center for Energy Studies
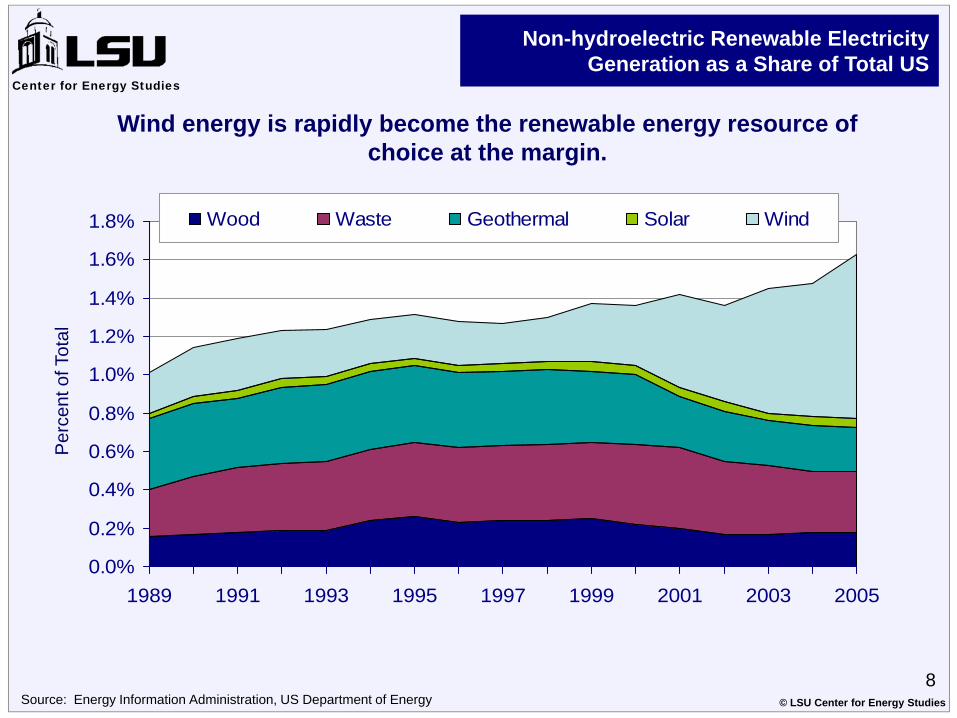
Non-hydroelectric Renewable ElectricityGeneration as a Share of Total US
Source: Energy Information Administration, US Department of Energy
0.0%
0.2%
0.4%
0.6%
0.8%
1.0%
1.2%
1.4%
1.6%
1.8%
1989 1991 1993 1995 1997 1999 2001 2003 2005
Wood Waste Geothermal Solar Wind
Per
cent
of T
otal
Wind energy is rapidly become the renewable energy resource of choice at the margin.
Center for Energy Studies
8© LSU Center for Energy Studies
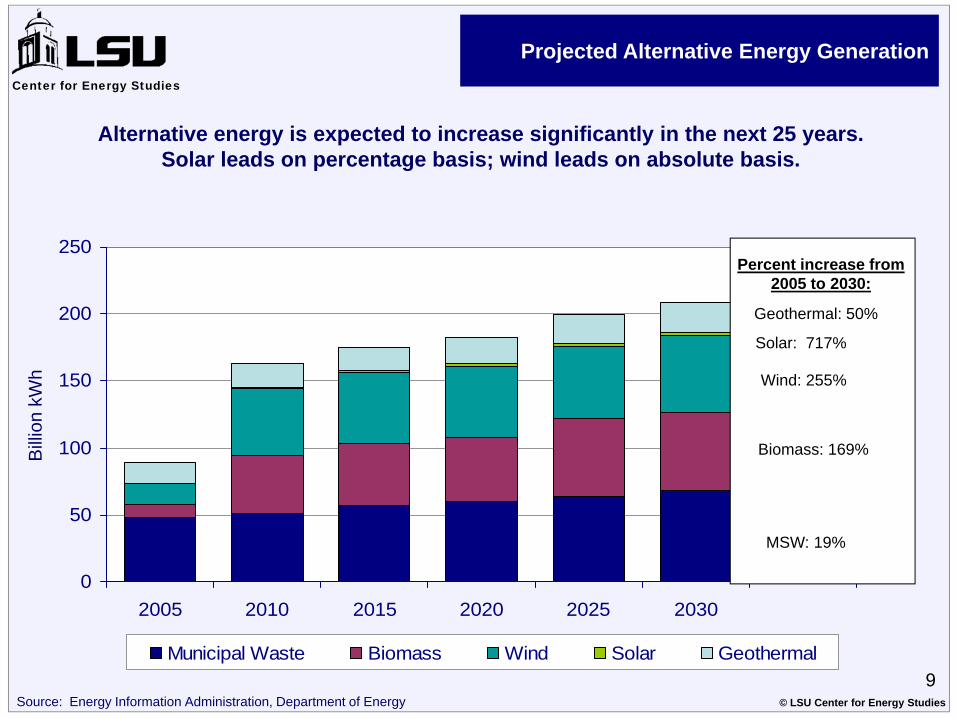
Projected Alternative Energy Generation
0
50
100
150
200
250
2005 2010 2015 2020 2025 2030
Municipal Waste Biomass Wind Solar Geothermal
Bill
ion
kWh
Alternative energy is expected to increase significantly in the next 25 years.Solar leads on percentage basis; wind leads on absolute basis.
Geothermal: 50%
Wind: 255%
Biomass: 169%
MSW: 19%
Solar: 717%
Percent increase from2005 to 2030:
Source: Energy Information Administration, Department of Energy
Center for Energy Studies
9© LSU Center for Energy Studies
10
Policy Mechanismsfor Alternative Energy
Center for Energy Studies
10© LSU Center for Energy Studies
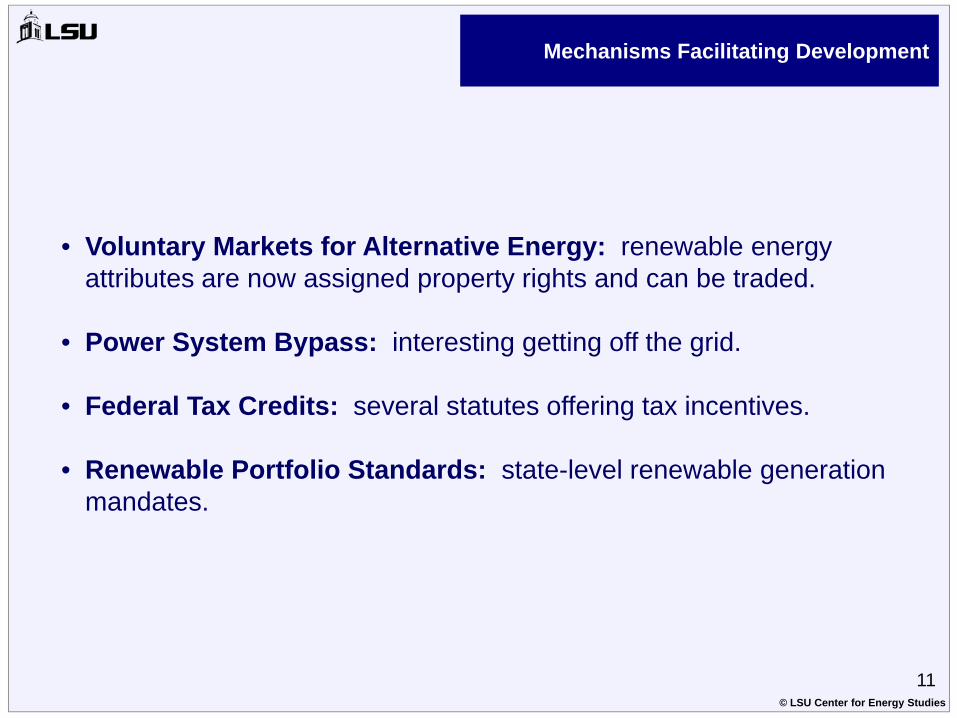
Mechanisms Facilitating Development
• Voluntary Markets for Alternative Energy: renewable energy attributes are now assigned property rights and can be traded.
• Power System Bypass: interesting getting off the grid.
• Federal Tax Credits: several statutes offering tax incentives.
• Renewable Portfolio Standards: state-level renewable generation mandates.
11© LSU Center for Energy Studies
What is an RPS?
A renewable portfolio standard (RPS) is a state policy that requires electricity providers to obtain a minimum percentage of their power from renewable
energy resources by a certain date.
Center for Energy Studies
12© LSU Center for Energy Studies
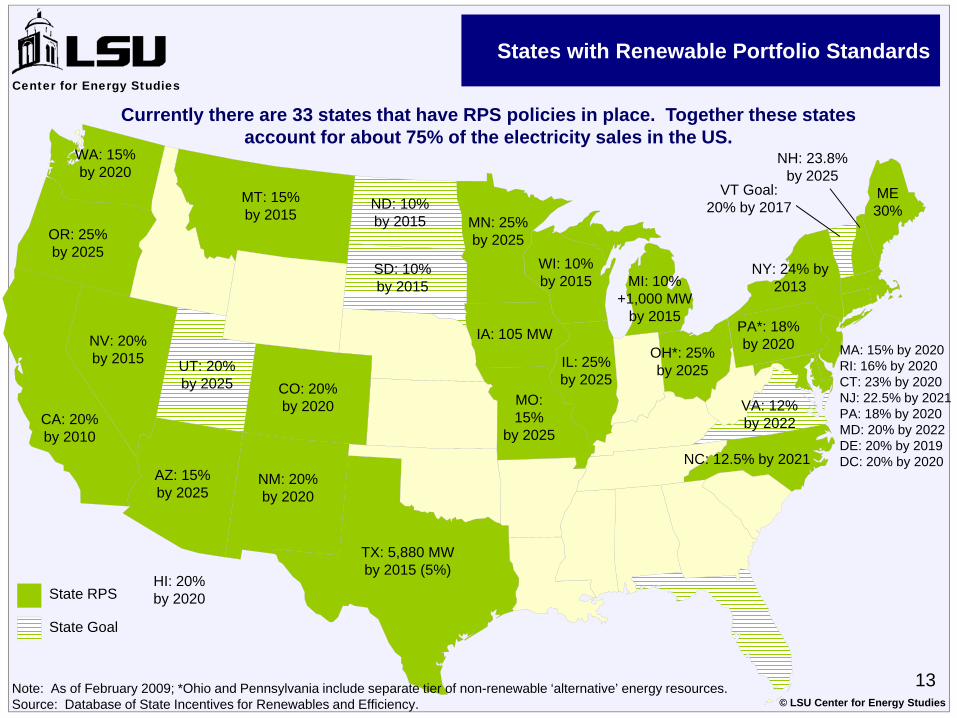
States with Renewable Portfolio Standards
Currently there are 33 states that have RPS policies in place. Together these states account for about 75% of the electricity sales in the US.
ME30%
VT Goal:20% by 2017
NH: 23.8%by 2025
WI: 10%by 2015
MT: 15%by 2015
IA: 105 MW
MN: 25%by 2025
WA: 15%by 2020
CA: 20%by 2010
NV: 20%by 2015
AZ: 15%by 2025
NM: 20%by 2020
UT: 20%by 2025
TX: 5,880 MWby 2015 (5%)
MO:15%
by 2025
IL: 25%by 2025
NC: 12.5% by 2021
VA: 12%by 2022
PA*: 18%by 2020
NY: 24% by 2013
State RPS
State Goal
OR: 25%by 2025
CO: 20%by 2020
ND: 10%by 2015
SD: 10%by 2015
OH*: 25%by 2025
MA: 15% by 2020RI: 16% by 2020CT: 23% by 2020NJ: 22.5% by 2021PA: 18% by 2020MD: 20% by 2022DE: 20% by 2019DC: 20% by 2020
Note: As of February 2009; *Ohio and Pennsylvania include separate tier of non-renewable ‘alternative’ energy resources.Source: Database of State Incentives for Renewables and Efficiency.
MI: 10%+1,000 MW
by 2015
HI: 20%by 2020
Center for Energy Studies
13© LSU Center for Energy Studies
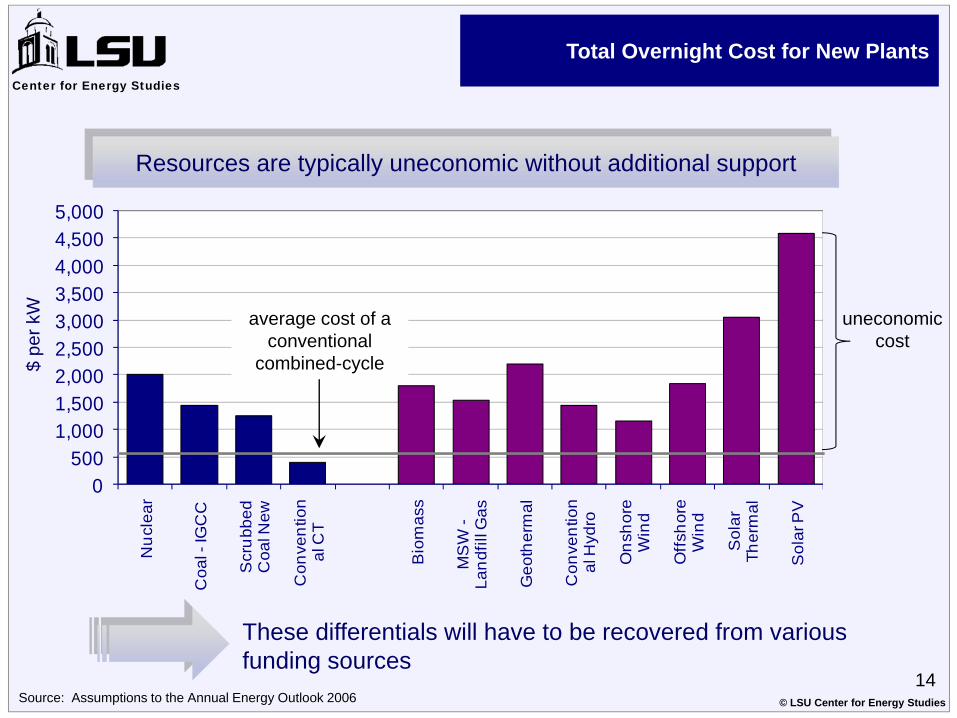
These differentials will have to be recovered from various funding sources
Total Overnight Cost for New Plants
0500
1,0001,5002,0002,5003,0003,5004,0004,5005,000
Nuc
lear
Coa
l -IG
CC
Scr
ubbe
d C
oal N
ew
Con
vent
ion
al C
T
Bio
mas
s
MS
W -
Land
fill G
as
Geo
ther
mal
Con
vent
ion
al H
ydro
Ons
hore
W
ind
Offs
hore
W
ind
Sol
ar
Ther
mal
Sol
ar P
V
$ pe
r kW
Source: Assumptions to the Annual Energy Outlook 2006
average cost of aconventional
combined-cycle
Resources are typically uneconomic without additional support
uneconomic cost
Center for Energy Studies
14© LSU Center for Energy Studies
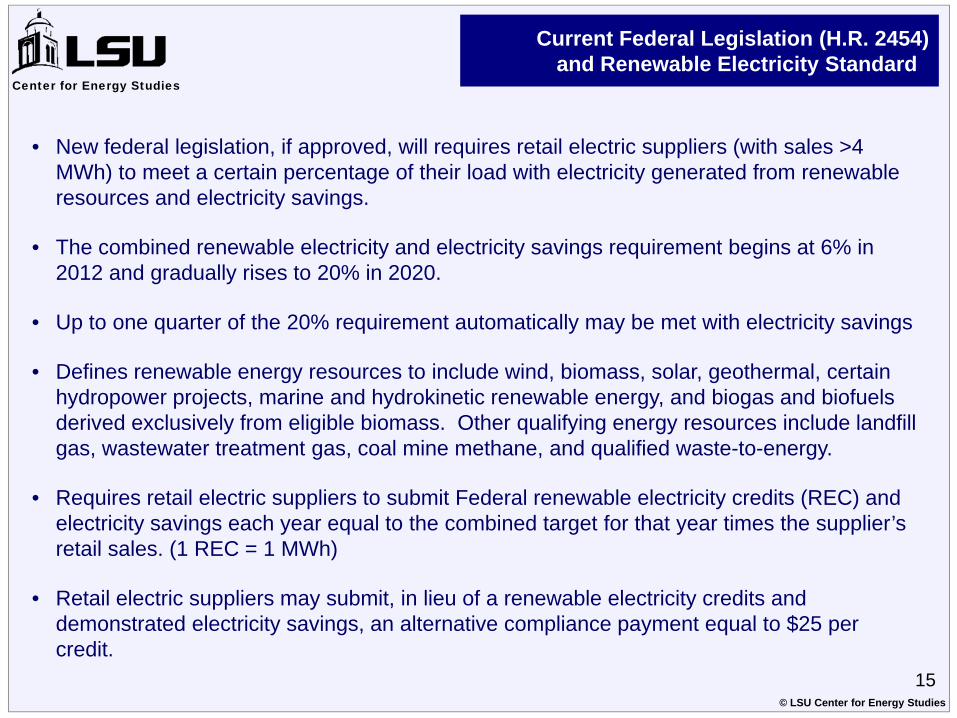
• New federal legislation, if approved, will requires retail electric suppliers (with sales >4 MWh) to meet a certain percentage of their load with electricity generated from renewable resources and electricity savings.
• The combined renewable electricity and electricity savings requirement begins at 6% in 2012 and gradually rises to 20% in 2020.
• Up to one quarter of the 20% requirement automatically may be met with electricity savings
• Defines renewable energy resources to include wind, biomass, solar, geothermal, certain hydropower projects, marine and hydrokinetic renewable energy, and biogas and biofuelsderived exclusively from eligible biomass. Other qualifying energy resources include landfill gas, wastewater treatment gas, coal mine methane, and qualified waste-to-energy.
• Requires retail electric suppliers to submit Federal renewable electricity credits (REC) and electricity savings each year equal to the combined target for that year times the supplier’s retail sales. (1 REC = 1 MWh)
• Retail electric suppliers may submit, in lieu of a renewable electricity credits and demonstrated electricity savings, an alternative compliance payment equal to $25 per credit.
Current Federal Legislation (H.R. 2454)and Renewable Electricity Standard
Center for Energy Studies
15© LSU Center for Energy Studies
16
Current Louisiana Resources
Center for Energy Studies
16© LSU Center for Energy Studies
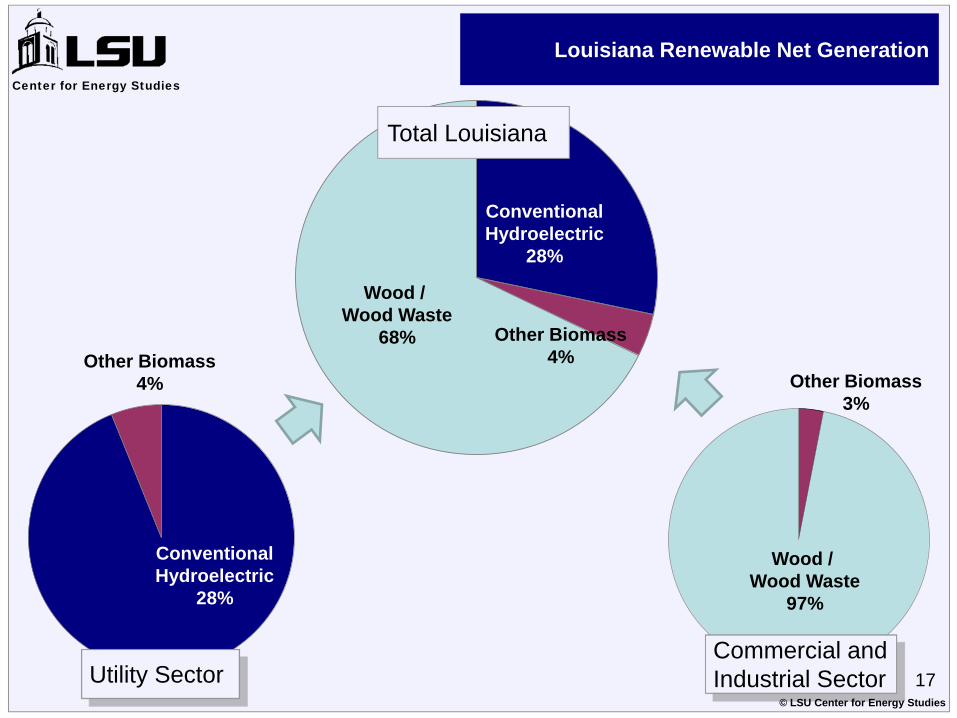
Louisiana Renewable Net Generation
ConventionalHydroelectric
28%
Wood / Wood Waste
68% Other Biomass4%
ConventionalHydroelectric
28%
Other Biomass4%
Wood / Wood Waste
97%
Other Biomass3%
Commercial andIndustrial SectorUtility Sector
Total Louisiana
Center for Energy Studies
17© LSU Center for Energy Studies

Note: Includes Wood/wood waste solids (including paper pellets, railroad ties, utility poles, wood chips, bark, and wood waste solids), wood waste liquids (red liquor, sludge wood, spent sulfite liquor, and other wood-based liquids), and black liquor.Source: Energy Information Administration, U.S. Department of Energy
Cap
acity
(MW
)G
eneration (million M
Wh)
Since 2002, electric generation capacity from wood and wood-derived fuels in Louisiana has increased 148 percent. Generation increased 10 percent between 2002
and 2003; it has remained between 2.8 and 3 million MWh since.
Wood Generation Trends:Historic Louisiana Capacity and Generation
Center for Energy Studies
18© LSU Center for Energy Studies
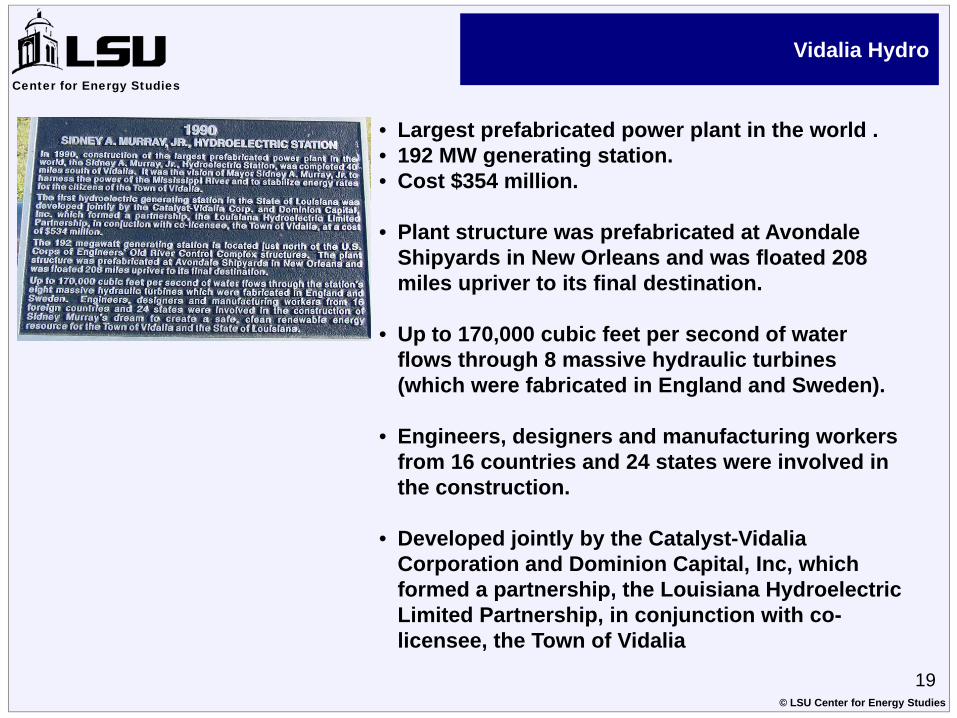
Vidalia Hydro
• Largest prefabricated power plant in the world .• 192 MW generating station.• Cost $354 million.
• Plant structure was prefabricated at Avondale Shipyards in New Orleans and was floated 208 miles upriver to its final destination.
• Up to 170,000 cubic feet per second of water flows through 8 massive hydraulic turbines (which were fabricated in England and Sweden).
• Engineers, designers and manufacturing workers from 16 countries and 24 states were involved in the construction.
• Developed jointly by the Catalyst-Vidalia Corporation and Dominion Capital, Inc, which formed a partnership, the Louisiana Hydroelectric Limited Partnership, in conjunction with co-licensee, the Town of Vidalia
Center for Energy Studies
19© LSU Center for Energy Studies
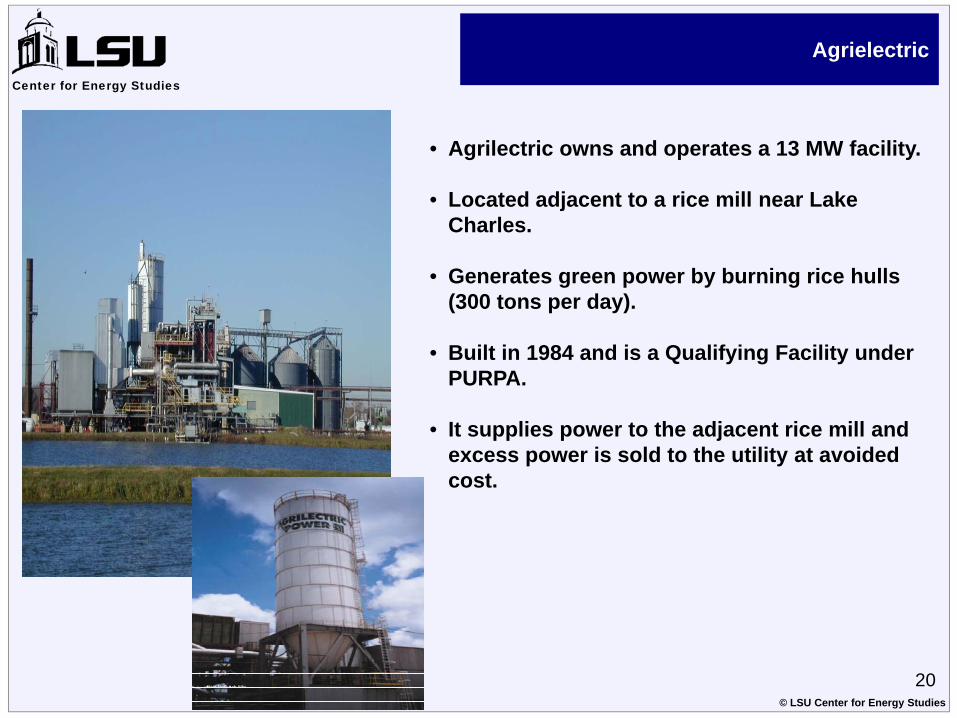
Agrielectric
• Agrilectric owns and operates a 13 MW facility.
• Located adjacent to a rice mill near Lake Charles.
• Generates green power by burning rice hulls (300 tons per day).
• Built in 1984 and is a Qualifying Facility under PURPA.
• It supplies power to the adjacent rice mill and excess power is sold to the utility at avoided cost.
Center for Energy Studies
20© LSU Center for Energy Studies
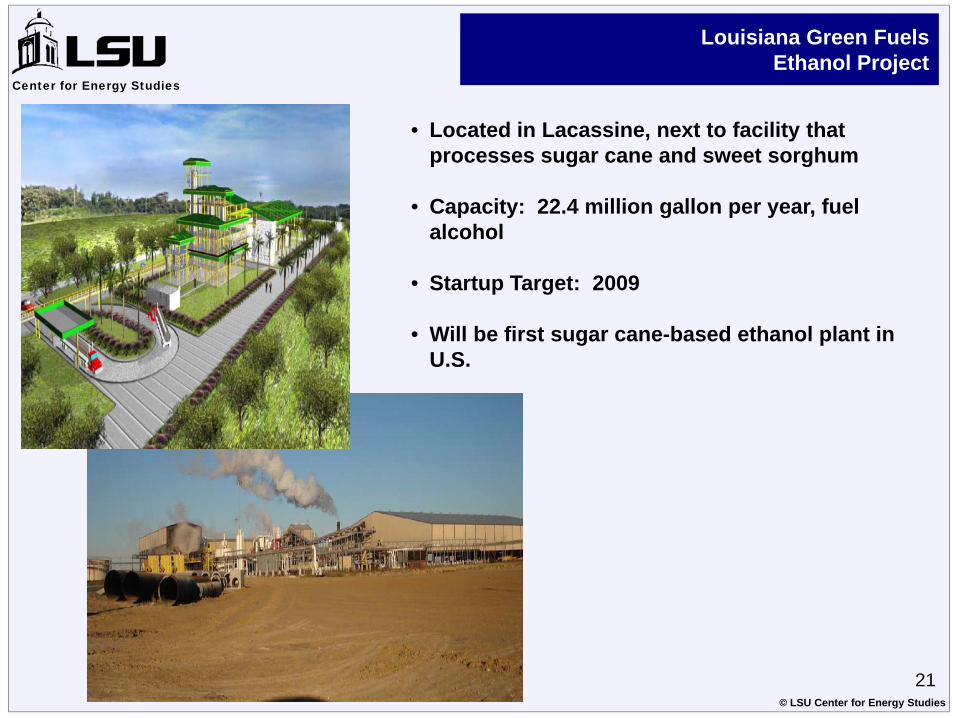
Louisiana Green FuelsEthanol Project
• Located in Lacassine, next to facility that processes sugar cane and sweet sorghum
• Capacity: 22.4 million gallon per year, fuel alcohol
• Startup Target: 2009
• Will be first sugar cane-based ethanol plant in U.S.
Center for Energy Studies
21© LSU Center for Energy Studies
22
Louisiana RenewableGeneration Opportunities
Center for Energy Studies
22© LSU Center for Energy Studies
Cap
acity
(MW
)
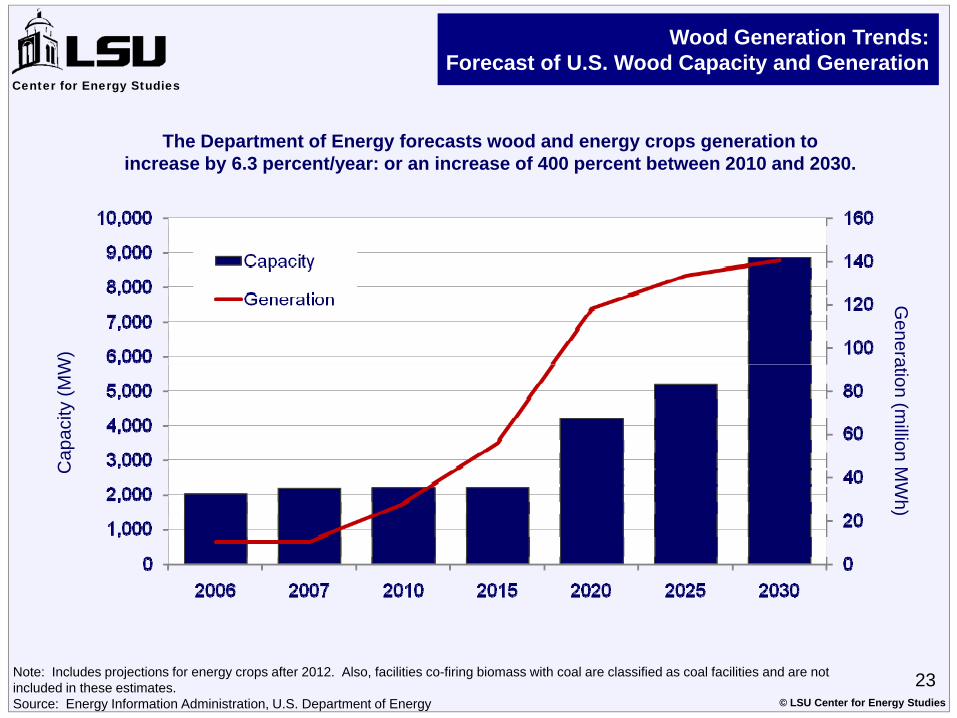
Note: Includes projections for energy crops after 2012. Also, facilities co-firing biomass with coal are classified as coal facilities and are not included in these estimates.Source: Energy Information Administration, U.S. Department of Energy
Generation (m
illion MW
h)
The Department of Energy forecasts wood and energy crops generation to increase by 6.3 percent/year: or an increase of 400 percent between 2010 and 2030.
Center for Energy Studies
Wood Generation Trends:Forecast of U.S. Wood Capacity and Generation
23© LSU Center for Energy Studies
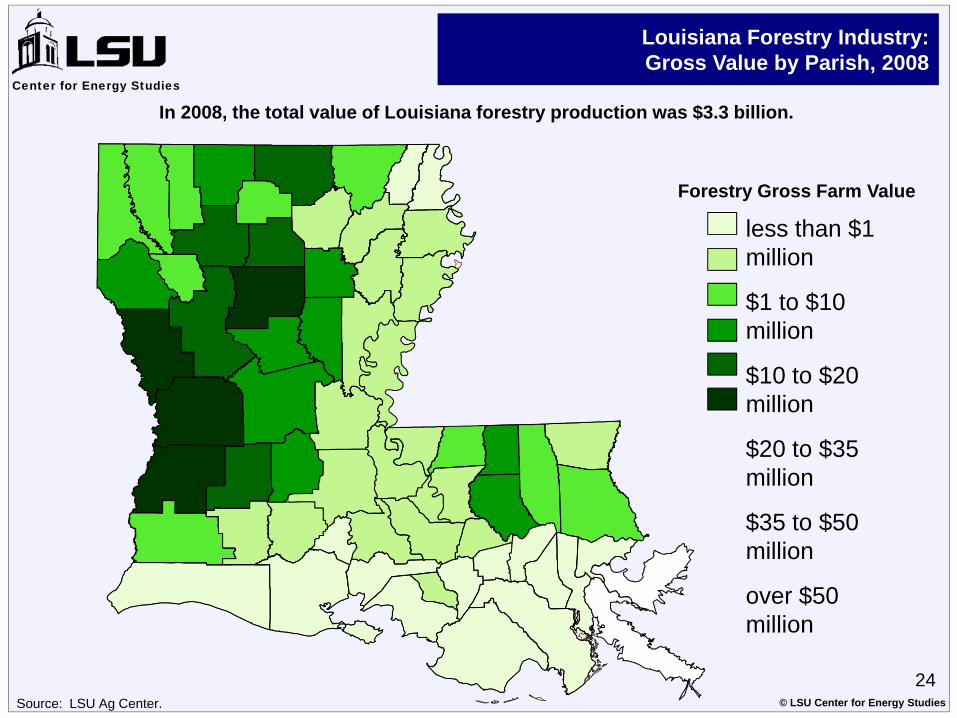
less than $1 million
$1 to $10 million
$10 to $20 million
$20 to $35 million
$35 to $50 million
over $50 million
In 2008, the total value of Louisiana forestry production was $3.3 billion.
Source: LSU Ag Center.
Forestry Gross Farm Value
Center for Energy Studies
Louisiana Forestry Industry:Gross Value by Parish, 2008
24© LSU Center for Energy Studies
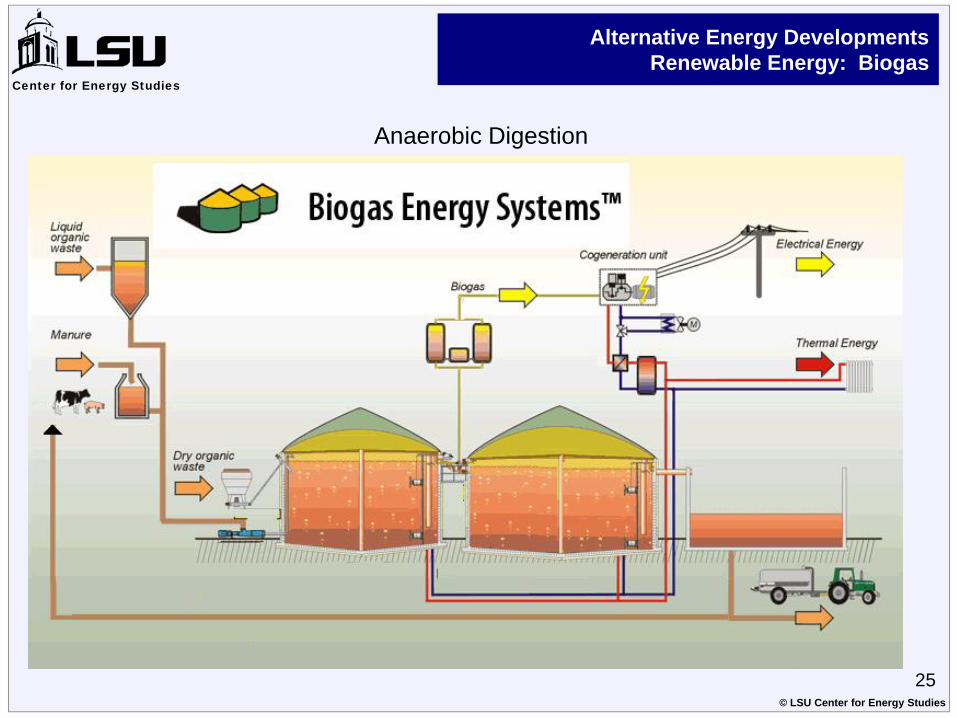
Anaerobic Digestion
Center for Energy Studies
Alternative Energy DevelopmentsRenewable Energy: Biogas
25© LSU Center for Energy Studies
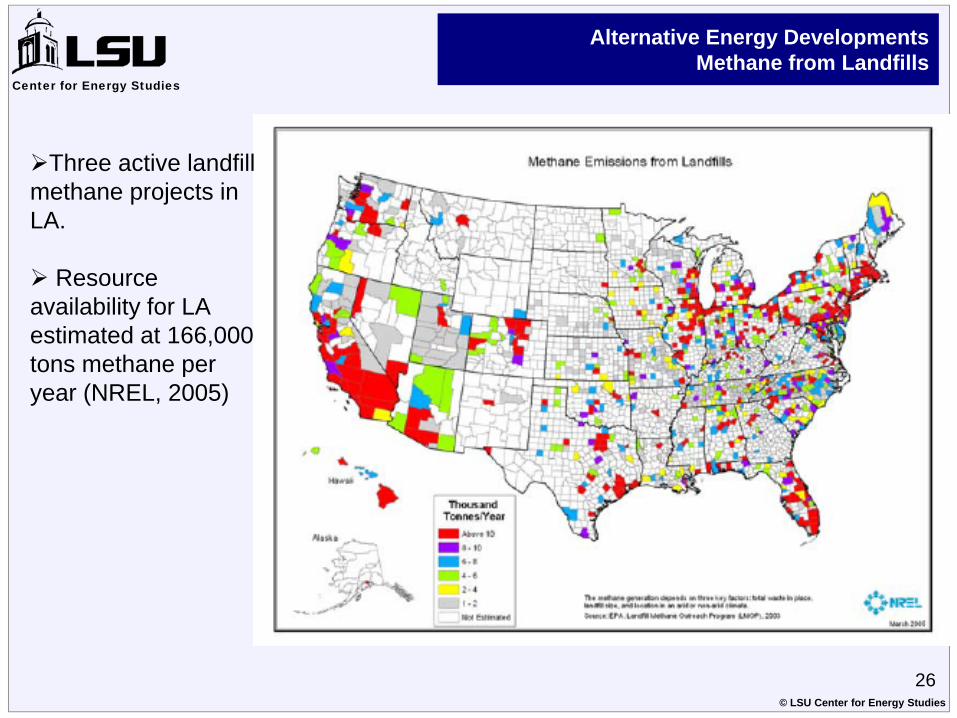
Three active landfill methane projects in LA.
Resource availability for LA estimated at 166,000 tons methane per year (NREL, 2005)
Center for Energy Studies
Alternative Energy DevelopmentsMethane from Landfills
26© LSU Center for Energy Studies
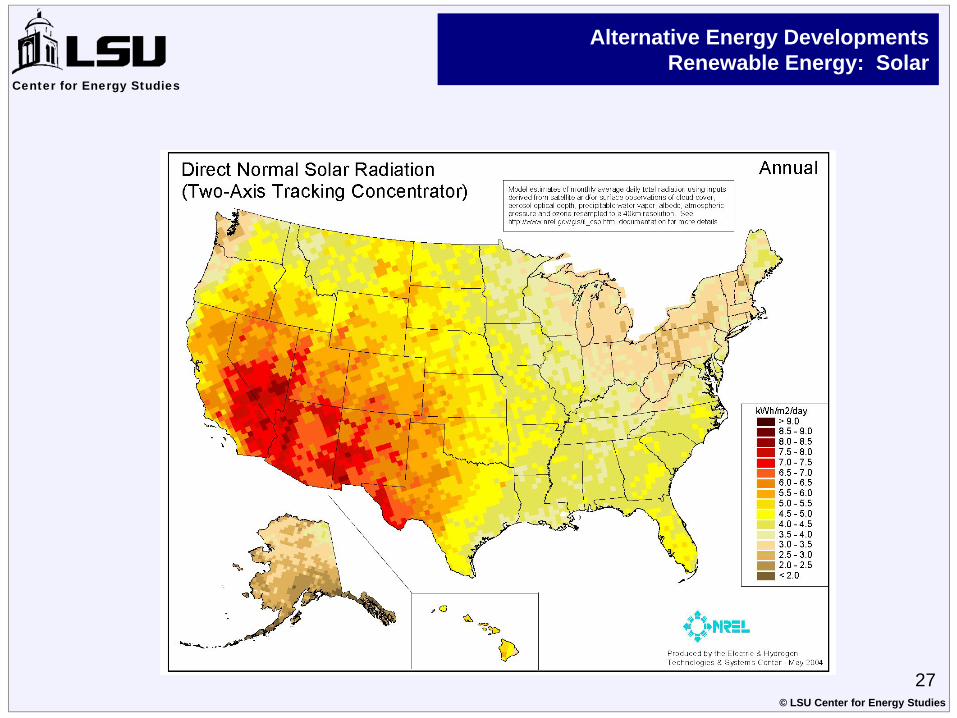
Alternative Energy DevelopmentsRenewable Energy: Solar
Center for Energy Studies
27© LSU Center for Energy Studies
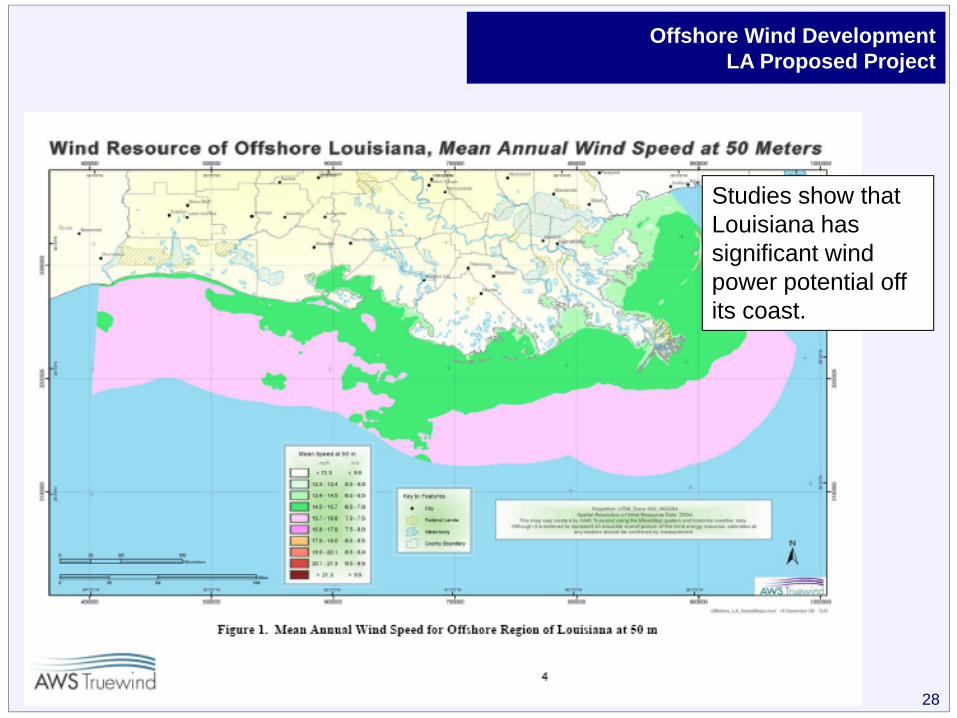
Offshore Wind DevelopmentLA Proposed Project
28
Studies show that Louisiana has significant wind power potential off its coast.
Offshore Wind DevelopmentDeep Water Wind
29Source: AWEA
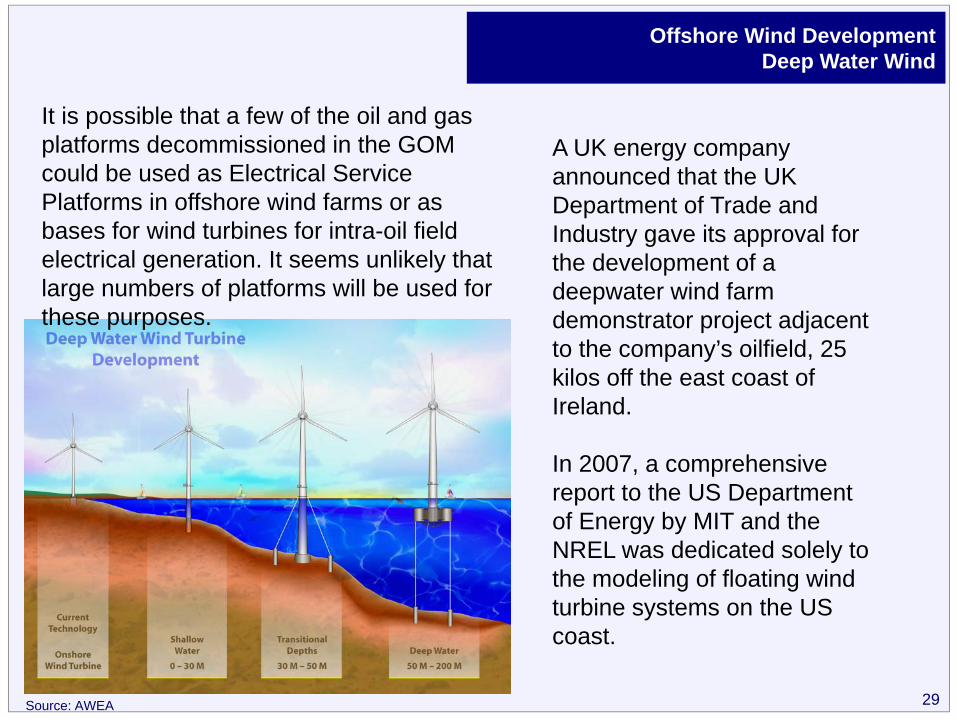
A UK energy company announced that the UK Department of Trade and Industry gave its approval for the development of a deepwater wind farm demonstrator project adjacent to the company’s oilfield, 25 kilos off the east coast of Ireland.
In 2007, a comprehensive report to the US Department of Energy by MIT and the NREL was dedicated solely to the modeling of floating wind turbine systems on the US coast.
It is possible that a few of the oil and gas platforms decommissioned in the GOM could be used as Electrical Service Platforms in offshore wind farms or as bases for wind turbines for intra-oil field electrical generation. It seems unlikely that large numbers of platforms will be used for these purposes.
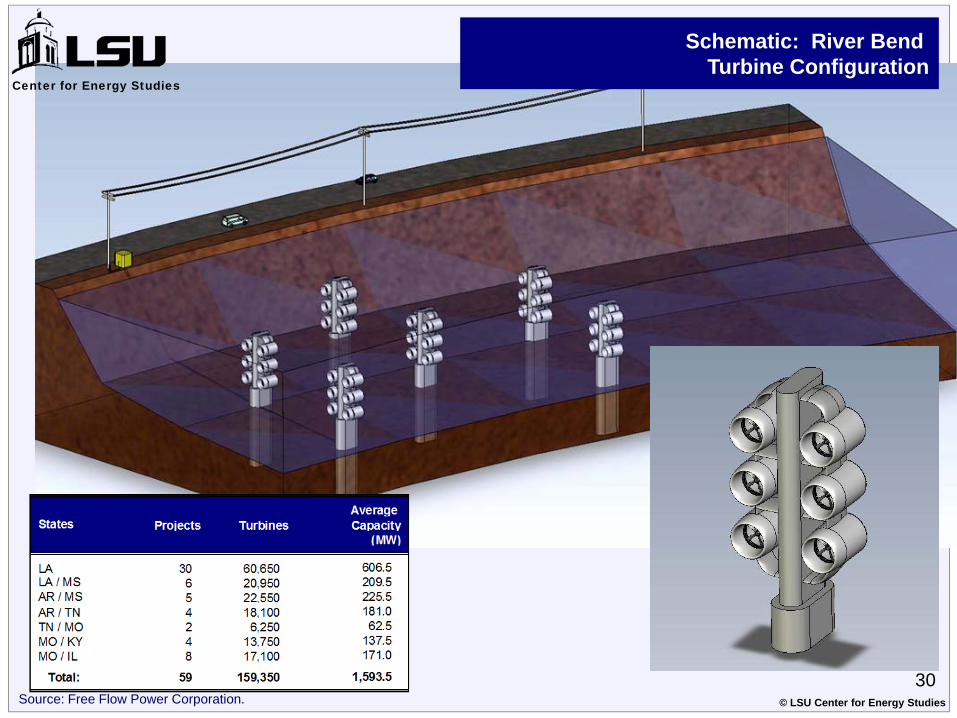
Source: Free Flow Power Corporation.
Center for Energy Studies
30© LSU Center for Energy Studies
Schematic: River Bend Turbine Configuration
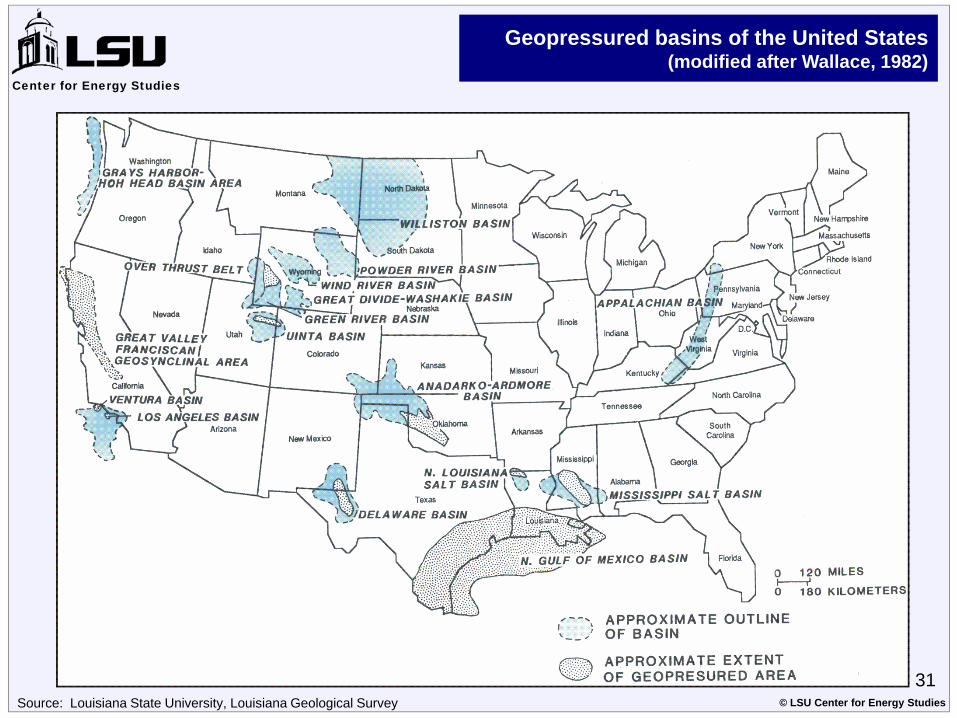
Geopressured basins of the United States(modified after Wallace, 1982)
Source: Louisiana State University, Louisiana Geological Survey
Center for Energy Studies
31© LSU Center for Energy Studies
Center for Energy Studies
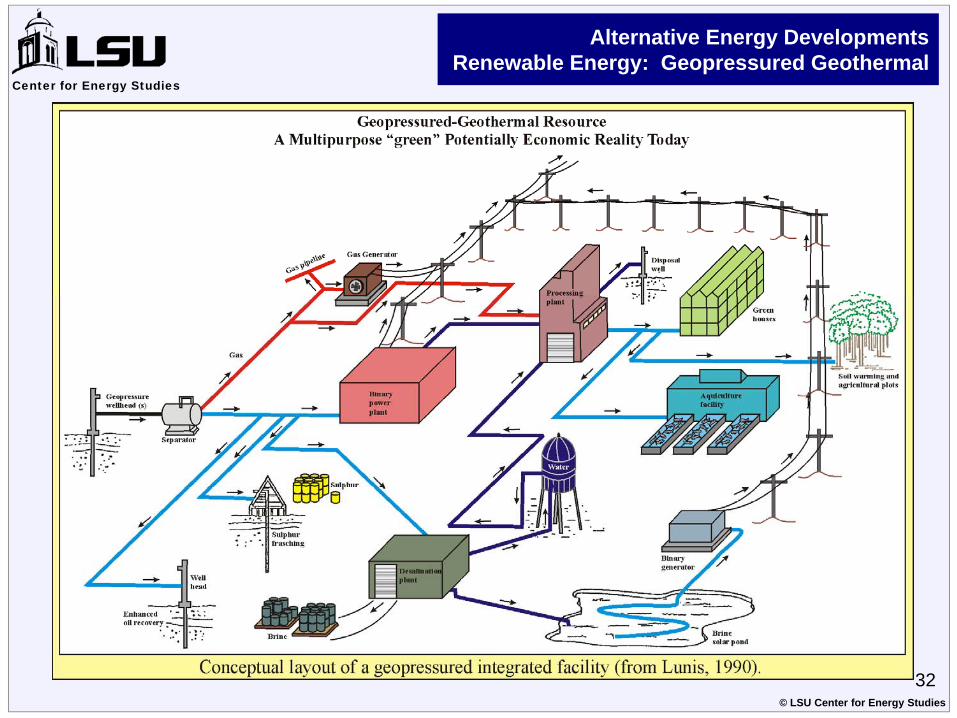
Alternative Energy DevelopmentsRenewable Energy: Geopressured Geothermal
32© LSU Center for Energy Studies
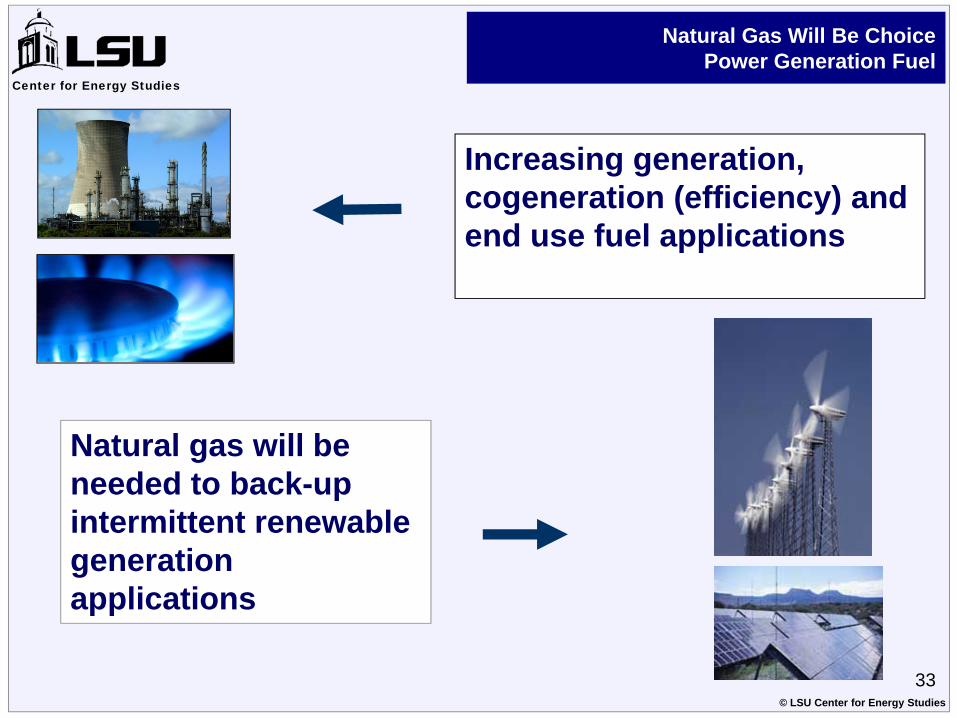
Natural Gas Will Be ChoicePower Generation Fuel
Increasing generation, cogeneration (efficiency) and end use fuel applications
Natural gas will be needed to back-up intermittent renewable generation applications
33© LSU Center for Energy Studies
Center for Energy Studies
Natural Gas Production
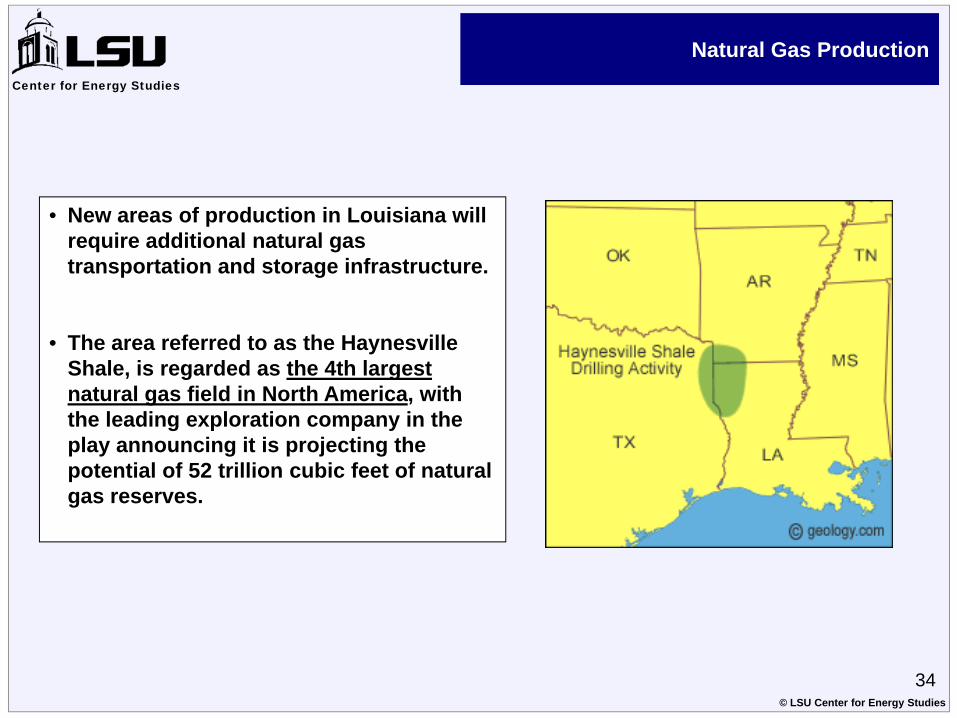
• New areas of production in Louisiana will require additional natural gas transportation and storage infrastructure.
• The area referred to as the Haynesville Shale, is regarded as the 4th largest natural gas field in North America, with the leading exploration company in the play announcing it is projecting the potential of 52 trillion cubic feet of natural gas reserves.
34© LSU Center for Energy Studies
Center for Energy Studies
Conclusions
Center for Energy Studies
35© LSU Center for Energy Studies

Conclusions
36© LSU Center for Energy Studies
Outside of unconventional gas, renewable energy is the fastest growing sector of the energy industry and should be for several years to come.
Considerable national policy momentum for a federal standard.
No silver bullet for Louisiana, resource base is more “niche” oriented. Considerable unique opportunities with considerable unique challenges.
Louisiana has as many opportunities for successful renewable energy development as any other state, provided appropriate support mechanisms are in place.
Louisiana natural gas production will be an important component of national renewable energy development.
Center for Energy Studies

Questions, Comments, & Discussion
www.enrg.lsu.edu
Center for Energy Studies
37© LSU Center for Energy Studies