removal of chlorinated phenols in upflow anaerobic sludge blanket reactors
TRANSCRIPT

~ Pergamon
PH: S0273-1223(98)00712-4
Waf. Sci. Tech. Vol. 38. No. 8-9. pp. 359-367. 1998.lAWQ
© 1998 Published by Elsevier Science Ltd.Printed in Great Britain. All rights reserved
0273-1223/98 $19'00 + 0'00
REMOVAL OF CHLORINATED PHENOLSIN UPFLOW ANAEROBIC SLUDGEBLANKET REACTORS
Ronald L. Droste, Kevin l. Kennedy, lingua Lu andMercedes Lentz
Department ofCivil Engineering, University ofOttawa, Ottawa, Ontario,Canada KIN 6N5
ABSTRACT
The dechlorination of chlorophenol (CP) compounds was investigated using uptlow anaerobic sludge blanketreactors. A total of five trichlorophenols (TCPs) and a single dichlorophenol (DCP) were individuallytreated: 2,3,4-TCP; 2,3,5-TCP; 2,3,6-TCP; 2.4,5-TCP; 2,4,6-TCP; and 3,5-DCP. Synthetic wastewatercomposed of sucrose and acetic acid provided an altemate, readily biodegradable carbon source. Eachchlorinated compound was concurrently fed to separate reactors. The parameters that were quantified includebiogas composition, acetic acid concentration, COD, and VSS. The degree to which CPs were sorbed to thegranular biomass in actively dechlorinating VASB reactors was found to be insignificant. CP compoundswere able to be metabolized to mineral end products to a large extent at loadings where reactor performancewas not impaired. Ortho chlorine atoms were most readily removed from CPs. CPs containing chlorine atomsin the para position were the most toxic agents with 2,4,5-TCP being the most toxic compound. Toxicity wasreversible. © 1998 Published by Elsevier Science Ltd. All rights reserved
KEYWORDS
UASB; chlorophenols; anaerobic; biological treatment; reductive dechlorination.
INTRODUCTION
The environmental effects of halogenated organic poUutants have long been the subject of vigorouslegislative control and research. This class of pollutants is noteworthy for their toxicity and recalcitrantnature in the environment. Halogenated aliphatic and aromatic compounds are produced in large quantitiesas solvents, precursors in the formation of herbicides and pesticides in the pulp bleaching process. A widevariety of chlorinated compounds have been identified in the effluent of kraft mills ranging from simpleorganochlorine compounds to a high molecular weight class of chlorolignins. In the bleaching processchlorine is introduced to the hydroxyl and phenolic functional groups composing lignin, as a consequence avariety of chlorinated acidic lignin and phenolic components are dissolved in the spent chlorination liquor(Kringstad and Lindstrom, 1984). Effluents containing CPs and related compounds are particularlyproblematic due to their persistence in the environment and their high solubility in fat. Once introduced intowater ecosystems, accumulation within river sediments and bioaccumulation within the tissues of organismshave been observed.
359
360 R. L. DROSTE et al.
Anaerobic processes have been shown to successfully dehalogenate more highly chlorinated phenoliccompounds (Hakulinen et ai., 1982 and Salkinoja-Salonen et ai., 1984). The biosorption of hydrophobic,non-volatile halogenated phenolic compounds has been observed in the final fate of halogenated compounds.Anaerobic batch culture studies have shown that mono- and di-chlorinated phenols can be mineralized underconditions where they are used as the sole carbon source when the biomass is provided a long acclimationperiod. Additionally, anaerobic bacteria reductively dechlorinate chlorinated compounds during thebiodegradation of wastewater (Sulfita et ai., 1982 and Shelton and Tiedje, 1984). Additional research hasindicated that biodegradation of highly chlorinated compounds by aerobic bacteria is hindered (Tiedje et ai.,1987). Other studies by these groups indicated that less chlorinated compounds tend to be both less toxic andmore biodegradable.
The upflow anaerobic sludge bed (UASB) reactor is an advanced anaerobic treatment that is characterizedby an anaerobic granular sludge with a notably high metabolic activity and good biosolids settleability.These characteristics allow the reactor to maintain a high biosolids content while operating at relatively lowhydraulic retention times (HRT) (Kennedy et ai., 1992). Operational data for the UASB system indicate thatchemical oxygen demand (COD) removal efficiency for pulp mill effluents is between 60-75% (Habets,1987) but can be greater than 95% for more biodegradable wastewaters. There have been numerousinvestigations regarding the inhibition of anaerobic degradation due to elevated CP concentrations (Guthrieand Morrison, 1975, Horowitz et ai., 1982 and Hrudey et ai., 1987). Two inhibition scenarios have beendescribed: (i) reduction in the activity of the anaerobes degrading the chlorinated compounds and (ii)reduction of chlorinated compound degradation as well as reduction in the activity of methanogens andacidogens. Arrested activity of CP degrading anaerobes, methanogens and acidogens, can result in totalreactor failure. In general, the degree of inhibition increases with the chlorine content of compounds anddecreases with increased biosolids acclimation periods with chlorinated wastes.
OBJECTIVES
A laboratory study was conducted to evaluate the use of anaerobic UASB reactor systems for the removal ofCPs from wastewater. The specific objectives of the study were as follows:
•
•
•
•
Determine and compare reactor removal efficiencies for six CP congeners.
Determine the portion of CP removal attributable to sorption onto the microbial mass.
Quantify the degree of mineralization and transformation of chlorinated compounds.
Examine toxicity effects as they pertain to UASB reactor performance.
This paper focuses on the objectives by reporting results of studies with six UASB reactors operated atdifferent CP loading rates and subjected to 2 different hydraulic retention times (HRT). This work was partof a larger study investigating reductive dechlorination and fate of CPs in UASB systems (Lu, 1992).
MATERIALS AND METHODS
Chemicals
All c~emicals used in the experiment were purchased from Aldrich chemicals and were of 99% purity. AllsolutIOns were made with distilled/deionized Milli-Q water. CP solutions (3,5-DCP; 2,4,6-TCP; 2,4,5-TCP;2,3,6-TCP; 2,3,5-TCP; 2,3,4-TCP) were made up in 0.01 M NaOH and adjusted to pH 7.5 using H
2S0
4,
Laboratory-scale bioreactors
Removal of chlorinated phenols 361
Six UAS.B reac~ors containing anaerobic granular biosolids were employed. Each was equipped with arecycle Ime to mcrease the degree of mixing within the reactor and was fed with the same syntheticwastewater containing a different CP congener. The reactors were located in a temperature controlled roomat 35°C.
The total operating volume of the reactors was 6.1 I wherein the quiescent anaerobic sludge occupiedbetween 50-60% of the reactor empty bed volume. A single layer of polyethylene plastic packing (Kochbiorings, diameter and length of 1.5 cm) was located at the top of the reactor to retard sludge from wash outthrough the effluent port. Synthetic wastewater feed solutions were pumped into the bottom of the reactorsusing a Harvard peristaltic pump. A variable speed Masterflex pump was used to maintain a 5: I recycle tofeed flow ratio. CP solutions were input into the recycle line by Harvard Apparatus syringe infusion pumps.Sampling ports were located along the side of each reactor and in the recycle line. The recycle line samplingport was a glass tee fitted with a screw cap and butyl rubber septum. Effluent was collected in a food gradeplastic bucket.
Each reactor was inoculated from a stock culture with 3 I of anaerobic granular sludge with a concentrationof 40 g YSS/l. The sludge had never been exposed to CPs. The reactor biomass was allowed to vary between20 and 28 g YSS/I (based on the reactor volume of 6.1 I) throughout the experiment. The biomassaccumulation was measured at the end of the experimental period. Synthetic wastewater, as an alternatecarbon source, was prepared using equal amounts of sucrose and acetic acid on a COD basis. The feed totalCOD was 5000 mg/l. The feed was buffered and nutrients were added to it.
The feed was maintained at 4°C in a refrigerated container as it was fed. Concentrated CP solutions weremetered into the feed line. In each stage the CP loading was increased stepwise by increasing itsconcentration in the synthetic wastewater. If toxicity was exhibited with a drop in COD removal of thecarbon source to 80%, feeding of CP was suspended until the reactor recovered. Soluble COD removals inwell functioning reactors were above 95%.
Sampling and experiments
Mass balances of COD and CPs were performed on each reactor. The masses of chlorinated organiccompounds associated with reactor sludge were determined using standard analytical extraction techniques.Soluble COD and gas composition were analyzed twice per week. Gas production, effluent volume, volatileacids, and CP concentrations in each reactor effluent were normally measured daily during the week. Noeffort was made to monitor aromatic ring cleavage products throughout the experiment. Alkalinity and pHanalyses were conducted once every two weeks.
Chlorophenols associated with biomass
CP removal associated with sorption to the anaerobic granular sludge was determined using a gaschromatographic-mass selective detector (GC-MSD). Ten ml biomass samples were removed from thereactors and centrifuged at 14,800 g for 10 min. The supernatant was decanted and saved; the granules werethen washed and suspended in distilled water and again centrifuged. The pellet formed was redissolved in 5ml of dilution media. One ml of internal standard was added (either 2,6-dibromophenol or 2,4,6-TCPdepending on the sample). Samples were made alkaline using 1 ml of 1M NaOH and then reacted with 1 mlof acetic anhydride for 3 h. CPs were extracted from the mixture into 5 ml of hexane. Acetylated CPs werequantified and verified by GC-MSD using a capillary column (J&W Scientific DB-5 capillary column on aHewlet-Packard 5890-GC/5971A-MSD). A splitless injection with a 30 s purge activation was employed forall injections and ultra high purity helium was used as the carrier gas. Separation was improved using thefollowing temperature schedule: initial column temperature of 40°C held for one minute, temperatureincreased 15°C/min to 100°C, temperature increased 2°C/min to a final temperature of 210°C. Injection portand transfer line temperatures were 250 and 280°C, respectively. CP recovery with this method wasdetermined to be greater than 95%.
362
Chlorophenols in the mixed liquor
R. L. DROSTE et at.
Mixed liquor samples were removed from the reactor recycle line and centrifuged for three minutes in aBeckman microcentrifuge to separate the supernatant from the biomass solids. The supernatant was thenfiltered through a Millipore 0.22 ~m Millex GV 13 filter into a glass vial, sealed with a teflon coated rubbercap and stored at 4°C prior to analysis. Concentrations were determined using a high performance liquidchromatograph (HPLC). Samples were separated on a Hypersil-ODS C 18 column, 2.1 mm i.d. x 100 mmlong x 5 ~m particle size. Detection wavelengths were set at 280 and 324 nm. The column was maintained at40°C and the flowrate of the mobile phase was set at 0.3 ml/min. A solvent gradient using HPLC grademethanol (0-100% in 15 minutes) and 0.05 M sodium acetate at pH 4.7 was used.
Other analytical techniques
Volatile fatty acids (VFA) were determined by the method of Ackman (1972) using a Hewlett-Packard572lA GC with a Chromosorb 101 glass column (approx. 6.35 mm x 365.8 cm). The column was held at180°C, and the temperature of the flame ionization detector was 350°C. Helium was the carrier gas at a flowrate of 15 ml/min. Samples were prepared by adding an internal standard (0.5 ml of 1000 mg/l isobutyricacid) to 0.5 ml of sample. The volume injected on the column was 0.8 ~l.
VSS analyses were performed according to Standard Methods (APHA, 1989). COD samples were performedusing the reflux method (Knetchel, 1978). All samples were analyzed in duplicate.
Biogas
A calibrated wet tip gas meter was used to measure biogas production. Biogas composition was determinedby the method of van Huyssteen (1967). The GC was equipped with a thermal conductivity detector andintegrator. The column (Porapack T 50/80 mesh) was maintained at 70°C. Ultra high purity helium was thecarrier gas at a flow rate of 40 ml/min. The detector and injection port temperatures were held at 150 and100°C, respectively. A sample volume of 0.5 ml was injected into the column.
RESULTS AND DISCUSSION
Chlorophenol removal
The HRTs investigated in this study were 3 d and 1 d. The reactors were initially run at a 3 d HRT for two tofive months. Then they were changed to aId HRT operation for several months. At the 1 d HRT, thevolumetric organic loadings and specific organic loadings (carbon loadings) were three-fold greater thanthose used for the same TCP concentrations as the 3 d HRT experiments. The reactor biomass was wellacclimated to CPs for all of the 1 d HRT runs; at the 3 d HRT operation, by the third concentration level, allreactors except one had been exposed to CPs for at least 19 days.
The anaerobic granular sludge seeded into all reactors had a specific acetoclastic methanogenic activity of0.5 g COD/g VSS.d. In terms of specific organic loading rates the reactors were not metabolically stressedeither at the 3 d or 1 d HRTs. At lower influent CP concentrations ($ 4 mg/l) reactors were often operated atthe particular CP loading for only a brief period of time because no adverse effects on overall treatment wereexpected or experienced. At higher influent CP concentrations the operational goal in terms of the minimumoperating time at a particular loading was 10 days. If inhibition of the microbial consortia was experienced,the CP loading was reduced or terminated. Data reported in this paper were collected during the last 4 daysof each run except when the run time was reduced for the reasons just described.
Removal of chlorinated phenols
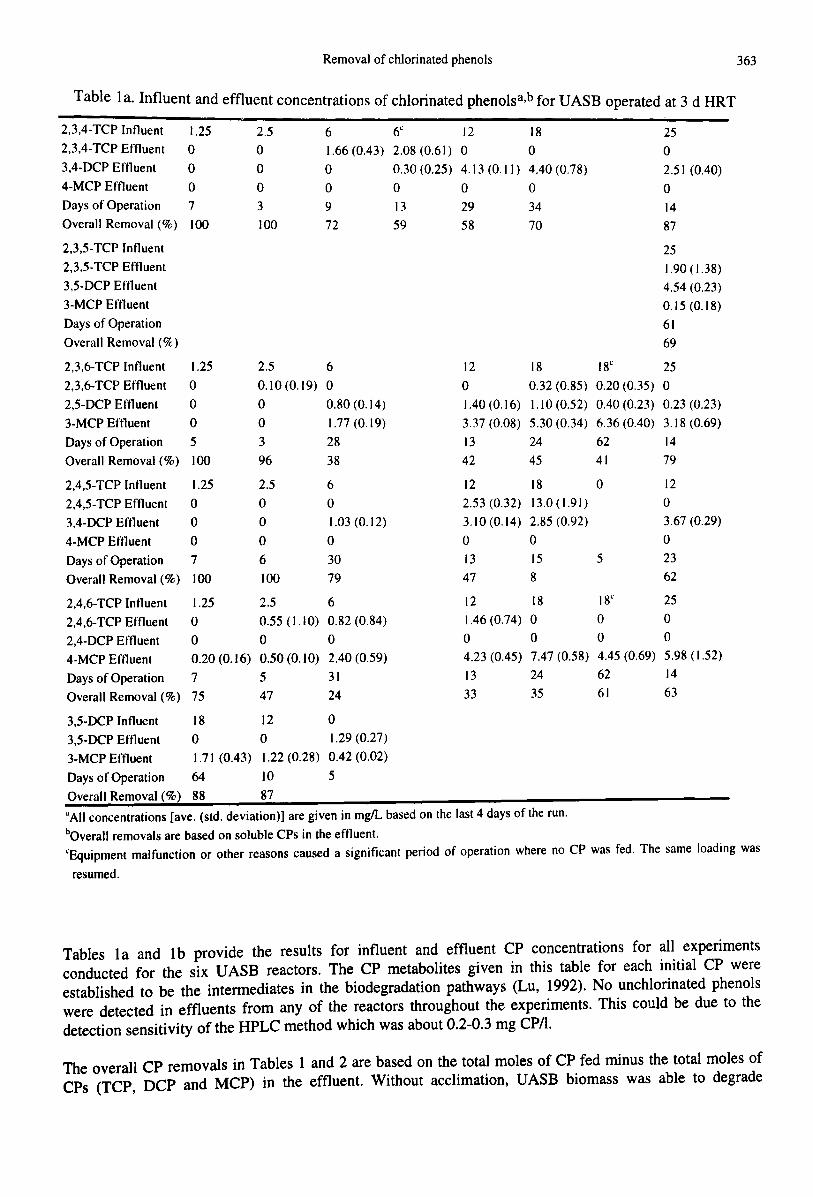
Table lao Influent and effluent concentrations of chlorinated phenolsa,b for UASB operated at 3 d HRT. .
363
2,3,4-TCP Influent 1.25 2.52,3,4-TCP Effluent 0 03,4-DCP Effluent 0 0
4-MCP Effluent 0 0Days of Operation 7 3
Overall Removal (%) 100 100
61.66 (0.43)oo9
72
6" 12 182.08 (0.61) 0 0
0.30 (0.25) 4.13 (0.11) 4.40 (0.78)00013 29 3459 58 70
25o2.5 I (0.40)o1487
2.3.5-TCP Influent2,3,5-TCP Effluent3.5-DCP Eftluent3-MCP EffluentDays of OperationOverall Removal (lk)
2,3,6-TCP Influent2,3,6-TCP Effluent
2,5-DCP Effluent3-MCP EftluentDays of OperationOverall Removal (%)
1.25ooo5100
2.50.10 (0.19)oo396
6o0.80 (0.14)1.77 (0.19)2838
12
o1.40 (0.16)337 (0.08)1342
18 18<
0.32 (0.85) 0.20 (0.35)1.10 (0.52) 0.40 (0.23)5.30 (0.34) 6.36 (0.40)24 6245 41
251.90 (1.38)4.54 (0.23)0.15 (0.18)
6169
25o0.23 (0.23)3.18 (0.69)1479
12 18 18" 251.46 (0.74) 0 0 0o 0004.23 (0.45) 7.47 (0.58) 4.45 (0.69) 5.98 (1.52)13 24 62 1433 35 61 63
2,4,5-TCP Influent 1.25 2.5 62,4,5-TCP Effluent 0 0 0
3,4-DCP Eftluent 0 0 1.03 (0.12)4-MCP Eftluent 0 0 0
Days of Operation 7 6 30Overall Removal (%) 100 100 79
2,4,6-TCP Influent 1.25 2.5 6
2,4,6-TCP Effluent 0 0.55 (1.10) 0.82 (0.84)2,4-DCP Effluent 0 0 0
4-MCP Efnuent 0.20 (0.16) 0.50 (0. 10) 2.40 (0.59)Days of Operation 7 5 31Overall Removal (%) 75 47 24
3,5-DCP Influent 18 12 03,5-DCP Effluent 0 0 1.29 (0.27)3-MCP Effluent 1.71 (0.43) 1.22 (0.28) 0.42 (0.02)Days of Operation 64 10 5Overall Removal (%) 88 87
12 182.53 (0.32) 13.0 (1.9/)3.10(0.14) 2.85(0.92)
o 013 /5
47 8
o
5
12o3.67 (0.29)o2362
"All concentrations [ave. (std. deviation)] are given in mgIL based on the last 4 days of the run.bOveraJl removals are based on soluble CPs in the effluent.
"Equipment malfunction or other reasons caused a significant period of operation where no CP was fed. The same loading wasresumed.
Tables 1a and 1b provide the results for influent and effluent CP concentrations for all experimentsconducted for the six UASB reactors. The CP metabolites given in this table for each initial CP wereestablished to be the intermediates in the biodegradation pathways (Lu, 1992). No unchlorinated phenolswere detected in effluents from any of the reactors throughout the experiments. This could be due to thedetection sensitivity of the HPLC method which was about 0.2-0.3 mg cpn.
The overall CP removals in Tables 1 and 2 are based on the total moles of CP fed minus the total moles ofCPs (TCP, DCP and MCP) in the effluent. Without acclimation, UASB biomass was able to degrade
364 R. L. DROSTE et ai.
significant amounts of TCP. Reactor perfonnance in tenns of CP removal and organic car~on removal wassimilar for the three CP loading rates where there was a gap in reactor operation as shown 10 Tables 1a andIb (2,3,4-TCP 3 d HRT, 6 mg TCPIl; 2,4,6-TCP, 3 d HRT, 18 mg TCPIl; 2,3,5-TCP, 1 d HRT, 18 mg
TCPI1).
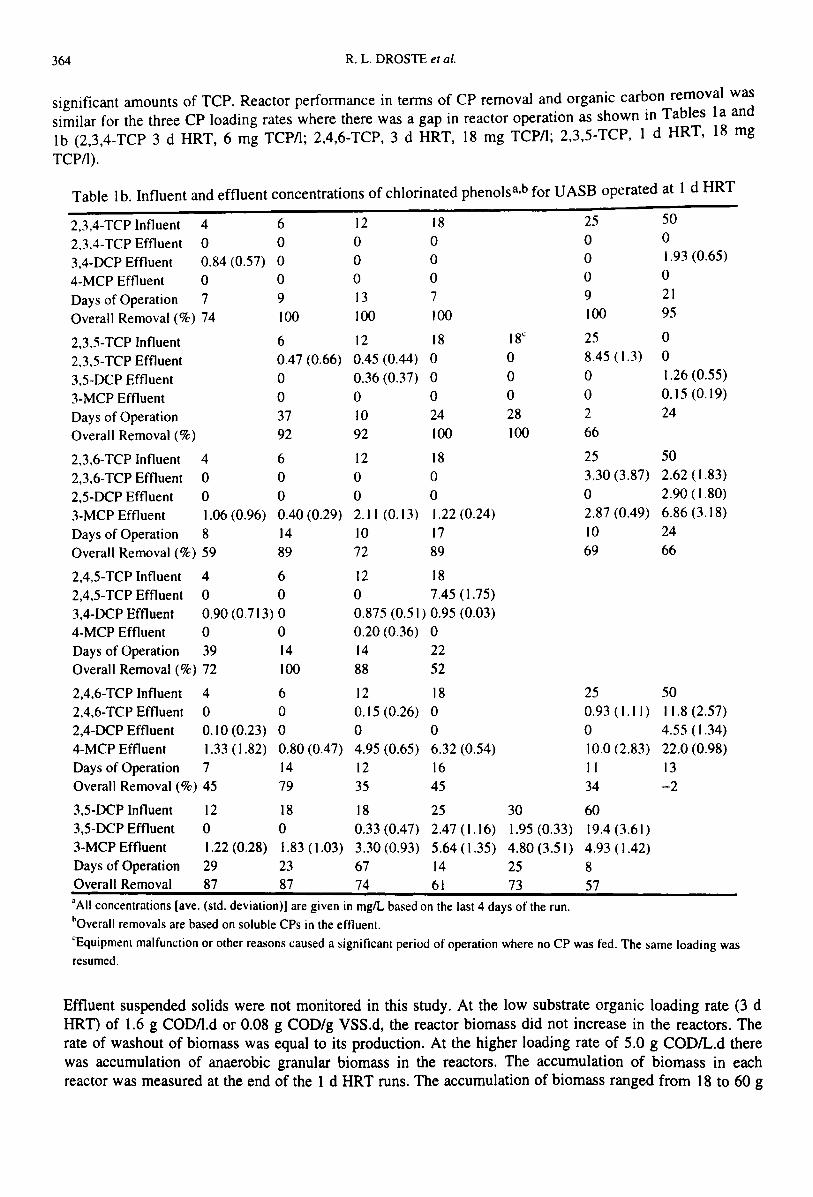
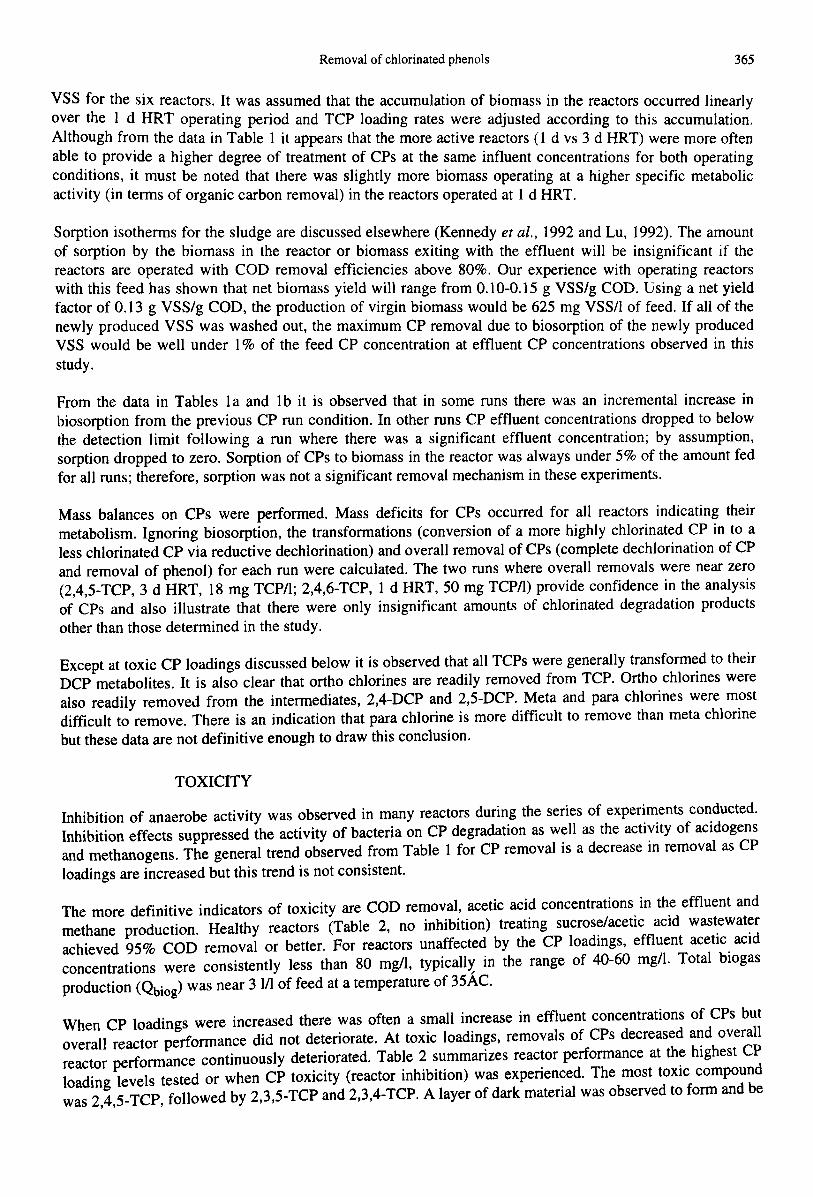
Table Ib. Influent and effluent concentrations of chlorinated phenolsa,b for VASH operated at 1 d HRT
2,3,4-TCP Influent 4 6 12 18 25 50
2.3.4-TCP Effluent 0 0 0 0 0 0
3,4-OCP Effluent 0.84 (0.57) 0 0 0 0 1.93 (0.65)
4-MCP Effluent 0 0 0 0 0 0
Days of Operation 7 9 13 7 9 21
Overall Removal (%) 74 100 100 100 100 95
2,3,5-TCP Influent 6 12 18 18" 25 0
2.3,5-TCP Effluent 0.47 (0.66) 0.45 (0.44) 0 0 8.45 (1.3) 0
3,5-DCP Effluent 0 0.36 (0.37) 0 0 0 1.26 (0.55)
3-MCP Effluent 0 0 0 0 0 0.15 (0.19)
Days of Operation 37 10 24 28 2 24
Overall Removal (%) 92 92 100 100 66
2,3,6-TCP Influent 4 6 12 18 25 50
2,3,6-TCP Effluent 0 0 0 0 3.30 (3.87) 2.62 (1.83)
2,5-OCP Effluent 0 0 0 0 0 2.90 (1.80)
3-MCP Effluent 1.06 (0.96) 0.40 (0.29) 2.11 (0.13) 1.22 (0.24) 2.87 (0.49) 6.86 (3.18)
Days of Operation 8 14 10 17 10 24
Overall Removal (%) 59 89 72 89 69 66
2,4,5-TCP Influent 4 6 12 182,4,5-TCP Effluent 0 0 0 7.45 (1.75)
3,4-OCP Effluent 0.90 (0.713) 0 0.875 (0.51) 0.95 (0.03)4·MCP Effluent 0 0 0.20 (0.36) 0Days of Operation 39 14 14 22Overall Removal (%) 72 100 88 52
2,4,6-TCP Influent 4 6 12 18 25 502,4,6-TCP Effluent 0 0 0.15 (0.26) 0 0.93 (1.11) 11.8 (2.57)2,4-OCP Effluent 0.10 (0.23) 0 0 0 0 4.55 (1.34)4-MCP Effluent 1.33 (1.82) 0.80 (0.47) 4.95 (0.65) 6.32 (0.54) 10.0 (2.83) 22.0 (0.98)Days of Operation 7 14 12 16 II 13Overall Removal (%) 45 79 35 45 34 -2
3,5-OCP Influent 12 18 18 25 30 603,5-DCP Effluent 0 0 0.33 (0.47) 2.47 (1.16) 1.95 (0.33) 19.4(3.61)3-MCP Effluent 1.22 (0.28) 1.83 (1.03) 3.30 (0.93) 5.64 (1.35) 4.80 (3.51) 4.93 ( 1.42)Days of Operation 29 23 67 14 25 8Overall Removal 87 87 74 61 73 57'AII concentrations [ave. (std. deviation)] are given in mglL based on the last 4 days of the run.~Overall removals are based on soluble CPs in the effluent."Equipment malfunction or other reasons l:aused a significant period of operation where no CP was fed. The same loading wasresumed.
Effluent suspended solids were not monitored in this study. At the low substrate organic loading rate (3 dHRT) of 1.6 g CODIl.d or 0.08 g COD/g VSS.d, the reactor biomass did not increase in the reactors. Therate of washout of biomass was equal to its production. At the higher loading rate of 5.0 g CODIL.d therewas accumulation of anaerobic granular biomass in the reactors. The accumulation of biomass in eachreactor was measured at the end of the 1 d HRT runs. The accumulation of biomass ranged from 18 to 60 g
Removal of chlorinated phenols 365
VSS for the six reactors. It was assumed that the accumulation of biomass in the reactors occurred linearlyover the I d HRT operating period and TCP loading rates were adjusted according to this accumulation.Although from the data in Table 1 it appears that the more active reactors (1 d vs 3 d HRT) were more oftenable ~~ prov.ide a higher degree of treatment of CPs at the same influent concentrations for both operatingCO~d~tIO~S, It must be noted that there was slightly more biomass operating at a higher specific metabolicactivity (m terms of organic carbon removal) in the reactors operated at 1 d HRT.
Sorption isotherms for the sludge are discussed elsewhere (Kennedy et ai., 1992 and Lu, 1992). The amountof sorption by the biomass in the reactor or biomass exiting with the effluent will be insignificant if thereactors are operated with COD removal efficiencies above 80%. Our experience with operating reactorswith this feed has shown that net biomass yield will range from 0.10-0.15 g VSS/g COD. Using a net yieldfactor of 0.13 g VSS/g COD, the production of virgin biomass would be 625 mg VSSII of feed. If all of thenewly produced VSS was washed out, the maximum CP removal due to biosorption of the newly producedVSS would be well under 1% of the feed CP concentration at effluent CP concentrations observed in thisstudy.
From the data in Tables 1a and 1b it is observed that in some runs there was an incremental increase inbiosorption from the previous CP run condition. In other runs CP effluent concentrations dropped to belowthe detection limit following a run where there was a significant effluent concentration; by assumption,sorption dropped to zero. Sorption of CPs to biomass in the reactor was always under 5% of the amount fedfor all runs; therefore, sorption was not a significant removal mechanism in these experiments.
Mass balances on CPs were performed. Mass deficits for CPs occurred for all reactors indicating theirmetabolism. Ignoring biosorption, the transformations (conversion of a more highly chlorinated CP in to aless chlorinated CP via reductive dechlorination) and overall removal of CPs (complete dechlorination of CPand removal of phenol) for each run were calculated. The two runs where overall removals were near zero(2,4,5-TCP, 3 d HRT, 18 mg TCPIl; 2,4,6-TCP, 1 d HRT, 50 mg TCPIl) provide confidence in the analysisof CPs and also illustrate that there were only insignificant amounts of chlorinated degradation productsother than those determined in the study.
Except at toxic CP loadings discussed below it is observed that all TCPs were generally transformed to theirDCP metabolites. It is also clear that ortho chlorines are readily removed from TCP. Ortho chlorines werealso readily removed from the intermediates, 2,4-DCP and 2,5-DCP. Meta and para chlorines were mostdifficult to remove. There is an indication that para chlorine is more difficult to remove than meta chlorinebut these data are not definitive enough to draw this conclusion.
TOXICITY
Inhibition of anaerobe activity was observed in many reactors during the series of experiments conducted.Inhibition effects suppressed the activity of bacteria on CP degradation as well as the activity of acidogensand methanogens. The general trend observed from Table 1 for CP removal is a decrease in removal as CPloadings are increased but this trend is not consistent.
The more definitive indicators of toxicity are COD removal, acetic acid concentrations in the effluent andmethane production. Healthy reactors (Table 2, no inhibition) treating sucrose/acetic acid wastewaterachieved 95% COD removal or better. For reactors unaffected by the CP loadings, effluent acetic acidconcentrations were consistently less than 80 mgll, typically in the range of 40-60 mg/I. Total biogasproduction (Qbiog) was near 31/1 of feed at a temperature of 35Ac.
When CP loadings were increased there was often a small increase in effluent concentrations of CPs butoverall reactor performance did not deteriorate. At toxic loadings, removals of CPs decreased a~d overallreactor performance continuously deteriorated. Table 2 summarizes reactor performance at th~ highest CPloading levels tested or when CP toxicity (reactor inhibition) was experienced. The most tOXIC compoundwas 2,4,5-TCP, followed by 2,3,5-TCP and 2,3,4-TCP. A layer of dark material was observed to form and be

366 R. L. DROSTE et al.
washed out of the reactor treating 2,3,4-TCP. Considering removal of various CPs discussed above itappears that para chlorinated phenols are the most toxic agents.
Table 2. Toxicity of CPs to UASB reactor biomass
Qbi\l8
LIL.d Comment
No inhibitionNo inhibitionNo inhibition
2.0 InhibitionNo inhibitionNo inhibition
3.0 Dark matter1.2 Inhibition
No inhibition2.4 Inhibition
No inhibition2.0 Inhibition
300
5001000
400
77
8075
73
>0.42>0.42>0.420.30>0.42>0.30
Specific Organic Specific CP Min. COD Max. AceticLoadinga Loadinga Removal AcidgCOD/g YSS.d Ilg/g YSS.d % mglL
0.080.080.080.080.080.08
>25>25>2518>25>18
CPFeed
Compound mgIL
3 d HRT2,3,4-TCP2,3,5-TCP2,3,6-TCP2,4,5-TCP2,4,6-TCP3,5-DCP
1 dHRT2,3,4-TCP 50 0.18 1.762,3,5-TCP 25 0.22 1.092,3,6-TCP >50 0.21 >2.112,4,5-TCP 18 0.19 0.672,4,6-TCP >50 0.19 >1.903,5-DCP 60 0.16 2.00 78 1000
·Sludge loading rates at I d HRT were adjusted for the accumulated sludge in the reactor.
The specific CP sludge loading rate able to be treated in the reactors increases as the organic substrate sludgeloading rate increases. Any change in HRT will not affect the ratio of CP to substrate specific sludge loadingrates. The data suggest that the ratio of CP to co-substrate is the controlling factor for treatability andtoxicity of CPs.
As indicated in Table 1a, the reactor treating 2,4,5-TCP at a 3 d HRT was operated at influent TCPconcentrations of 18, 0 and 12 mg/l for 15, 5 and 23 days, respectively. Recovery of overall reactorperformance occurred within about 2 days after terminating the 18 mg TCpn in the feed. Performance at a12 mgn influent TCP concentration was similar to the earlier run for this reactor.
Similarly the reactors treating 2,3,5-TCP, 2,4,5-TCP and 3,5-DCP at aId HRT were operated at zero CPloadings after toxicity was experienced. Full recovery of reactor performance took from 2-5 days.
CONCLUSIONS
1. CPs can be metabolized in anaerobic systems. There was no accumulation of phenol in any of thereactors under the conditions of this study.
2. Reductive dechlorination of ortho chlorines occurs readily.3. Chlorinated phenols with para and meta chlorines are the most difficult to treat with para chlorinated
compounds exhibiting the most toxicity. The most toxic agent was 2,4,5-TCP.4. Chlorophenol toxicity is reversible. Full recovery times are from 2-5 days if influent TCP
concentrations are reduced to zero.
REFERENCES
Ackman, R. O. (1972). Porous polymer bead packing and formic acid vapour in OLe of volatile fatty acids. J. Chromat. Sci., 10,560.
APHA (1980). Standard Methods for the Examination of Waste and Wastewater. 15th edn.Guthrie, D. J. and Morrison, S. M. (1975). Bacterial concentration of chlorinated hydrocarbon insecticides from aqueous systems.
Microbial Ecol., 2. 43-59.
Removal of chlorinated phenols 367
Habets, L. H. A (1987). Experience with full-scale and pilot-scale biopaq UASB anaerobic treatment of pulp, paper and boardmilleffluents. IPPTA, 24, 1.
Hakulinen, R. and Salkinoja-Salonen, M. (1990). Treatment of pulp and paper industry wastewaters in an anaerobic fluidized bedreactor. Process Biochem., 17(2), 18-22.
Horowitz, A, Shelton, D. R., Cornell, C. P. and Tiedje, 1. M. (1982). Anaerobic degradation of aromatic compounds in sedimentsand digested sludge. Dev. Indust. Microbiol., 23, 435-444.
Hrudey, S. E., Knettig, E., Daignault, S. A and Fedorak, P. M. (1987). Anaerobic biodegradation of monochlorophenols. Sci. &Technol. Letters. 8. 65-76.
Kennedy, K.• Lu, J. and Mohn, W. W. (1992). Biosorption of chlorophenols to anaerobic granular sludge. Water Research, 26,1085-1092.
Knechtel, J. R. (1978). A more economical method for the determination of chemical oxygen demand. Water Poll. Contr., 116,25-30.
Kringstad, K. P. and Lindstrom, K. (1984). Spent liquors from pulp bleaching. Envir. Sci. and Technol., 18(8), 236A-248A.Lu, 1. (1992). The Fate of Chlorinated Phenols in Upflow Anaerobic Sludge Blanket Reactors. M.ASc. Thesis, University of
Ottawa, Ottawa, ON.Salkinoja-Salonen, M. R., Valo, R., Apajalahti, 1., Hakulinen, R., Silakoski, L. and Jaakkola, T. (1984). Biodegradation of
chlorophenolic compounds in waters from wood-processing industry. In Current Perspectives in Microbial Ecology,Klug, M. J. and Reddy, C. A (eds.), American Society for Microbiology, Washington, DC.
Shelton, D. R. and Tiedje, J. M. (1984). General method for determining anaerobic biodegradation potential. Appl. Environ.Microbiol., 47, 850-857.
Sulfita, J. M., Horowitz, A, Shelton, D. R. and Tiedje, 1. M. (1982). Dehalogenation: a novel pathway for the anaerobicbiodegradation of haloaromatic compounds. Sci., 218, 1115-1117.
Tiedje, J. M., Boyd, S. A. and Fathepure, B. Z. (1987). Anaerobic degradation of chlorinated aromatic hydrocarbons. J. Ind.Microbiol. Suppl., 117-127.
van Huyssteen, J. J. (1967). Gas chromatographic separation of anaerobic digester gases using porous polymers. Water Research,1,237-242.