remittances and institutions: are remittances a curse?
TRANSCRIPT
World Development Vol. 40, No. 4, pp. 657–666, 2012� 2011 Elsevier Ltd. All rights reserved.
0305-750X/$ - see front matter
www.elsevier.com/locate/worlddevdoi:10.1016/j.worlddev.2011.09.014
Remittances and Institutions: Are Remittances a Curse?
YASSER ABDIH, RALPH CHAMI and JIHAD DAGHERInternational Monetary Fund, Washington, DC, USA
and
PETER MONTIEL *
Williams College, Williamstown, USA
Summary. — This paper addresses the complex and overlooked relationship between the receipt of workers’ remittances and institu-tional quality in the recipient country. Using a simple model, we show how an increase in remittance inflows can lead to deteriorationof institutional quality—specifically, to an increase in the share of funds diverted by the government for its own purposes. In a crosssection of 111 countries we empirically verify this proposition and find that a higher ratio of remittances to GDP leads to lower indicesof control of corruption, government effectiveness, and rule of law, even after controlling for potential reverse causality.� 2011 Elsevier Ltd. All rights reserved.
Key words — remittances, institutions, corruption
* The authors would like to thank Leslie Lipschitz, Tom Cosimano,
Andrew Feltenstein, Connel Fullenkamp, Mike Gapen, and three ano-
nymous referees for valuable comments and suggestions. The authors
also would like to thank Ms. Yasmina Zinbi and Ms. Naseebah Hajjaj
for help in editing and formatting the paper. Final revision accepted:August 12, 2011.
1. INTRODUCTION
Inflows of workers’ remittances have been growing rapidlyin many developing countries at least since the early 1990s.With recent estimates putting remittance flows at $325 bil-lion, they now rival and even exceed other types of balanceof payments inflows that have traditionally received muchmore attention. Since 1998, these private income trans-fers—at least those flowing through official channels—havebeen second only to FDI flows, but several times larger thanremaining private capital inflows and official aid (WorldBank 2006; International Monetary Fund 2005, and Chamiet al., 2008).
There is now a substantial literature that documents the wel-fare-enhancing benefits of remittances for the recipients. Forexample, remittances are credited with reducing poverty, andtheir compensatory nature is responsible for minimizingconsumption volatility of transfer recipients (see, e.g., Chami,Fullenkamp, & Jahjah 2003; IMF, 2005; World Bank, 2006,among others). Researchers, however, have also recognizedthat these flows entail several development challenges, specifi-cally in terms of their effect on growth (see, e.g., Chami et al.,2003; IMF, 2005; WorldBank, 2006), and Dutch disease effects(Acosta, Lartey, & Mandelman, 2007, among others).
That resource inflows can pose development challenges haslong been familiar from the literature on the national resourcecurse. These challenges can emerge through several challenges.In addition to familiar Dutch disease effects, Sala-i-Martinand Subramanian (2003) show that these windfalls may reducethe quality of institutions and governance in countries withlarge resource endowments, with adverse effects on growth.The revenue from oil and minerals plays a buffer role betweengovernment and citizens: because the government can substi-tute these windfalls for taxes to finance a larger and less effi-cient public sector, the incentives for citizens to monitor andhold the government accountable are reduced. As a result,rent-seeking and corruption increase, reducing the quantityand quality of investment. Sala-i-Martin and Subramaniango on to argue that by disbursing the revenue from these
657
resources among the people, the adverse incentive effect ongovernment behavior may be mitigated.
In this paper, we test whether remittance flows also generateadverse effects on the quality of institutions in countries thatreceive these flows. To our knowledge, this is the first suchexercise measuring the impact of remittance flows on institu-tional quality.
Because remittance inflows differ from natural resource in-flows in several ways, at first glance one might not expect themto have similar adverse effects on institutional quality. Remit-tance flows are private income transfers that are not directlytaxed. As a result, they are neither mediated by the recipi-ent-country government nor directly generate resources forthat government. As household-to-household non-market pri-vate income transfers that are widely dispersed and usuallyallocated in small amounts, they seem ideally suited to complywith the Sala-i-Martin and Subramanian policy prescription.So one might indeed expect (as is argued in World Bank,2006) that remittances may escape or avoid the adverse effectsof oil windfalls on institutional quality.
We show, however, that despite these differences the pres-ence of these flows will nevertheless affect the incentives facedby the government, and may, therefore, have important im-pacts on the quality of domestic governance. We focus specif-ically on the government’s incentives to divert resources for itsown use or that of its favored constituents. For lack of a betterword, we will label this phenomenon generically as “corrup-tion,” though what we have in mind is much broader andcould encompass, for example, cronyism, populism, or othertypes of resource diversion. Remittance inflows may affectthe government’s incentives through either or both of two
658 WORLD DEVELOPMENT
channels. First, even when remittances are not taxed directly,their presence expands the base for other taxes (e.g., the VAT),thereby making it less costly for the government to appropri-ate resources for its own purposes. Second, the nontaxableexogenous resources that remittances provide for householdsmake it possible for them to finance the purchase of goods thatmay substitute for public services. In that case, access to remit-tance income makes government corruption less costly fordomestic households to bear, and consequently such corrup-tion is likely to increase.
In Section 2, we construct a simple model illustrating thesepoints. These insights motivate our empirical work. In Section3, we use standard cross-country regressions to explore the ef-fects of remittance inflows on institutional quality in the reci-pient countries, and conduct several robustness checks. We arewell aware that remittances could be endogenous to the pres-ence of corruption, or more broadly to the quality of domesticeconomic institutions in general, since it is quite plausible thatpoor domestic governance could lead to larger emigration,which itself could lead to increased remittances. We attemptto isolate the causality from remittances to corruption throughan instrumental variable approach. Our results point to a neg-ative and robust impact of remittances on the quality of gov-ernance in countries that receive these flows. Since theprescription advocated for resolving the dilemma of the im-pact of revenue from oil and minerals on government behav-ior—that is, by disbursing the revenue from such windfalls—does not transfer to the case of remittances, which are alreadydisbursed in this manner, in Section 4 we conclude by offeringalternative policy advice for countries that rely on these flows.
2. A SIMPLE MODEL: PUBLIC GOOD PROVISION INTHE PRESENCE OF NON-TAXABLE REMITTANCES
We begin by developing a simple model that outlines a plau-sible channel through which the presence of non-taxable pri-vate income transfers to households, such as remittances,can affect the quality of domestic governance. We use the term“government effectiveness” in this model to refer to the extentto which resources are devoted to increasing the welfare of arepresentative agent, rather than diverted for other purposessuch as furthering the wellbeing of the public-sector deci-sion-maker. Thus, the notion of effectiveness captured in ourmodel most naturally corresponds to government corruption,cronyism, or populism.
We assume that households choose consumption to maxi-mize their utility, while an intrinsically non-benevolent gov-ernment is interested in both its (financial) welfare as well asthat of the household. 1 For simplicity, the model has only 2goods. One is a private good that must be purchased by thehousehold, and the other a good that could be provided bythe government or purchased by the household. The sourceof funding for the latter, which we will refer to for simplicityas the “public service,” does not affect the marginal utility de-rived from its consumption. That is, whether provided by thegovernment or by the household, the good is of the same qual-ity. The intention is to capture the fact that many of the ser-vices that are provided by the public sector in recipientcountries can also be acquired privately. For example, house-holds can decide to buy education and health care services oreven security services on their own if the public provision of
these services is non-existent or is of poor quality. 2 In general,given the assumed uniformity of quality, households wouldprefer for the government to provide the public service as longas the increase in taxes due to this provision does not offset the
benefit they derive from these goods. For simplicity we assumeinitially that the tax rate is independent of the provision of thepublic service by the government. Our objective is to show inthis simple framework that an increase in these non-taxableprivate income transfers from abroad to households in thecountry of origin can impact the provision of public services.
(a) The representative agent problem
Households care about their consumption of the privategood as well as the public service. They take the governmentprovision of the latter to be exogenous, and choose their ownconsumption of the two types of goods, c and g, to maximize:
Uðc; g; �gÞ ¼ a logðcÞ þ ð1� aÞ logðg þ �gÞ ð1Þwhere c is the agent’s consumption of the private good, and gis the agent’s consumption of a good that is a perfect substi-tute for the public good, while �g is the level of governmentprovision of the public good. The agent’s budget constraintis the following:
ð1� tÞy þ R ¼ cþ g ð2Þwhere y is the agent’s income, t the tax rate, and R (whichstands for remittances) represents the foreign non-taxable pri-vate income transfers received from abroad. The assumptionthat remittances are non-taxed accords with the general situa-tion in recipient countries (see e.g., World Bank, 2006, amongothers).
Maximizing (1) subject to (2) yields:
g� ¼ ð1� aÞ½ð1� tÞy þ R� � a�g ð3ÞTherefore, taking the level of government provision of thepublic good as given, private purchases of the public goodare increasing in household disposable income (domestic andforeign) and decreasing in the government’s provision of thegood. This result is intuitive: when households prefer to keeprelatively constant the share of a good in their consumptionbasket, a higher endowment of a certain good (�g) will decreasethe demand for this good (g), everything else equal, and in-crease consumption of the other goods (c).
(b) The government’s problem
Our central assumption is that the government does not be-have like a central planner. In particular, suppose that the gov-ernment cares about maximizing a combination of therepresentative agent’s utility and its own utility, derived fromresources that the government reserves for itself. In that casethe government’s problem consists of maximizing:
Wð�g;UÞ ¼ b logðsÞ þ ð1� bÞUðc; g; �gÞ ð4Þwhere s stands for whatever the government keeps for its ownconsumption. The government chooses how much of the re-sources that it collects to divert for its own purposes. It, there-fore, chooses �g to maximize (4) subject to the budgetconstraint: 3
ty ¼ �g þ s ð5Þand the non-negativity constraint:
�g � 0
(c) Stackelberg game
Since the government knows the problem of the representa-tive agent and, therefore, the reaction of private agents to its
REMITTANCES AND INSTITUTIONS: ARE REMITTANCES A CURSE? 659
own spending decisions, it will take this reaction into accountin its optimization problem. However, since it is highly unli-kely that private agents could cooperate so as to be able toplay a Nash bargaining game with the government, it is mostnatural to assume that individual private agents take the gov-ernment’s provision of the public good as fixed and unaffectedby their actions. 4 Therefore, our model economy works as aStackelberg game where the government moves first. Underthis assumption, and replacing (3) and (2) in the objectivefunction of the government yields the following:
Wð�gÞ ¼ b logðty � �gÞ þ ð1� bÞfa log½aðð1� tÞy þ Rþ �gÞ�þ ð1� aÞ log½ð1� aÞðð1� tÞy þ Rþ �gÞ�g;
which simplifies to:
Wð�gÞ ¼ b logðty � �gÞ þ ð1� bÞ½a logðaÞþ ð1� aÞ logð1� aÞ þ logðð1� tÞy þ Rþ �gÞ� ð6Þ
The government’s problem is to maximize Wð�gÞ subject to thenonnegativity constraint on �g. Assuming an interior solution,the optimal government provision of the public good is givenby:
�g� ¼ ðt � bÞy � bR ð7ÞEqn. (7) provides our key result: the government’s provision ofthe public good is decreasing in the amount of (non-taxed)remittances. The intuition is the following: at the margin,remittances reduce the value that the representative householdplaces on an extra unit of the government-provided publicgood, because they increase the ability of the household tomeet its own needs. Consequently, the cost to the governmentof diverting resources for its own purposes is reduced and thegovernment does so, cutting back on its provision of the publicgood. 5 In addition, the substitutability between private andpublic provision of the good g, implies that an increase inthe tax base y does not fully translate into an increase in theprovision of the public good �g. Instead, part of that increasein revenue is diverted to the government’s own consumption.Note that a necessary condition for an interior solution is thatthe government’s incentive to divert resources, given by b, notbe excessively strong relative to the share of national incomethat the government can collect from households, t. If thiscondition is not satisfied, the government would provide nopublic goods, even in the absence of remittances.
Given this optimal level of spending on the public good, wecan easily derive the optimal level of resources diverted to thegovernment’s own consumption:
s� ¼ bðy þ RÞ ð8ÞNote that the amount diverted does not depend on the taxrate, but is increasing in both income and remittances. Theavailability of remittances increases the household’s privateconsumption of both goods (c, g), which allows the govern-ment to free ride and reduce its contribution to the publicgood, thereby increasing its own consumption.
It is also clear that the government’s proclivity to divert re-sources to its own consumption, measured by b, leaves thehousehold worse off in equilibrium. Substituting (3) and (7)into (1) we have:
@Uðc�; g�; �g�Þ@b
¼ � 1
ð1� bÞ < 0 ð9Þ
We can express the rate of resource diversion as a ratio eitherto total government spending or to total income. These ratiosare given, respectively, by:
s�
g�¼ by þ bRðt � bÞy � bR
¼b 1þ R
y
� �ðt � bÞ � b R
y
ð10Þ
�s�
y¼ b 1þ R
y
� �ð11Þ
As one can easily see:
@ðs�=yÞ@ðR=yÞ ¼ b > 0 and;
@ðs�=�g�Þ@ðR=yÞ ¼
bt
½ðt � bÞ � bðR=yÞ�2> 0
That is, both measures of resource diversion are increasing inthe level of remittances relative to GDP.
3. EVIDENCE
The model in Section 2 suggested a channel through whichremittances can increase the level of corruption in a country,even though they do not provide a direct source of revenuefor the government. We now turn to the data to see if the evi-dence is consistent with such an effect. We use a cross sectionof 111 countries, chosen on the basis of the availability of dataon workers’ remittances. Our remittance variable is measuredas the average ratio of worker remittance flows to GDP be-tween 1990 and 2000. It is enough for a country to have oneobservation on remittances during this period to be in oursample. A detailed description of the data and a listing of datasources are included in Appendix B, Tables 9 and 10.
(a) OLS results
To ensure that our results can be compared with those in theliterature that studies the determinants of government quality,we use the framework of the seminal work by La Porta, Lo-pez-de-Silanes, Shleifer, and Vishny (1999)—henceforthPLSV—and add our own regressors. Our main regressionmodel is, therefore, the following:
Corruption control2000 ¼ aþ b1 � economicþ b2 � religion
þ b3 � legalþ c1 � remittances
ð12ÞOur endogenous variable is taken from the World Bank gov-ernance indicators. It is a measure of control of corruption (in-versely related to the degree of corruption) in the year 2000.We regress this measure on average remittance receipts be-tween 1990 and 2000 while controlling for economic, religion,and legal variables, as in PLSV.
As a first step, we ignore all endogeneity issues stemmingfrom the inclusion of a measure of remittances on the righthand side of the regression.
The OLS results are shown in Table 1, Appendix A. In Col-umn (1) we simply regress the index of corruption control (de-noted Corrup) on remittance flows. We find a negative andsignificant coefficient, as suggested by our model. In column(2) we add a measure of energy depletion in the country. Itscoefficient turns out to be negative and statistically significant,consistent with the findings of many recent studies that oil-richcountries tend to have worse institutions on average (see Leite& Weidmann, 1999; Sala-i-Martin & Subramanian, 2003). Thecoefficient of remittances remains negative and significant. In-deed, this coefficient remains negative in all the specificationswe use in this paper. In columns (3) and (4) we add the regres-sors that La Porta et al. (1999) use in their regressions (Table 9in Appendix B provides a description of all the regressors used
Table 1. Corruption and remittances: OLS regressions
(1) (2) (3) (4)Corrup Corrup Corrup Corrup
Remit �0.0335* �0.0411** �0.0223* �0.0278**
(�1.95) (�2.14) (�1.69) (�2.06)
Energy_av �0.0260** �0.0332*** �0.0357***
(�2.12) (�3.55) (�3.80)
660 WORLD DEVELOPMENT
in this paper). We follow their approach by alternating thereligion and the legal variables as regressors, since they arecorrelated. 6 In column (3) we add the legal variables. Amongthese, only the dummy for Scandinavian laws is positive andsignificant, which is similar to the result in La Porta et al.(1999). The coefficients on remittances and energy remain neg-ative and significant in this specification as well as in column(4), where we replace the legal variables by variables that mea-sure the prevalence of certain religions in these countries. Sim-ilar to La Porta et al. (1999), we find a negative and significantcoefficient on both the variables “Muslim” and “Catholic”while the coefficient on “Other Denominations” is negative;however, unlike in La Porta et al., it is slightly insignificant.Note that the R2 improves dramatically in columns (3) and(4) when we add the legal or religion variables. 7
As in PLSV, we add to both specifications real GDP per ca-pita, whose coefficient we find to be positive and strongly sig-nificant. This captures the idea that richer countries tend todemand better institutions. We need to control for this mea-sure of well-being so that the coefficients on the other exoge-nous variables will only reflect the direct impact of thesefactors on corruption, rather than effects operating indirectlythrough per capita income. However, given the fact thatGDP per capita can be endogenous to institutions, its inclu-sion as a regressor needs further discussion, which we post-pone to the next section.
The major concern with the results from OLS regressions,however, and in particular with respect to the effects of remit-tance flows, is that remittances could be endogenous to thepresence of corruption, or more broadly to the quality ofdomestic economic institutions in general. It is very plausiblethat poorer institutions in a country could lead to higher emi-gration, which itself could lead to higher remittances. There-fore, we need to isolate the causality from remittances to ourmeasures of institutional quality from that operating in the re-verse direction. To do so, we require an instrument for remit-tances.
Rgdp_av 0.388*** 0.442***
(7.58) (8.87)Legal_UK 0.129
(0.54)Legal_FR �0.143
(�0.64)Legal_GE 0.293
(0.82)Legal_SC 1.076**
(2.42)Ethnic �0.00599 �0.00399
(�0.02) (�0.02)Catho �0.00895***
(�2.86)Muslim �0.00667**
(�2.10)Other_NP �0.00513
(�1.45)Constant �0.0211 0.0940 �2.754*** �2.489***
(�0.22) (0.88) (�6.48) (�4.47)R2 0.0345 0.0753 0.694 0.683
t Statistics in parentheses.OLS regressions: Table 1 shows the output from OLS regressions. Thedependent variable is a measure of control of corruption (inversely relatedto the degree of corruption) taken from the World Bank governanceindicators in year 2000. Remit, Energy_av and Rgdp_av are 1990–2000averages (see definitions in Table 9).
* p < 0.10.** p < 0.05.
*** p < 0.01.
(b) The coastal area as an instrument for remittances
To instrument properly for remittances we need a variablethat is correlated with remittance flows but not correlated withour endogenous variable (corruption), except through in-cluded regressors. The coastal area of a country (defined asthe ratio of the area within 100 km from a sea or an oceanto the total area of the country) appears to satisfy both crite-ria. 8 As we will discuss below, this variable is likely to affectinstitutional quality primarily through its effects on includedregressors such as per capita income. However, greater coastalarea is generally associated with a higher ratio of emigrants tothe total population, which for obvious reasons leads to higherremittances on average. Accordingly, coastal area appears apriori to be an appropriate instrument for remittances. In a la-ter section of the paper, we check for robustness and analyzethe exclusion restriction in more detail; for now, we showand discuss the instrumental variable regressions.
Table 2 shows the first stage regression for both specifica-tions (the legal variables and the religion variables, respec-tively). We find that the impact of the coastal area onremittances is large and highly significant. The F statistic onthe excluded instrument is equal to 7.59 in the first specifica-tion and 9.95 in the second, suggesting that our instrumentsdo not suffer from significant weakness 9. Columns (3) and(4) show the output from 2SLS second stage regressions. Inthe first specification we find a negative and significant coeffi-cient on remittances at the 10% level, while in the second
specification the significance level improves to 5%. The coeffi-cient is very similar across both specifications and implies aquantitatively meaningful relation. The results suggest in factthat an increase by one standard deviation in the ratio ofremittances to GDP results in a decline of around 0.56(�0.12�4.74) in the “control of corruption” variable, whichis around two thirds of a standard deviation in this variable.The Conditional Likelihood Ratio test proposed by Moreira(2003), which is robust to weak instruments, shows that thecoefficient on instrumented remittances is significant at the5% level 10.
One problem with our instrument is that it may be corre-lated with institutional quality through channels other thanremittance flows. In that case, coastal area would be a poorinstrument, because the instrumented remittance variablewould still be correlated with the disturbance term (unlessthese channels are explicitly accounted for in the regressions).Coastal area indeed tends to be correlated with variables thathave been found to affect institutional quality through their ef-fects on living standards, such as per capita real GDP itself anda variety of demographic variables that are highly correlatedwith per capita GDP. This is shown in Table 5 in AppendixA. While we did control for real GDP per capita, we did notcontrol for the other demographic variables. This raises thequestion of whether instrumenting for remittance flows withcoastal area while omitting these demographic variables fromthe regression may result in a biased estimate of the effects ofremittance flows on institutional quality. 11

REMITTANCES AND INSTITUTIONS: ARE REMITTANCES A CURSE? 661
To address this potential bias we need to control for the ef-fects of living standards on institutional quality. It is interest-ing to see that the coefficient on the instrumented remittancevariable is negative and statistically significant as long as wecontrol for either real GDP per capita itself or other variablesthat are correlated with it, such as dependency ratios, mortal-ity rates, and/or any combinations of such variables likely toaffect institutional quality and to be affected by our instru-ment. 12 In columns (3) and (4) of Table 3, for example, weshow the results from replacing per capita GDP by two demo-graphic variables, dependence and urbanization. We canclearly see that these 2SLS regressions with the coastal areaas instrument yield results similar to the ones in Table 2 col-umns (3) and (4).
But this procedure creates a second potential endogeneityproblem. Like remittances themselves, measures of living stan-dards such as per capita GDP are potentially endogenous withrespect to institutional quality. Although we used the initial le-vel of real GDP per capita in our estimation to mitigate thisproblem, since institutional quality is generally very persistentthe endogeneity of GDP might still be an issue. Accordingly,we also instrument for real per capita GDP by the distanceto the equator as in Treisman (2000). Columns (1) and (2) inTable 3 show the results of 2SLS estimation where we
Table 2. Corruption and remittances: benchmark instrumental variableregressions
(1) (2) (3) (4)Remit Remit Corrup Corrup
Coast 3.368** 3.615***
(2.08) (2.77)Rgdp_90 �1.138*** �1.026*** 0.343*** 0.378***
(�3.37) (�3.27) (4.02) (5.20)Legal_UK �0.670 0.310
(�0.26) (0.94)Legal_FR 0.0926 �0.0506
(0.04) (�0.14)Legal_GE �1.081 0.0996
(�0.42) (0.23)Legal_SC �0.907 0.874***
(�0.41) (2.70)Energy_av 0.0546 0.0472 �0.0349** �0.0368**
(1.48) (1.04) (�2.42) (�2.14)Ethnic �5.444*** �5.611*** �0.663 �0.638
(�2.67) (�2.90) (�1.11) (�1.29)Catho 0.00907 �0.0111***
(0.68) (�3.29)Muslim 0.0312 �0.00677
(1.41) (�1.54)Other_NP 0.00229 �0.00681*
(0.12) (�1.85)Remit �0.129* �0.120**
(�1.81) (�2.02)
Constant 11.32*** 9.126*** �2.004** �1.426*
(2.96) (2.76) (�2.35) (�1.85)R2 0.274 0.312 0.591 0.621
t Statistics in parentheses.2SLS regressions: The first two columns show the results from the firststage regression for both specifications. The third and fourth columnsshow the results from the second stage for both specifications. Note thatRgdp_90 is the real per capital GDP in 1990.
* p < 0.10.** p < 0.05.
*** p < 0.01.
instrument for both remittances and real per capita GDP withcoastal area and distance to the equator as instruments. Thecoefficient on remittances remains negative and significant inthese regressions.
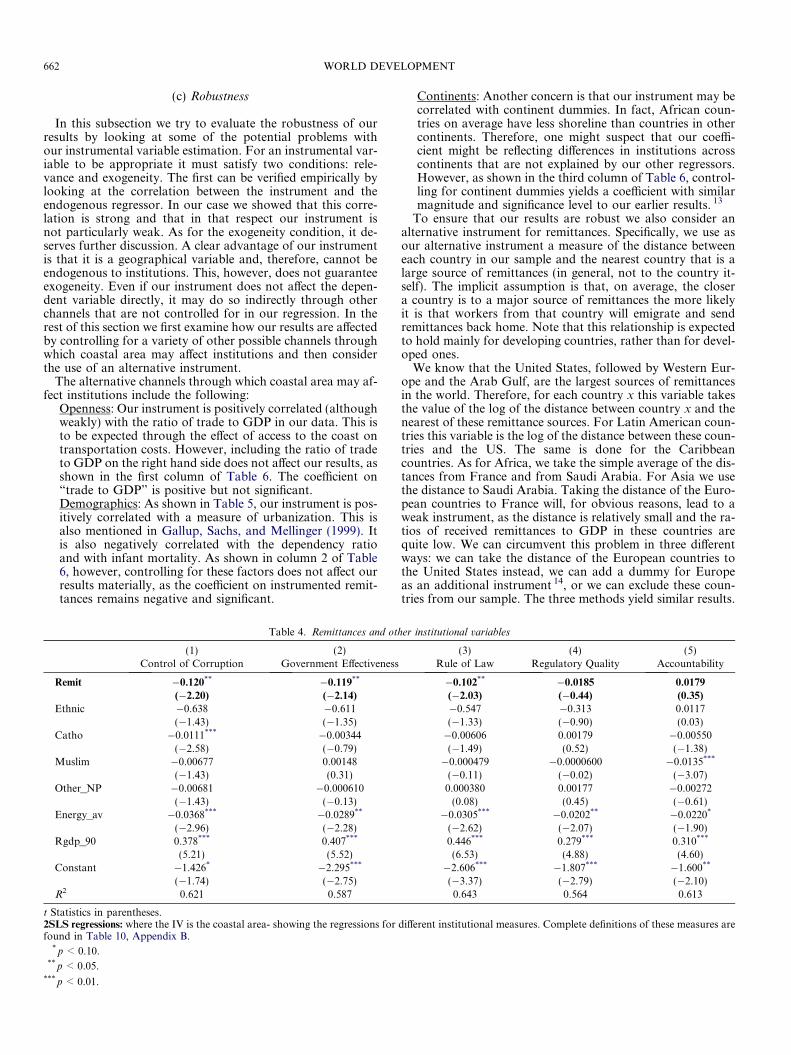
Table 4 shows the result of the 2SLS regressions of Table 2when we vary the endogenous regressors to look at other indi-cators of institutional quality. We only show the specificationwith the religion variables since the results obtained using theother specifications are very similar. It is interesting to see thatremittances affect the three variables that are most related tocorruption and government quality. We find a negative andsignificant coefficient on remittances (instrumented by thecoastal area) in the regressions where the control of corrup-tion, government effectiveness, and the rule of law measuresare the dependent variables. As one would expect, these threeendogenous variables are highly correlated in our sample. Asfor regulatory quality and voice and accountability, they seemunaffected by remittances. This in itself is interesting since itsuggests that only specific aspects of domestic institutionalquality—those associated with the diversion of resources bythe public sector—tend to be affected by the receipt of remit-tance flows.
Table 3. Variations on the benchmark instrumental variable regressions
(1) (2) (3) (4)Corrup Corrup Corrup Corrup
Remit �0.161** �0.227* �0.103** �0.106**
(�2.29) (�1.84) (�2.06) (�2.07)
Rgdp_90 0.540*** 0.621***
(4.74) (3.50)Ethnic �0.405 �0.376 �0.459 �0.560
(�0.75) (�0.49) (�1.19) (�1.48)Catho �0.00763 �0.0156***
(�1.39) (�3.60)Muslim �0.000408 �0.0157***
(�0.06) (�3.45)Other_NP �0.00167 �0.0154***
(�0.27) (�3.06)Energy_av �0.0396*** �0.0418** �0.0298** �0.0286**
(�2.63) (�2.06) (�2.27) (�2.18)Legal_UK 0.297 0.430
(0.61) (1.43)Legal_FR �0.163 0.115
(�0.35) (0.40)Legal_GE �0.953 0.598
(�1.06) (1.42)Legal_SC �0.238 1.603***
(�0.23) (3.11)Dependence �2.442*** �1.934***
(�3.64) (�2.94)Urban 0.00301 0.00598
(0.60) (1.20)Constant �3.010** �3.712*** 3.467*** 1.328**
(�2.48) (�2.64) (4.42) (1.99)R2 0.447 0.0255 0.630 0.634
t Statistics in parentheses.2SLS regressions (variations): Columns (1) and (2) show the 2SLSregressions where the coastal area and distance to the equator are used asinstruments to real per capita GDP and remittances.Columns (3) and (4) show the 2SLS regressions where dependence andurbanization are on the right hand side, and the coastal area used as aninstrument for remittances.
* p < 0.10.** p < 0.05.
*** p < 0.01.
662 WORLD DEVELOPMENT
(c) Robustness
In this subsection we try to evaluate the robustness of ourresults by looking at some of the potential problems withour instrumental variable estimation. For an instrumental var-iable to be appropriate it must satisfy two conditions: rele-vance and exogeneity. The first can be verified empirically bylooking at the correlation between the instrument and theendogenous regressor. In our case we showed that this corre-lation is strong and that in that respect our instrument isnot particularly weak. As for the exogeneity condition, it de-serves further discussion. A clear advantage of our instrumentis that it is a geographical variable and, therefore, cannot beendogenous to institutions. This, however, does not guaranteeexogeneity. Even if our instrument does not affect the depen-dent variable directly, it may do so indirectly through otherchannels that are not controlled for in our regression. In therest of this section we first examine how our results are affectedby controlling for a variety of other possible channels throughwhich coastal area may affect institutions and then considerthe use of an alternative instrument.
The alternative channels through which coastal area may af-fect institutions include the following:
Openness: Our instrument is positively correlated (althoughweakly) with the ratio of trade to GDP in our data. This isto be expected through the effect of access to the coast ontransportation costs. However, including the ratio of tradeto GDP on the right hand side does not affect our results, asshown in the first column of Table 6. The coefficient on“trade to GDP” is positive but not significant.Demographics: As shown in Table 5, our instrument is pos-itively correlated with a measure of urbanization. This isalso mentioned in Gallup, Sachs, and Mellinger (1999). Itis also negatively correlated with the dependency ratioand with infant mortality. As shown in column 2 of Table6, however, controlling for these factors does not affect ourresults materially, as the coefficient on instrumented remit-tances remains negative and significant.
Table 4. Remittances and oth
(1) (2)Control of Corruption Government Effectiveness
Remit �0.120** �0.119**
(�2.20) (�2.14)
Ethnic �0.638 �0.611(�1.43) (�1.35)
Catho �0.0111*** �0.00344(�2.58) (�0.79)
Muslim �0.00677 0.00148(�1.43) (0.31)
Other_NP �0.00681 �0.000610(�1.43) (�0.13)
Energy_av �0.0368*** �0.0289**
(�2.96) (�2.28)Rgdp_90 0.378*** 0.407***
(5.21) (5.52)Constant �1.426* �2.295***
(�1.74) (�2.75)R2 0.621 0.587
t Statistics in parentheses.2SLS regressions: where the IV is the coastal area- showing the regressions forfound in Table 10, Appendix B.
* p < 0.10.** p < 0.05.
*** p < 0.01.
Continents: Another concern is that our instrument may becorrelated with continent dummies. In fact, African coun-tries on average have less shoreline than countries in othercontinents. Therefore, one might suspect that our coeffi-cient might be reflecting differences in institutions acrosscontinents that are not explained by our other regressors.However, as shown in the third column of Table 6, control-ling for continent dummies yields a coefficient with similarmagnitude and significance level to our earlier results. 13
To ensure that our results are robust we also consider analternative instrument for remittances. Specifically, we use asour alternative instrument a measure of the distance betweeneach country in our sample and the nearest country that is alarge source of remittances (in general, not to the country it-self). The implicit assumption is that, on average, the closera country is to a major source of remittances the more likelyit is that workers from that country will emigrate and sendremittances back home. Note that this relationship is expectedto hold mainly for developing countries, rather than for devel-oped ones.
We know that the United States, followed by Western Eur-ope and the Arab Gulf, are the largest sources of remittancesin the world. Therefore, for each country x this variable takesthe value of the log of the distance between country x and thenearest of these remittance sources. For Latin American coun-tries this variable is the log of the distance between these coun-tries and the US. The same is done for the Caribbeancountries. As for Africa, we take the simple average of the dis-tances from France and from Saudi Arabia. For Asia we usethe distance to Saudi Arabia. Taking the distance of the Euro-pean countries to France will, for obvious reasons, lead to aweak instrument, as the distance is relatively small and the ra-tios of received remittances to GDP in these countries arequite low. We can circumvent this problem in three differentways: we can take the distance of the European countries tothe United States instead, we can add a dummy for Europeas an additional instrument 14, or we can exclude these coun-tries from our sample. The three methods yield similar results.
er institutional variables
(3) (4) (5)Rule of Law Regulatory Quality Accountability
�0.102** �0.0185 0.0179
(�2.03) (�0.44) (0.35)
�0.547 �0.313 0.0117(�1.33) (�0.90) (0.03)�0.00606 0.00179 �0.00550(�1.49) (0.52) (�1.38)�0.000479 �0.0000600 �0.0135***
(�0.11) (�0.02) (�3.07)0.000380 0.00177 �0.00272
(0.08) (0.45) (�0.61)�0.0305*** �0.0202** �0.0220*
(�2.62) (�2.07) (�1.90)0.446*** 0.279*** 0.310***
(6.53) (4.88) (4.60)�2.606*** �1.807*** �1.600**
(�3.37) (�2.79) (�2.10)0.643 0.564 0.613
different institutional measures. Complete definitions of these measures are
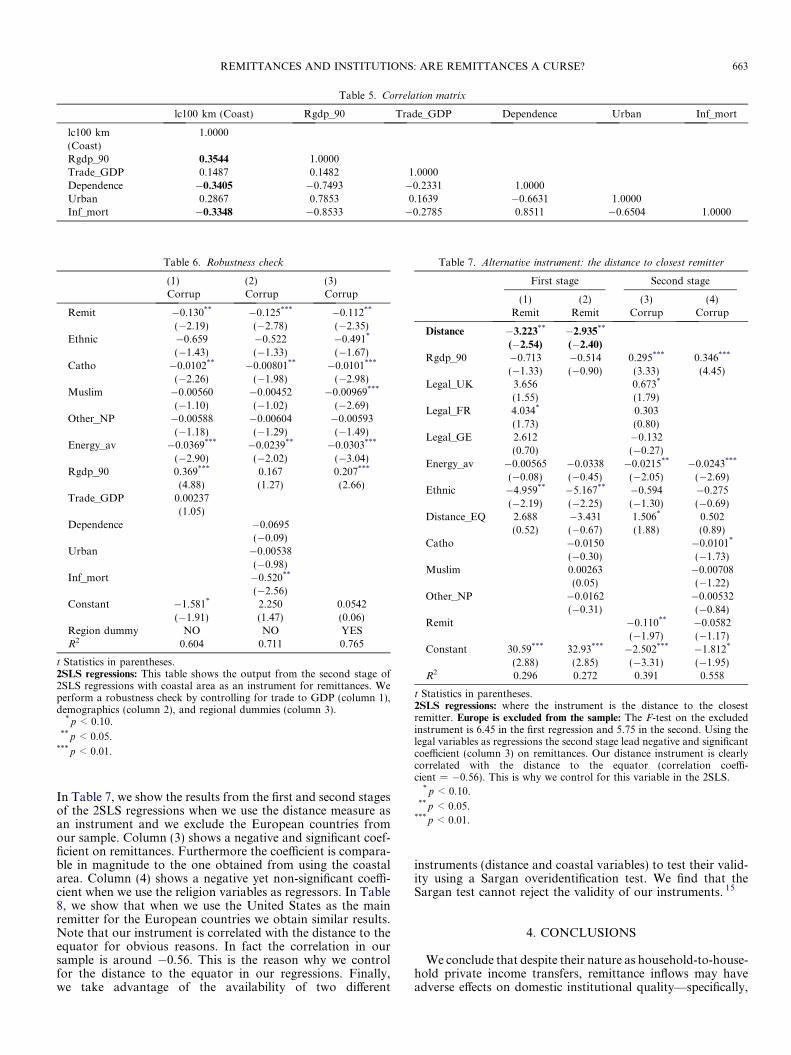
Table 5. Correlation matrix
lc100 km (Coast) Rgdp_90 Trade_GDP Dependence Urban Inf_mort
lc100 km(Coast)
1.0000
Rgdp_90 0.3544 1.0000Trade_GDP 0.1487 0.1482 1.0000Dependence �0.3405 �0.7493 �0.2331 1.0000Urban 0.2867 0.7853 0.1639 �0.6631 1.0000Inf_mort �0.3348 �0.8533 �0.2785 0.8511 �0.6504 1.0000
Table 6. Robustness check
(1) (2) (3)Corrup Corrup Corrup
Remit �0.130** �0.125*** �0.112**
(�2.19) (�2.78) (�2.35)Ethnic �0.659 �0.522 �0.491*
(�1.43) (�1.33) (�1.67)Catho �0.0102** �0.00801** �0.0101***
(�2.26) (�1.98) (�2.98)Muslim �0.00560 �0.00452 �0.00969***
(�1.10) (�1.02) (�2.69)Other_NP �0.00588 �0.00604 �0.00593
(�1.18) (�1.29) (�1.49)Energy_av �0.0369*** �0.0239** �0.0303***
(�2.90) (�2.02) (�3.04)Rgdp_90 0.369*** 0.167 0.207***
(4.88) (1.27) (2.66)Trade_GDP 0.00237
(1.05)Dependence �0.0695
(�0.09)Urban �0.00538
(�0.98)Inf_mort �0.520**
(�2.56)Constant �1.581* 2.250 0.0542
(�1.91) (1.47) (0.06)Region dummy NO NO YESR2 0.604 0.711 0.765
t Statistics in parentheses.2SLS regressions: This table shows the output from the second stage of2SLS regressions with coastal area as an instrument for remittances. Weperform a robustness check by controlling for trade to GDP (column 1),demographics (column 2), and regional dummies (column 3).
* p < 0.10.** p < 0.05.
*** p < 0.01.
Table 7. Alternative instrument: the distance to closest remitter
First stage Second stage
(1) (2) (3) (4)Remit Remit Corrup Corrup
Distance �3.223** �2.935**
(�2.54) (�2.40)
Rgdp_90 �0.713 �0.514 0.295*** 0.346***
(�1.33) (�0.90) (3.33) (4.45)Legal_UK 3.656 0.673*
(1.55) (1.79)Legal_FR 4.034* 0.303
(1.73) (0.80)Legal_GE 2.612 �0.132
(0.70) (�0.27)Energy_av �0.00565 �0.0338 �0.0215** �0.0243***
(�0.08) (�0.45) (�2.05) (�2.69)Ethnic �4.959** �5.167** �0.594 �0.275
(�2.19) (�2.25) (�1.30) (�0.69)Distance_EQ 2.688 �3.431 1.506* 0.502
(0.52) (�0.67) (1.88) (0.89)Catho �0.0150 �0.0101*
(�0.30) (�1.73)Muslim 0.00263 �0.00708
(0.05) (�1.22)Other_NP �0.0162 �0.00532
(�0.31) (�0.84)Remit �0.110** �0.0582
(�1.97) (�1.17)Constant 30.59*** 32.93*** �2.502*** �1.812*
(2.88) (2.85) (�3.31) (�1.95)R2 0.296 0.272 0.391 0.558
t Statistics in parentheses.2SLS regressions: where the instrument is the distance to the closestremitter. Europe is excluded from the sample: The F-test on the excludedinstrument is 6.45 in the first regression and 5.75 in the second. Using thelegal variables as regressions the second stage lead negative and significantcoefficient (column 3) on remittances. Our distance instrument is clearlycorrelated with the distance to the equator (correlation coeffi-cient = �0.56). This is why we control for this variable in the 2SLS.
* p < 0.10.** p < 0.05.
*** p < 0.01.
REMITTANCES AND INSTITUTIONS: ARE REMITTANCES A CURSE? 663
In Table 7, we show the results from the first and second stagesof the 2SLS regressions when we use the distance measure asan instrument and we exclude the European countries fromour sample. Column (3) shows a negative and significant coef-ficient on remittances. Furthermore the coefficient is compara-ble in magnitude to the one obtained from using the coastalarea. Column (4) shows a negative yet non-significant coeffi-cient when we use the religion variables as regressors. In Table8, we show that when we use the United States as the mainremitter for the European countries we obtain similar results.Note that our instrument is correlated with the distance to theequator for obvious reasons. In fact the correlation in oursample is around �0.56. This is the reason why we controlfor the distance to the equator in our regressions. Finally,we take advantage of the availability of two different
instruments (distance and coastal variables) to test their valid-ity using a Sargan overidentification test. We find that theSargan test cannot reject the validity of our instruments. 15
4. CONCLUSIONS
We conclude that despite their nature as household-to-house-hold private income transfers, remittance inflows may haveadverse effects on domestic institutional quality—specifically,
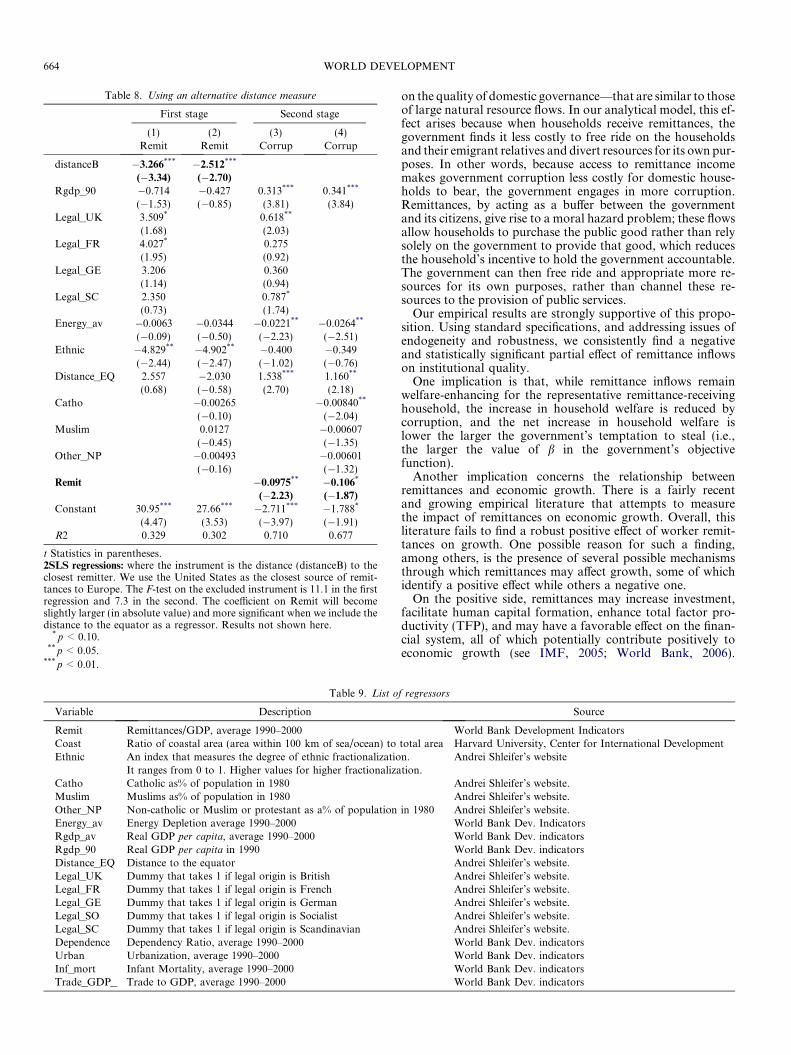
Table 8. Using an alternative distance measure
First stage Second stage
(1) (2) (3) (4)Remit Remit Corrup Corrup
distanceB �3.266*** �2.512***
(�3.34) (�2.70)
Rgdp_90 �0.714 �0.427 0.313*** 0.341***
(�1.53) (�0.85) (3.81) (3.84)Legal_UK 3.509* 0.618**
(1.68) (2.03)Legal_FR 4.027* 0.275
(1.95) (0.92)Legal_GE 3.206 0.360
(1.14) (0.94)Legal_SC 2.350 0.787*
(0.73) (1.74)Energy_av �0.0063 �0.0344 �0.0221** �0.0264**
(�0.09) (�0.50) (�2.23) (�2.51)Ethnic �4.829** �4.902** �0.400 �0.349
(�2.44) (�2.47) (�1.02) (�0.76)Distance_EQ 2.557 �2.030 1.538*** 1.160**
(0.68) (�0.58) (2.70) (2.18)Catho �0.00265 �0.00840**
(�0.10) (�2.04)Muslim 0.0127 �0.00607
(�0.45) (�1.35)Other_NP �0.00493 �0.00601
(�0.16) (�1.32)Remit �0.0975** �0.106*
(�2.23) (�1.87)
Constant 30.95*** 27.66*** �2.711*** �1.788*
(4.47) (3.53) (�3.97) (�1.91)R2 0.329 0.302 0.710 0.677
t Statistics in parentheses.2SLS regressions: where the instrument is the distance (distanceB) to theclosest remitter. We use the United States as the closest source of remit-tances to Europe. The F-test on the excluded instrument is 11.1 in the firstregression and 7.3 in the second. The coefficient on Remit will becomeslightly larger (in absolute value) and more significant when we include thedistance to the equator as a regressor. Results not shown here.
* p < 0.10.** p < 0.05.
*** p < 0.01.
Table 9. List o
Variable Description
Remit Remittances/GDP, average 1990–2000Coast Ratio of coastal area (area within 100 km of sea/ocean) toEthnic An index that measures the degree of ethnic fractionalizatio
It ranges from 0 to 1. Higher values for higher fractionalizaCatho Catholic as% of population in 1980Muslim Muslims as% of population in 1980Other_NP Non-catholic or Muslim or protestant as a% of populationEnergy_av Energy Depletion average 1990–2000Rgdp_av Real GDP per capita, average 1990–2000Rgdp_90 Real GDP per capita in 1990Distance_EQ Distance to the equatorLegal_UK Dummy that takes 1 if legal origin is BritishLegal_FR Dummy that takes 1 if legal origin is FrenchLegal_GE Dummy that takes 1 if legal origin is GermanLegal_SO Dummy that takes 1 if legal origin is SocialistLegal_SC Dummy that takes 1 if legal origin is ScandinavianDependence Dependency Ratio, average 1990–2000Urban Urbanization, average 1990–2000Inf_mort Infant Mortality, average 1990–2000Trade_GDP_ Trade to GDP, average 1990–2000
664 WORLD DEVELOPMENT
on the quality of domestic governance—that are similar to thoseof large natural resource flows. In our analytical model, this ef-fect arises because when households receive remittances, thegovernment finds it less costly to free ride on the householdsand their emigrant relatives and divert resources for its own pur-poses. In other words, because access to remittance incomemakes government corruption less costly for domestic house-holds to bear, the government engages in more corruption.Remittances, by acting as a buffer between the governmentand its citizens, give rise to a moral hazard problem; these flowsallow households to purchase the public good rather than relysolely on the government to provide that good, which reducesthe household’s incentive to hold the government accountable.The government can then free ride and appropriate more re-sources for its own purposes, rather than channel these re-sources to the provision of public services.
Our empirical results are strongly supportive of this propo-sition. Using standard specifications, and addressing issues ofendogeneity and robustness, we consistently find a negativeand statistically significant partial effect of remittance inflowson institutional quality.
One implication is that, while remittance inflows remainwelfare-enhancing for the representative remittance-receivinghousehold, the increase in household welfare is reduced bycorruption, and the net increase in household welfare islower the larger the government’s temptation to steal (i.e.,the larger the value of b in the government’s objectivefunction).
Another implication concerns the relationship betweenremittances and economic growth. There is a fairly recentand growing empirical literature that attempts to measurethe impact of remittances on economic growth. Overall, thisliterature fails to find a robust positive effect of worker remit-tances on growth. One possible reason for such a finding,among others, is the presence of several possible mechanismsthrough which remittances may affect growth, some of whichidentify a positive effect while others a negative one.
On the positive side, remittances may increase investment,facilitate human capital formation, enhance total factor pro-ductivity (TFP), and may have a favorable effect on the finan-cial system, all of which potentially contribute positively toeconomic growth (see IMF, 2005; World Bank, 2006).
f regressors
Source
World Bank Development Indicatorstotal area Harvard University, Center for International Developmentn.tion.
Andrei Shleifer’s website
Andrei Shleifer’s website.Andrei Shleifer’s website.
in 1980 Andrei Shleifer’s website.World Bank Dev. IndicatorsWorld Bank Dev. indicatorsWorld Bank Dev. indicatorsAndrei Shleifer’s website.Andrei Shleifer’s website.Andrei Shleifer’s website.Andrei Shleifer’s website.Andrei Shleifer’s website.Andrei Shleifer’s website.World Bank Dev. indicatorsWorld Bank Dev. indicatorsWorld Bank Dev. indicatorsWorld Bank Dev. indicators
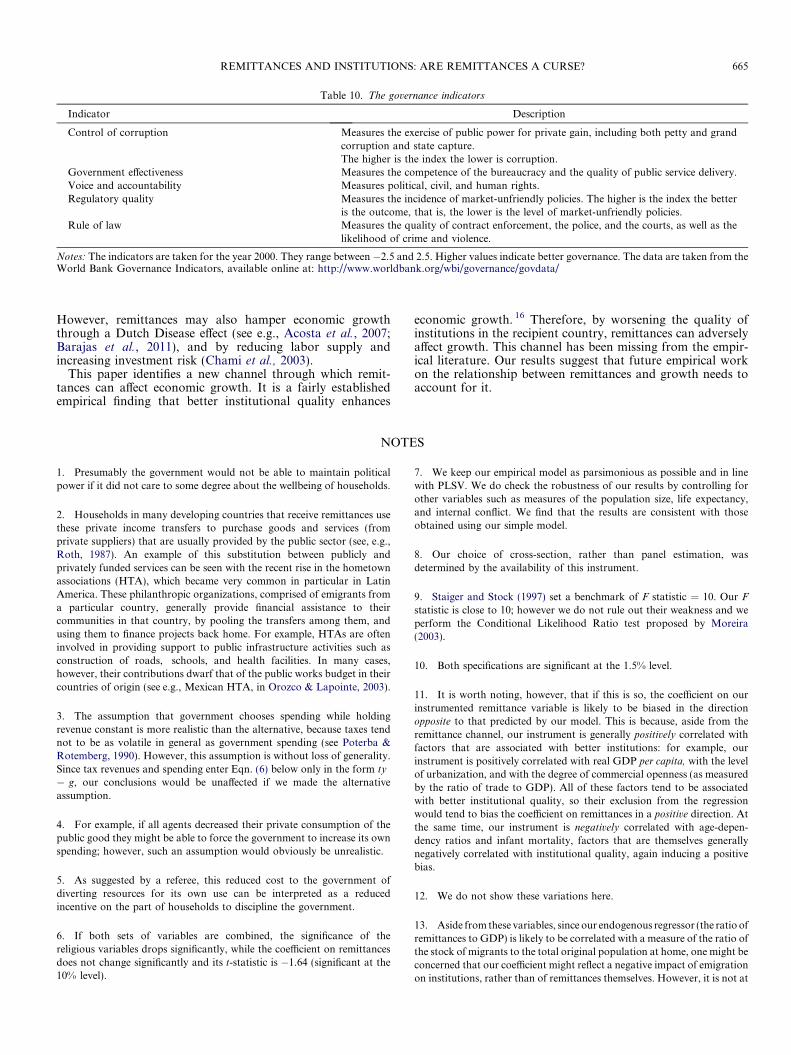
Table 10. The governance indicators
Indicator Description
Control of corruption Measures the exercise of public power for private gain, including both petty and grandcorruption and state capture.The higher is the index the lower is corruption.
Government effectiveness Measures the competence of the bureaucracy and the quality of public service delivery.Voice and accountability Measures political, civil, and human rights.Regulatory quality Measures the incidence of market-unfriendly policies. The higher is the index the better
is the outcome, that is, the lower is the level of market-unfriendly policies.Rule of law Measures the quality of contract enforcement, the police, and the courts, as well as the
likelihood of crime and violence.
Notes: The indicators are taken for the year 2000. They range between �2.5 and 2.5. Higher values indicate better governance. The data are taken from theWorld Bank Governance Indicators, available online at: http://www.worldbank.org/wbi/governance/govdata/
REMITTANCES AND INSTITUTIONS: ARE REMITTANCES A CURSE? 665
However, remittances may also hamper economic growththrough a Dutch Disease effect (see e.g., Acosta et al., 2007;Barajas et al., 2011), and by reducing labor supply andincreasing investment risk (Chami et al., 2003).
This paper identifies a new channel through which remit-tances can affect economic growth. It is a fairly establishedempirical finding that better institutional quality enhances
economic growth. 16 Therefore, by worsening the quality ofinstitutions in the recipient country, remittances can adverselyaffect growth. This channel has been missing from the empir-ical literature. Our results suggest that future empirical workon the relationship between remittances and growth needs toaccount for it.
NOTES
1. Presumably the government would not be able to maintain politicalpower if it did not care to some degree about the wellbeing of households.
2. Households in many developing countries that receive remittances usethese private income transfers to purchase goods and services (fromprivate suppliers) that are usually provided by the public sector (see, e.g.,Roth, 1987). An example of this substitution between publicly andprivately funded services can be seen with the recent rise in the hometownassociations (HTA), which became very common in particular in LatinAmerica. These philanthropic organizations, comprised of emigrants froma particular country, generally provide financial assistance to theircommunities in that country, by pooling the transfers among them, andusing them to finance projects back home. For example, HTAs are ofteninvolved in providing support to public infrastructure activities such asconstruction of roads, schools, and health facilities. In many cases,however, their contributions dwarf that of the public works budget in theircountries of origin (see e.g., Mexican HTA, in Orozco & Lapointe, 2003).
3. The assumption that government chooses spending while holdingrevenue constant is more realistic than the alternative, because taxes tendnot to be as volatile in general as government spending (see Poterba &Rotemberg, 1990). However, this assumption is without loss of generality.Since tax revenues and spending enter Eqn. (6) below only in the form ty
� g, our conclusions would be unaffected if we made the alternativeassumption.
4. For example, if all agents decreased their private consumption of thepublic good they might be able to force the government to increase its ownspending; however, such an assumption would obviously be unrealistic.
5. As suggested by a referee, this reduced cost to the government ofdiverting resources for its own use can be interpreted as a reducedincentive on the part of households to discipline the government.
6. If both sets of variables are combined, the significance of thereligious variables drops significantly, while the coefficient on remittancesdoes not change significantly and its t-statistic is �1.64 (significant at the10% level).
7. We keep our empirical model as parsimonious as possible and in linewith PLSV. We do check the robustness of our results by controlling forother variables such as measures of the population size, life expectancy,and internal conflict. We find that the results are consistent with thoseobtained using our simple model.
8. Our choice of cross-section, rather than panel estimation, wasdetermined by the availability of this instrument.
9. Staiger and Stock (1997) set a benchmark of F statistic = 10. Our F
statistic is close to 10; however we do not rule out their weakness and weperform the Conditional Likelihood Ratio test proposed by Moreira(2003).
10. Both specifications are significant at the 1.5% level.
11. It is worth noting, however, that if this is so, the coefficient on ourinstrumented remittance variable is likely to be biased in the directionopposite to that predicted by our model. This is because, aside from theremittance channel, our instrument is generally positively correlated withfactors that are associated with better institutions: for example, ourinstrument is positively correlated with real GDP per capita, with the levelof urbanization, and with the degree of commercial openness (as measuredby the ratio of trade to GDP). All of these factors tend to be associatedwith better institutional quality, so their exclusion from the regressionwould tend to bias the coefficient on remittances in a positive direction. Atthe same time, our instrument is negatively correlated with age-depen-dency ratios and infant mortality, factors that are themselves generallynegatively correlated with institutional quality, again inducing a positivebias.
12. We do not show these variations here.
13. Aside from these variables, since our endogenous regressor (the ratio ofremittances to GDP) is likely to be correlated with a measure of the ratio ofthe stock of migrants to the total original population at home, one might beconcerned that our coefficient might reflect a negative impact of emigrationon institutions, rather than of remittances themselves. However, it is not at
666 WORLD DEVELOPMENT
all clear that the effect of emigration on domestic institutions should beexpected to be negative. Indeed, recent literature sees emigration aspotentially beneficial to the home country. Specifically, authors such asMountford (1997) and Beine, Docquier, and Rapoport (2003), argue thatthe possibility of emigration raises the expected return on education athome, and thus is likely to increase investment in education, which haspositive effects on productivity and growth.Beine, Docquier, and Rapoport(2003) found a positive and highly significant effect of migration prospectson gross human capital formation. The increased stock of human capital inthe home country may on average have a positive effect on institutions. Eventhe older literature on migration such as Grubel and Scott (1966)acknowledges that the short-term loss to the original country might be welloffset in the long run due to spillovers and network effects.
14. This option might not be appropriate since this dummy might affectdirectly institutions even after controlling for GDP and other religious andlegal variables.
15. The p-value from the Sargan test varies between 0.25 and 0.66depending on the regression and the distance measure used (results notshown).
16. See, for example, Hall and Jones (1999), Knack and Keefer (1995),Mauro (1995a, 1995b), Acemoglu, Johnson, and Robinson (2002),Easterly and Levine (2003), and Dollar and Kraay (2003).
REFERENCES
Acemoglu, D., Johnson, S., & Robinson, J. A. (2002). Reversal of fortune:Geography and institutions in the making of the modern world incomedistribution. Quarterly Journal of Economics, (107), 1231–1294.
Acosta, P. A., Lartey, E., & Mandelman, E. (2007). Remittances and theDutch Disease. Federal Reserve Bank of Atlanta Working Paper,2007-08.
Barajas, Adolfo, Ralph Chami, Dalia Hakura, Peter J., & Montiel (2011).Worker remittances and the equilibrium real exchange rate: Theoryand evidence, Economia, (11), 45-94.
Beine, M., Docquier, F., & Rapoport, H. (2003). Brain Drain and Growthin LDCs: Winners and Losers. IZA Discussion paper. IZA Bonn.
Chami, R., Fullenkamp, C., & Jahjah, S. (2003). Are ImmigrantRemittance Flows a Source of Capital for Development? IMFWorking Papers (03/189). Washington: International Monetary Fund.
Chami, R., Barajas, A., Cosimano, T., Fullenkamp, C., Gapen, M., &Montiel, P., 2008. Macroeconomic Consequences of Remittances.IMF Occasional Paper. Washington: International Monetary Fund.
Dollar, D., & Kraay, A. (2003). Institutions, trade, and growth. Journal ofMonetary Economics, (50), 133–162.
Easterly, W., & Levine, R. (2003). Tropics, germs, and crops: Howendowments influence economic development. Journal of MonetaryEconomics, (50), 3–39.
Gallup, J.L., Sachs, J., & Mellinger, A. (1999). Geography and EconomicDevelopment, World Bank Annual Conference on Economic Devel-opment.
Grubel, H. G., & Scott, A. (1966). The international flow of humancapital. American Economic Review, (56), 268–274.
Hall, R. E., & Jones, C. I. (1999). Why do some countries produce somuch more output per worker than others?. The Quarterly Journal ofEconomics, (114), 83–116.
International Monetary Fund, (2005). World Economic Outlook, April2005: Globalization and External Imbalances, World Economic andFinancial Surveys. Washington.
Knack, S., & Keefer, P. (1995). Institutions and economic performance:Cross-country tests using alternative institutional measures. Economics& Politics, 7(3), 207–227.
La Porta, R., Lopez-de-Silanes, F., Shleifer, A., & Vishny, R. W. (1999).The quality of government. The Journal of Law, Economics andOrganization, (15), 222–279.
Leite, C., & Weidmann, M. (1999). Does Mother Nature Corrupt?Natural Resources, Corruption and Economic Growth. IMF Workingpaper (WP/99/85). Washington: International Monetary Fund.
Mauro, P. (1995a). Corruption and the composition of governmentexpenditure. Journal of Public Economics, (69), 263–279.
Mauro, P. (1995b). Corruption and growth. The Quarterly Journal ofEconomics, 110(3), 681–712.
Moreira, M. (2003). A conditional likelihood ratio test for structuralmodels. Econometrica, 71(4), 1027–1048.
Mountford, A. (1997). Can a brain drain be good for growth in the sourceeconomy?. Journal of Development Economics, 53(2), 287–303.
Orozco, M., & Lapointe, M. (2003). Mexican Hometown Associationsand Their Development Opportunities. Inter-American DialogueResearch Paper Series, September.
Poterba, J. M., & Rotemberg, J. J. (1990). Inflation and taxation withoptimizing governments. Journal of Money, Credit & Banking, (22),1–18.
Roth, G. (1987). The private provision of public services in developingcountries. New York: Oxford University Press for the World Bank.
Sala-i-Martin, X., & Subramanian, A. (2003). Addressing the NaturalResource Curse: An Illustration from Nigeria. IMF Working Paper(WP/03/139). Washington: International Monetary Fund.
Staiger, D., & Stock, J. (1997). Instrumental variables regression withweak instruments. Econometrica, 65(3), 557–586.
Treisman, Daniel (2000). The causes of corruption: A cross-nationalstudy. Journal of Public Economics, (76), 399–457.
World Bank (2006). Global economic prospects: Economic implications ofremittances and migration. Washington: The World Bank.
APPENDIX A
See Tables 1–8.
APPENDIX B
See Tables 9 and 10.