remittances and educational attainment: evidence from tajikistan€¦ · remittances and...
TRANSCRIPT
Bayerische Julius-Maximilians-Universität Würzburg
Wirtschaftswissenschaftliche Fakultät
Remittances and Educational Attainment:
Evidence from Tajikistan
Sebastian Köllner
Wirtschaftswissenschaftliche Beiträge des Lehrstuhls für Volkswirtschaftslehre,
insbes. Wirtschaftsordnung und Sozialpolitik Prof. Dr. Norbert Berthold
Nr. 124
2013
Sanderring 2 • D-97070 Würzburg

Remittances and Educational Attainment: Evidence from Tajikistan
Sebastian Köllner
Bayerische Julius-Maximilians-Universität Würzburg
Lehrstuhl für Volkswirtschaftslehre, insbes. Wirtschaftsordnung und Sozialpolitik
Sanderring 2
D-97070 Würzburg
Tel.: 0931-31-86568
Fax: 0931-31-82774
Email:
Remittances and Educational Attainment: Evidence from Tajikistan
Sebastian Köllner
Abstract
This paper examines the impact of remittances on educational attainment in Tajikistan using
the Tajikistan Living Standards Measurement Survey (TLSS) from 2007 and 2009. Applying an
ordered probit framework and controlling for heteroskedasticity, censoring, intra-family cor-
relation, and different measures of remittances, we find a negative impact of receiving re-
mittances on educational outcomes. Calculations of the marginal effects draw a more subtle
picture indicating that remittances positively affect educational achievements as long as ed-
ucation is mandatory. For higher, non-mandatory levels of education, however, receiving
remittances negatively influences educational attainment. These results support concerns
regarding the wide-spread affirmative impact of remittances on human capital formation.
Accounting for endogeneity, the coefficients of the remittance variables become insignifi-
cant. Our general findings, however, remain unchanged implying that remittances are not
used for investments in human capital accumulation once education becomes voluntary.
1
Introduction
During the past decade, remittances have become an important source of income in many
developing countries. Remittances provide additional resources to households, increase
their disposable income, and might relax budget constraints of the household (McKen-
zie/Rapoport, 2011, 1343; Cox Edwards/Ureta, 2003, 1f.). Families, thus, may rely less on
children’s work, therefore increasing time available for education (Bansak/Chezum, 2009,
145). Additional funds from remittances could either foster consumption or boost invest-
ments like education (McKenzie/Sasin, 2007, 3). If remittances are primarily used for con-
sumption, the educational attainment of households should not systematically differ among
households receiving remittances and those who do not obtain these supplementary funds.
Contrarily, educational attainment should increase if additional resources are invested in
education. In thiscase, children from households receiving remittances attain better educa-
tional results than children from other households.
There has been a growing number of publications examining the impact of remittances on
schooling decisions of children in developing countries (Acosta, 2011; King/Lillard, 1987;
Nguyen/Purnamasari, 2011; McKenzie/Rapoport, 2011). Following the standard model for
educational decisions derived from the neo-classical theory, education should not simply be
regarded as a consumption activity but as an investment in an individual’s human capital.
One makes an investment in his education if the associated returns exceed the costs of this
investment (Sjaastad, 1962; King/Lillard, 1987, 168; Dustmann/Glitz, 2011, 24f.). Additional-
ly, returns to investments in education will be compared with the returns to alternative in-
vestments (Cox Edwards/Ureta, 2003, 438). The costs of investments in education do not
only include direct costs, such as tuition fees, but also indirect costs, such as foregone earn-
ings. While the benefits of education will be realized in the future, costs occur at the mo-
ment of education. Hence, the costs of schooling have to be paid from current resources
(McKenzie/Rapoport, 2011, 1342).
The financing of next generation’s education through remittances creates a “forward” link
(Rapoport/Docquier, 2005, 69). If remittances positively affect the human capital formation
of children, remittances should also improve long-run growth as the younger population
becomes more educated. Some studies refer to the “repayment of loans” hypothesis indicat-
ing a reverse link (McKenzie/Rapoport, 2011, 1332; Rapoport/Docquier, 2005, 69). Today’s
investment in the prospective migrant’s human capital might be a profitable investment for
2
the household since education may have a higher return when migrating. So, the chance of
migrating in the future increases the expected return to education. Thus, remittances may
be considered a repayment of informal loans which were used to finance educational in-
vestments of the prospective migrant. This channel can be regarded as a “backward” link
since remittances are targeted for the parental generation of the migrant
(Rapoport/Docquier, 2005, 69).
Although remittances, if invested, may have positive effects on the educational attainment
of children, households receiving remittances are often characterized by out-migration of
one parent. Recent studies showed that the absence of one parent can lead to disruptive
effects on the household structure and imposes an economic burden on the remaining
household members (Hanson/Woodruff, 2003, 2; Amuedo-Dorantes et al., 2010, 237). As a
result, children may be forced to work in order to offset the work of the absent household
member (Bansak/Chezum, 2009, 145). Information and network effects could be a further
source of the depressing effect of migration on educational attainment since children of mi-
grant parents have a higher probability of becoming a migrant than children without migrant
household members (McKenzie/Rapoport, 2011, 1343). This may raise the opportunity costs
of staying in school due to higher potential earnings abroad. In consequence, children leave
school earlier in order to migrate and start working (McKenzie/Rapoport, 2011, 1343).
Hence, the overall effect of migration on children’s educational attainment is unclear a pri-
ori.
We examine whether remittances foster educational investments and, if so, whether indi-
viduals from households receiving remittances from abroad show higher educational at-
tainments than individuals from households without remittances. Employing data from 2007
and 2009, we analyze this question in the context of Tajikistan. During the last two decades,
the country turned into a major labor exporting country where remittances have become a
source of income of utmost importance, reaching 47 % of the country’s GDP or 3 billion USD
in 2011 (World Bank, 2013a). The civil war between 1992 and 1998 and the poor condition
of the economy led to massive migration outflows. Official figures show that the number of
Tajik labor migrants sums up to one million people, while unofficial figures range up to 1.5
million Tajik labor migrants abroad (Umarov, 2010, 11). The vast majority of these migrants
(> 95 %) head to Russia (Danzer/Ivaschenko, 2010, 190; Umarov, 2010, 11). Thus, interna-
tional labor migration has become a “livelihood strategy” in Tajikistan during the last years
3
(Bennett et al., 2013, 1). The global economic recession led to a temporary decline of the
number of international migrants and the amount of remittances sent to Tajikistan. Current
findings indicate that during the crisis migrants additionally withheld a larger part of their
earnings as precautionary savings (Danzer/Ivaschenko, 2010, 200).
The Tajik education system generally receives a poor evaluation although the country has a
high enrollment rate (2011: primary – 96.9 %, secondary – 86.0 %, World Bank, 2013b) and a
high literacy rate (2010: 99.7 %, World Bank, 2013c). However, the level of education has
little improved since the breakdown of the former Soviet Union. For individuals aged 25 and
older, the average years of schooling have slightly increased to 9.85 years in 2010 from 9.01
years in 1990 (Barro/Lee, 2013). Moreover, the quality of education has been declining since
the collapse of the Soviet Union. State spending on education has fallen from 8.9 % of GDP in
1991 to 3.5 % in 2008 (Republic of Tajikistan, 2007, 28; Tajikistan State Statistical Committee,
2013a). Estimations showed that current state spending on education accounts for merely
30 % of the funds needed (Republic of Tajikistan, 2007, 28). The National Development
Strategy unveils a number of severe problems in the Tajik education sector. On the one hand
“[t]he quality of instruction and training and the knowledge and skill levels achieved by stu-
dents fall significantly short of contemporary demands” (Republic of Tajikistan, 2007, 28).
Another reason could be found in “the shortage of schoolteachers and […] their poor qualifi-
cations”, which can be attributed to the low salaries paid in the public education sector (Re-
public of Tajikistan, 2007, 28). In 2008, teachers in public schools and universities on average
earned 181 Somoni (53 USD) per month or only 78 % of the average common monthly wage
in Tajikistan (Tajikistan State Statistical Committee, 2013b). Many teachers have sought bet-
ter paid jobs in private educational institutions or other sectors.
The educational system in Tajikistan currently consists of four years of primary school and a
two-tiered secondary education. After primary school, students spend five years at basic
school. According to our data, nearly half of the persons surveyed (45 %) finish their studies
after basic school (grade 9), up to which education is compulsory. Those individuals continu-
ing their education could choose between a two year program (secondary general) where
students are prepared for university, a technical special secondary education, or some voca-
tional training. After secondary school, individuals can study at university for another five
years.
4
The contribution of this paper is threefold. First, the article aims to estimate the impact of
remittances on educational attainment in Tajikistan and to close the existing gap in litera-
ture. Second, the paper makes a contribution to the existing literature whether remittances
are used for consumption rather than investments. Moreover, the findings give some useful
implications encouraging an investment-related use of non-governmental transfers.
The paper is structured as follows. The next section provides an overview of the relevant
literature. Section 3 presents the employed data and discusses the econometric model. Sec-
tion 4 outlines the main empirical results and gives some implications. The final section
draws conclusions about the impact of remittances on educational attainment in Tajikistan.
Literature Review
The relationship between migration and educational attainment has been discussed several
times (Cox Edwards/Ureta, 2003; Hanson/Woodruff, 2003; McKenzie/Rapoport, 2011). Dif-
ferent measures of educational attainment are applied in the literature, ranging from school
attendance (Amuedo-Dorantes, 2010; Acosta, 2011; King/Lillard, 1987; Ngu-
yen/Purnamasari, 2011; Cox Edwards/Ureta, 2003), school years completed (Han-
son/Woodruff, 2003), grades attained (McKenzie/Rapoport, 2011), to the probability of se-
lected school transitions (Mare, 1980).
Hanson/Woodruff (2003) detected that children from households with a migrant in the US
complete significantly more years of schooling. Using a 10 % subsample of the 2000 Mexico
Census of Population and Housing, they estimated an extra 0.23 to 0.89 years of schooling
for girls whose mothers have less than three years of education (Hanson/Woodruff, 2003,
21f.). Zhunio et al. (2012) investigated the impact of remittances on educational outcomes
employing a sample of 69 low- and middle-income countries. They found a significant posi-
tive influence of remittances on primary school completion and secondary school enrollment
(Zhunio et al., 2012, 4613). These results remain robust to a couple of different specifica-
tions indicating that remittances play an important role in improving educational outcomes.
Amuedo-Dorantes et al. (2010) analyzed the impact of remittances on children’s schooling in
various Haitian communities. They distinguished between children from households with
out-migration and those without absent household members. The authors observed that
receiving remittances raises school attendance of children regardless of whether their
household is confronted with out-migration of household members or not (Amuedo-
5
Dorantes et al., 2010, 238). In other communities, however, the positive effect of remittanc-
es on the likelihood of school attendance could only be found for children from households
without absent members (Amuedo-Dorantes et al., 2010, 240). These differences could be
explained by the fact that out-migration of one household member may impose an econom-
ic burden on the remaining household members (Amuedo-Dorantes et al., 2010, 237; Han-
son/Woodruff, 2003, 6). Cox Edwards/Ureta (2003) examined the impact of remittances on
school retention from the 1997 Annual Household Survey in El Salvador. They showed that
receiving remittances significantly lowers the hazard of a child leaving school. Moreover,
they found that income from remittances has a several times stronger impact on the proba-
bility of leaving school than other sources of income (Cox Edwards/Ureta, 2003, 449f.). Re-
mittances are not directly correlated with parental schooling and, therefore, closer to a ran-
domly assigned transfer whose effect is a cleaner estimate on school retention rates than
the effect of household income (Cox Edwards/Ureta, 2003, 432). Bansak/Chezum (2009)
investigated the effects of remittances on school enrollment in Nepal. Their findings indicate
a positive impact which is statistically significant only for young children (aged 5 to 10) (Ban-
sak/Chezum, 2009, 147). Moreover, boys appear to gain more from remittances than girls.
Adams/Cuecuecha (2010) analyzed the marginal spending behavior of households in Guate-
mala. They observed that households receiving remittances at the margin spend less on con-
sumption goods, but more on education than households without remittances (Ad-
ams/Cuecuecha, 2010, 1633).
Other studies could not detect a positive impact of remittances on educational outcomes.
McKenzie/Rapoport (2011) found a significant negative effect of migration on school attend-
ance and educational attainment using data from 1997 ENADID in rural Mexico. Separating
by sex and applying an IV-Censored Ordered Probit model, the results showed that the de-
pressing effect of migration is somewhat stronger for boys (McKenzie/Rapoport, 2011,
1345). These findings could be explained by the fact that young males in households with
migrants rather migrate themselves instead of attending an educational institution whereas
girls in migrant households drop school in order to engage in housework (McKen-
zie/Rapoport, 2011, 1335). Acosta (2011) came to the conclusion that the overall impact of
remittances on school attendance remains quite low. Hence, remittances do not significantly
enhance investment in the education of children (Acosta, 2011, 930). Running a probit esti-
mation, remittances increase school enrollment rates significantly. However, these results
6
are no longer valid after controlling for endogeneity and potential sample selection bias
(Acosta, 2011, 925/930). Similar to these findings, Nguyen/Purnamasari (2011) could not
provide evidence that migration increases school enrollment of children. The analysis of a
data set from Indonesia suggested that migration only has a positive impact on school en-
rollment when using an OLS estimation. Applying an IV approach with historical migration
networks as instruments, the impact is much smaller and statistically not significantly differ-
ent from zero (Nguyen/Purnamasari, 2011, 17). Chami et al. (2005) concluded that remit-
tances are not primarily devoted to investments but to compensate their recipients for bad
economic outcomes.
Most studies focused their analysis on children between 6 and 24 years. This might be rea-
sonable for developing countries where schooling has mostly been marked by considerable
progress within the past decades. In Tajikistan, however, this progress has virtually not ap-
peared since the country gained independence in 1991.
There is only limited research on educational attainment in the context of Tajikistan
(Clément, 2011; Bennett et al., 2013). Clément (2011) analyzed the impact of remittances on
household expenditure patterns in Tajikistan. He did not provide any evidence that remit-
tances have a positive effect on investment expenditures like education (Clément, 2011,
71/75). Applying the Tajikistan Living Standards Measurement Survey (TLSS) 2003 from the
World Bank, he concluded that remittances have not been used for investments but rather
for consumption activities. Bennett et al. (2013) found ambiguous evidence for the impact of
household members’ migration on school enrollment of secondary school-aged children
(aged 11-17 years) in Tajikistan using the TLSS 2007. Longer-term migration of parents was
associated with a significantly higher likelihood of children to be enrolled (Bennett et al.,
2013, 9). These results imply that longer-term migration of one parent is an effective strate-
gy where economic benefits outweigh the costs. In contrast, children affected by the migra-
tion of siblings or other household members (no parents, no siblings) are less likely to be in
school (Bennett et al., 2013, 11). However, only few of the results were statistically signifi-
cantly different from zero. Using the TLSS 1999 and 2003, Shemyakina (2006) evaluated the
effect of the 1992-1998 armed conflict in Tajikistan on school enrollment in the compulsory
age group (aged 7-15 years) and the probability of completion of compulsory schooling. The
results indicate that the conflict influenced boys and girls differently. While girls were 11-12
% less likely to be enrolled (significant at the 1 % level) in case of damage to the household’s
7
dwelling, boys did not experience a negative impact (Shemyakina, 2006, 27). Moreover, the
probability of completing compulsory schooling was significantly lower for boys and girls
who were of school age during the civil war (born in 1976-1986), although the effect was
greater for girls. Additionally, girls from regions strongly exposed to the conflict had a signifi-
cantly lower probability to complete compulsory schooling than girls from regions relatively
unaffected by the conflict (Shemyakina, 2006, 31).
Other existing studies on Tajikistan have rather focused on the impact of remittances on
poverty reduction (Kumo, 2012; Danzer/Ivaschenko, 2010) and labor supply (Justi-
no/Shemyakina, 2012). Kumo (2012) could not find any correlation between household in-
come levels and the amounts of remittances received in Tajikistan. Moreover, he observed
that remittances do not lead to a significant reduction of poverty because households with
higher incomes are more likely to supply migrants. Danzer/Ivaschenko (2010) analyzed mi-
gration patterns within the business cycle in Tajikistan. They identified how the global finan-
cial crisis influenced Tajik migration patterns. In contrast to Kumo (2012), they concluded
that remittances play a major role in reducing poverty (Danzer/Ivaschenko, 2010, 191).
While Bennett et al. (2013) examined the influence of migration on school enrollment in
Tajikistan using TLSS 2007, to the best of our knowledge the impact of remittances on edu-
cational attainment in Tajikistan has never been investigated with data from the TLSS 2007
and 2009.
Methodology
Data
The data employed in the analysis were taken from the Tajikistan Living Standards Meas-
urement Surveys in 2007 and 2009 (TLSS 2007/ TLSS 2009), jointly conducted by the World
Bank, UNICEF and the State Statistical Committee of Tajikistan. The TLSS 2007 comprises
4,860 households with about 30,000 individuals. The TLSS 2009 consists of 1,503 households
with about 10,000 individuals. The data include information about educational aspects as
well as migration patterns, and are representative at the national level, the regional level
(four regions and Dushanbe), and the urban/rural level (World Bank, 2008, 7; World Bank,
2010, 1). Most of the households who were interviewed during the second wave in 2009 had
already been surveyed in 2007. However, the formation of a panel consisting of only two
periods would have been misleading. Furthermore, building a balanced panel would have
8
resulted in a severe loss of the observations of approximately two thirds of the households
being interviewed in 2007. In contrast to Danzer/Ivaschenko (2010), investigating migration
patterns before and after the global financial crisis, our topic would have required longer
series for profound scientific statements. Using a pooled OLS estimation allows us to capital-
ize on the households interviewed only once, and increase the number of observations con-
siderably. As some households were employed twice, our data set does not consist of inde-
pendently sampled observations. Thus, we do not have an independently pooled cross sec-
tion (Wooldridge, 2009, 444).
Model
In this section, we present the conceptual framework and the empirical model of our analy-
sis. Following King/Lillard (1987), we imbed the human capital model into a model of house-
hold demand. Educational attainment within this framework is not a decision of the individ-
ual but rather one of the entire household. Hence, educational outcomes do not only de-
pend on an assessment of the costs and benefits of education but also on the family’s pref-
erences and budget constraints. Our framework implies that an individual’s educational at-
tainment is not independent of the households’ economic conditions (King/Lillard, 1987,
168).
In our empirical model, educational attainment is measured as the highest diploma an indi-
vidual has attained. The desired level of educational attainment y* is a continuous variable
depending on several explanatory variables, denoted as x, and a residual term e. Hence,
y* = xβ + e, e|x ~ normal (0,1).
In reality, however, we cannot observe the desired level y*. Instead, we can only observe a
discrete level of educational attainment, y, expressed in different completed levels of educa-
tion (Wooldridge, 2010, 655). Thus,
y = 0 if y* ≤ α1
= 1 if α1 < y* ≤ α2
= 2 if α2 < y* ≤ α3 .
.
.
= J if αj < y* .
9
The variables α1 to αj constitute threshold parameters denoting the transition from one level
of educational attainment to another. We classify educational attainment into eight catego-
ries with a natural order: no educational attainment (0), primary school (1), basic school (2),
secondary general (3), secondary special (4), secondary technical (5), higher education (6),
and graduate school (7). Any observed completed educational level y is an outcome of the
optimization of the household’s utility function. An individual completes an educational level
y if the value of the underlying latent variable y* is within the thresholds αj and αj+1. We
therefore treat educational attainment as an ordered, discrete variable.
Assuming a standard normal distribution for e, we can derive the conditional distribution of
y given x and compute each response probability summing to unity:
P(y = 0|x) = P(y* ≤ α1|x) = P(xβ + e ≤ α1|x) = Φ(α1 – xβ)
P(y = 1|x) = P(α1 < y* ≤ α2|x) = Φ(α2 – xβ) – Φ(α1 – xβ) .
.
.
P(y = J – 1|x) = P(αJ-1 < y* ≤ αJ|x) = Φ(αJ – xβ) – Φ(αJ-1 – xβ)
P(y = J|x) = P(y* > αJ|x) = 1 – Φ(αJ – xβ).
The parameters α and β can be estimated by maximum likelihood estimation. Thus, for each
i, the log-likelihood function is (Wooldridge, 2010, 656):
li(α,β) = 1[yi = 0] log[Φ(α1 – xiβ)] + 1[yi = 1] log[Φ(α2 – xiβ) – Φ(α1 – xiβ)] + … + 1[yi = J]
log[1 – Φ(αJ – xiβ)].
Since we have a discrete dependent variable with a natural order, an ordered probit model,
originally developed by King/Lillard (1987), seems appropriate for our estimation. This strat-
egy has been frequently used in the literature (Holmes, 2003, 253; Maitra, 2003).
In this paper we do not apply a sequential model of education like Pal (2004) because educa-
tional attainments are ordered in nature, but they are only partly sequential. An individual
cannot attain a degree of higher education (6) without graduating basic school (2). However,
one can get a university degree without having completed the level of secondary technical
education (5). Since our measure of educational attainment is not restricted to schooling
levels, we do not have conditional sequence of the dependent variable and therefore cannot
apply a sequential model.
To investigate the effect of remittances on the educational attainment of household mem-
bers, we will test the following empirical model:
yi = β0 + xiγk + rueiβ2 + εi .
10
In the model, yi refers to the highest diploma an individual has attained (m3bq5). xi is a set of
explanatory variables, including individual and household characteristics, as well as charac-
teristics of the household head. ruei measures the impact of remittances on our dependent
variable. Different variables of remittances are presented in the following chapter.
Although a large number of studies (Amuedo-Dorantes et al., 2010; Maitra, 2003) applies
current school enrollment as dependent variable, we prescind from the use of this measure
for three different reasons. First, it does not seem appropriate to measure the impact of
remittances on educational attainment with the help of a binary variable. Second, measuring
current school enrollment ignores some complications of educational attainment, such as
grade repetition or late integration in the educational system (Amuedo-Dorantes et al.,
2010, 232). Finally, low school enrollment rates are a problem in most developing countries
but only to a lesser extent in Tajikistan. The high levels of school enrollment during the Sovi-
et-era have remained until today. However, the quality of education deteriorates in Tajiki-
stan as we have shown in a previous chapter.
Potential endogeneity between our remittance variable and educational attainment may
cause inconsistent estimates. Remittances could be correlated with the unmeasured deter-
minants of educational attainment like ability leading to omitted variable bias. The relation-
ship between remittances and educational attainment includes a further uncertainty. Remit-
tances can be the cause and the consequence of migration (Rapoport/Docquier, 2005, 16).
Lucas and Stark (1985) found out that migrants with better education tend to remit more,
whereas other studies came to the conclusion that households with high incomes are more
likely to supply migrants (Kumo, 2012, 14). The impact direction is therefore unclear, forcing
us to account for reverse causality. To allow for possible endogeneity we apply an instru-
mental variable approach. We use information about existing migrant networks, an instru-
ment widely accepted in the literature (McKenzie/Rapoport, 2011; Justino/Shemyakina,
2012). In contrast to studies about the Mexican/US remittance behavior (Hanson/Woodruff,
2003), there are no historical migration rates available for Tajikistan. Thus, we employ the
proportion of households in a population point (primary sampling unit) having migrants
abroad as an instrumental variable (hh_psushare) as proposed by Justino/Shemyakina
(2012). Recent studies show that migrant networks facilitate the access to the foreign labor
market (Munshi, 2003, 553; Chiquiar/Hanson, 2005, 245; Carrington et al., 1996, 909). That
particularly affects members of households with current labor migrants.
11
Although the size of the migration network at the community level (i.e. within primary sam-
pling units) has not been part of the TLSS 2009, we adopt the TLSS 2007 results to the TLSS
2009. This is possible because we have information about the primary sampling units for
both surveys. As migrant networks are highly persistent and do not change substantially
within two years, this step seems reasonable. Our instrument has to satisfy two general re-
strictions as claimed by Wooldridge (2009, 529). First, it must be correlated with the variable
which is instrumented. Second, the instrument must be uncorrelated with the model error
term. Meeting both conditions, hh_psushare seems therefore suitable for the IV estimations.
Descriptive Statistics
The set of explanatory variables includes individual and household level characteristics. On
the individual level we account for age and sex of the individual. Age and age squared con-
trol for differences across birth cohorts, allowing for a non-linear relationship between age
and educational attainment. Furthermore, we include information about whether an indi-
vidual has been enrolled in an educational institution during the previous academic year.
Since household characteristics influence educational attainment in various ways, we ac-
count for several characteristics of the household head and the household in general. We
control for the educational level, gender and age of the household head. We use some fur-
ther variables to account for the number of children under 15 years per household and
whether a household is located in a rural region. We employ deflated (at 2007 levels)
monthly per capita expenditures on food as an additional regressor to capture the welfare
level of the household. This is reasonable since we examine a developing country with 54 %
of the population living below the national poverty line in 2007 (World Bank, 2013d), and
food expenditures vary greatly between the households. Finally, we account for the deflated
monthly per capita expenditures on education and the labor income earned last month from
main occupation of the household members which serves as a proxy of permanent income.
Tables 1 and 2 give a description of the variables and present the summary statistics for the
full sample.
12
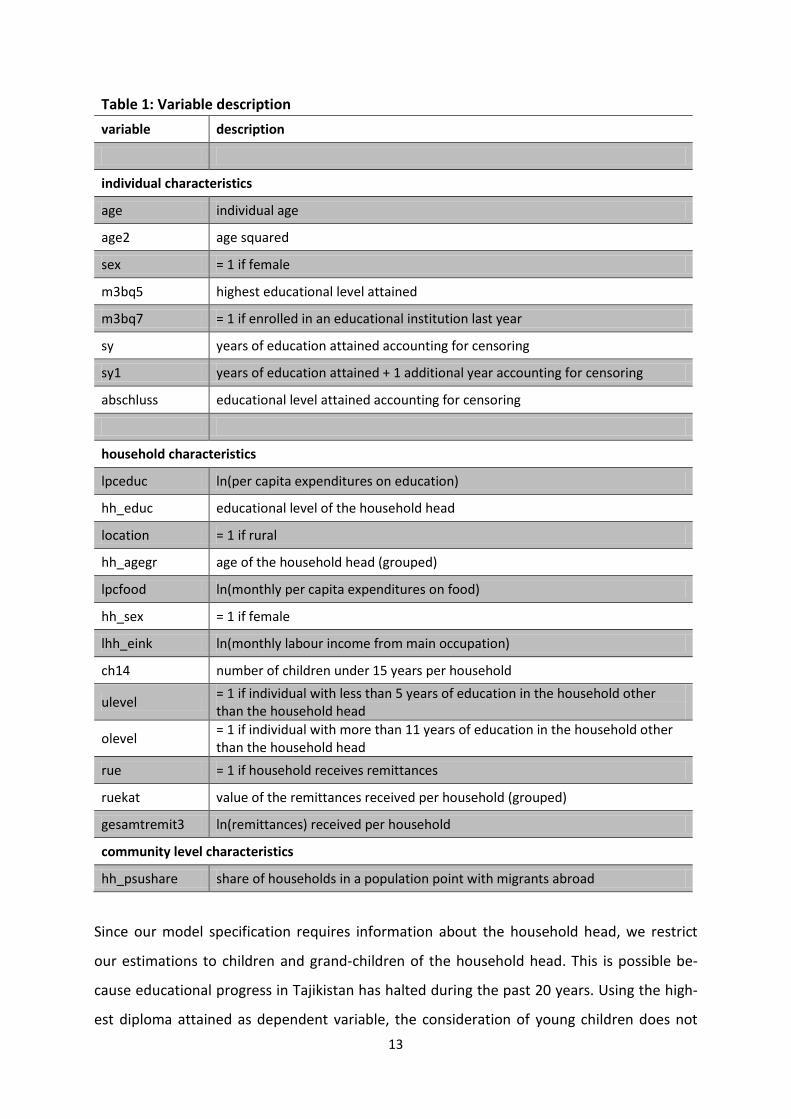
Table 1: Variable description variable description
individual characteristics
age individual age
age2 age squared
sex = 1 if female
m3bq5 highest educational level attained
m3bq7 = 1 if enrolled in an educational institution last year
sy years of education attained accounting for censoring
sy1 years of education attained + 1 additional year accounting for censoring
abschluss educational level attained accounting for censoring
household characteristics
lpceduc ln(per capita expenditures on education)
hh_educ educational level of the household head
location = 1 if rural
hh_agegr age of the household head (grouped)
lpcfood ln(monthly per capita expenditures on food)
hh_sex = 1 if female
lhh_eink ln(monthly labour income from main occupation)
ch14 number of children under 15 years per household
ulevel = 1 if individual with less than 5 years of education in the household other than the household head
olevel = 1 if individual with more than 11 years of education in the household other than the household head
rue = 1 if household receives remittances
ruekat value of the remittances received per household (grouped)
gesamtremit3 ln(remittances) received per household
community level characteristics
hh_psushare share of households in a population point with migrants abroad
Since our model specification requires information about the household head, we restrict
our estimations to children and grand-children of the household head. This is possible be-
cause educational progress in Tajikistan has halted during the past 20 years. Using the high-
est diploma attained as dependent variable, the consideration of young children does not 13
seem appropriate as their educational attainment might be preliminary and schooling is
mandatory up to the age of 15. However, to account for those terminating their education
before this age, we only exclude individuals under the age of 11 and account for the possible
censoring bias of children enrolled in an educational institution. Thus, we have data on
14,802 individuals.
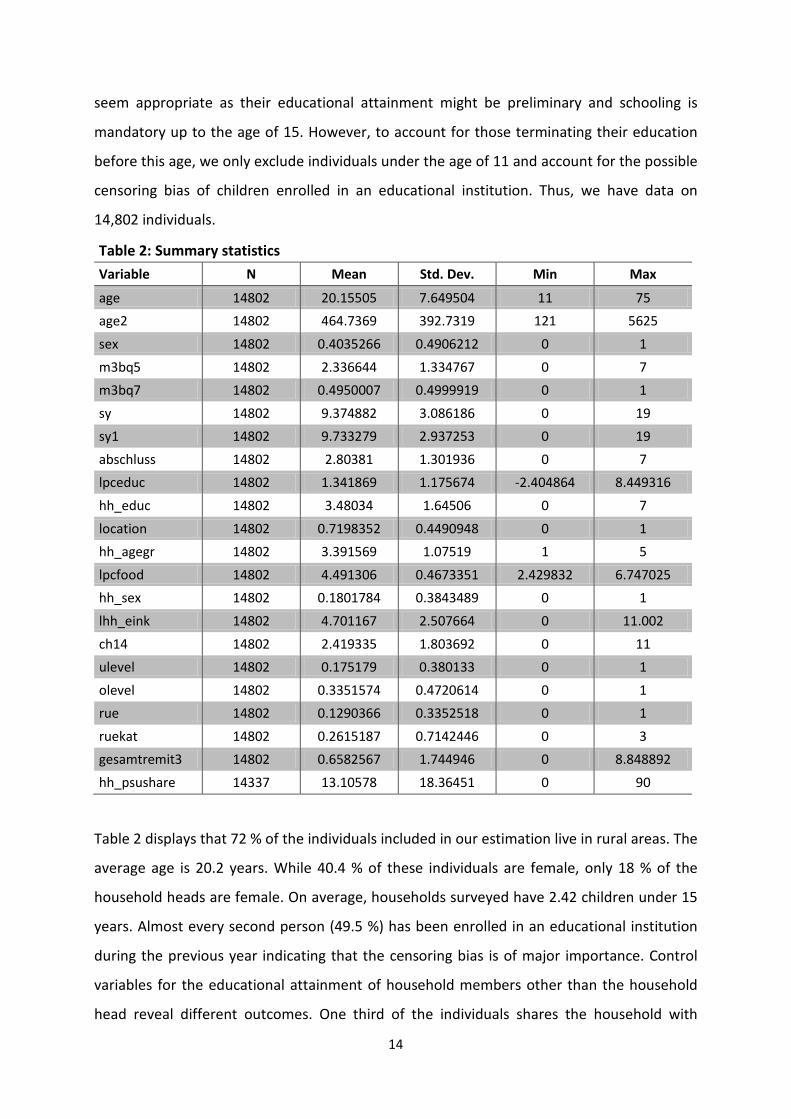
Table 2: Summary statistics Variable N Mean Std. Dev. Min Max
age 14802 20.15505 7.649504 11 75 age2 14802 464.7369 392.7319 121 5625 sex 14802 0.4035266 0.4906212 0 1 m3bq5 14802 2.336644 1.334767 0 7 m3bq7 14802 0.4950007 0.4999919 0 1 sy 14802 9.374882 3.086186 0 19 sy1 14802 9.733279 2.937253 0 19 abschluss 14802 2.80381 1.301936 0 7 lpceduc 14802 1.341869 1.175674 -2.404864 8.449316 hh_educ 14802 3.48034 1.64506 0 7 location 14802 0.7198352 0.4490948 0 1 hh_agegr 14802 3.391569 1.07519 1 5 lpcfood 14802 4.491306 0.4673351 2.429832 6.747025 hh_sex 14802 0.1801784 0.3843489 0 1 lhh_eink 14802 4.701167 2.507664 0 11.002 ch14 14802 2.419335 1.803692 0 11 ulevel 14802 0.175179 0.380133 0 1 olevel 14802 0.3351574 0.4720614 0 1 rue 14802 0.1290366 0.3352518 0 1 ruekat 14802 0.2615187 0.7142446 0 3 gesamtremit3 14802 0.6582567 1.744946 0 8.848892 hh_psushare 14337 13.10578 18.36451 0 90
Table 2 displays that 72 % of the individuals included in our estimation live in rural areas. The
average age is 20.2 years. While 40.4 % of these individuals are female, only 18 % of the
household heads are female. On average, households surveyed have 2.42 children under 15
years. Almost every second person (49.5 %) has been enrolled in an educational institution
during the previous year indicating that the censoring bias is of major importance. Control
variables for the educational attainment of household members other than the household
head reveal different outcomes. One third of the individuals shares the household with
14
members having attained more than 11 years of education. In contrast, 17.5 % of those in-
cluded live with household members other than the household head who achieved less than
five years of education and who have not been enrolled in an educational institution during
the previous academic year.
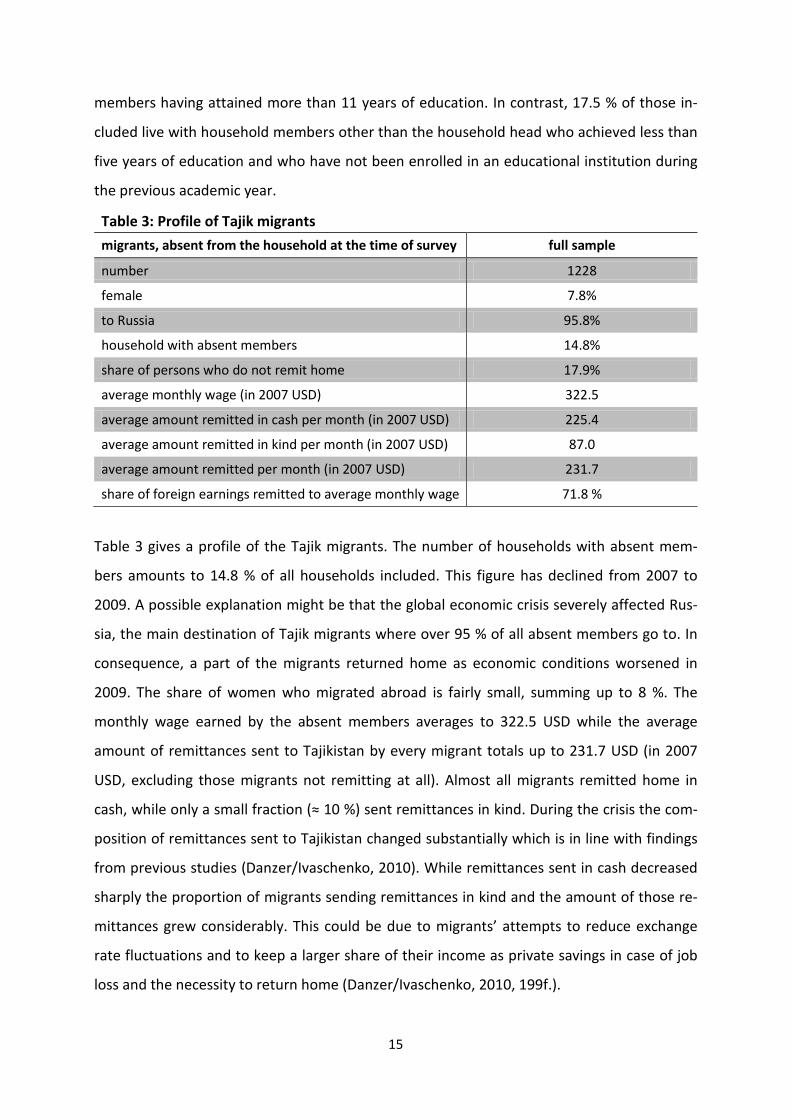
Table 3: Profile of Tajik migrants
migrants, absent from the household at the time of survey full sample
number 1228
female 7.8%
to Russia 95.8%
household with absent members 14.8%
share of persons who do not remit home 17.9%
average monthly wage (in 2007 USD) 322.5
average amount remitted in cash per month (in 2007 USD) 225.4
average amount remitted in kind per month (in 2007 USD) 87.0
average amount remitted per month (in 2007 USD) 231.7
share of foreign earnings remitted to average monthly wage 71.8 %
Table 3 gives a profile of the Tajik migrants. The number of households with absent mem-
bers amounts to 14.8 % of all households included. This figure has declined from 2007 to
2009. A possible explanation might be that the global economic crisis severely affected Rus-
sia, the main destination of Tajik migrants where over 95 % of all absent members go to. In
consequence, a part of the migrants returned home as economic conditions worsened in
2009. The share of women who migrated abroad is fairly small, summing up to 8 %. The
monthly wage earned by the absent members averages to 322.5 USD while the average
amount of remittances sent to Tajikistan by every migrant totals up to 231.7 USD (in 2007
USD, excluding those migrants not remitting at all). Almost all migrants remitted home in
cash, while only a small fraction (≈ 10 %) sent remittances in kind. During the crisis the com-
position of remittances sent to Tajikistan changed substantially which is in line with findings
from previous studies (Danzer/Ivaschenko, 2010). While remittances sent in cash decreased
sharply the proportion of migrants sending remittances in kind and the amount of those re-
mittances grew considerably. This could be due to migrants’ attempts to reduce exchange
rate fluctuations and to keep a larger share of their income as private savings in case of job
loss and the necessity to return home (Danzer/Ivaschenko, 2010, 199f.).
15
We treat remittances as all transfers in cash or in kind sent to the household by migrant
workers who have worked abroad during the previous year. To account for possible meas-
urement error we use three different measures of remittances. The variable rue is a dummy
equal to 1 if a household has received any remittances during the previous 12 months and 0
otherwise. A second variable, ruekat, categorizes the monthly amount of remittances re-
ceived in cash or in kind per household (gesamtremit2) with 0 for “no remittances” received,
1 for “< 78 USD” received, 2 for “78-349 USD” received, up to 3 for “> 349 USD” received (in
2007 USD). The intervals have been chosen as follows: 1 includes the lowest quintile of those
receiving remittances, while 3 comprises the highest quintile. All remaining observations
receiving remittances are assigned to 2. Our third variable, gesamtremit3, represents the
logarithm of monthly remittances received in cash or in kind in 2007 USD per household
(gesamtremit3 = ln(gesamtremit2)).
Empirical Results
Baseline model
Table 4 presents the results of our baseline regressions with the highest diploma an individ-
ual has obtained (m3bq5) as our dependent variable. We estimate the baseline regressions
with different measures of remittances. All regressions include controls for individual and
household characteristics, as well as for the head of the household. In a next step, we ac-
count for the discreteness of the dependent variable and apply an ordered probit model.
16
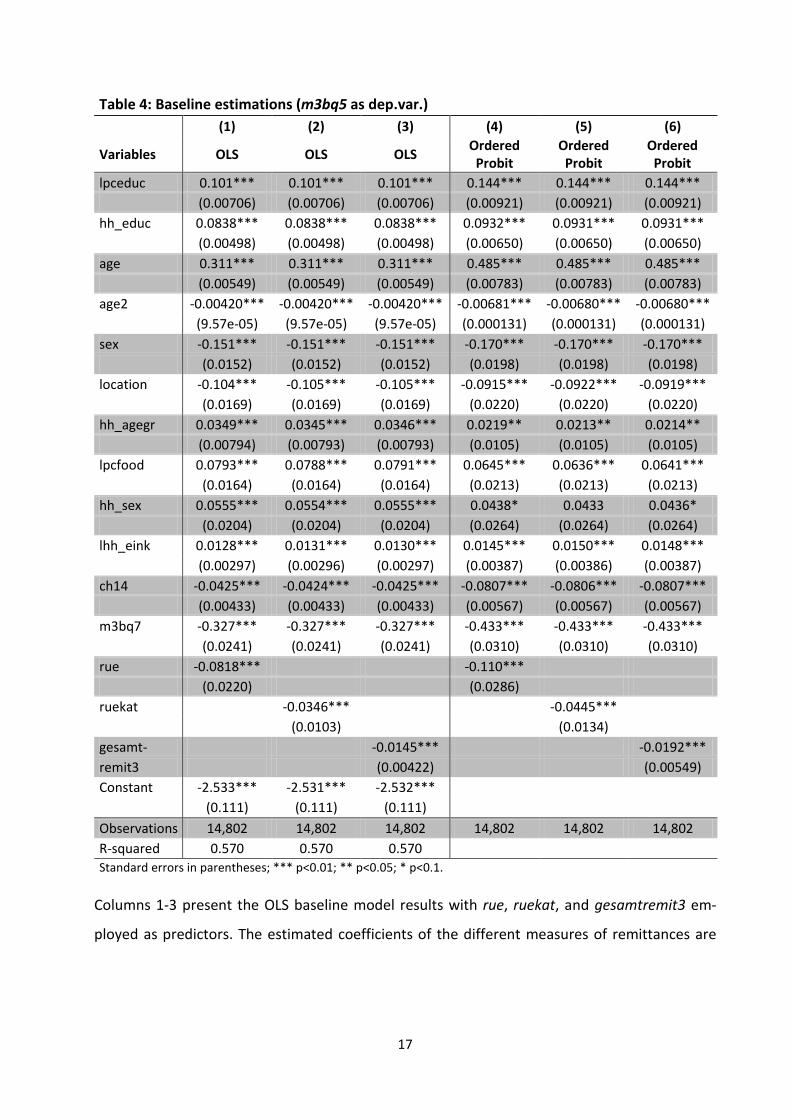
Table 4: Baseline estimations (m3bq5 as dep.var.) (1) (2) (3) (4) (5) (6)
Variables OLS OLS OLS Ordered Probit
Ordered Probit
Ordered Probit
lpceduc 0.101*** 0.101*** 0.101*** 0.144*** 0.144*** 0.144*** (0.00706) (0.00706) (0.00706) (0.00921) (0.00921) (0.00921) hh_educ 0.0838*** 0.0838*** 0.0838*** 0.0932*** 0.0931*** 0.0931*** (0.00498) (0.00498) (0.00498) (0.00650) (0.00650) (0.00650) age 0.311*** 0.311*** 0.311*** 0.485*** 0.485*** 0.485*** (0.00549) (0.00549) (0.00549) (0.00783) (0.00783) (0.00783) age2 -0.00420*** -0.00420*** -0.00420*** -0.00681*** -0.00680*** -0.00680*** (9.57e-05) (9.57e-05) (9.57e-05) (0.000131) (0.000131) (0.000131) sex -0.151*** -0.151*** -0.151*** -0.170*** -0.170*** -0.170*** (0.0152) (0.0152) (0.0152) (0.0198) (0.0198) (0.0198) location -0.104*** -0.105*** -0.105*** -0.0915*** -0.0922*** -0.0919*** (0.0169) (0.0169) (0.0169) (0.0220) (0.0220) (0.0220) hh_agegr 0.0349*** 0.0345*** 0.0346*** 0.0219** 0.0213** 0.0214** (0.00794) (0.00793) (0.00793) (0.0105) (0.0105) (0.0105) lpcfood 0.0793*** 0.0788*** 0.0791*** 0.0645*** 0.0636*** 0.0641*** (0.0164) (0.0164) (0.0164) (0.0213) (0.0213) (0.0213) hh_sex 0.0555*** 0.0554*** 0.0555*** 0.0438* 0.0433 0.0436* (0.0204) (0.0204) (0.0204) (0.0264) (0.0264) (0.0264) lhh_eink 0.0128*** 0.0131*** 0.0130*** 0.0145*** 0.0150*** 0.0148*** (0.00297) (0.00296) (0.00297) (0.00387) (0.00386) (0.00387) ch14 -0.0425*** -0.0424*** -0.0425*** -0.0807*** -0.0806*** -0.0807*** (0.00433) (0.00433) (0.00433) (0.00567) (0.00567) (0.00567) m3bq7 -0.327*** -0.327*** -0.327*** -0.433*** -0.433*** -0.433*** (0.0241) (0.0241) (0.0241) (0.0310) (0.0310) (0.0310) rue -0.0818*** -0.110*** (0.0220) (0.0286) ruekat -0.0346*** -0.0445*** (0.0103) (0.0134) gesamt- -0.0145*** -0.0192*** remit3 (0.00422) (0.00549) Constant -2.533*** -2.531*** -2.532*** (0.111) (0.111) (0.111) Observations 14,802 14,802 14,802 14,802 14,802 14,802 R-squared 0.570 0.570 0.570 Standard errors in parentheses; *** p<0.01; ** p<0.05; * p<0.1.
Columns 1-3 present the OLS baseline model results with rue, ruekat, and gesamtremit3 em-
ployed as predictors. The estimated coefficients of the different measures of remittances are
17
negative and significant at the 1 % level.1 The educational level of individuals from households
receiving remittances is 0.082 units lower compared to individuals living in households without
remittances (column 1). Using a categorized measure of remittances or gesamtremit3, educa-
tional attainment of individuals from households receiving remittances is lower than the level
of education of individuals from households without remittances (columns 2 and 3). The coeffi-
cient, however, decreases the more the remittance variable is subdivided.
Applying an ordered probit specification the coefficients of our variables of interest remain
negative and highly significant (columns 4-6). Calculations of the marginal effects show that
individuals from households receiving remittances have a significantly lower probability to ob-
tain a secondary general degree than those from households without remittances. These find-
ings are robust to different measures of remittances as well as higher educational degrees.
However, for mandatory levels of education (m3bq5 ≤ 2) the calculations of the marginal ef-
fects indicate that remittances increase the probability of obtaining these degrees. The results
imply that remittances improve the educational level of household members as long as school-
ing is mandatory. For higher levels remittances have a negative impact on educational attain-
ment.
In general, we obtain negative and highly significant coefficients for all measures of remittances
on educational outcomes in all baseline estimations although educational levels of the absent
members are significantly higher than those of the general population. The negative impact of
remittances on educational attainment contradicts the hypothesis that remittances are used
for investments like education. After completing mandatory levels of education, individuals
from households receiving remittances show significantly lower levels of educational attain-
ment than individuals from households without remittances. Both, the dummy variable indicat-
ing whether a household receives remittances, as well as the exact amount of remittances re-
ceived, play a significant role for educational attainment. The results indicate that individuals
from households receiving remittances leave educational institutions earlier in order to work.
1 The estimated coefficients of the control variables show the expected signs. Educational attainment increases with age, and is significantly higher for individuals with higher per capita expenditures on education and food as well as a higher household labor income. On the other hand, women, individuals living in rural areas, and individu-als from households with a higher number of children under 15 years have significant lower levels of education. The characteristics of the household head strongly influence the educational success of an individual. The degree attained increases with age of the household head and his level of education. Similar to previous literature educa-tional attainment is higher for individuals with a female household head (Behrman/Wolfe, 1984, 301). The highest diploma attained is significantly lower for those individuals currently enrolled in an educational institution. This could be explained by the fact that these people have not finished their human capital formation, yet. Most coeffi-cients are highly significant at the 1 % level.
18
Given that nearly 96 % of all labor migrants in our survey head to Russia and average wages in
Tajikistan account for only one tenth of those in Russia (IMF, 2005; IMF, 2001), the return to
one additional year of education is far exceeded by the return to working abroad. This assump-
tion even holds for the return to several additional years of schooling. Hence, individuals from
households receiving remittances tend to quit education earlier as the return to working
abroad could hardly be compensated by additional years of education.
Our estimation could be affected by heteroskedasticity leading to biased standard errors which
are no longer valid for constructing confidence intervals and t statistics. A White test confirms
our assumption of heteroskedasticity. We therefore use heteroskedasticity-robust standard
errors in our further estimations.
Censoring
While ordered probit models account for the non-negative restriction and the discreteness of
the dependent variable, they fail to account for censored observations (Maitra, 2003, 130).
Censoring occurs when an individual is still enrolled in an educational institution at the time of
the survey and has not finished his studies yet (King/Lillard, 1987, 169). The final level of educa-
tion is therefore uncertain. It is equal or greater than the current level of education. Neglecting
the censoring bias, OLS and ordered probit estimations produce inconsistent estimators of the
coefficients. This bias grows in magnitude with a higher frequency of censored observations.
Like previous research on educational attainment we distinguish between currently enrolled
individuals and those who have already completed their education. In our data every second
individual (49.5 %) was enrolled at the time of the survey. Similar to other studies in the field of
the economics of education, we use an ordered probit model which simultaneously accounts
for the censoring bias to estimate educational attainment (King/Lillard, 1987; Holmes, 2003;
Maitra, 2003; McKenzie/Rapoport, 2011).
There are several possibilities to deal with the problem of censoring. First, estimations could be
implemented using only the uncensored observations. This would lead to a significant loss of
observations. Moreover, the estimators of the coefficients would be inconsistent since older
people and individuals with a low level of education are taken into account more often
(Wooldridge, 2009, 601). Another possibility might be the truncation of the data above the age
of likely educational completion (Holmes, 2003, 256). However, a truncated regression is intri-
cate as the age of likely educational completion can vary significantly, e.g. 16 or 25 years. The
19
higher the age limit, the more observations get lost. In any case, many younger observations
would get lost (Holmes, 2003, 256). A lower age limit would treat more individuals like uncen-
sored observations although they are still enrolled. Both possibilities do not adequately deal
with the censoring problem as they cause a non-random sample selection. Instead, individuals
who are still enrolled should be treated as incomplete observations. These individuals will
probably attain a higher level of education than they currently have.
Accounting for the censoring bias, we replace m3bq5 by several newly created dependent vari-
ables. First, we assume that an individual being enrolled during the previous academic year will
complete this level of education (abschluss) (King/Lillard, 1987, 169). Two problems may arise
with this dependent variable. Using abschluss can lead to biased estimates since not all individ-
uals will complete the educational level currently enrolled in. However, this effect might be
offset by other individuals completing further educational levels which we do not account for.
This is particularly relevant for younger children with lower educational levels, such as primary
school or basic school. Abschluss employs the same classification of educational levels as
m3bq5. Therefore, educational attainment is classified into eight ordered categories, ranging
from no education (0) to graduate school (7). When applying abschluss as dependent variable,
there might be a considerable gap between the actual level of educational attainment and the
level assigned by abschluss. One might imagine an 11-year-old child with a degree from primary
school being enrolled in the 5th grade. Using abschluss implies that this child has already com-
pleted basic school which is usually finished after the 9th grade. This may lead to a substantial
overestimation of future educational attainments of currently enrolled individuals.
In order to diminish this gap we develop years of education (sy) as another dependent variable.
Variable m3bq5 is converted into years of education while the number of years usually neces-
sary to complete an educational level is assigned to every individual. Hence, a degree from pri-
mary school represents four years of education, whereas a university degree sums up to 16
years of education. As half of the individuals surveyed have not finished education yet, we must
account for the censoring bias. Extra years of education are assigned to those individuals being
enrolled at the time of survey. We assume that an individual will complete the year of educa-
tion currently enrolled in. Hence, one year of education is additionally assigned to those en-
rolled. Although the gap between the actual level of educational attainment and the one as-
signed is reduced significantly by sy, future educational attainments of currently enrolled indi-
viduals might now be substantially underestimated. This leads to a significant bias against
20
younger individuals. To account for this problem, we apply a compromise solution between
abschluss and sy. In addition to sy, another year of education is assigned to individuals enrolled
at the time of the survey (sy1). Thus, five, six or nine years of education are assigned to the 11-
year-old child attending the 5th grade depending on whether we use sy, sy1 or abschluss. With
the help of these three dependent variables we try to capture the impact of the censored ob-
servations. Our model specification will be estimated with all dependent variables presented.
As mentioned previously, educational attainment can only be observed as a discrete variable
even if it might be continuous (Lillard/King, 1984, 7f.). So, it is necessary to take this into ac-
count. Using years of education (sy, sy1) as dependent variable, the data are additionally char-
acterized by probability spikes at completion levels since educational attainment is the out-
come of a series of ordered discrete choices (Maitra, 2003, 130; Glick/Sahn, 2000, 68). The
choice to proceed to the next educational level (e.g. secondary school or university) is likely to
differ from the choice to continue for an extra year once one has already started secondary
school or university (Glick/Sahn, 2000, 68). In order to account for such probability spikes the
application of an ordered probit specification seems reasonable since OLS causes biased esti-
mates (Maitra, 2003, 130; Holmes, 2003, 257; McKenzie/Rapoport, 2011, 1341).
Using our newly created dependent variables and excluding individuals below the age of 11, we
account for the censoring bias. In addition, another problem may arise since our specification
procedure treats every individual as an independent observation. Educational levels of house-
hold members are probably not independent of each other and might instead be positively cor-
related because of common family characteristics and similar attributes (Lillard/King, 1984, 6).2
As this correlation will lead to inconsistent estimates, we employ two dummy variables control-
ling for a low and high level of educational attainment of other household members, respec-
tively (ulevel/olevel). The variable ulevel is a dummy equal to 1 if there is at least one household
member other than the household head who attained less than five years of education and
who is currently not enrolled in an educational institution. The variable olevel is another dum-
my which is equal to 1 if there is at least one household member other than the household
head who attained more than 11 years of schooling. Since an average household in our sample
2 Several reasons for the non-independence between household members were given by Griliches (1979, S38). In literature, the impact of intra-family correlation on educational attainment ranges from remarkable family effects which lead to serious overestimation of the true returns to schooling to negligible effects exerting only little influ-ence on the estimates of the coefficients (Griliches, 1979, S58).
21
consists of 2.42 children under 15 years, the problem of intra-family correlation is of major im-
portance. By using both dummies we control for this possible correlation.
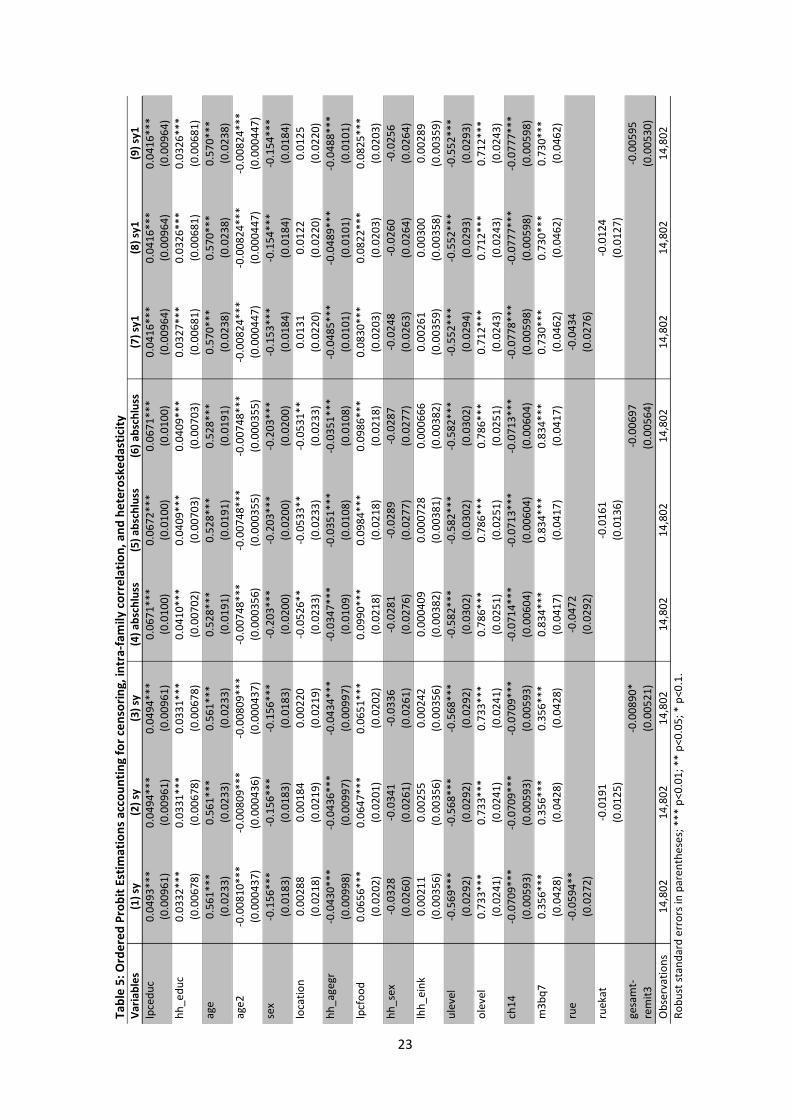
Table 5 presents results of our ordered probit estimations accounting for the censoring bias,
intra-family correlation, and heteroskedasticity. Using our newly created dependent variables
(sy, abschluss, sy1), we obtain similar results for all of them. The coefficients of our main varia-
bles of interest (rue, ruekat, gesamtremit3) slightly differ in magnitude and significance.3 Simi-
lar to the findings from our baseline estimation, we observe negative and partly significant (at
the 5 % level) coefficients for all measures of remittances. Accounting for intra-family correla-
tion, both variables show the expected sign and are highly significant at the 1 % level for all es-
timations. Thus, an individual’s educational attainment is significantly lower if there is a mem-
ber with an exceptionally low level of educational attainment in the household. In contrast, a
household member with more than 11 years of education significantly increases the individual’s
educational attainment. However, both variables (ulevel, olevel) take a lot of explanatory power
from hh_educ.
3 Our controls show the expected signs with the exception of a few variables. In contrast to our baseline results, we now observe a positive and highly significant impact of being enrolled in an educational institution (m3bq7) on educational attainment. This could be explained by the fact that we now control for the censoring bias by using newly created dependent variables. Accounting for intra-family correlation, censoring, and heteroskedasticity, the sign of the coefficient of hh_agegr changes. Educational attainment now decreases with age of the household head. The result is significant at the 1 % level. Furthermore, we cannot find a higher educational attainment for individuals from households with a female household head any longer. Instead, the coefficient is negative but not statistically significantly different from zero. Moreover, the significance of some coefficients has changed com-pared to our baseline specification. The impact of the labor income of the household head during the previous month (lhh_eink) on educational attainment remains positive but is not statistically significant anymore. The varia-ble location differs in sign and significance. Applying abschluss as dependent variable, the location of a household in a rural area is associated with lower levels of educational attainment. These findings are no longer valid using sy or sy1 as our dependent variable. One explanation might be that there are no significant differences between urban and rural areas when educational attainment is measured in years completed. Using completed degrees (m3bq5, abschluss) as measure of educational attainment, however, these differences become relevant.
22
Tabl
e 5:
Ord
ered
Pro
bit E
stim
atio
ns a
ccou
ntin
g fo
r cen
sorin
g, in
tra-
fam
ily c
orre
latio
n, a
nd h
eter
oske
dast
icity
Va
riabl
es
(1) s
y (2
) sy
(3) s
y
(4) a
bsch
luss
(5
) abs
chlu
ss
(6) a
bsch
luss
(7
) sy1
(8
) sy1
(9
) sy1
lp
cedu
c 0.
0493
***
0.04
94**
* 0.
0494
***
0.06
71**
* 0.
0672
***
0.06
71**
* 0.
0416
***
0.04
16**
* 0.
0416
***
(0
.009
61)
(0.0
0961
) (0
.009
61)
(0.0
100)
(0
.010
0)
(0.0
100)
(0
.009
64)
(0.0
0964
) (0
.009
64)
hh_e
duc
0.03
32**
* 0.
0331
***
0.03
31**
* 0.
0410
***
0.04
09**
* 0.
0409
***
0.03
27**
* 0.
0326
***
0.03
26**
*
(0.0
0678
) (0
.006
78)
(0.0
0678
) (0
.007
02)
(0.0
0703
) (0
.007
03)
(0.0
0681
) (0
.006
81)
(0.0
0681
) ag
e 0.
561*
**
0.56
1***
0.
561*
**
0.52
8***
0.
528*
**
0.52
8***
0.
570*
**
0.57
0***
0.
570*
**
(0
.023
3)
(0.0
233)
(0
.023
3)
(0.0
191)
(0
.019
1)
(0.0
191)
(0
.023
8)
(0.0
238)
(0
.023
8)
age2
-0
.008
10**
* -0
.008
09**
* -0
.008
09**
* -0
.007
48**
* -0
.007
48**
* -0
.007
48**
* -0
.008
24**
* -0
.008
24**
* -0
.008
24**
*
(0.0
0043
7)
(0.0
0043
6)
(0.0
0043
7)
(0.0
0035
6)
(0.0
0035
5)
(0.0
0035
5)
(0.0
0044
7)
(0.0
0044
7)
(0.0
0044
7)
sex
-0.1
56**
* -0
.156
***
-0.1
56**
* -0
.203
***
-0.2
03**
* -0
.203
***
-0.1
53**
* -0
.154
***
-0.1
54**
*
(0.0
183)
(0
.018
3)
(0.0
183)
(0
.020
0)
(0.0
200)
(0
.020
0)
(0.0
184)
(0
.018
4)
(0.0
184)
lo
catio
n 0.
0028
8 0.
0018
4 0.
0022
0 -0
.052
6**
-0.0
533*
* -0
.053
1**
0.01
31
0.01
22
0.01
25
(0
.021
8)
(0.0
219)
(0
.021
9)
(0.0
233)
(0
.023
3)
(0.0
233)
(0
.022
0)
(0.0
220)
(0
.022
0)
hh_a
gegr
-0
.043
0***
-0
.043
6***
-0
.043
4***
-0
.034
7***
-0
.035
1***
-0
.035
1***
-0
.048
5***
-0
.048
9***
-0
.048
8***
(0.0
0998
) (0
.009
97)
(0.0
0997
) (0
.010
9)
(0.0
108)
(0
.010
8)
(0.0
101)
(0
.010
1)
(0.0
101)
lp
cfoo
d 0.
0656
***
0.06
47**
* 0.
0651
***
0.09
90**
* 0.
0984
***
0.09
86**
* 0.
0830
***
0.08
22**
* 0.
0825
***
(0
.020
2)
(0.0
201)
(0
.020
2)
(0.0
218)
(0
.021
8)
(0.0
218)
(0
.020
3)
(0.0
203)
(0
.020
3)
hh_s
ex
-0.0
328
-0.0
341
-0.0
336
-0.0
281
-0.0
289
-0.0
287
-0.0
248
-0.0
260
-0.0
256
(0
.026
0)
(0.0
261)
(0
.026
1)
(0.0
276)
(0
.027
7)
(0.0
277)
(0
.026
3)
(0.0
264)
(0
.026
4)
lhh_
eink
0.
0021
1 0.
0025
5 0.
0024
2 0.
0004
09
0.00
0728
0.
0006
66
0.00
261
0.00
300
0.00
289
(0
.003
56)
(0.0
0356
) (0
.003
56)
(0.0
0382
) (0
.003
81)
(0.0
0382
) (0
.003
59)
(0.0
0358
) (0
.003
59)
ulev
el
-0.5
69**
* -0
.568
***
-0.5
68**
* -0
.582
***
-0.5
82**
* -0
.582
***
-0.5
52**
* -0
.552
***
-0.5
52**
*
(0.0
292)
(0
.029
2)
(0.0
292)
(0
.030
2)
(0.0
302)
(0
.030
2)
(0.0
294)
(0
.029
3)
(0.0
293)
ol
evel
0.
733*
**
0.73
3***
0.
733*
**
0.78
6***
0.
786*
**
0.78
6***
0.
712*
**
0.71
2***
0.
712*
**
(0
.024
1)
(0.0
241)
(0
.024
1)
(0.0
251)
(0
.025
1)
(0.0
251)
(0
.024
3)
(0.0
243)
(0
.024
3)
ch14
-0
.070
9***
-0
.070
9***
-0
.070
9***
-0
.071
4***
-0
.071
3***
-0
.071
3***
-0
.077
8***
-0
.077
7***
-0
.077
7***
(0.0
0593
) (0
.005
93)
(0.0
0593
) (0
.006
04)
(0.0
0604
) (0
.006
04)
(0.0
0598
) (0
.005
98)
(0.0
0598
) m
3bq7
0.
356*
**
0.35
6***
0.
356*
**
0.83
4***
0.
834*
**
0.83
4***
0.
730*
**
0.73
0***
0.
730*
**
(0
.042
8)
(0.0
428)
(0
.042
8)
(0.0
417)
(0
.041
7)
(0.0
417)
(0
.046
2)
(0.0
462)
(0
.046
2)
rue
-0.0
594*
*
-0
.047
2
-0
.043
4
(0.0
272)
(0
.029
2)
(0.0
276)
ru
ekat
-0.0
191
-0.0
161
-0.0
124
(0
.012
5)
(0.0
136)
(0
.012
7)
ge
sam
t-
-0.0
0890
*
-0
.006
97
-0.0
0595
re
mit3
(0
.005
21)
(0.0
0564
)
(0
.005
30)
Obs
erva
tions
14
,802
14
,802
14
,802
14
,802
14
,802
14
,802
14
,802
14
,802
14
,802
Ro
bust
stan
dard
err
ors i
n pa
rent
hese
s; *
** p
<0.0
1; *
* p<
0.05
; * p
<0.1
.
23
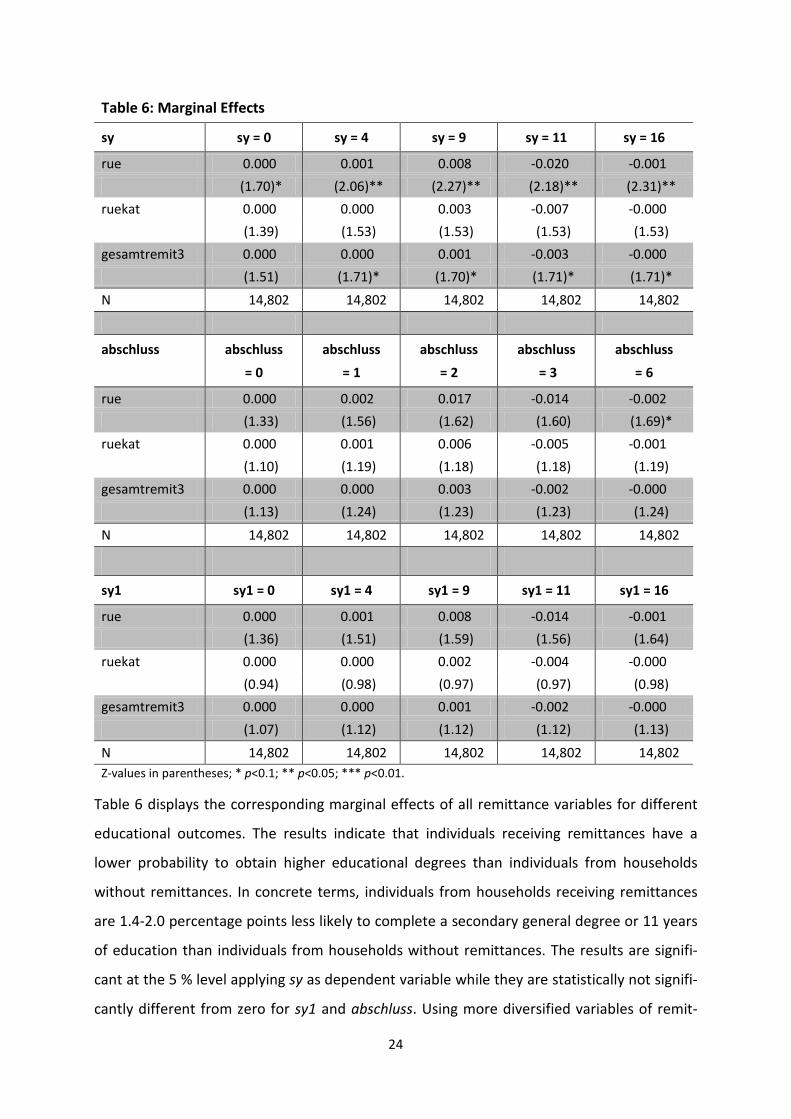
Table 6: Marginal Effects
sy sy = 0 sy = 4 sy = 9 sy = 11 sy = 16
rue 0.000 0.001 0.008 -0.020 -0.001 (1.70)* (2.06)** (2.27)** (2.18)** (2.31)** ruekat 0.000 0.000 0.003 -0.007 -0.000
(1.39) (1.53) (1.53) (1.53) (1.53) gesamtremit3 0.000 0.000 0.001 -0.003 -0.000
(1.51) (1.71)* (1.70)* (1.71)* (1.71)* N 14,802 14,802 14,802 14,802 14,802
abschluss
abschluss = 0
abschluss = 1
abschluss = 2
abschluss = 3
abschluss = 6
rue 0.000 0.002 0.017 -0.014 -0.002 (1.33) (1.56) (1.62) (1.60) (1.69)* ruekat 0.000 0.001 0.006 -0.005 -0.001
(1.10) (1.19) (1.18) (1.18) (1.19) gesamtremit3 0.000 0.000 0.003 -0.002 -0.000
(1.13) (1.24) (1.23) (1.23) (1.24)
N 14,802 14,802 14,802 14,802 14,802
sy1 sy1 = 0 sy1 = 4 sy1 = 9 sy1 = 11 sy1 = 16
rue 0.000 0.001 0.008 -0.014 -0.001 (1.36) (1.51) (1.59) (1.56) (1.64) ruekat 0.000 0.000 0.002 -0.004 -0.000
(0.94) (0.98) (0.97) (0.97) (0.98) gesamtremit3 0.000 0.000 0.001 -0.002 -0.000
(1.07) (1.12) (1.12) (1.12) (1.13)
N 14,802 14,802 14,802 14,802 14,802 Z-values in parentheses; * p<0.1; ** p<0.05; *** p<0.01.
Table 6 displays the corresponding marginal effects of all remittance variables for different
educational outcomes. The results indicate that individuals receiving remittances have a
lower probability to obtain higher educational degrees than individuals from households
without remittances. In concrete terms, individuals from households receiving remittances
are 1.4-2.0 percentage points less likely to complete a secondary general degree or 11 years
of education than individuals from households without remittances. The results are signifi-
cant at the 5 % level applying sy as dependent variable while they are statistically not signifi-
cantly different from zero for sy1 and abschluss. Using more diversified variables of remit-
24
tances (ruekat, gesamtremit3), we still observe a 0.2-0.7 percentage point lower probability
of completing a secondary general degree or 11 years of education for individuals from
households receiving remittances. These findings are significant at the 10 % level for sy. We
obtain similar results for attaining a university degree or 16 years of education. The marginal
effects of all remittance variables are negative but smaller in magnitude implying an up to
0.2 percentage point lower probability of completing university for individuals from house-
holds receiving remittances. The results are significant at the 10 % level only for sy and ab-
schluss.
For mandatory levels of education, however, the calculations of the marginal effects show a
different picture. Thus, individuals from households receiving remittances now have a 0.8-
1.7 percentage point higher probability to complete basic school or nine years of education
than individuals from households without remittances. The results are significant at the 5 %
level for sy while they are statistically not significantly different from zero for sy1 and ab-
schluss. Applying ruekat and gesamtremit3, the effects remain positive but small in magni-
tude and significant at the 10 % level only for sy. As a consequence, we observe that receiv-
ing remittances increases the probability of completing mandatory levels of schooling but
hinders the attainment of higher levels of education. This is in line with findings from our
baseline regression indicating that remittances are partially spent for investments as long as
education is mandatory. Once education becomes voluntary remittances impede the at-
tainment of higher educational levels.
Accounting for the censoring bias, intra-family correlation, and heteroskedasticity, we obtain
negative and partly significant coefficients for our main variable of interest for non-
mandatory levels of education. The remittance variables show a diminishing impact in mag-
nitude the more diversified they are. Whether a household receives remittances plays a ma-
jor role for educational outcomes of the members while the concrete amount of remittances
received has only little impact on educational attainment.
Thus, we cannot confirm the hypothesis that remittances generally lead to higher invest-
ments in education. Our results indicate that this is only true for mandatory levels of educa-
tion. Instead, for non-mandatory levels of education individuals from households receiving
remittances show lower levels of education compared to individuals from households with-
out remittances. These findings imply that households with migrants have stronger prefer-
25
ences for the present than for the future as they invest less in education as soon as educa-
tion becomes voluntary.
Instrumental Variable Estimation
Our estimations could be confronted with endogeneity problems and reverse causality be-
tween the remittance variable and educational attainment leading to inconsistent estima-
tors. To account for these aspects, we apply an instrumental variable estimation. Using the
size of migration networks at the community level (hh_psushare), we instrument the differ-
ent measures of remittances (rue, ruekat, gesamtremit3) which are supposed to be endoge-
nous. We obtain a negative and highly significant effect of our instrument on the remittance
variables. The findings imply that a higher proportion of households in a population point
having migrants abroad lowers the probability and the amount of remittances sent home.
This could be explained with the insurance motive of remittances (Amuedo-Dorantes/Pozo,
2006). A lack of networks generally increases the migrant’s income uncertainty since net-
works serve as a safety net. With the help of remittances labor migrants may insure this in-
come risk in two different ways. They on the one hand might remit for reasons of family-
provided insurance as they expect to have a secure place at home when they are in need.
The migrants on the other hand might remit to accumulate precautionary savings in order to
be prepared for worsening work opportunities in the host country (Amuedo-Dorantes/Pozo,
2006, 244). As a result, the authors found out that increases in income risk raise the propen-
sity to remit and the proportion of earnings sent home as remittances (Amuedo-
Dorantes/Pozo, 2006, 243). These results are applicable to our case because households
from communities with a large proportion of households having migrants abroad have a
lower probability and receive lower amounts of remittances. As these households do not
experience a lack of networks, the insurance motive of remittances is of minor importance
for them.
In a first step, we have to check whether our instrumented regressors are endogenous at all.
Previous research (Maitra, 2003; Adams/Cuecuecha, 2010; Hanson/Woodruff, 2003) has
shown that the problem of endogenous regressors is highly relevant for this topic. Compar-
ing the coefficients of our variable of interest points at considerable differences between the
baseline estimations and the 2SLS regression. Hence, we suspect endogeneity of our remit-
tance variable. A Durbin-Wu-Hausman test for endogeneity leads to an F statistic of 1.56
26
using sy as dependent variable. Thus, we cannot reject the null hypothesis that the regres-
sors are exogenous. Applying sy1, we can reject the null hypothesis at the 10 % level. Our
findings indicate that sy and abschluss are not endogenous while sy1 seems to be endoge-
nous. As we cannot make a clear distinction whether our remittance variables are endoge-
nous or not running IV estimations appears to be reasonable.
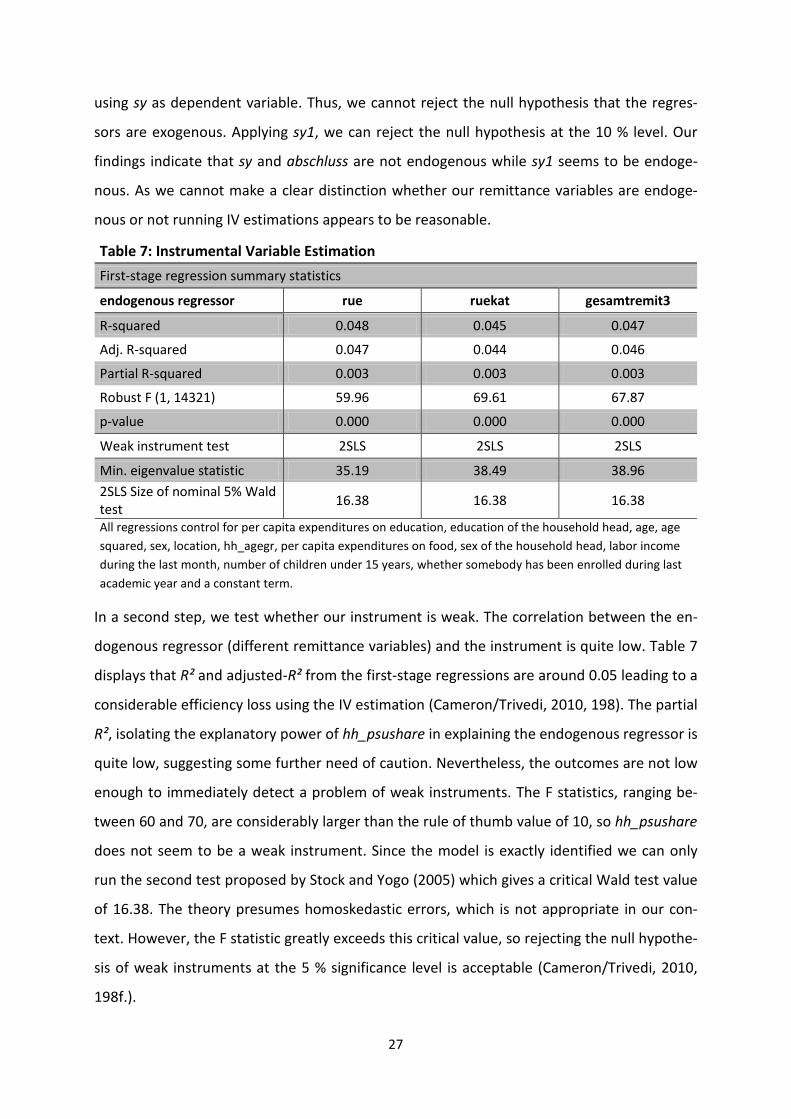
Table 7: Instrumental Variable Estimation
First-stage regression summary statistics
endogenous regressor rue ruekat gesamtremit3
R-squared 0.048 0.045 0.047
Adj. R-squared 0.047 0.044 0.046
Partial R-squared 0.003 0.003 0.003
Robust F (1, 14321) 59.96 69.61 67.87
p-value 0.000 0.000 0.000
Weak instrument test 2SLS 2SLS 2SLS
Min. eigenvalue statistic 35.19 38.49 38.96 2SLS Size of nominal 5% Wald test 16.38 16.38 16.38
All regressions control for per capita expenditures on education, education of the household head, age, age squared, sex, location, hh_agegr, per capita expenditures on food, sex of the household head, labor income during the last month, number of children under 15 years, whether somebody has been enrolled during last academic year and a constant term.
In a second step, we test whether our instrument is weak. The correlation between the en-
dogenous regressor (different remittance variables) and the instrument is quite low. Table 7
displays that R² and adjusted-R² from the first-stage regressions are around 0.05 leading to a
considerable efficiency loss using the IV estimation (Cameron/Trivedi, 2010, 198). The partial
R², isolating the explanatory power of hh_psushare in explaining the endogenous regressor is
quite low, suggesting some further need of caution. Nevertheless, the outcomes are not low
enough to immediately detect a problem of weak instruments. The F statistics, ranging be-
tween 60 and 70, are considerably larger than the rule of thumb value of 10, so hh_psushare
does not seem to be a weak instrument. Since the model is exactly identified we can only
run the second test proposed by Stock and Yogo (2005) which gives a critical Wald test value
of 16.38. The theory presumes homoskedastic errors, which is not appropriate in our con-
text. However, the F statistic greatly exceeds this critical value, so rejecting the null hypothe-
sis of weak instruments at the 5 % significance level is acceptable (Cameron/Trivedi, 2010,
198f.).
27
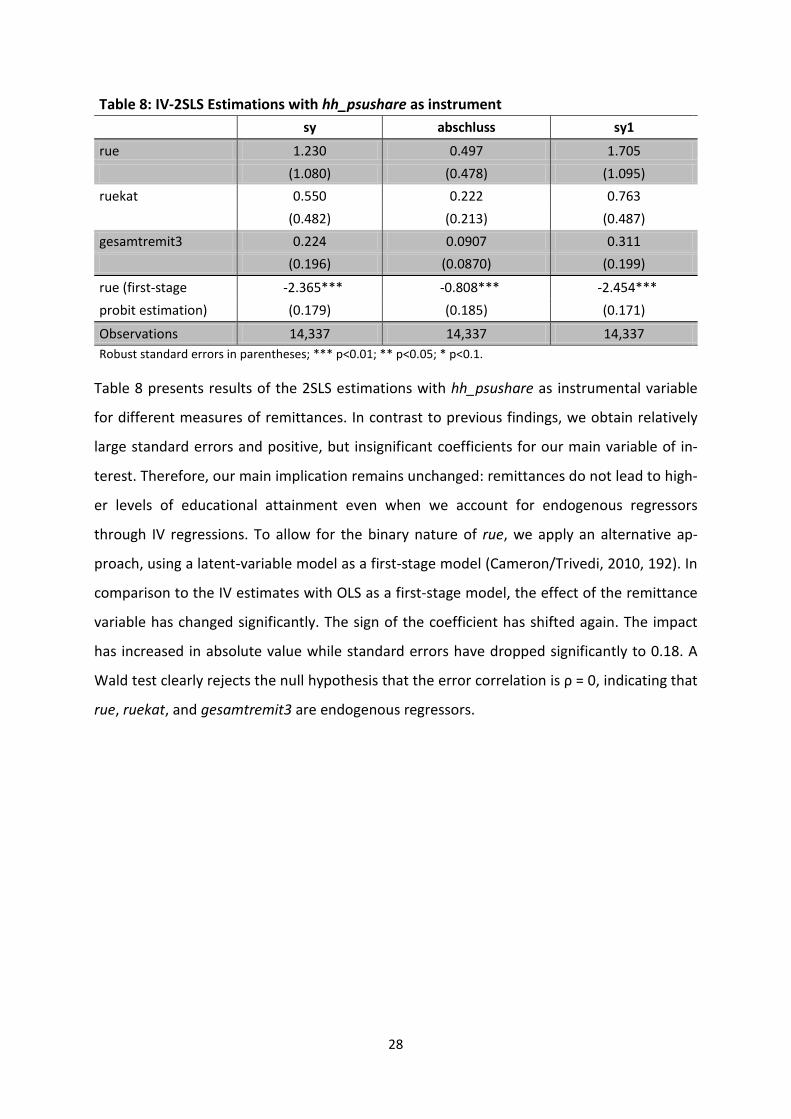
Table 8: IV-2SLS Estimations with hh_psushare as instrument sy abschluss sy1
rue 1.230 0.497 1.705 (1.080) (0.478) (1.095) ruekat 0.550 0.222 0.763 (0.482) (0.213) (0.487) gesamtremit3 0.224 0.0907 0.311 (0.196) (0.0870) (0.199)
rue (first-stage -2.365*** -0.808*** -2.454*** probit estimation) (0.179) (0.185) (0.171)
Observations 14,337 14,337 14,337 Robust standard errors in parentheses; *** p<0.01; ** p<0.05; * p<0.1.
Table 8 presents results of the 2SLS estimations with hh_psushare as instrumental variable
for different measures of remittances. In contrast to previous findings, we obtain relatively
large standard errors and positive, but insignificant coefficients for our main variable of in-
terest. Therefore, our main implication remains unchanged: remittances do not lead to high-
er levels of educational attainment even when we account for endogenous regressors
through IV regressions. To allow for the binary nature of rue, we apply an alternative ap-
proach, using a latent-variable model as a first-stage model (Cameron/Trivedi, 2010, 192). In
comparison to the IV estimates with OLS as a first-stage model, the effect of the remittance
variable has changed significantly. The sign of the coefficient has shifted again. The impact
has increased in absolute value while standard errors have dropped significantly to 0.18. A
Wald test clearly rejects the null hypothesis that the error correlation is ρ = 0, indicating that
rue, ruekat, and gesamtremit3 are endogenous regressors.
28
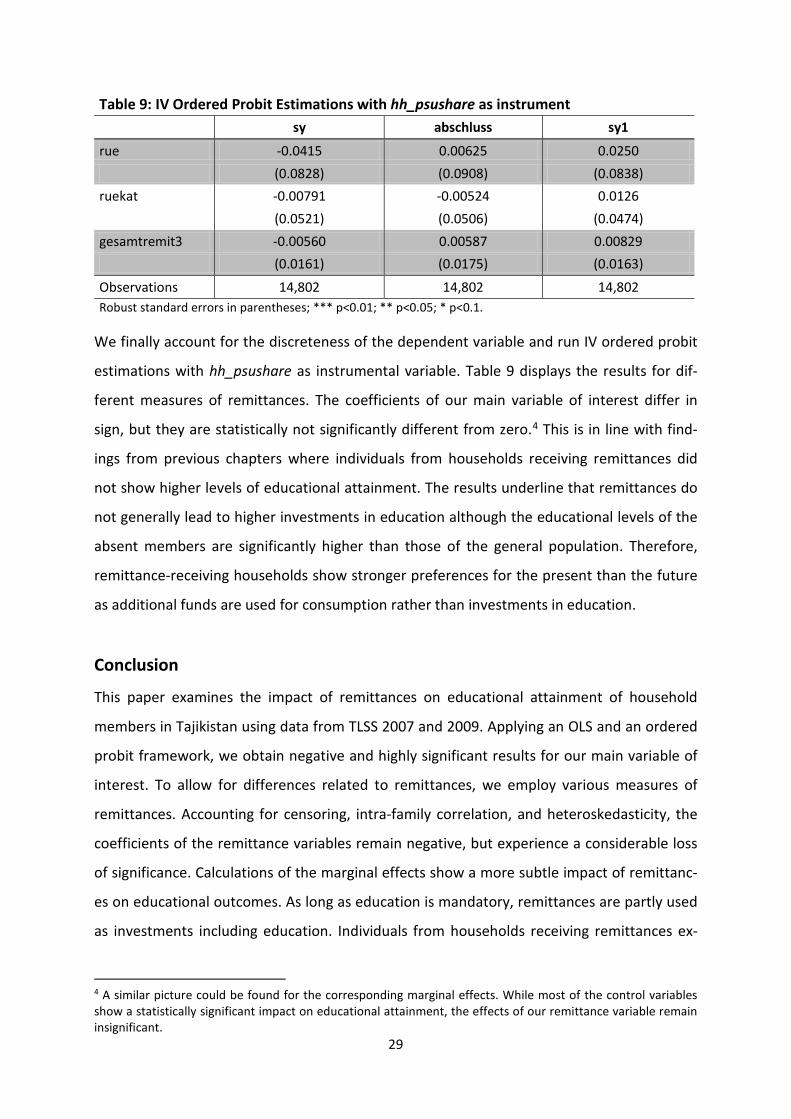
Table 9: IV Ordered Probit Estimations with hh_psushare as instrument sy abschluss sy1
rue -0.0415 0.00625 0.0250 (0.0828) (0.0908) (0.0838) ruekat -0.00791 -0.00524 0.0126 (0.0521) (0.0506) (0.0474) gesamtremit3 -0.00560 0.00587 0.00829 (0.0161) (0.0175) (0.0163)
Observations 14,802 14,802 14,802 Robust standard errors in parentheses; *** p<0.01; ** p<0.05; * p<0.1.
We finally account for the discreteness of the dependent variable and run IV ordered probit
estimations with hh_psushare as instrumental variable. Table 9 displays the results for dif-
ferent measures of remittances. The coefficients of our main variable of interest differ in
sign, but they are statistically not significantly different from zero.4 This is in line with find-
ings from previous chapters where individuals from households receiving remittances did
not show higher levels of educational attainment. The results underline that remittances do
not generally lead to higher investments in education although the educational levels of the
absent members are significantly higher than those of the general population. Therefore,
remittance-receiving households show stronger preferences for the present than the future
as additional funds are used for consumption rather than investments in education.
Conclusion
This paper examines the impact of remittances on educational attainment of household
members in Tajikistan using data from TLSS 2007 and 2009. Applying an OLS and an ordered
probit framework, we obtain negative and highly significant results for our main variable of
interest. To allow for differences related to remittances, we employ various measures of
remittances. Accounting for censoring, intra-family correlation, and heteroskedasticity, the
coefficients of the remittance variables remain negative, but experience a considerable loss
of significance. Calculations of the marginal effects show a more subtle impact of remittanc-
es on educational outcomes. As long as education is mandatory, remittances are partly used
as investments including education. Individuals from households receiving remittances ex-
4 A similar picture could be found for the corresponding marginal effects. While most of the control variables show a statistically significant impact on educational attainment, the effects of our remittance variable remain insignificant.
29
hibit higher educational outcomes than those from households without remittances. For
higher, non-mandatory levels of education, however, remittances hinder investments in ed-
ucation, leading to lower levels of educational attainment for individuals from remittance-
receiving households. This might be the case since the return to further education is far ex-
ceeded by the return to working abroad. Additionally, migration networks increase oppor-
tunity costs of staying in school since the entry to foreign labor markets becomes easier.
Therefore, individuals from households receiving remittances quit education earlier in order
to migrate. Applying instrumental variable estimations, we obtain large standard errors and
positive coefficients for our main variable of interest. The results, however, are statistically
not significantly different from zero. Hence, our main implication remains unchanged: we
cannot find a positive impact of remittances sent to Tajikistan on educational attainment of
household members for non-mandatory levels of schooling.
Investments in human capital play an important role in promoting sustainable economic de-
velopment. In this context, remittances can serve as a private source of funding particularly
with regard to the high relevance for the Tajik economy. The present paper attempts to
identify the impact of remittances on human capital accumulation. The findings, however,
indicate that households rarely use means available through remittances to enhance in-
vestments in education of younger household members. Instead, remittances are rather
used as a coping strategy to satisfy basic levels of consumption (Clément, 2011). These re-
sults suggest that financial constraints are still very high in Tajikistan, forcing households to
cover daily needs.
Although many studies find a positive impact of remittances on education, there is still some
concern regarding the effects of migration on human capital formation. Therefore, one poli-
cy solution would be to increase public expenditures on education. As a result, the quality of
the educational system might improve while disincentives of schooling would decrease and
returns to education would rise. This could help encouraging households to invest in the
education of younger household members.
30

Acknowledgements
The author would like to thank Mustafa Çoban, Klaus Gründler, and Martin Schmitz for their
comments on earlier versions of the paper. Julia Schreiber provided valuable research assis-
tance.
31
References
ACOSTA, P. (2011): School Attendance, Child Labour, and Remittances from International
Migration from El Salvador, Journal of Development Studies, Vol. 47(6), pp. 913-936.
ADAMS, R.H./CUECUECHA, A. (2010): Remittances, Household Expenditure and Investment
in Guatemala, World Development, Vol. 38(11), pp. 1626-1641.
AMUEDO-DORANTES, C./GEORGES, A./POZO, S. (2010): Migration, Remittances, and Chil-
dren’s Schooling in Haiti, The ANNALS of the American Academy of Political and Social Sci-
ence, Vol. 630(1), pp. 224-244.
AMUEDO-DORANTES, C./POZO, S. (2006): Remittances as insurance: evidence from Mexican
immigrants, Journal of Population Economics, Vol. 19(2), pp. 227-254.
BANSAK, C./CHEZUM, B. (2009): How Do Remittances Affect Human Capital Formation of
School-Age Boys and Girls?, The American Economic Review: Papers & Proceedings, Vol.
99(2), pp. 145-148.
BARRO, R./LEE, J.W. (2013): Educational Attainment Dataset, URL:
http://www.barrolee.com/ , last visited: 11.12.2013.
BEHRMAN, J.R./WOLFE, B.L. (1984): The socioeconomic impact of schooling in a developing
country, The Review of Economics and Statistics, Vol. 66(2), pp. 296-303.
BENNETT, R./CLIFFORD, D./FALKINGHAM, J. (2013): Household Members’ Migration and the
Education of Children ’Left Behind’: Empirical Findings from Tajikistan and Reflections for
Research Practice, Population, Space and Place, Vol. 19(1), pp. 1-14.
CAMERON, A.C./TRIVEDI,K. (2010): Microeconometrics Using Stata, Stata Press.
CARRINGTON, W.J./DETRAGIACHE, E./VISHWANATH,T. (1996): Migration with Endogenous
Moving Costs, The American Economic Review, Vol. 86(4), pp. 909-930.
CHAMI, R./FULLENKAMP, C./JAHJAH, S. (2005): Are Immigrant Remittance Flows a Source of
Capital for Development?, IMF Staff Papers, Vol. 52(1), pp. 55-81.
CHIQUIAR, D./HANSON, G.H. (2005): International Migration, Self-Selection, and the Distri-
bution of Wages: Evidence from Mexico and the United States, Journal of Political Economy,
Vol. 113(2), pp. 239-281.
CLÉMENT, M. (2011): Remittances and Household Expenditure Patterns in Tajikistan: A Pro-
pensity Score Matching Analysis, Asian Development Review, Vol. 28(2), pp. 58-87.
32
COX EDWARDS, A./URETA, M. (2003): International Migration, Remittances, and Schooling:
Evidence from El Salvador, Journal of Development Economics, Vol. 72(2), pp. 429-461.
DANZER, A.M./IVASCHENKO, O. (2010): Migration Patterns in a remittances dependent
economy: Evidence from Tajikistan during the global financial crisis, Migration Letters, Vol.
7(2), pp. 190-202.
DUSTMANN, C./GLITZ, A. (2011): Migration and Education, Norface Migration Discussion
Paper No. 2011-11.
GLICK, P./SAHN, D.E. (2000): Schooling of girls and boys in a West African country: the ef-
fects of parental education, income, and household structure, Economics of Education Re-
view, Vol. 19(1), pp. 63-87.
GRILICHES, Z. (1979): Sibling Models and Data in Economics: Beginnings of a Survey, Journal
of Political Economy, Vol. 87(5), pp. S37-S64.
HANSON, G.H./WOODRUFF, C. (2003): Emigration and Educational Attainment in Mexico,
Mimeo, University of California at San Diego.
HOLMES, J. (2003): Measuring the determinants of school completion in Pakistan: analysis of
censoring and selection bias, Economics of Education Review, Vol. 22(3), pp. 249-264.
IMF (2005): Republic of Tajikistan: Selected Issues and Statistical Appendix, IMF Country Re-
port No. 05/131.
IMF (2001): Republic of Tajikistan: Statistical Appendix, IMF Country Report No. 01/69.
JUSTINO, P./SHEMYAKINA, O.N. (2012): Remittances and labor supply in post-conflict Tajiki-
stan, IZA Journal of Labor & Development, Vol. 1(8).
KING, E.M./LILLARD, L.A. (1987): Education Policy and Schooling Attainment in Malaysia and
the Philippines, Economics of Education Review, Vol. 6(2), pp. 167-181.
KUMO, K. (2012): Tajik Labour Migrants and their Remittances: Is Tajik Migration Pro-Poor?,
Post-Communist Economies, Vol. 24(1), pp. 87-109.
LILLARD, L.A./KING, E.M. (1984): Methods for Analyzing Schooling Choice with Household
Survey Data, A RAND Note N–1963–AID.
LUCAS, R.E.B./STARK, O. (1985): Motivations to Remit: Evidence from Botswana, Journal of
Political Economy, Vol. 93(5), pp. 901-918.
MAITRA, P. (2003): Schooling and Educational Attainment: Evidence from Bangladesh, Edu-
cation Economics, Vol. 11(2), pp. 129-153.
33
MARE, R.D. (1980): Social Background and School Continuation Decisions, Journal of the
American Statistical Association, Vol. 75(370), pp. 295-305.
McKENZIE, D./RAPOPORT, H. (2011): Can migration reduce educational attainment? Evi-
dence from Mexico, Journal of Population Economics, Vol. 24(4), pp. 1331-1358.
McKENZIE, D./SASIN, M.J. (2007): Migration, Remittances, Poverty, and Human Capital: Con-
ceptual and empirical challenges, World Bank Policy Research Working Paper No. 4272.
MUNSHI, K. (2003): Networks in the Modern Economy: Mexican Migrants in the U.S. Labor
Market, The Quarterly Journal of Economics, Vol. 118(2), pp. 549-599.
NGUYEN, T./PURNAMASARI, R. (2011): Impacts of International Migration and Remittances
on Child Outcomes and Labor Supply in Indonesia, World Bank Policy Research Working Pa-
per No. 5591.
PAL, S. (2004): Child Schooling in Peru: Evidence from a sequential analysis of school pro-
gression, Journal of Population Economics, Vol. 17(4), pp. 657-680.
RAPOPORT, H./DOCQUIER, F. (2005): The Economics of Migrants’ Remittances, IZA Discus-
sion Paper No. 1531.
REPUBLIC OF TAJIKISTAN (2007): National Development Strategy of the Republic of Tajikistan
for the Period to 2015, Dushanbe.
SHEMYAKINA, O. (2006): The Effect of Armed Conflict on Accumulation of Schooling: Results
from Tajikistan, HiCN Working Paper No. 12.
SJAASTAD, L. (1962): The costs and returns of human migration, Journal of Political Economy,
Vol. 70(5), pp. 80-93.
TAJIKISTAN STATE STATISTICAL COMMITTEE (2013a): Implementation of state budget 2000–
2008, URL: http://www.stat.tj/english/tables.htm , last visited: 11.12.2013.
TAJIKISTAN STATE STATISTICAL COMMITTEE (2013b): Average monthly wages by sector
1985–2008, URL: http://www.stat.tj/english/tables.htm , last visited: 11.12.2013.
UMAROV, H. (2010): Tadzhikskaya trudovaya migratsiya v usloviyakh global’nogo fi-
nansovogo krizisa: pritshiny i posledstviya, [Tajik labor migration during the global financial
crisis: reasons and implications], research lecture, International Organization of Migration.
WOOLDRIDGE, J.M. (2010): Econometric Analysis of Cross Section and Panel Data, 2nd ed.,
MIT Press.
WOOLDRIDGE, J.M. (2009): Introductory Econometrics: A Modern Approach, 4th ed., South
Western.
34
WORLD BANK (2008): Tajikistan Living Standards Measurement Survey 2007 – Basic Infor-
mation Document.
WORLD BANK (2010): Tajikistan Living Standards Measurement Survey 2009 – Notes for Us-
ers.
WORLD BANK (2013a): Workers Remittances Database, URL:
http://databank.worldbank.org/data/home.aspx , last visited: 11.12.2013.
WORLD BANK (2013b): World Development Indicators: school enrollment, URL:
http://databank.worldbank.org/data/home.aspx , last visited: 11.12.2013.
WORLD BANK (2013c): World Development Indicators: literacy rate, URL:
http://databank.worldbank.org/data/home.aspx , last visited: 11.12.2013.
WORLD BANK (2013d): World Development Indicators: poverty headcount ratio at national
poverty line (% of population), URL: http://databank.worldbank.org/data/home.aspx , last
visited: 11.12.2013.
ZHUNIO, M./VISHWASRAO, S./CHIANG, E. (2012): The Influence of Remittances on Education
and Health Outcomes: A Cross-Country Study, Applied Economics, Vol. 44(35), pp. 4605-
4616.
35