relative house price dynamics across euro area and us cities
TRANSCRIPT

Work ing PaPer Ser i e Sno 1206 / J une 2010
relative houSe
Price dynamicS
acroSS euro area
and uS citieS
convergence or
divergence?
by Paul Hiebert and Moreno Roma

WORKING PAPER SER IESNO 1206 / JUNE 2010
In 2010 all ECB publications
feature a motif taken from the
€500 banknote.
RELATIVE HOUSE PRICE DYNAMICS
ACROSS EURO AREA
AND US CITIES
CONVERGENCE OR DIVERGENCE? 1
by Paul Hiebert and Moreno Roma 2
1 We would like to thank Concha Artola and Martin Eiglsperger for valuable advice at the outset of this project, as well as Philippe de Rougemont,
Joseph Gyourko, Monika Piazzesi and Philip Vermeulen for insightful advice and discussions.
All errors in this paper are the sole responsibility of the authors.
2 Both authors: European Central Bank, Kaiserstrasse 29, 60311 Frankfurt am Main, Germany,
e-mail: [email protected] and [email protected]
This paper can be downloaded without charge from http://www.ecb.europa.eu or from the Social Science Research Network electronic library at http://ssrn.com/abstract_id=1616616.
NOTE: This Working Paper should not be reported as representing the views of the European Central Bank (ECB). The views expressed are those of the authors
and do not necessarily reflect those of the ECB.

© European Central Bank, 2010
AddressKaiserstrasse 2960311 Frankfurt am Main, Germany
Postal addressPostfach 16 03 1960066 Frankfurt am Main, Germany
Telephone+49 69 1344 0
Internethttp://www.ecb.europa.eu
Fax+49 69 1344 6000
All rights reserved.
Any reproduction, publication and reprint in the form of a different publication, whether printed or produced electronically, in whole or in part, is permitted only with the explicit written authorisation of the ECB or the authors.
Information on all of the papers published in the ECB Working Paper Series can be found on the ECB’s website, http://www.ecb.europa.eu/pub/scientific/wps/date/html/index.en.html
ISSN 1725-2806 (online)

3ECB
Working Paper Series No 1206June 2010
Abstract 4
Non-technical summary 5
1 Introduction 7
2 Frameworks for regional house price analysis and existing results 8
3 Stylised facts on city-level house price dynamics 10
4 Methodology 12
4.1 Variable selection 12
4.2 Generating a database of city-level dispersion 13
4.3 Specifi cation of panel regression 14
5 Results 14
5.1 Testing for price level convergence to national level 15
5.2 Analysing regional house price dispersion in panel data framework 16
6 Conclusions 18
References 20
Appendices 22
Tables and fi gures 23
CONTENTS

4ECBWorking Paper Series No 1206June 2010
Abstract
This paper examines the time varying dispersion in city house pricelevels across the four biggest euro area countries compared with thosein the United States. Using available city-level data over the period
plaining price differentials in a panel regression framework including
limited evidence of convergence in city-level house prices despite syn-chronised cycles in the national aggregates for most countries since the1990s. There is an important role for income differentials in explain-ing city-level house price dispersion in Germany, France, and the US(but not in Italy or Spain once unobserved city factors are taken intoaccount). At the same time, population differences across cities playa role, though this appears to be associated with amenities specific toa particular location. In general, there has been a lower dispersion ofcity-level house prices in the four largest euro area economies comparedwith the US in conjunction with a lower estimated income elasticity forhouse price differentials. The results, particularly for income, appearto be robust to restricting the analysis to large urban centres.
Key words: House price convergence, house price dispersion, houseprice drivers, panel data analysis.
JEL classification: R21, R31, E31.
per capita income, population and relative distances. Results indicate
1987-2008, it tests for price convergence and analyses key factors ex-
5ECB
Working Paper Series No 1206June 2010
Non-technical summary
House prices are driven by many factors related both to housing’s role asa consumption good and asset. These factors influence the extent to whichhouse price convergence across locations would be expected at the city levelthrough time. On the one hand, housing as a consumption good has a verystrong non-traded component in the form of land and labour, with only asmall traded component in the form of, for instance, construction materials.This would limit the prospect of price convergence across geographic regions,except possibly in the long run to the extent that income –or productivitylevels– converge across geographic areas, or in areas where housing has astrong tradable component. In such an environment, city-level house priceswould be expected to mainly reflect local factors such as regional per capitaincome, amenities or population dynamics.
On the other hand, price convergence in house prices might rise over shortertime periods given, inter alia, common movements across various regions inhousing fundamentals (such as income) at a business cycle or longer termfrequency, concurrent changes or convergence in borrowing conditions asso-ciated with housing acquisition and, on the asset pricing side, the correlationof housing risk premia in its role as an asset class across regions. Indeed,housing risk premia –or the higher expected return accrued for bearing riskon specific to owning a house– should consist of both a market risk compo-nent generally associated with housing assets (which could co-move acrossregions as the desirability of this asset class varies) and an idiosyncratic riskcomponent (associated with any particular house). Moreover, as with otherasset classes, house prices should contain some information on expected fu-ture returns on the basis of foreseen developments in fundamentals, poten-tially implying a higher volatility in house prices than current local income.Any comovement in house prices across regions may be particularly relevantin currency unions, given expected convergence linked to policies, as well aslinkages in trade, financial markets and some correlation in general economicconditions.
This paper examines the behaviour of city house price levels across the four
and compares their evolution with those in the United States. It first assessesthe extent to which house price levels have been evolving across cities in thelargest countries of the euro area, and the countries themselves, relative tothe US. Secondly, it examines the key local factors explaining differentials incity house price levels in a panel regression framework, using available dataon the dynamics of per capita income, population and distances betweencities.
The analysis indicates limited evidence of long-run convergence in city-level
biggest euro area countries using available data over the period 1987-2008,
6ECBWorking Paper Series No 1206June 2010
house prices for the euro area or the US. Indeed, there appears to havebeen a varied pattern dispersion of city-level house prices in contrast tofairly similar cycles in the national indices for many (though not all) largeeuro area countries and the US since the 1990s. In general, however, therehas been a lower dispersion of city level house prices in the four largest euroarea economies compared with the US. A rise in the dispersion of house pricedifferences across city pairs has been observed in recent years for Germany,Italy and the US, in contrast to a decline in Spain and France. The resultsof the panel regression indicate an important role for income in explainingcity-level house price dispersion in Germany, France, and the US (but notItaly or Spain when unobserved city factors are taken into account). Atthe same time, population differences across cities play a role in explaininghouse price differentials, though this appears to be associated with city-level amenities. The results, particularly for income, appear to be robust tochanging the sample composition to encompass only large urban centres.
There are several caveats to the analysis, notably relating to the represen-tativeness and comparability of house price data at the city level along withan incomplete list of explanatory factors – economic and financial factors, aswell as the role of policies and preferences – hampered by data unavailability.These caveats notwithstanding, this analysis provides some new evidence onthe dynamics of city-level house prices in the euro area compared with theUS which, given that national housing markets are inherently a functionof local markets, may help contribute to a better understanding of moregeneralised house price dynamics.

7ECB
Working Paper Series No 1206June 2010
1 Introduction
The spatial distributions of house prices at the city level, and their dynamicevolution, are driven by many factors related both to housing’s role as aconsumption good and asset. On the one hand, housing as a consump-tion good has a very strong non-traded component in the form of land andlabour, with only a small traded component in the form of, for instance,construction materials. This would limit the prospect of price convergenceacross geographic regions, except possibly in the long run to the extentthat income –or productivity levels– converge across geographic areas, orin areas where housing has a strong tradable component. In such an envi-ronment, city-level house prices would be expected to mainly reflect localfactors such as regional per capita income, amenities or population dynam-ics. On the other hand, price convergence in house prices might, however,nonetheless arise over shorter time periods given, inter alia, common move-ments across various regions in housing fundamentals (such as income) at abusiness cycle or longer term frequency, concurrent changes or convergencein borrowing conditions associated with housing acquisition and, on the as-set pricing side, the correlation of housing risk premia in its role as an assetclass across regions. Indeed, housing risk premia –or the higher expectedreturn accrued for bearing risk on specific to owning a house– should consistof both a market risk component generally associated with housing assets(which could co-move across regions as the desirability of this asset classvaries) and an idiosyncratic risk component (associated with any particularhouse). Moreover, as with other asset classes, house prices should containsome information on expected future returns on the basis of foreseen devel-opments in fundamentals, potentially implying a higher volatility in houseprices than current local income. Any comovement in house prices acrossregions may be particularly relevant in currency unions, given expected con-vergence linked to policies, as well as linkages in trade, financial markets andsome correlation in general economic conditions.
This paper examines the behaviour of city house price levels across the four
and compares their evolution with those in the United States. It first assessesthe extent to which house price levels have been converging across cities inthe largest countries of the euro area, and the countries themselves, relativeto the US. Secondly, it examines the key local factors explaining differentialsin city house price levels in a panel regression framework, using available dataon the dynamics of per capita income, population and distances betweencities.
The analysis indicates limited evidence of long-run convergence in city-levelhouse prices for the euro area or the US. Indeed, there appears to have beena varied pattern dispersion of city-level house prices in contrast to fairly
biggest euro area countries using available data over the period 1987-2008,
8ECBWorking Paper Series No 1206June 2010
similar cycles in the national indices for many (though not all) large euroarea countries and the US since the 1990s. In general, however, there hasbeen a lower dispersion of city level house prices in the four largest euro areaeconomies compared with the US. The results of the panel regression indicatean important role for income in explaining city-level house price dispersion inGermany, France, and the US (but not Italy or Spain when unobserved cityfactors are taken into account). At the same time, population differencesacross cities play a role in explaining house price differentials, though thisappears to be associated with city-level amenities. The results, particularlyfor income, appear to be robust to changing the sample composition toencompass only large urban centres.
In the remainder of the paper, a review of frameworks for regional houseprice analysis, along with a review of results, is presented in Section 2. Somestylised facts for the five countries analysed are then presented in Section 3.A presentation of the empirical strategy and results follows in Sections 4and Section 5, respectively. Finally, some concluding remarks are containedin Section 6.
2 Frameworks for regional house price analysis andexisting results
One classic approach to modelling the evolution of regional house pricesis the framework of Rosen (1979) and Roback (1982). In this approach,wages (or productivity), amenities (physical or other attributes specific toa location such as weather, green space, proximity to the sea/lake/river,crime, etc.), and the user cost of housing play a key difference in generatingconditions whereby consumers are indifferent across space at all points intime. Glaeser and Gyourko (2006) build on this framework in developing amore up-to-date dynamic model of house prices.
The above approach would not suggest a strong likelihood of house price con-vergence apart from that deriving from the convergence of its main demanddeterminants. Indeed, housing has a strong consumption good componentwhich is not tradable across geographic areas, given the immovability ofthe property location (and limited associated arbitrage possibilities). Whilethere is some traded component of housing in the form of raw material costs,construction and other costs might also differ by location.1
There are, however, several arguments why house prices may converge acrossregions. First, housing demand fundamentals such as income or interestrates may converge across regions – both in a shorter term or transitory
1Tax and regulatory considerations might also be region specific, thereby contributingto limit price convergence.
9ECB
Working Paper Series No 1206June 2010
manner (possibly associated with the “lift all boats” aspects of an economiccycle) and a longer term or permanent manner (as productivity levels con-verge). Even in the case that standard housing demand fundamentals donot converge, housing risk premia may nonetheless correlate across regionsin the case that a general market risk component of housing as an asset classco-move across regions as the desirability of this asset class varies (indepen-dent of either an idiosyncratic risk component associated with any particularhouse, or of fundamentals at the local level).2 Moreover, as with other as-set classes, house prices should contain some information on expected futurereturns on the basis of foreseen developments, including convergence, in fun-damentals. Indeed, some papers have suggested that convergence in houseprices might be expected as shocks to regional house prices “ripple out”across the economy on account of factors such as migration, equity transfer,spatial arbitrage and spatial patterns in the determinants of house prices –see, for instance, the application to house prices in the United Kingdom ofMeen (1999).
The evidence on actual house price convergence across regions in Europe atthe country level is mixed, while any analysis at the city level appears to bequite scarce apart from some studies of the United Kingdom. On the onehand, Holly, Pesaran, and Yamagata (2010) find on the basis of a dynamicprice diffusion model with error correction that shocks to a dominant region(London) are propagated to other regions, albeit with a delay. Moreover,they find that cointegration test results can be thought of as generally sup-porting error correction formulations for regional house prices in UK cities.On the other hand, Holmes and Grimes (2008) investigate the long-run con-vergence of regional house prices in the UK, and find the presence of multiplestochastic trends with, at best, very weak evidence of long-run convergence.Using a principal components methodology, they find that regional houseprices in the United Kingdom are driven by a single common stochastic trendand they can be regarded as exhibiting convergence in the long-run, even ifthe speed of adjustment towards long run equilibrium is low. For Europemore generally, Smullen and MacDonald (2006) argue that convergence ofprices has been occurring in Europe over the last ten years, notably in Ger-many, Italy, France, and Spain. At the same time, they observe that whilethere have been some developments in relation to market harmonization,the diversity of legal, tax, regulatory, and especially cultural and behavioralaspects of the different marketplaces is so large that this convergence trendis likely to be weak for the foreseeable future. At the euro area countrylevel, Vansteenkiste and Hiebert (2009) find that house price spillovers aresmall in the euro area compared with those across states in the US. For the
2Indeed, “cluster” traders at different points in house price booms may exert influenceon general price dynamics not strictly related to fundamentals, see for instance Piazzesiand Schneider (2009).
10ECBWorking Paper Series No 1206June 2010
US, Clark and Coggin (2009) find only mixed evidence for regional conver-gence amongst cities on the basis of a unobserved components structuraltime series analysis between 1975 and 2005.
While there is limited literature on house price convergence in continentalEurope, studies examining convergence in tradable goods are quite numer-ous. Bergin and Glick (2007) find significant time-variation in the degreeof convergence of global prices for goods and services over the last fifteenyears. Specifically, there appears to be a general U-shaped pattern withprice dispersion first falling and then rising in recent years, a pattern diffi-cult to explain in terms of the standard gravity equation variables commonin the literature. Rogers (2005) provides evidence of a striking decline indispersion for traded good prices across European cities, most of which tookplace prior to the launch of the euro. As a result, dispersion in the euroarea is now more similar to that in the US. Bundesbank (2009) report thatduring the past ten years, there has been, if at all, only a moderate tendencyto further convergence in prices of goods and services in the euro area. Atthe industry level, Goldberg and Verboven (2005) find strong evidence ofconvergence towards both the absolute and the relative versions of the Lawof One Price based on European car market data.
3 Stylised facts on city-level house price dynamics
A detailed description of the database used in the descriptive and econo-metric analysis is provided in Appendix A. It is worth noting that nationalsources are used to assemble a novel database for house price data at the citylevel across euro area countries. Two points should be mentioned. First, theuse of national sources may pose some limits of comparability across coun-tries. Second, the cities included in the sample for a given country may notbe fully representative of price developments in that country due to possiblelimited coverage3 and/or diverging price developments. For example, Span-ish cities included in the sample exhibited higher price increases than thenational average throughout the sample period analysed.
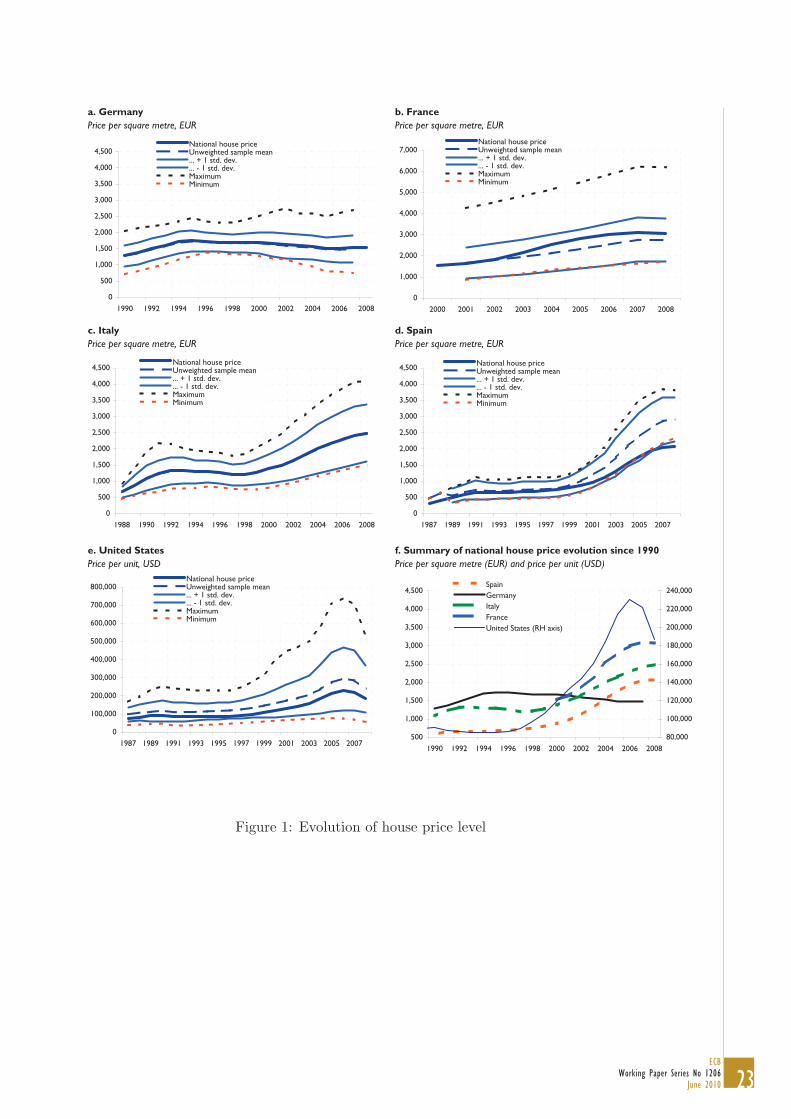
Since 1990, house prices have exhibited remarkably similar cycles in citieswithin the 4 largest euro area countries and the US. Following a stagnationin the level of city-level house prices for a decade at their 1990 level across allof the countries analysed, there was a correlated increase thereafter acrossall countries with the exception of Germany (see Figure 1, Panel f ). By2006-8, national house prices had peaked 135% from their 2000 value in
3As indicated in Muzzicato, Sabbatini, and Zollino (2008), the weight in the generalindex for Italy of large cities such as Milan and Rome is only of the order of around 5%each, based on the share on total dwellings in 2001 among all municipalities included inthe index.

11ECB
Working Paper Series No 1206June 2010
Spain, 100% in France, and 75% in Italy. National house prices in the USincreased by a similar amount to France –by around 93%– over the sameperiod. In contrast, house prices at the national level in Germany fell byaround 11.5%.
These movements in the national index, however, were associated with con-siderable heterogeneity in house price levels at the city level within eachrespective country. Whereas a more or less constant wedge in France ex-isted between 2000 and 2008, as measured by the large dispersion betweenthe maximum house price and minimum house price as well as the standarddeviation, dispersion across cities appears to have grown over the period inall other countries analysed – that is, Germany, Italy, Spain, and the US.
Indeed, examining house price levels in 2006, there were markedly differinglevels amongst cities within the euro area countries – though the dispersionbetween maximum and minimum paled in comparison with the US (seeFigure 2). In Germany, the average house price in Munich in 2006 was31
4 times above its counterpart in Magdeburg. In France, the average houseprice in Paris in 2006 was 33
4 times above its counterpart in Limoges. InItaly, the average house price in Venice in 2006 was close to 3 times aboveits counterpart in Palermo. In Spain, the average house price in Madrid in2006 was 13
4 times above its counterpart in Valencia. In the US, however,the average house price dispersion was considerably more marked than inany of the euro area countries, with average house prices in San Franciscoin 2006 nearly 10 times above their counterpart in Detroit. The relativelylarger dispersion in US city prices, though per unit and not per square metre,nonetheless hint at a stronger role for heterogeneity in the average city levelhousing supply elasticity to housing demand shocks compared with the euroarea.
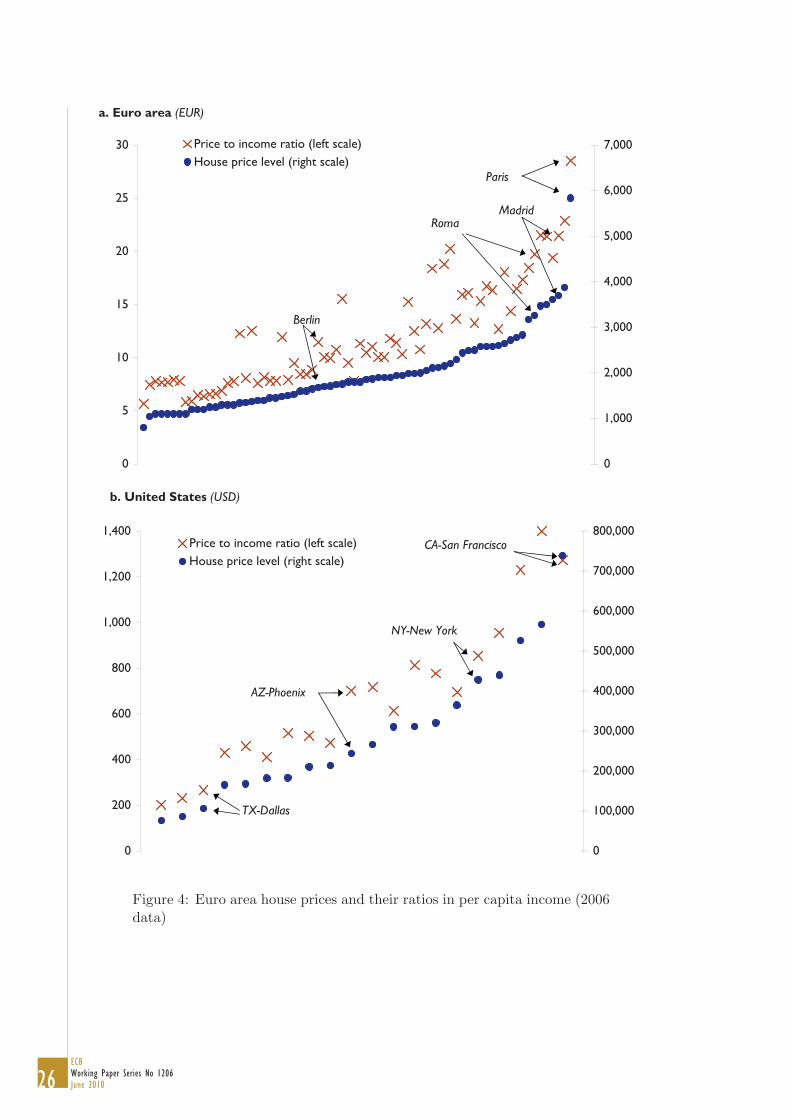
Regional per capita income appears to be an important determinant of city-level house prices across all four of the euro area countries analysed. Thescatter plot contained in Figure 3 would suggest a positive relationship be-tween regional income and city level house prices in 2006 for both the euroarea countries and the US. Within the countries, it would seem that thereis a rather strong positive implied trend between city level house prices andregional income in Germany, Spain and the US, a positive relationship withsome clustering in Italy (corresponding largely with a geographic North-South distinction), and a fairly limited relationship in France (with Parisbeing a clear outlier). Comparing an ordinal ranking of house price levels tohouse price to income ratios, however, it would appear that regional incomealone is not sufficient to explain the relative level of city house prices acrossall four of the euro area countries analysed. Figure 4, which contains anordinal ranking in 2006 of city-level house price levels (denoted with dots)with their corresponding house price to income ratios (denoted with an“X”),indicates that a clean linear mapping does not exist between house price-

12ECBWorking Paper Series No 1206June 2010
income ratios and house price levels for either the euro area (upper panelof the Figure) or the US (lower panel). As indicated in Figure 3, the rela-tionship of city level house prices to regional income, however, appears tohave been more robust than the corresponding relationship with populationin either the euro area or the US.
More generally, the higher-order moments of the distribution of city levelhouse prices appears to have been only loosely linked to regional income.Examining the evolution of the distribution of standardised city level houseprices and regional income levels in the euro area between 2001 and 2006(see top panel of Figure 5), there was a flattening in the distribution ofcity level house price levels in the euro area countries over the period, incontrast to a tightening of the distribution of income. This correspondedto both an increase in the dispersion of house prices across cities as wellas a more positive skew. Comparing these distributions with those of theUS, there was a similar flattening in the house price distribution, thoughit would appear that regional house price levels are generally much moredispersed in the US. This latter structural feature could be taken to suggesta possible role of heterogeneous supply elasticity as well as higher labourmarket mobility in driving regional house price developments in the USwhen compared with the euro area. As for income developments, there wasa small increase in divergence over the period in the US in contrast to theconvergence witnessed in the euro area cities analysed.
4 Methodology
This section presents details of the methodology followed to generate vari-ables used in the analysis of city-level house prices in the four largest euroarea countries and the US. It begins with a brief overview of the variablesused in the analysis.4 It then details the methodology used to generate adatabase of bilateral city pairs. Lastly, it presents the empirical specificationused in generating the panel regression results in Section 5.
4.1 Variable selection
We compare house price level differences across cities among the differentcountries in order to answer whether geographical mobility, decreasing fi-nancial market frictions and increasing market integration have been ac-companied by declining price dispersion.
House prices are empirically modelled as a function of several determinants– per capita income, population, distances between cities and amenities
4For more on data sources, see Appendix A.
13ECB
Working Paper Series No 1206June 2010
that are assumed to be time-invariant in a fixed effects panel regressionframework– in a spatial equilibrium framework in the spirit of the modelsdiscussed in Section 2. Per capita income has a clear rationale as the maindeterminant of housing affordability. Population also contains informationrelevant to housing demand and its effects on prices through changes indensity or agglomeration. These two determinants, which can be predom-inantly classified as housing demand determinants, albeit with some influ-ence on housing supply, are partly chosen on the basis of data availability forcity-level analysis for the euro area countries analysed. In addition to percapita income and population, explicit measures of distances between citiesare also added to gauge both the geographic propensity for price shock ef-fects “rippling out” across urban centres as well as the possibility of housingsubstitution between adjoining districts.
While the above list of explanatory factors does not include all relevant vari-ables for regional house price determination, other variables might a prioribe expected to have a limited effect. For instance, one component of the usercost of housing with presumably large effects and which fluctuates most overtime would tend to be the after-tax mortgage rate, which have been rathersimilar across regions in the largest euro area countries over the last yearsand, at any rate, show little within-country variation.5 Likewise, thoughGlaeser, Gyourko, and Saiz (2008) argue that varying degrees of housingsupply elasticity is important for explaining the dynamics of city level houseprice developments in the US, housing supply is not modelled here for lackof data availability but is nonetheless likely to be more uniformly inelasticin euro area metropolitan areas than in cities within the US.
4.2 Generating a database of city-level dispersion
The variables are analysed in spatially differenced form in order to assessfactors underlying house price dispersion. This definition of the variablesallows for stationary data which can be tested for convergence and clustering.For the tests of convergence, city-level house prices are compared with thecorresponding national index. For the panel data econometric analysis, wedefine price dispersion across cities as the difference (logs of) of relative houseprices – following the exposition of Bergin and Glick (2007). Specifically,let pi,t be the price of a unit of housing in city i at time t, where all pricesare expressed in local currency. For a given city pair (i, j), the relative pricedifference at time t in percentage terms (where lower case denotes logs) is:
qij,t = pi,t − pj,t (1)5Time series for other relevant variables in the user cost of housing, such as local tax
rates, city-specific depreciation, and information on expectations of house price apprecia-tion, are unfortunately difficult to obtain at the city level.
14ECBWorking Paper Series No 1206June 2010
In this way, we define the average price dispersion at time t for the citypair (i, j) as qi,j .6 The same city-level difference transformation is made forincome per capita and population. Distances are, naturally, constant acrosscity pairs.
As there is obviously a symmetric matrix of potential city pairs, we onlyanalyse one observation within each set, leading to N(N−1)/2 observations.Ultimately, there are potentially N(N − 1)/2 city pairs in the euro area, forup to 19 annual observations. Thus, the sample consists of 2, 485 staticobservations of dispersion among city pairs for the euro area countries anal-ysed, compared with 190 static observations of dispersion among city pairsfor the cities analysed in the US. The resulting length when taking into ac-count the number of dynamic observations –based on varying time series–is reported in Table 2.
4.3 Specification of panel regression
We estimate the equation below for all the possible city pairs within Ger-many, Italy, France, Spain and the US. We then pool the data for the fourlargest euro area countries and estimate the same specification for a pooledeuro area sample. In this specification, qij,t is the relative price difference attime t in percentage terms (note that lower case letters denote logs), distijis the distance across city pairs, popij,t is the relative population differenceat time t in percentage terms and incij,t is the relative income difference attime t in percentage terms. eij,t is an error term.
qij,t = α0 + α1distij + α2popij,t + α3incij,t + eij,t (2)
Standard errors are clustered at the city pair level to address potential prob-lems of heteroskedasticity and autocorrelation in the error terms.7
5 Results
This section reports the results of the empirical investigation of city-levelhouse prices in the four biggest euro area countries and the US. It focusesfirst on the convergence of house prices across cities in the four largest euroarea countries (Germany, Spain, France, and Italy) and compares this paceof convergence with that witnessed within cities across the US, in the spirit
6There is also the possibility of obtaining mean squared differences across regions asdone in Bergin and Glick (2007), which did not greatly influence the results.
7All estimation is done using STATA 9.0. Clustering at the country pair level allowsthe variance to differ across pairs while permitting an unstructured covariance within theclusters to control for correlation across time.

15ECB
Working Paper Series No 1206June 2010
of the methodology used in Engel and Rogers (2004) and Bergin and Glick(2007). A panel regression is then run on annual city-level house price dataspanning the period 1990 to 2007 (the latter subject to data availability),examining time-varying features of data series likely related to price disper-sion, such as income, population and geographic distance, and relating pricedispersion between cities to these factors.
5.1 Testing for price level convergence to national level
Several panel unit root tests are performed to test price convergence in eachof the euro area countries examined and in the US (Levin, Lin & Chu, Im,Pesaran & Shin, Augmented Dickey-Fuller and Phillips-Perron). For eachcountry, the log of nation-wide house prices is used as a numeraire. For eachcity, a dynamic relative price difference (in logarithms) between city houseprices and nation-wide prices is computed. In all tests reported, the nullhypothesis is the presence of non-stationarity (i.e. a unit root). A rejectionof the null hypothesis of non-stationarity is generally interpreted as priceconvergence or at least an indication that relative prices return to a fixedvalue in the long-run.
Results for the formal tests of price convergence are reported in Table 1.8
In Germany and Spain there is generally no indication of price convergence.Results for France, generally pointing to price convergence, have to be cau-tiously interpreted given the shorter time span of the sample (8 years) com-pared to the other countries. In Italy there is an indication of convergenceand that relative prices tend to be fairly anchored within the sample periodexamined. This notwithstanding, a clustering of relative house prices be-tween cities in the North of the country (exhibiting higher relative prices)and cities in the South (with lower relative prices) is evident and does notdisappear over time. For the US, results are not conclusive, as the PhilippsPerron test does not indicate convergence while the other three tests pointin the opposite direction. Moreover, results for the US, contrary to thosefor the euro area countries, are not robust to changes in the lag specificationand therefore do not allow for firm conclusions.
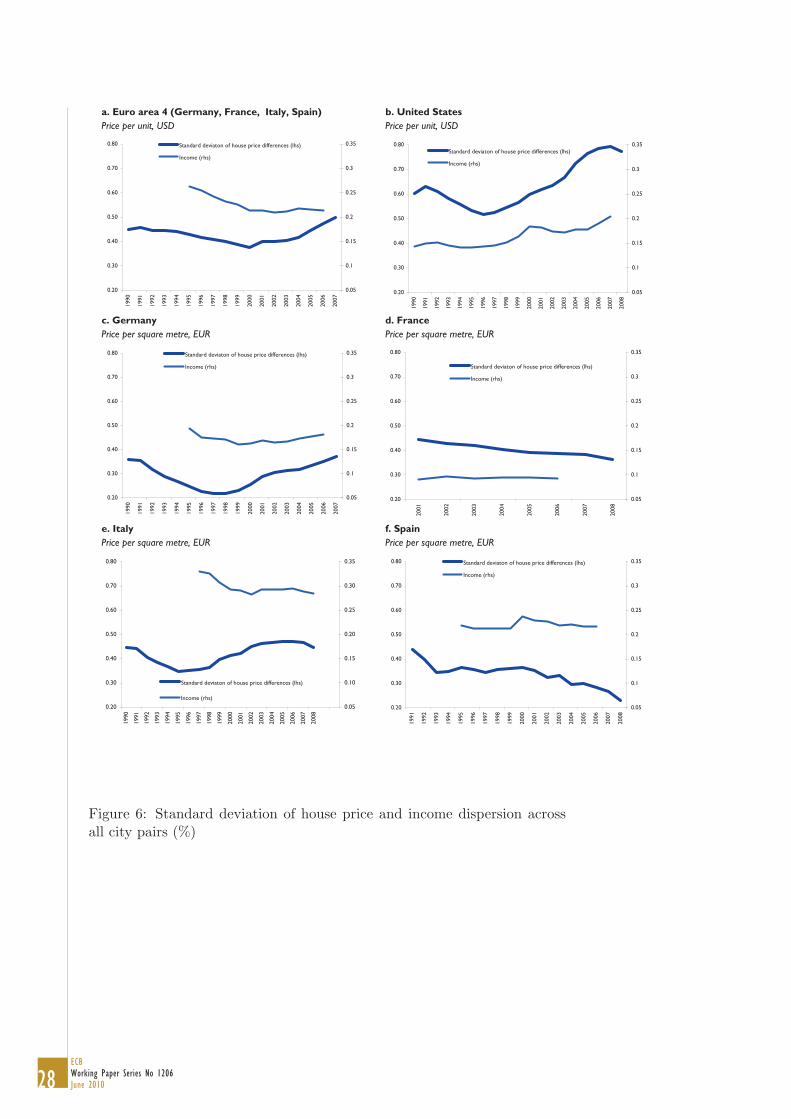
Given issues related to the low power of unit root tests in finite samples(see Carvalho and Harvey (2005) and Pesaran (2007)), the results can besupplemented with a review of graphical evidence on the time variation in thedispersion of city-level price levels by country. Figure 6, which contains thestandard deviation of large euro area and within-country city pairs, suggestsa rise in the dispersion of house price differences across city pairs in recentyears for Germany, Italy and the US, in contrast to Spain and France. That
8The panel unit root tests include a constant and the lag length structure of the testhas been chosen by an automatic Schwarz selection criteria.

16ECBWorking Paper Series No 1206June 2010
said, a “U-shaped” pattern in Germany, with falling city-level house pricedispersion in the 1990s followed by rising dispersion thereafter, may suggestsome role of unification for convergence of house prices in east Germany towest German levels in the earlier period. More generally, the dispersion ofthe US city pairs appears to be considerably higher on average than thedispersion in euro area countries –consistent with the static representationfor 2006 in Figure 2– despite a relatively lower dispersion in regional income.
All in all, these results for large euro area countries and the US are broadly inline with Holmes and Grimes (2008), who document weak evidence of long-run convergence in regional house prices in the UK and a general lack ofconsensus in the literature on this topic. More recently, Holly, Pesaran, andYamagata (2010) using an error correction framework find mixed evidenceon convergence of house prices across UK regions relative to London.
5.2 Analysing regional house price dispersion in panel dataframework
Table 2a presents estimation results of an OLS specification of equation 2 in-cluding time and city dummies. Results of a pooled sample of the four euroarea countries analysed are followed by results for individual countries (Ger-many, Italy, France, Spain and the US). The estimation yields the followingfindings:
• The distance across city pairs is generally not statistically significantin the country specifications and in the pooled estimation. A priori,being housing a non tradable good, distances across locations, whichin gravity models proxy (fixed) transportation costs (see Bergin andGlick (2007)), would not be expected to explain relative house pricesacross city pairs. Beyond this, results not do not support the idea ofhousing substitution across adjoining districts.
• The coefficient associated with differences in populations across citypairs is always positive but statistically significant at the 1% level onlyin Germany, France and in the pooled euro area sample. This wouldsuggest that bigger cities exhibit higher house prices, as graphicallyshown in Figure 3.
• The coefficient associated with income differentials across city pairs isalso positive and statistically significant (generally at the 1% level).As expected, positive income differentials across city pairs, which arerelated to productivity 9and wage differentials, should attract flowsof workers thus pushing up housing demand and in turn house prices
9See Kahn (2010) for a discussion of the link between productivity and house prices.

17ECB
Working Paper Series No 1206June 2010
(see Nieuwerburg and Weill (2006)). The magnitude of the incomecoefficient, i.e. the elasticity of relative house price differentials to rel-ative income differentials, is close to but below 1 in the euro areacountries and in the pooled sample, but larger in the US (above 2).10
This could reflect an extended period of stronger regional house pricevariation within the US sample period examined, culminated with thesubprime crisis, indicating that relative house price changes exceededcorresponding income dynamics. Indeed, Glaeser, Gyourko, and Saiz(2008) suggest that heterogeneous housing supply elasticities acrossUS cities has contributed to price bubbles in certain regions but notothers depending on whether quantities are constrained in response todemand shocks.
Table 2b presents the results for the same specification discussed above usinga fixed-effects estimation with time and city dummies. As previously dis-cussed, this estimation methodology allows taking into account unobservabletime-invariant characteristics which are believed to influence relative houseprice differentials over time. Among these unobservable components areamenities/disamenities associated with a certain location (infrastructure,supply of green areas, pollution or lack of it, crime rates etc) as well ascity specific characteristics (such as weather conditions). The importance ofthese unobserved factors is confirmed by the fact that some of the countryspecific results slightly differ from the OLS one. More specifically, for thepooled euro area countries and the US the results of the fixed effects estima-tion are broadly in line with the OLS. Moreover, the estimated coefficientsfor the US are similar to the OLS one while for the pooled euro area samplethey are larger. The estimation results indicate:
• At the country level, the coefficient associated with differences in pop-ulations across city pairs is positive and statistically significant at the10% level only in Germany. It is however not statistically significantin the other three euro area countries. This would suggest that (inItaly, France, Spain as well as in the US) differences in population donot provide information in explaining relative prices at the city levelonce the unobserved characteristics discussed above are taken into ac-count.11 Differences in populations across cities are indeed likely to becorrelated to local amenities/disamenities. Moreover, population mayembed some information on supply elasticities: Green, Malpezzi, andMayo (2005) find that population is one of the key supply determinantsat the metropolitan level in the US.
10For the pooled euro area specification, it is possible that there is a role of differingborrowing conditions across countries in determining the extent of house price convergence.
11This stands somewhat in contrast to the finding at the national level in Spain by Milesand Pillonca (2008).
18ECBWorking Paper Series No 1206June 2010
• Income differentials continue however to be a driving factor in explain-ing relative house price differentials in all countries except in Italy andSpain where the coefficients are not statistically significant. For thecase of Italy, this would be consistent with the finding of Miles andPillonca (2008), who find evidence of only a modest real income con-tribution to house prices changes over the period 1996-2006.
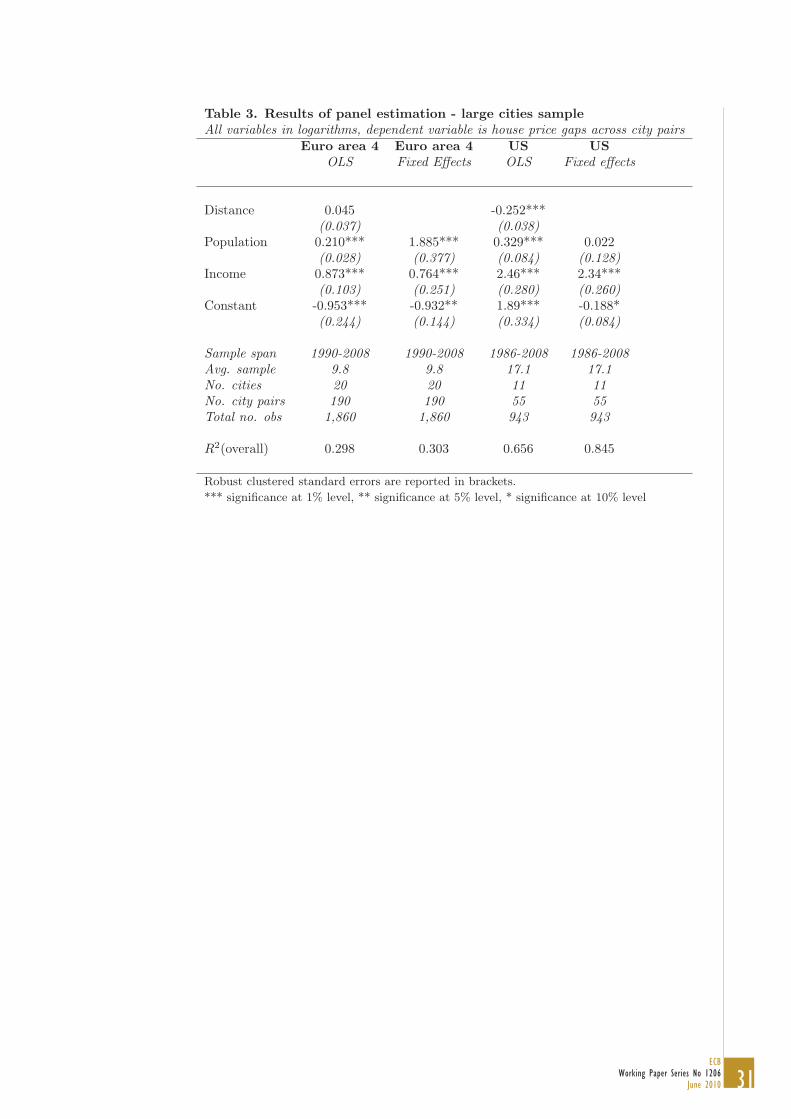
Finally, we have estimated the same specifications discussed above bothwith OLS and fixed effects for a sample of large cities for the pooled euroarea (including cities above 600,000 inhabitants) and for the US (includingmetropolitan areas with a population above 4 million).12 Results for theeuro area are confirmed (see Table 3). Interestingly, the elasticity of relativeprices to relative income for the fixed effect specification is lower for thesample of euro area larger cities (0.76 versus 1.56) pointing to more subduedchanges in relative prices for a given income differential within this sampleof more homogenous cities in terms of income level. Results for the USpanel of larger metropolitan areas indicate that population differentials ispositively related to price differential (in the OLS) while it continues to beinsignificant in the fixed effect estimation. Surprisingly, the coefficient forthe distance across cities is negative and statistically significant. Finally, thecoefficient associated with income differential is remarkably stable in termsof size (above 2) and statistical significance across all the specifications andsamples examined.
6 Conclusions
This paper examined the behaviour of city house price levels across the four
comparing their evolution with those in the US. The analysis indicates lim-ited evidence of long-run convergence in city-level house prices for the euroarea or the US. Indeed, there appears to have been a varied pattern dis-persion of city-level house prices in contrast to fairly similar cycles in thenational indices for many (though not all) large euro area countries and theUS since the 1990s. In general, however, there has been a lower dispersion ofcity level house prices in the four largest euro area economies compared withthe US. The results of the panel regression indicate an important role for in-come differentials in explaining city-level house price dispersion in Germany,France, and the US (but not Italy or Spain when unobserved city factors aretaken into account). At the same time, population differences across citiesplay a role in explaining house price differentials, though this appears to be
12In larger cities, arbitrage may be more likely given a larger proportion of foreignpopulation.
biggest euro area countries using available data over the period 1987-2008,

19ECB
Working Paper Series No 1206June 2010
associated with city-level amenities. The results, particularly for income,appear to be robust to changing the sample composition to encompass onlylarge urban centres.
There are several caveats to the analysis, notably relating to the represen-tativeness and comparability of house price data at the city level along withan incomplete list of explanatory factors – economic and financial factors, aswell as the role of policies and preferences – hampered by data unavailability.These caveats notwithstanding, this analysis provides some new evidence onthe dynamics of city-level house prices in the euro area compared with theUS which, given that national housing markets are inherently a functionof local markets, may help contribute to a better understanding of moregeneralised house price dynamics.
20ECBWorking Paper Series No 1206June 2010
References
Bergin, P. R., and R. Glick (2007): “Global price dispersion: Are pricesconverging or diverging?,” Journal of International Money and Finance,26, 703–729.
Bundesbank, D. (2009): “Price convergence in the euro area,” DeutscheBundesbank Monthly Report (March).
Carvalho, V. M., and A. C. Harvey (2005): “Growth, cycles and con-vergence in US regional time series,” International Journal of Forecasting,21.
Clark, S. P., and T. D. Coggin (2009): “Trends, Cycles and Conver-gence in U.S. Regional House Prices,” Journal of Real Estate Finance andEconomics, 39.
Engel, C., and J. H. Rogers (2004): “European product market inte-gration after the euro,” Economic Policy, 19(39), 347–384.
Glaeser, E. L., and J. Gyourko (2006): “Housing dynamics,” NBERWorking Paper No. 12787 (December).
Glaeser, E. L., J. Gyourko, and A. Saiz (2008): “Housing Supply andHousing Bubbles,” Journal of Urban Economics, 64(2), 198–217.
Goldberg, P. K., and F. Verboven (2005): “Market integration andconvergence to the Law of One Price: evidence from the European carmarket,” Journal of International Economics, 65(1), 49–73.
Green, R. K., S. Malpezzi, and S. K. Mayo (2005): “Metropolitan-Specific Estimates of the Price Elasticity of Supply of Housing, and TheirSources,” American Economic Review, 95(2), 334–339.
Holly, S., H. Pesaran, and T. Yamagata (2010): “Spatial and Tempo-ral Diffusion of House Prices in the UK,” CES-IFO Working Paper No.2913.
Holmes, M., and A. Grimes (2008): “Is there long-run convergenceamong regional house prices in the UK?,” Urban Studies, 45(8), 1531–1544.
Kahn, J. A. (2010): “Productivity Swings and Housing Prices,” FederalReserve Bank of New York Current Issues (July), 15.
Meen, G. (1999): “Regional House Prices and the Ripple Effect: A NewInterpretation,” Housing Studies, 14(6), 733–53.
21ECB
Working Paper Series No 1206June 2010
Miles, D., and V. Pillonca (2008): “Financial innovation and Euro-pean housing and mortgage markets,” Oxford Review of Economic Policy,24(1), 145–175.
Muzzicato, S., R. Sabbatini, and F. Zollino (2008): “Prices of Resi-dential Property in Italy: Constructing a New Indicator,” Bank of ItalyOccasional Paper No. 17.
Nieuwerburg, S. V., and P.-O. Weill (2006): “Why has house pricedispersion gone up?,” NBER Working Paper Series No. 12538 (Septem-ber).
Pesaran, M. H. (2007): “A pair-wise approach to testing for output andgrowth convergence,” Journal of Econometrics), 138.
Piazzesi, M., and M. Schneider (2009): “Momentum traders in thehousing market: Survey evidence and a search model,” NBER WorkingPaper No. 14669.
Roback, J. (1982): “Wages, Rents, and the Quality of Life,” Journal ofPolitical Economy, 90(4), 1257–78.
Rogers, J. H. (2005): “Monetary union, price level convergence, and infla-tion: How close is Europe to the USA?,” Journal of Monetary Economics,54, 785–796.
Rosen, S. (1979): “Wage-Based Indexes of Urban Quality of Life,”in Current Issues in Urban Economics, ed. by P. Mieszkowski, andM. Straszheim. Johns Hopkins Univerity Press.
Smullen, J., and K. MacDonald (2006): “European residential propertymarket convergence,” The Journal of Financial Transformation, 19.
Vansteenkiste, I., and P. Hiebert (2009): “Do house price develop-ments spill over across euro area countries? Evidence from a Global VAR,”ECB Working Paper No. 1026 (March).

22ECBWorking Paper Series No 1206June 2010
Appendices
A Data sources
HOUSE PRICES
Definition: Log of house prices from national sources (see below):a series forexisting houses is used for Germany and Italy, a combined series (incorporat-ing existing and new houses) for France and Spain. In the US house pricesfor a median dwelling in 2000 from the Census were chained dynamicallyusing house price indices from S&P / Case-Shiller.
Units: EUR per square metre (Euro area countries), USD per typical dwelling(US).
Source: BulwienGesa AG (Germany), Federation Nationale de l’Immobilier– FNAIM (France), Nomisma (Italy), Ministerio de Vivienda (Spain), Case-Shiller S&P and Census (US).
PER CAPITA INCOME
Definition: Disposable income of private households by Nomenclature d’unitesterritoriales statistiques (NUTS) 2 regions. Purchasing power standardbased on final consumption per inhabitant. For cases in which city-levelincome was unavailable, income from the relevant region was used as aproxy.
Units: EUR (Euro area countries), USD (US).
Sources: Eurostat and Bureau of Economic Analysis/ Census (US).
POPULATION
Definition: Total resident population.
Units: Thousands.
Sources: Eurostat (Euro area countries) and Census (US).
DISTANCES
Definition: Distance between city pairs, computed using the great circleformula on the basis of geographical coordinates.
Units: Kilometres.
Sources: mapsofworld.com
23ECB
Working Paper Series No 1206June 2010
Figure 1: Evolution of house price level

24ECBWorking Paper Series No 1206June 2010
à
Figure 2: House price level (2006)

25ECB
Working Paper Series No 1206June 2010
0
1,000
2,000
3,000
4,000
5,000
6,000
10 12 14 16 18 20 22 24
Per capita income (EUR thousand)
Ho
use
price
(E
UR
pe
r sq
m)
Germany France
Italy Spain
0
100,000
200,000
300,000
400,000
500,000
600,000
700,000
800,000
30,000 35,000 40,000 45,000 50,000 55,000 60,000
Per capita income (USD)
Ho
use
pri
ce
(U
SD
pe
r u
nit)
0
1,000
2,000
3,000
4,000
5,000
6,000
0 500 1,000 1,500 2,000 2,500 3,000 3,500 4,000
Population (thousands)
Ho
use
price
(E
UR
pe
r sq
m)
Germany France
Italy Spain
0
100,000
200,000
300,000
400,000
500,000
600,000
700,000
800,000
0 5,000 10,000 15,000 20,000
Population (thousands)
Ho
use
pri
ce
(U
SD
pe
r u
nit)
Figure 3: Correlations between house prices and income-population (2006)
26ECBWorking Paper Series No 1206June 2010
Figure 4: Euro area house prices and their ratios in per capita income (2006data)

27ECB
Working Paper Series No 1206June 2010
Figure 5: Frequency distributions of standardised house prices and income
28ECBWorking Paper Series No 1206June 2010
Figure 6: Standard deviation of house price and income dispersion acrossall city pairs (%)

29ECB
Working Paper Series No 1206June 2010
Table 1. Panel unit root tests for city-level house pricesTest statistics (with p-values in parentheses). The null hypothesis for all testsassumes individual or common unit root process.
Levin, Lin Im, Pesaran ADF PP No. obs& Chu & Shin
Germany -2.45 -1.15 84.53 58.69 595(0.007) (0.125) (0.114) (0.83)
France -17.44 -7.08 125.25 43.68 119(0) (0) (0) (0.124)
Italy -5.63 -4.87 83.04 64.70 280(0) (0) (0) (0)
Spain 0.37 1.92 3.22 4.39 110(0.644) (0.973) (0.994) (0.975)
United States -10.92 -8.81 152.74 34.80 372(0) (0) (0) (0.703)
Test statistics are t-test (Levin, Lin & Chu), W stat (Im, Pesaran & Shin), and Fisher
Chi-square (for Augmented Dickey-Fuller, or ADF, and Philipps Perron, or PP)

30ECBWorking Paper Series No 1206June 2010
Table 2. Results of panel estimation
a. OLS with time and city dummiesAll variables in logarithms, dependent variable is the house price gaps across city pairs
Euro area 4 DE IT FR ES US
Distance 0.029 0.032 -0.30 -0.005 -0.065*** -0.090(0.024) (0.019) (0.030) (0.030) (0.011) (0.083)
Population 0.105*** 0.092*** 0.044 0.340*** 0.201* 0.024(0.018) (0.016) (0.064) (0.032) (0.087) (0.049)
Income 0.886*** 0.449*** 0.911*** 0.924** 0.869* 2.22***(0.101) (0.112) (0.167) (0.413) (0.340) (0.233)
Constant -1.032*** -0.032 -1.374 0.158 0.619 0.238(0.166) (0.153) (2.001) (0.606) (2.646) (0.751)
Sample span 1990-2008 1991-2008 1990-2008 2000-2008 1990-2008 1986-2008Avg. sample 9.4 11.9 12 6 12 18.4No. cities 71 35 13 17 6 20No. city pairs 2,485 595 78 136 15 190Total no. obs 23,426 7,106 936 816 180 3,497
R2 0.484 0.323 0.750 0.493 0.874 0.391
Robust clustered standard errors are reported in brackets.
*** significance at 1% level, ** significance at 5% level, * significance at 10% level
b. Fixed Effects with time and city dummiesAll variables in logarithms, dependent variable is the house price gaps across city pairs
Euro area 4 DE IT FR ES US
Population 1.746*** 1.065*** 0.187 -0.196 -2.275* 0.100(0.374) (0.214) (0.417) (0.968) (1.045) (0.084)
Income 1.569*** 0.486** -0.322 2.264** 0.489 2.39***(0.379) (0.196) (0.299) (1.118) (0.428) (0.149)
Constant -1.264*** 0.472*** 0.211 -0.083 -1.394* -0.065(0.165) (0.090) (0.349) (0.174) (0.616) (0.051)
Sample span 1990-2008 1991-2008 1990-2008 2000-2008 1990-2008 1986-2008Avg. sample 9.4 11.9 12 6 12 18.4No. cities 71 35 13 17 6 20No. city pairs 2,485 595 78 136 15 190Total no. obs 23,426 7,106 936 816 180 3,497
R2(overall) 0.173 0.264 0.023 0.024 0.694 0.332
Robust clustered standard errors are reported in brackets.
*** significance at 1% level, ** significance at 5% level, * significance at 10% level
31ECB
Working Paper Series No 1206June 2010
Table 3. Results of panel estimation - large cities sampleAll variables in logarithms, dependent variable is house price gaps across city pairs
Euro area 4 Euro area 4 US USOLS Fixed Effects OLS Fixed effects
Distance 0.045 -0.252***(0.037) (0.038)
Population 0.210*** 1.885*** 0.329*** 0.022(0.028) (0.377) (0.084) (0.128)
Income 0.873*** 0.764*** 2.46*** 2.34***(0.103) (0.251) (0.280) (0.260)
Constant -0.953*** -0.932** 1.89*** -0.188*(0.244) (0.144) (0.334) (0.084)
Sample span 1990-2008 1990-2008 1986-2008 1986-2008Avg. sample 9.8 9.8 17.1 17.1No. cities 20 20 11 11No. city pairs 190 190 55 55Total no. obs 1,860 1,860 943 943
R2(overall) 0.298 0.303 0.656 0.845
Robust clustered standard errors are reported in brackets.
*** significance at 1% level, ** significance at 5% level, * significance at 10% level

Work ing PaPer Ser i e Sno 1118 / november 2009
DiScretionary FiScal PolicieS over the cycle
neW eviDence baSeD on the eScb DiSaggregateD aPProach
by Luca Agnello and Jacopo Cimadomo