relationships of hair mineral concentrations with insulin resistance in metabolic syndrome
TRANSCRIPT
Relationships of Hair Mineral Concentrations with InsulinResistance in Metabolic Syndrome
Whan-Seok Choi & Se-Hong Kim & Ju-Hye Chung
Received: 12 January 2014 /Accepted: 16 March 2014 /Published online: 27 March 2014# Springer Science+Business Media New York 2014
Abstract Mineral deficiencies can cause impaired insulinrelease and insulin resistance. This study was conducted toinvestigate the relationship between hair mineral concentra-tions and insulin resistance in patients with metabolic syn-drome (MS). A total of 456 subjects (161 patients with MSand 295 subjects without MS) were reviewed, and fastingplasma glucose, triglycerides, HDL-cholesterol, homeostasisassessment model-insulin resistance (HOMA-IR), and hairmineral concentrations were analyzed. While hair sodiumand potassium concentrations were significantly higher, thehair calcium, magnesium, and zinc concentrations were lowerin the MS group than in the control group. Regarding toxicelement measurements, the hair arsenic (As) and lead (Pb)concentrations were higher in theMS group than in the controlgroup. The results of multiple regression analysis, afteradjusting for age, showed significant relationships betweenthe Na/Mg and Ca/P ratios and HOMA-IR (R2=0.109,p<0.05). The Ca, Na, K, and B concentrations were alsoassociated with HOMA-IR (R2=0.116, p<0.05). The hairNa concentration was significantly associated with MS, evenafter adjusting for age, visceral adipose tissue, and HOMA-IR(OR 1.020; 95 % CI 1.001–1.040; p=0.036). Our findingssuggest that hair mineral concentrations, such as calcium,magnesium, zinc, sodium, and potassium concentrations,may play a role in the development of insulin resistance.
Keywords Hair .Mineral . Metabolic syndrome . Calcium .
Sodium . Insulin resistance
Introduction
The metabolic syndrome (MS) is a cluster of risk factors fortype 2 diabetes and cardiovascular disease and is often re-ferred to as a “prediabetic” state. The five simple criteria formetabolic syndrome are as follows: increased waist circum-ference with population-specific cutoff values, increased tri-glyceride levels or treatment for hypertriglyceridemia, lowHDL-cholesterol concentration or treatment for this condition,elevated blood pressure or treatment for hypertension, andelevated glucose concentration or treatment with a hypogly-cemic agent. Insulin resistance, which is a main causativefactor of metabolic syndrome and type 2 diabetes [1], refersto a decrease in the response of peripheral tissues to insulin.Insulin resistance and associated metabolic syndrome increasearteriosclerosis-related cardiovascular and cerebrovascularmortality [2, 3].
Minerals have recently drawn attention as one of nutritionalfactors that determine insulin resistance. Mineral deficiencieshave been considered to play critical roles in enzymatic dys-function, leading to endocrine metabolic disorders. Among 12essential trace elements that are known to be essential formetabolism in the body, chromium, zinc, manganese, calcium,magnesium, copper, and vanadium have been associated withcarbohydrate metabolism. Imbalances of these elements cancause impaired insulin release and insulin resistance [4]. Inparticular, calcium, magnesium, and zinc have been known tobe important for insulin resistance. Magnesium is a criticalsupportive factor of enzymes that are associated with carbo-hydrate metabolism, as it is important for the regulation andinhibition of insulin. In addition, because insulin is secretedvia a calcium-dependent process, dysfunction of calciumchannels has been associated with diabetes [5, 6]. Zinc alsohas a protective effect on insulin resistance, and low concen-trations of zinc have been associated with chronic inflamma-tion and insulin resistance [7].
W.<S. Choi (*) : S.<H. Kim : J.<H. ChungDepartment of Family Medicine, College of Medicine, The CatholicUniversity of Korea, 505 Banpo-Dong, Seocho-Gu, Seoul 137-701,South Koreae-mail: [email protected]
Biol Trace Elem Res (2014) 158:323–329DOI 10.1007/s12011-014-9946-2
Methods that measure mineral concentrations in the blood,urine, and tissues are complex. Furthermore, the concentra-tions of elements in serum often do not reflect their content inthe whole body because their concentrations in the blood areregulated by a homeostatic mechanism. However, the mineralconcentrations in hair tissue are 50 to 100 times higher thanthose in the blood or urine. In addition, measurement of traceelements in hair has the advantages of easy sample collection,a non-invasive process, and the provision of a relatively longperiod of information, compared to blood sampling [8]. Ac-cordingly, this study was conducted to investigate the rela-tionship between hair mineral concentrations and insulin re-sistance in patients with metabolic syndrome.
Methods
A retrospective cross-sectional survey was conducted amongsubjects who visited Uijeongbu St. Mary Hospital or St.Vincent’s Hospital in South Korea from September 2009 toOctober 2013. A total of 456 subjects (355 males, 101 fe-males) who underwent hair mineral analysis and comprehen-sive health screening were reviewed. They consisted of 161patients with metabolic syndrome and 295 subjects withoutmetabolic syndrome. The sample size of our study was calcu-lated based on our previous study. The calculated sample sizewas 162 patients in each group in order to have a power of80 % to detect a difference in the mean homeostasis assess-ment model-insulin resistance (HOMA-IR) of 1.4, assumingthat the standard deviation is 4.5 in primary outcome variableswith an alpha error of 5 %. The sample size and power forgroup analysis was enough to evaluate the difference ofinsulin resistance in two groups. The exclusion criteriawere cancers, thyroid diseases, and diabetes. Subjectswho were taking systemic glucocorticoids, blood glucose-lowering medications (e.g., metformin, thiazolidinediones),anti-inflammatory medications, and immunosuppressantdrugs were also excluded. This study was approved bythe Research Ethical Committee of the College of Medi-cine, The Catholic University of Korea, and conducted inaccordance with the Declaration of Helsinki (IRB numberXC14RIMI0006U).
Risk Factor Assessment
The anthropometric, clinical, and laboratory investigationswere performed on all subjects. The height of each participantwas determined using a fixed wall-scale measuring device andwas measured to the nearest 0.1 cm. The body weight wasmeasured to the nearest 0.1 kg using a digital scale calibratedprior to eachmeasurement. The bodymass index (BMI; kg/m2)was calculated as the weight in kilograms divided by thesquare of height in meters. Waist circumference (WC) was
measured twice to the nearest centimeter at the end of normalexpiration in a horizontal plane immediately superior to theleft iliac crest according to the National Health and NutritionExamination Survey protocols. If the variation between thesetwo measurements was greater than 2 cm, a third measure-ment was taken and the mean was calculated using the twoclosest measurements. Seated blood pressures were measuredusing a mercury sphygmomanometer after a 10-min rest peri-od. Two blood pressure measurements were taken from allsubjects with a 5-min interval and were averaged for analysis.Fasting plasma glucose, total cholesterol, triglyceride, andHDL-cholesterol levels were measured after a 12-h fastingusing an auto-analyzer (Hitachi 747 auto-analyzer, Tokyo,Japan). Blood samples for serum mineral concentration werecollected in trace mineral-free tubes, kept at room temperaturefor 10–20 min for coagulation, and centrifuged within 1 h at3,000 rpm for 5 min. These samples were stored in a refrig-erator at −4 °C. The serum levels of total calcium, phosphate,and magnesium were measured by an automatic analyticalinstrument (Hitachi 7600-100 Automatic Analyzer, Hitachi,Japan) following standard operating procedures. Smokingstatus and alcohol use were also investigated. The HOMA-IR that was used as a marker of insulin sensitivity was calcu-lated using the Matthews method: Fasting insulin (μU/ml)×Fasting blood glucose (mmol/l)/22.5 [9]. To assess abdominalfat distribution, approximately four to five continuous trans-verse images (120 kV, 200 mA, scanning time of 2 s, field ofview of 380 mm, and slice thickness 5 mm) were obtained atthe L4–5 level using a CT scanner (LightSpeed, GEHealthcare, Milwaukee, WI, USA). Segmentation of the axialimages into visceral adipose tissue (VAT) and subcutaneousadipose tissue (SAT) areas was performed by one trainedobserver using an image analysis software (Rapidia,software version 2.8, Infinitt Co., Seoul). The visceraladipose regions were measured at the L4–5 interverte-bral space by manual tracing, and the pixels with athreshold range of −190 to −30 Hounsfield units (HU)were calculated for the adipose tissue area. The SATarea was determined by subtracting the VAT area fromthe total abdominal fat area.
The MS was defined according to the revised NationalCholesterol Education Program Expert Panel on Detection,Evaluation, and Treatment of High Blood Cholesterol inAdults (NCEP-ATP III) criteria [10] with the Korean Societyfor the Study of Obesity’s (KSSO) cutoff point for abdominalobesity (≥90 cm for men and ≥85 cm for women) [11].Diagnosis of MS was based on the presence of three or moreof the following clinical criteria: (1) WC ≥90 cm for men or≥85 cm for women; (2) TG levels ≥150 mg/dl; (3) HDL levels<40 mg/dl for men or <50 mg/dl for women; (4) SBP≥130 mmHg or DBP ≥85 mmHg, or the use of antihyperten-sive medication; and (5) FBS ≥100 mg/dl, or the use of anti-diabetics or insulin.
324 Choi et al.
The Measurement of Hair Mineral Concentrations
For analysis of hair minerals, all participants were asked not tochemically process their hair (i.e., no dyeing, bleaching,perms, or frosting) for at least 2 months prior to hair samplecollection [12]. The hair had also to be free of all gels, oils, andhair creams before sample collection. Only patients who hadnot used shampoos that contain selenium sulfide were accept-ed for the study [13]. The hair samples were washed withacetone, water, and Extran (1 %v/v) to ensure accurate assess-ment of endogenous metal content. After washing, aliquots ofhair samples were wet-ashed according to the following pro-cedure. A 250-mg sample was wet-digested overnight with2.5 ml of HNO3 in a closed, graduated polypropylene tube(50 ml) at room temperature and then for 1 h at 60 to 70 °C in adrying oven. After cooling to room temperature, the samplewas diluted to a final volume of 25ml withMilli Q water. Thissolution was analyzed with a PerkinElmer mass spectrometer
(Sciex Elan 6100, PerkinElmer Corporation, Foster, CA,USA) [14]. Mineral concentrations are shown as milligrampercent (mg/100 g of hair).
Statistical Analysis
The data were analyzed using SPSS software, version 13.0(SPSS Inc., Chicago, IL, USA), and are presented as themeans±standard deviations. The values of fasting plasmaglucose, HDL-cholesterol, triglycerides, HOMA-IR, and allof the hair mineral concentrations were highly skewed; thus,they were log-transformed for all of the analyses. Age-adjusted Pearson’s correlation coefficients were used to assesssimple correlations between hair mineral concentrations andinsulin resistance. The relationships of hair mineral concen-trations with insulin resistance are presented as linear regres-sion coefficients with 95 % confidence intervals. Multiplelogistic regression analysis was also performed to assess therelationships between hair minerals and MS. A two-sided pvalue <0.05 was considered statistically significant.
Results
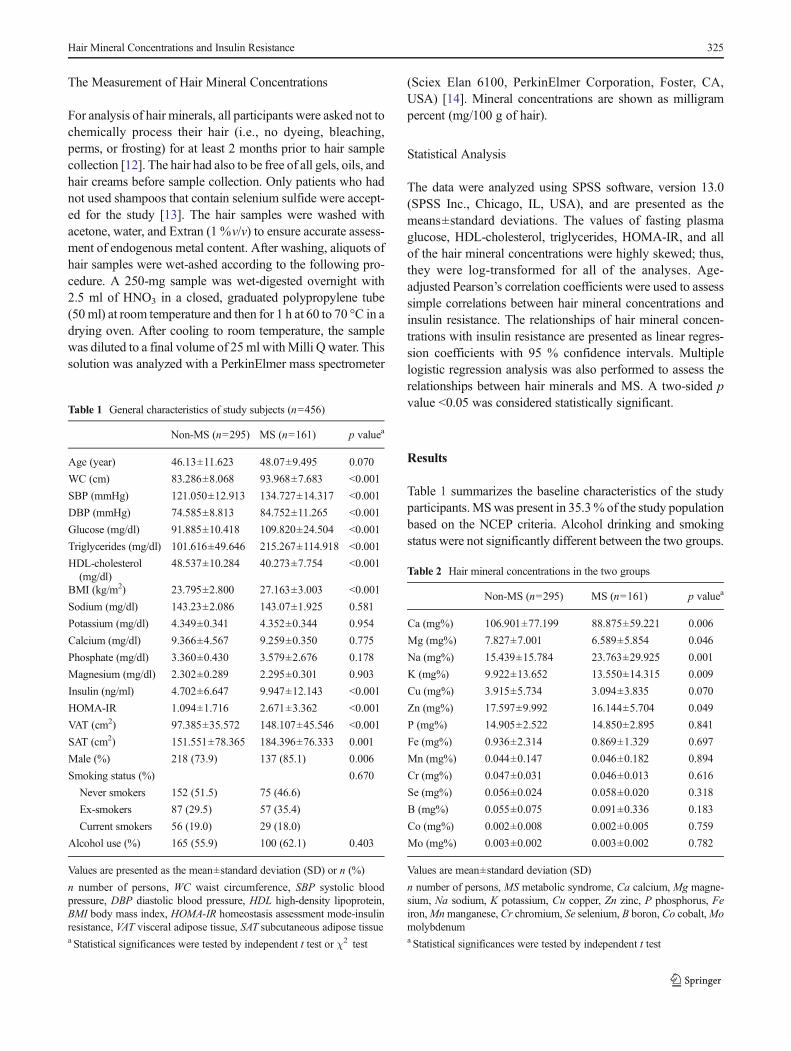
Table 1 summarizes the baseline characteristics of the studyparticipants.MSwas present in 35.3% of the study populationbased on the NCEP criteria. Alcohol drinking and smokingstatus were not significantly different between the two groups.
Table 1 General characteristics of study subjects (n=456)
Non-MS (n=295) MS (n=161) p valuea
Age (year) 46.13±11.623 48.07±9.495 0.070
WC (cm) 83.286±8.068 93.968±7.683 <0.001
SBP (mmHg) 121.050±12.913 134.727±14.317 <0.001
DBP (mmHg) 74.585±8.813 84.752±11.265 <0.001
Glucose (mg/dl) 91.885±10.418 109.820±24.504 <0.001
Triglycerides (mg/dl) 101.616±49.646 215.267±114.918 <0.001
HDL-cholesterol(mg/dl)
48.537±10.284 40.273±7.754 <0.001
BMI (kg/m2) 23.795±2.800 27.163±3.003 <0.001
Sodium (mg/dl) 143.23±2.086 143.07±1.925 0.581
Potassium (mg/dl) 4.349±0.341 4.352±0.344 0.954
Calcium (mg/dl) 9.366±4.567 9.259±0.350 0.775
Phosphate (mg/dl) 3.360±0.430 3.579±2.676 0.178
Magnesium (mg/dl) 2.302±0.289 2.295±0.301 0.903
Insulin (ng/ml) 4.702±6.647 9.947±12.143 <0.001
HOMA-IR 1.094±1.716 2.671±3.362 <0.001
VAT (cm2) 97.385±35.572 148.107±45.546 <0.001
SAT (cm2) 151.551±78.365 184.396±76.333 0.001
Male (%) 218 (73.9) 137 (85.1) 0.006
Smoking status (%) 0.670
Never smokers 152 (51.5) 75 (46.6)
Ex-smokers 87 (29.5) 57 (35.4)
Current smokers 56 (19.0) 29 (18.0)
Alcohol use (%) 165 (55.9) 100 (62.1) 0.403
Values are presented as the mean±standard deviation (SD) or n (%)
n number of persons, WC waist circumference, SBP systolic bloodpressure, DBP diastolic blood pressure, HDL high-density lipoprotein,BMI body mass index, HOMA-IR homeostasis assessment mode-insulinresistance, VAT visceral adipose tissue, SAT subcutaneous adipose tissuea Statistical significances were tested by independent t test or χ2 test
Table 2 Hair mineral concentrations in the two groups
Non-MS (n=295) MS (n=161) p valuea
Ca (mg%) 106.901±77.199 88.875±59.221 0.006
Mg (mg%) 7.827±7.001 6.589±5.854 0.046
Na (mg%) 15.439±15.784 23.763±29.925 0.001
K (mg%) 9.922±13.652 13.550±14.315 0.009
Cu (mg%) 3.915±5.734 3.094±3.835 0.070
Zn (mg%) 17.597±9.992 16.144±5.704 0.049
P (mg%) 14.905±2.522 14.850±2.895 0.841
Fe (mg%) 0.936±2.314 0.869±1.329 0.697
Mn (mg%) 0.044±0.147 0.046±0.182 0.894
Cr (mg%) 0.047±0.031 0.046±0.013 0.616
Se (mg%) 0.056±0.024 0.058±0.020 0.318
B (mg%) 0.055±0.075 0.091±0.336 0.183
Co (mg%) 0.002±0.008 0.002±0.005 0.759
Mo (mg%) 0.003±0.002 0.003±0.002 0.782
Values are mean±standard deviation (SD)
n number of persons, MS metabolic syndrome, Ca calcium, Mg magne-sium, Na sodium, K potassium, Cu copper, Zn zinc, P phosphorus, Feiron,Mnmanganese, Cr chromium, Se selenium, B boron, Co cobalt,Momolybdenuma Statistical significances were tested by independent t test
Hair Mineral Concentrations and Insulin Resistance 325

HOMA-IR (2.67±3.36 vs 1.09±1.71, p<0.001) and insulin(9.94±12.14 vs 4.70±6.64, p<0.001) were significantlyhigher in the MS group than in the control group. No differ-ences in the serum sodium, potassium, calcium, magnesium,
or phosphate levels were found between the two groups. Theareas of visceral and subcutaneous adipose tissue were alsogreater in the MS group than in the control group (p<0.05).
Hair Mineral Concentrations Between the Groups
While hair sodium and potassium concentrations were signif-icantly higher in the MS group, the hair calcium, magnesium,and zinc concentrations were significantly lower in the MSgroup than in the control group (Table 2). As for the toxicelement measurements, the hair arsenic (As) and lead (Pb)concentrations were higher in theMS group than in the controlgroup (p<0.05), whereas the concentrations of cadmium,mercury, and aluminum were not different between the twogroups (Table 3).While the Ca/K ratio was significantly lowerin the MS group, the Na/Mg ratio was higher in the MS groupthan in the control group (p<0.05).
Association Between HairMineral Concentrations and InsulinResistance
Partial correlation analysis showed significantly negative cor-relations between hair Ca, Mg, and Cu concentrations and theHOMA-IR but showed positive correlations of hair Na and Kwith the HOMA-IR (Table 4). The hair Se concentration waspositively correlated with fasting blood glucose (r=0.163);however, Ca and Mg were negatively correlated with fastingblood glucose. A significantly negative correlation was foundbetween the hair Ca, Cu, and Co concentrations and blood
Table 3 Hair mineral concentration ratios and toxic elementconcentrations
Non-MS (n=295) MS (n=161) p valuea
S (mg%) 4,070.52±359.15 4,044.98±390.03 0.494
U (mg%) 0.037±0.117 0.027±0.057 0.251
As (mg%) 0.009±0.006 0.011±0.005 0.006
Be (mg%) 0.001±0.00013 0.001±0.00023 0.673
Hg (mg%) 0.157±0.108 0.184±0.126 0.023
Cd (mg%) 0.003±0.011 0.003±0.004 0.565
Pb (mg%) 0.124±0.104 0.151±0.162 0.037
Al (mg%) 0.682±0.814 0.656±0.485 0.671
Ca/P 7.432±5.845 6.162±4.495 0.010
Na/K 2.605±2.198 2.526±2.319 0.724
Ca/K 41.744±55.717 21.267±33.111 0.000
Zn/Cu 9.050±9.585 9.030±5.659 0.978
Na/Mg 3.894±6.114 5.843±8.803 0.013
Ca/Mg 15.532±4.850 15.521±4.572 0.982
Fe/Cu 0.523±1.683 0.433±0.440 0.390
Values are mean±standard deviation (SD)
n number of persons, MS metabolic syndrome, S sulfur, U uranium, Asarsenic, Be beryllium, Hg mercury, Cd cadmium, Pb lead, Al aluminum,Ca calcium, Mg magnesium, Na sodium, K potassium, Cu copper, Znzinc, P phosphorus, Fe irona Statistical significances were tested by independent t test
Table 4 Partial correlation coefficients between metabolic risk factors and hair mineral concentrations (age-adjusted)
SBP DBP FBS TG HDL BMI WC HOMA-IR
Ca (mg%) −0.221* −0.154* −0.155* −0.163* 0.109 −0.172* −0.265* −0.301*Mg (mg%) −0.166* −0.097 −0.143* −0.125* 0.093 −0.172* −0.211* −0.275*Na (mg%) 0.125 0.128 0.174 0.146* −0.109* 0.107 0.166 0.203*
K (mg%) 0.104 0.059 0.208 0.108* −0.159* 0.147 0.149 0.255*
Cu (mg%) −0.138* −0.123* −0.040 −0.022 0.042 −0.087 −0.142* −0.166*Zn (mg%) −0.014 0.072 −0.096 −0.010 0.118* −0.039 −0.069 −0.089P (mg%) 0.041 0.040 −0.059 0.039 −0.027 0.031 0.048 0.002
Fe (mg%) −0.052 −0.006 −0.033 −0.063 0.085 −0.027 −0.021 −0.030Mn (mg%) −0.041 −0.044 −0.030 −0.039 −0.032 −0.023 −0.039 −0.039Cr (mg%) 0.003 −0.018 0.026 0.078 0.024 0.150* 0.100* 0.061
Se (mg%) 0.094 0.080 0.163* 0.066 −0.025 0.031 0.079 0.062
B (mg%) −0.035 0.046 0.052 0.125* −0.038 0.098 0.038 −0.024Co (mg%) −0.175* −0.142* −0.037 −0.021 0.016 −0.028 −0.075 −0.051Mo (mg%) 0.031 0.062 0.021 0.069 0.053 0.041 0.022 −0.004
WC waist circumference, SBP systolic blood pressure, DBP diastolic blood pressure, FBS fasting blood glucose, HDL high-density lipoprotein, BMIbody mass index, HOMA-IR homeostasis assessment model-insulin resistance, Ca calcium, Mg magnesium, Na sodium, K potassium, Cu copper, Znzinc, P phosphorus, Fe iron, Mn manganese, Cr chromium, Se selenium, B boron, Co cobalt, Mo molybdenum
*Significant at the 0.05 level (two-tailed)
326 Choi et al.

pressure. Mg was negatively correlated with systolic bloodpressure, but not with diastolic blood pressure.
The results of multiple regression analysis, after adjustingfor age, showed significant relationships of the Na/Mg andCa/P ratios with the HOMA-IR (R2=0.109, p<0.05) (Table 5).The Ca, Na, K, and B concentrations were also associatedwith the HOMA-IR (R2=0.116, p<0.05) (Table 6). The asso-ciations between hair mineral concentrations and MS wereassessed by multivariate logistic regression models (Table 7).The hair Na concentration was associated with MS, even afteradjusting for age, visceral adipose tissue, and HOMA-IR (OR1.020; 95 % CI 1.001–1.040; p=0.036).
Discussion
The results of this study showed that the hair calcium, mag-nesium, and zinc concentrations were significantly reduced inthe MS group, while sodium and potassium concentrationswere higher in the MS group, compared with those of controlsubjects. In addition, the hair Ca, Na, and K concentrationswere associated with insulin resistance in multiple regressionanalysis. Furthermore, the hair Na concentration was alsoassociated with MS, even after adjusting for HOMA-IR andvisceral adipose tissue in multivariate logistic regressionmodels. The results of this study revealed that patients withMS have different patterns of essential trace and toxic ele-ments in their scalp hair samples compared to subjects withoutMS. Therefore, our findings suggest that hair mineral concen-trations, such as those of Ca, Na, and K, may play a role in thedevelopment of insulin resistance.
Table 5 Multiple linear regression analysis for HOMA-IR after adjustingfor age
Unstandardizedcoefficients
Standardizedcoefficients
t p valuea
B Std. error Beta
Zn/Cu 0.001 0.007 0.008 0.164 0.870
Ca/Mg −0.007 0.013 −0.027 −0.553 0.581
Fe/Cu −0.016 0.043 −0.017 −0.370 0.712
Na/Mg 0.045 0.009 0.254 5.059 0.000
Na/K 0.001 0.028 0.002 0.041 0.967
Ca/P −0.031 0.012 −0.128 −2.521 0.012
Age −0.009 0.006 −0.072 −1.563 0.119
Coefficient of determination (R2 )=0.109
HOMA-IR homeostasis assessment model-insulin resistance,Ca calcium,Mg magnesium, Na sodium, K potassium, Cu copper, Zn zinc, P phos-phorus, Fe irona Statistical significances were tested by multiple linear regressionanalysis
Table 6 Multiple linear regression analysis for HOMA-IR after adjustingfor age
Unstandardizedcoefficients
Standardizedcoefficients
t p valuea
B Std. error Beta
Ca (mg%) −0.003 0.002 −0.150 −1.567 0.018
Mg (mg%) 0.000 0.018 −0.002 −0.022 0.982
Na (mg%) 0.010 0.003 0.165 2.941 0.003
K (mg%) 0.011 0.006 0.118 1.996 0.047
Cu (mg%) −0.012 0.012 −0.046 −0.973 0.331
Zn (mg%) −0.005 0.007 −0.030 −0.622 0.534
P (mg%) −0.008 0.024 −0.015 −0.316 0.752
Fe (mg%) −0.003 0.031 −0.004 −0.092 0.927
Cr (mg%) 0.260 2.353 0.005 0.110 0.912
Se (mg%) 1.969 2.841 0.034 0.693 0.489
B (mg%) −0.705 0.306 −0.111 −2.305 0.022
Co (mg%) −2.494 9.390 −0.013 −0.266 0.791
Mo (mg%) −21.591 33.004 −0.031 −0.654 0.513
Coefficient of determination (R2 )=0.116
HOMA-IR homeostasis assessment model-insulin resistance,Ca calcium,Mg magnesium, Na sodium, K potassium, Cu copper, Zn zinc, P phos-phorus, Fe iron,Mnmanganese, Cr chromium, Se selenium, B boron, Cocobalt,Mo molybdenuma Statistical significances were tested by multiple linear regressionanalysis
Table 7 Multiple logistic regression analysis for hair mineral concentra-tions with MS
B Std. error OR 95 % CI p valuea
VAT 0.032 0.004 1.033 1.024–1.041 0.000
HOMA-IR 0.242 0.082 1.273 1.084–1.496 0.003
Ca (mg%) 0.002 0.003 1.002 0.995–1.009 0.517
Mg (mg%) −0.018 0.035 0.982 0.917–1.051 0.593
Na (mg%) 0.020 0.010 1.020 1.001–1.040 0.036
K (mg%) −0.003 0.012 0.997 0.974–1.021 0.806
Cu (mg%) −0.029 0.025 0.971 0.924–1.021 0.250
Zn (mg%) −0.013 0.017 0.987 0.954–1.020 0.427
P (mg%) 0.008 0.049 1.008 0.916–1.109 0.873
Fe (mg%) 0.009 0.054 1.009 0.907–1.122 0.869
Cr (mg%) −15.811 12.150 0.000 0.000–2984 0.193
B (mg%) 0.482 0.867 1.620 0.296–8.861 0.578
Odds ratios (ORs) and 95 % confidence intervals (CIs) are presented asthe odds of metabolic syndrome
VAT visceral adipose tissue, HOMA-IR homeostasis assessment model-insulin resistance, Ca calcium,Mgmagnesium, Na sodium, K potassium,Cu copper, Zn zinc, P phosphorus, Fe iron, Mn manganese, Cr chromi-um, Se selenium, B borona Statistical significances were tested by multiple linear regressionanalysis
Hair Mineral Concentrations and Insulin Resistance 327
In the MS group, the hair magnesium concentration wassignificantly lower, and the Na/Mg ratio was higher. Magne-sium is crucial for carbohydrate metabolism and is related toglucose homeostasis, insulin action, and the development oftype 2 diabetes. Previous studies have shown that cellular Mgconcentrations were relatively lower in patients with insulinresistance or type 2 diabetes [15, 16]. A rise in blood glucoselevel increases insulin secretion. Then, insulin transfers Mginto the insides of cells by acting on theMg pathway, resultingin decreased blood Mg concentrations and increased cellularMg concentrations. Severe magnesium deficiency can lead toan increase in inflammatory cytokines [17], thus enhancingoxidative stress and the systemic inflammatory response [18].Conversely, it was reported that sufficient Mg intake increasedinsulin sensitivity in non-diabetic subjects [19] and reduced therisk of diabetes [20]. Interestingly, magnesium intake has beenshown to result in increased sodium intake levels, and sodiumopposes magnesium in many physiological processes [21].The results of our study showed that hair sodium concentra-tions were higher in the MS group compared to control sub-jects, and these levels were associated with insulin resistance inmultiple regression analysis. The opposing effects of highlevels of sodium and low magnesium concentrations on therisk of type 2 diabetes could potentially explain these findings.Consistent with our findings, significantly lower levels of Mgand Ca were found in the hair of diabetes mellitus patients thanin the hair of controls, whereas the levels of Na were signifi-cantly higher in subjects with diabetes than in the controls [22].
Dietary calcium plays an important role in the regulation ofenergy metabolism, and it is also known to have anti-obesityeffects; an increase of 1,000 mg in calcium intake was relatedto an 8-kg reduction in body weight [23]. Low daily calciumintake was associated with greater adiposity and with diabetes[24]. However, in other studies, cellular Ca concentrationswere shown to be high in patients with insulin resistance[25], and Ca in adipocytes was reported to induce weightincreases and to deteriorate slowly into insulin resistance[26]. In this study, the hair Ca concentrations were lower inthe MS group than in the control group, consistent with theresults of previous studies that showed positive effects ofcalcium on glucose tolerance, insulin resistance, and lipidprofile [27, 28]. This finding shows that the depletion ofintracellular Ca could be a factor contributing to MS.
In this study, the hair zinc concentrations in the MS groupwere lower than those in the non-MS group, suggesting thatzinc deficiencymight play a role in the development of insulinresistance and MS. Zinc is known to play an important role ininsulin metabolism, especially in its synthesis, storage, andsecretion. Metabolic abnormalities of zinc are known to resultin the development of type 2 diabetes [29]. In terms of toxicelements, the hair arsenic (As) and lead (Pb) concentrationswere higher in the MS group than in the control group.Consistent with this finding, Afridi et al. also reported
significantly higher values of Pb and As in the hair of diabeticpatients than in the control group [30]. Pb tends to accumulatein the body, and it has brisk interactions with other divalentcations, such as Fe(II) and Zn(II). Arsenic exposure could playa role in the development of hyperglycemia and diabetesmellitus [31]. The administration of As has been demonstratedto produce mitochondrial damage and necrosis of β cells inmice, with the consequence of transient hyperglycemia [32].
Our study had a few limitations. First, it was conducted inKoreans who were living in the limited area of Gyunggi-do,and the subject group cannot represent the entire Koreanpopulation. Furthermore, the sample size to detect a differencebetween various hair mineral concentrations was not calculat-ed in this study. Second, although diet may affect mineralconcentrations, a dietary survey was not performed in thisstudy. Third, while zinc is known to play an important rolein insulin metabolism, no attempt was made to measure serumzinc level. Fourth, this was a cross-sectional study, and wetherefore could not determine causality between mineral con-centrations andMS. Further prospective studies with adequatesample size are required to investigate what effects the imbal-ance of interrelated minerals have and how they are related tometabolic syndrome.
References
1. Martin BC, Warram JH, Krolewski AS, Bergman RN, Soeldner JS,Kahn CR (1992) Role of glucose and insulin resistance in develop-ment of type 2 diabetes mellitus: results of a 25-year follow-up study.Lancet 340(8825):925–929
2. Despres JP, Lamarche B, Mauriege P, Cantin B, Dagenais GR,Moorjani S, Lupien PJ (1996) Hyperinsulinemia as an independentrisk factor for ischemic heart disease. N Engl J Med 334(15):952–957. doi:10.1056/NEJM199604113341504
3. Lakka HM, Laaksonen DE, Lakka TA, Niskanen LK, Kumpusalo E,Tuomilehto J, Salonen JT (2002) The metabolic syndrome and totaland cardiovascular disease mortality in middle-aged men. JAMA288(21):2709–2716
4. Chen MD, Lin PY, Tsou CT, Wang JJ, Lin WH (1995) Selectedmetals status in patients with noninsulin-dependent diabetes mellitus.Biol Trace Elem Res 50(2):119–124. doi:10.1007/BF02789414
5. Ojuka EO (2004) Role of calcium and AMP kinase in the regulationof mitochondrial biogenesis and GLUT4 levels in muscle. Proc NutrSoc 63(2):275–278. doi:10.1079/PNS2004339
6. Wright DC, Hucker KA, Holloszy JO, Han DH (2004) Ca2+ andAMPK both mediate stimulation of glucose transport by musclecontractions. Diabetes 53(2):330–335
7. DiSilvestro RA (2000) Zinc in relation to diabetes and oxidativedisease. J Nutr 130(5S Suppl):1509S–1511S
8. Klevay LM, Bistrian BR, Fleming CR, Neumann CG (1987) Hairanalysis in clinical and experimental medicine. Am J Clin Nutr 46(2):233–236
9. Matthews DR, Hosker JP, Rudenski AS, Naylor BA, Treacher DF,Turner RC (1985) Homeostasis model assessment: insulin resistanceand beta-cell function from fasting plasma glucose and insulin con-centrations in man. Diabetologia 28(7):412–419
328 Choi et al.
10. Grundy SM, Cleeman JI, Daniels SR, Donato KA, Eckel RH,Franklin BA, Gordon DJ, Krauss RM, Savage PJ, Smith SC Jr,Spertus JA, Costa F (2005) Diagnosis and management of the met-abolic syndrome: an American Heart Association/National Heart,Lung, and Blood Institute Scientific Statement. Circulation 112(17):2735–2752. doi:10.1161/CIRCULATIONAHA.105.169404
11. Lee SY, Park HS, Kim DJ, Han JH, Kim SM, Cho GJ (2007)Appropriate waist circumference cutoff points for central obesity inKorean adults. Diabetes Res Clin Pract 5(1):72–80
12. Bass DA, Hickock D, Quig D, Urek K (2001) Trace element analysisin hair: factors determining accuracy, precision, and reliability. AlternMed Rev 6(5):472–481
13. LeBlanc A, Dumas P, Lefebvre L (1999) Trace element content ofcommercial shampoos: impact on trace element levels in hair. SciTotal Environ 229(1–2):121–124
14. Miekeley N, de Fortes Carvalho LM, Porto da Silveira CL, LimaMB(2001) Elemental anomalies in hair as indicators of endocrinologicpathologies and deficiencies in calcium and bonemetabolism. J TraceElem Med Biol 15(1):46–55
15. Resnick LM (1992) Cellular calcium and magnesium metabolism inthe pathophysiology and treatment of hypertension and related met-abolic disorders. Am J Med 93(2A):11S–20S
16. Kao WH, Folsom AR, Nieto FJ, Mo JP, Watson RL, Brancati FL(1999) Serum and dietary magnesium and the risk for type 2 diabetesmellitus: the Atherosclerosis Risk in Communities Study. Arch InternMed 159(18):2151–2159
17. Vormann J (2003) Magnesium: nutrition and metabolism. Mol AspMed 24(1–3):27–37
18. Manuel y Keenoy B, Moorkens G, Vertommen J, NoeM, Neve J, DeLeeuw I (2000) Magnesium status and parameters of the oxidant-antioxidant balance in patients with chronic fatigue: effects of sup-plementation with magnesium. J Am Coll Nutr 19(3):374–382
19. Guerrero-Romero F, Tamez-Perez HE, Gonzalez-Gonzalez G,Salinas-Martinez AM, Montes-Villarreal J, Trevino-Ortiz JH,Rodriguez-Moran M (2004) Oral magnesium supplementation im-proves insulin sensitivity in non-diabetic subjects with insulin resis-tance. A double-blind placebo-controlled randomized trial. DiabetesMetab 30(3):253–258
20. Colditz GA, Manson JE, Stampfer MJ, Rosner B, Willett WC,Speizer FE (1992) Diet and risk of clinical diabetes in women. AmJ Clin Nutr 55(5):1018–1023
21. Lopez-Ridaura R, Willett WC, Rimm EB, Liu S, Stampfer MJ,Manson JE, Hu FB (2004) Magnesium intake and risk of type 2diabetes in men and women. Diabetes Care 27(1):134–140
22. Afridi HI, Kazi TG, Kazi N, Jamali MK, Arain MB, Jalbani N,Sarfaraz RA, Shah A, Kandhro GA, Shah AQ, Baig JA (2008)Potassium, calcium, magnesium, and sodium levels in biologicalsamples of hypertensive and nonhypertensive diabetes mellitus pa-tients. Biol Trace Elem Res 124(3):206–224. doi:10.1007/s12011-008-8142-7
23. Lin YC, Lyle RM, McCabe LD, McCabe GP, Weaver CM,Teegarden D (2000) Dairy calcium is related to changes in bodycomposition during a two-year exercise intervention in young wom-en. J Am Coll Nutr 19(6):754–760
24. Isaia G, Giorgino R, Adami S (2001) High prevalence ofhypovitaminosis D in female type 2 diabetic population. DiabetesCare 24(8):1496
25. Barbagallo M, Novo S, Licata G, Resnick LM (1993) Diabetes,hypertension and atherosclerosis: pathophysiological role of intracel-lular ions. Int Angiol 12(4):365–370
26. Zemel MB (2002) Regulation of adiposity and obesity risk by dietarycalcium: mechanisms and implications. J Am Coll Nutr 21(2):146S–151S
27. Zemel MB (2003) Role of dietary calcium and dairy products inmodulating adiposity. Lipids 38(2):139–146
28. Jacqmain M, Doucet E, Despres JP, Bouchard C, Tremblay A (2003)Calcium intake, body composition, and lipoprotein-lipid concentra-tions in adults. Am J Clin Nutr 77(6):1448–1452
29. BasakiM, SaebM, Nazifi S, Shamsaei HA (2012) Zinc, copper, iron,and chromium concentrations in young patients with type 2 diabetesmellitus. Biol Trace Elem Res 148(2):161–164. doi:10.1007/s12011-012-9360-6
30. Afridi HI, Kazi TG, Kazi N, Jamali MK, Arain MB, Jalbani N, BaigJA, Sarfraz RA (2008) Evaluation of status of toxic metals in biolog-ical samples of diabetes mellitus patients. Diabetes Res Clin Pract80(2):280–288. doi:10.1016/j.diabres.2007.12.021
31. Rahman M, Axelson O (1995) Diabetes mellitus and arsenic expo-sure: a second look at case-control data from a Swedish coppersmelter. Occup Environ Med 52(11):773–774
32. Frost SC, Kohanski RA, Lane MD (1987) Effect of phenylarsineoxide on insulin-dependent protein phosphorylation and glucosetransport in 3 T3-L1 adipocytes. J Biol Chem 262(20):9872–9876
Hair Mineral Concentrations and Insulin Resistance 329