regulatory governance and sector performance - … · regulatory governance and sector performance:...
TRANSCRIPT
Policy ReseaRch WoRking PaPeR 4494
Regulatory Governance and Sector Performance:
Methodology and Evaluation for Electricity Distribution in Latin America
Luis AndresJosé Luis Guasch
Sebastián Lopez Azumendi
The World BankLatin America and the Caribbean RegionSustainable Development DepartmentJanuary 2008
WPS4494P
ublic
Dis
clos
ure
Aut
horiz
edP
ublic
Dis
clos
ure
Aut
horiz
edP
ublic
Dis
clos
ure
Aut
horiz
edP
ublic
Dis
clos
ure
Aut
horiz
edP
ublic
Dis
clos
ure
Aut
horiz
edP
ublic
Dis
clos
ure
Aut
horiz
edP
ublic
Dis
clos
ure
Aut
horiz
edP
ublic
Dis
clos
ure
Aut
horiz
ed
Produced by the Research Support Team
Abstract
The Policy Research Working Paper Series disseminates the findings of work in progress to encourage the exchange of ideas about development issues. An objective of the series is to get the findings out quickly, even if the presentations are less than fully polished. The papers carry the names of the authors and should be cited accordingly. The findings, interpretations, and conclusions expressed in this paper are entirely those of the authors. They do not necessarily represent the views of the International Bank for Reconstruction and Development/World Bank and its affiliated organizations, or those of the Executive Directors of the World Bank or the governments they represent.
Policy ReseaRch WoRking PaPeR 4494
This paper contributes to the literature that explores the link between regulatory governance and sector performance. The paper develops an index of regulatory governance and estimates its impact on sector performance, showing that indeed regulation and its governance matter. The authors use two unique databases: (i) the World Bank Performance Database, which contains detailed annual data for 250 private and public electricity companies in Latin America and the Caribbean; and (ii) the Electricity Regulatory Governance Database, which contains data on several aspects of the governance of electricity agencies in the region. The authors run different models to explain the impacts of change in ownership and different characteristics of the regulatory agency on the performance of the
This paper—a product of the Sustainable Development Department in the Latin America and the Caribbean Region—is part of a larger effort in the department to understand the determinants for performance in the infrastructure sectors. Policy Research Working Papers are also posted on the Web at http://econ.worldbank.org. The authors may be contacted at [email protected], [email protected], and [email protected].
utilities. The results suggest that the mere existence of a regulatory agency, regardless of the utilities’ ownership, has a significant impact on performance. Furthermore, after controlling for the existence of a regulatory agency, the ownership dummies are still significant and with the expected signs. The authors propose an experience measure in order to identify the gradual impact of the regulatory agency on utility performance. The results confirm this hypothesis. In addition, the paper explores two different measures of governance, an aggregate measure of regulatory governance, and an index based on principal components, including autonomy, transparency, and accountability. The findings show that the governance of regulatory agencies matters and has significant effects on performance.
Regulatory Governance and Sector
Performance: Methodology and
Evaluation for Electricity Distribution in
Latin America
Luis ANDRES, José Luis GUASCH, and Sebastián LOPEZ AZUMENDI*
* Luis A. Andres is Infrastructure Economist, Latin America and Caribbean Region, World Bank, Jose Luis Guasch is Senior Adviser on Regulation and Competitiveness, Latin America and Caribbean Region, World Bank and Professor of Economics, University of California, San Diego, and Sebastian Lopez Azumendi is consultant, Latin America and Caribbean Region, World Bank. They are grateful to Daniel Benitez, Georgeta Dragoiu, Antonio Estache, Martin Rossi, and Tomas Serebrisky. They are particularly indebted to Paulo Correa for sharing his data on Brazilian regulatory agencies and Mariam Dayoub and Aires da Conceicao for their assistance collecting the data in Brazil. Georgeta Dragoiu and Julio A. Gonzalez contributed in the collection of the performance data. The findings, interpretations and conclusions expressed herein do not necessarily reflect the views of the Board of the Executive Directors of the World Bank or the governments they represent.
- 2 -
1. INTRODUCTION According to an increasing body of empirical evidence, institutions matter for growth and development (Aron, 2000; Rodrik, 2004). The infrastructure sector generally, and the electricity sector in particular, are not an exception to this finding. Research on the subject has associated better sector performance, represented by higher levels of electricity generation per capita, to the governance of institutions responsible for the conduct of regulatory decisions (Cubbin and Stern, 2006). Despite the different approaches in the design of regulatory institutions, a separate agency from the government with reasonable levels of autonomy and technical expertise has emerged as the model and paradigm of a regulatory institution. The Latin America and the Caribbean (LAC) region has adopted that regulatory model. Beginning with Chile’s National Energy Commission in 1978 and ending in 2001 with Barbados’ Fair Trading Commission, the region presents a diverse spectrum of regulatory authorities and practices, today 70 percent of countries in the region have a separate entity—with varying degrees of independence—to regulate electricity markets (LAC Electricity Regulatory Governance Database, The World Bank, 2007). Even though more than 10 years have passed since the majority of LAC countries established independent agencies, the study of their governance and of its impact on sector performance has been limited and poorly focused. With some exceptions (Correa et al., 2006; Brown et al, 2007; Guasch and Spiller, 1999), the research on the subject has limited the assessment of regulatory agencies to a few governance indicators, specifically focusing on their independence from political authorities, and many of them have been case studies. This is particularly the case of the electricity sector of the LAC region where, beyond specific agency-based case studies, regional analyses that assess institutional design and governance behavior do not exist. In a previous paper (Andres et al, 2007b), we attempted to fill that gap. Based on selected literature on the subject, we defined and assessed electricity’s agencies governance through four main characteristics of their governance design: (i) autonomy from political authorities and of their management and regulatory competencies; (ii) transparency before institutional and non-institutional stakeholders; (iii) accountability to the three branches of government (Executive, Legislative, and Judiciary); and (iv) tools and capacities for the conduct of the regulatory policy and the improvement of its institutional development. We defined regulatory governance as the agency’s institutional design and structure that allows it to carry its functions as an independent regulator. Although we tried to capture as many governance variables as possible, some caveats need to be taken into account. Our assessment of the governance of regulatory agencies was based on the regulatory and institutional inputs that agencies need to implement their procedures and tools, but does not consider the outputs or outcomes of agencies’ regulation.1 In other words, the measurement of agencies’ governance is not an indicator
1 This has been the overwhelming mechanism used by the literature on the subject to assess the independence and other attributes of regulatory agencies. Although, ideally, we would like to include the effectiveness of
- 3 -
of the effectiveness of the use of their regulatory instruments (such as the methodology to calculate tariff readjustment) or the quality of stakeholders’ involvement in public consultations. Rather it is aimed at capturing the institutional conditions necessary to achieve good regulation regardless of their scope and impact on the sector’s performance (Correa et al., 2006). While we considered some practices (informal regulation) of agencies’ governance, the indicators used are referred to the operationalization of particular aspects of agencies’ governance but did not measure their full effectiveness. In this paper we combine our data on electricity agencies’ governance with data collected at the company level and assess the impact of regulatory agencies on utility performance in the electricity sector of the LAC region. This research fills a gap in the literature on the subject as previous attempts to interrelate the notions of governance of agencies and performance of the electricity sector have focused on very limited factors, affecting the scope and explanatory power of the research. On the governance side, previous research has only focused on the existence of an agency, a legal framework, or particular aspects of its governance, mainly its autonomy, emphasizing formal attributes. On the performance side, only electricity generation per capita was used as an indicator related to governance (Stern and Cubbin, 2005). Estache and Rossi have recently written a paper exploring the relationship between the establishment of an agency and the efficiency of the utilities as well as the welfare of the consumers (Estache and Rossi, 2007). In this paper, we go further as we create an aggregate index with different critical aspects of the governance of regulatory agencies and we relate and relate it to several factors that represent the performance of utilities and assess its impact on sector performance. Based on the hypothesis that agencies (and their governance) have a positive impact on performance, we develop a methodology where we ran different models in order to explain the contributions of change in ownership and different characteristics of the regulatory agency and of its governance on the performance of the utilities. The results suggest that the mere existence of a regulatory agency, independent of the utilities’ ownership has a significant impact on performance. Furthermore, after controlling for the existence of a regulatory agency, the ownership dummies are still significant and display the expected signs. We also proposed an experience measure in order to identify the gradual impact of the agency on performance. Our results confirm this hypothesis. In measuring governance, we explore two different approaches: (i) we use an aggregated measure of regulatory governance (Electricity Regulatory Governance Index, ERGI); and (ii) we decompose several dimensions of agencies governance into three main principal components related to both informal and formal aspects of autonomy, transparency, and accountability; we also include agencies’ attributes in setting tariff structure and levels as an independent variable together with the formal and informal dimensions of autonomy, transparency, accountability, and tools. The results suggest that governance matters and that it has significant impacts on performance when we simulated a standard deviation in each of these indexes. The paper is organized as follows: The next section is a review of the literature on institutional design of independent agencies as well as on the impact of private sector participation on sector performance. The third section proposes an analytical framework for regulatory governance. Section 4 presents the empirical approach for measuring the impacts on performance and section 5 describes the data. Section 6 provides a detailed
the different institutional arrangements on sector performance and on institutional quality outcomes, the cross-regional nature of our research and the limited resources to undertake this task convinced us of this approach as the most convenient.
- 4 -
description of the results. The final section of the paper presents the conclusions and the final remarks. 2. LITERATURE REVIEW This work will explore the relationship between two different literatures. The first is related to the impact of private sector participation on sector performance. The second is the literature related to the measurement of the governance of regulatory agencies. There is little knowledge on the relationship between these two. Some exceptions include a recent paper done by Sirtaine et al. (2004) and Estache and Rossi (2007). The literature on change in ownership, most of it related to ownership change, has focused on other sectors than electricity, such as in transportation (for example, Ramamurti, 1996; and Laurin and Bozec, 2000), telecommunications (for example, Ros, 1999; and Ramamurti, 1996) and manufacturing (for example, Frydman et al., 1999; and Boarman and Vining, 1989). In the case of privatization of the distribution of electricity, in particular for Latin American Countries, there is no comprehensive reference. Most of the articles that analyze this issue respond to case-studies or a country analysis (For examples, see Galal et al., 1994; and La Porta and Lopez-de-Silanes, 1999), and only the telecommunications sector has been more deeply analyzed in the region (see for example Ros and Banerjee, 2000). Some exceptions in these sectors are Estache and Rossi (2004) for the case of Electricity Distribution. For the case of the electrical sector in Latin America, there are broad descriptions of the reforms in the sector but no empirical analysis (see for example, Millan et al., 2001; Dussan, 1996; and Estache and Rodriguez Pardina, 1998). Information on Latin America can also be found in studies on developing countries (see for example Bacon and Besant-Jones, 2001). The recent review of Joskow (2003) summarizes the lessons learned across countries in the electricity market. The lack of available systematic data has prevented the development of empirical analysis in the subject. Nevertheless, some country analysis has been conducted. For example, Chisari et al. (1997) built a general equilibrium model in order to analyze the impact of privatizations in Argentina between 1993 and 1995. Among regional empirical research, Estache and Rossi (2004) analyze the impact of change in ownership on labor productivity and prices. They also evaluated how the different regulatory environments affected these outcomes in the region. They found that private firms use significantly less labor to produce a given bundle of output than public firms. Using similar data, Rossi (2004) also analyzed the firms’ operating and maintenance expenses. He found that these costs did not change significantly after the reform, and argued that outsourcing, in part, may bias the results for the decrease in labor usage and labor productivity. The literature on the governance of agencies in infrastructure has centered on the independent regulator model, which is reflected in the United States (US) independent commissions. An institutional design model that emphasizes agencies that make decisions independently from the Executive branch, are subject to the accountability of the Parliament, and budgeting autonomy has emerged as the paradigm of an infrastructure regulator. The first attempts to evaluate infrastructure regulatory agencies
- 5 -
made use of frameworks to assess the independence of Central Banks (Stern and Cubbin, 2005; and Oliverira, Machado, Novaes, and Ferreira, 2005). This fact explains the original emphasis on agencies’ independence and the reduced significance given to other aspects of their functioning such as accountability and transparency. The evolution of the subject and the initial stages of agencies functioning changed the original approach and introduced more comprehensive approaches to assessment. The literature has focused on three main aspects of their design: a) their independence from political authorities and the autonomy of their management, b) mechanisms to make them accountable (both to other branches of government and to the public), and c) the transparency of both their rule- and decision-making procedures. Within these categories, indicators range from simple measures to determine, for instance, independence (such as the legal instruments that created the agency) to more sophisticated mechanisms aimed, for example, at improving the quality of regulation (such as Regulatory Impact Analysis). Research on the regulatory governance of independent agencies has evolved and changed. Despite the original focus on independence, a growing body of literature has been using more comprehensive approaches to address their institutional design. Good examples of this trend are the works of Correa et al. (2006), Brown et al. (2006), and Andres et al. (2007), which approach the assessment of independent regulatory agencies through the classic lens of autonomy, transparency, and accountability, but include a wide array of indicators within these variables as well as innovative tools to understand and assess their functioning. Furthermore, this literature focuses not only on the formal aspects of regulation (provisions existing in agencies’ statues and laws) but also on informal regulation (aspects related to the implementation of the provisions’ components). This approach is useful as it recognizes the broad nature of the role of regulatory agencies: they are not only institutions responsible for driving investment in infrastructure but also are decentralized administrative bodies in charge as such of delivering public service to citizens. The following paragraphs review some of the literature on the subject. Stern and Holder (1999) develop a framework to assess the governance of economic regulators in several sectors (electricity, natural gas, telecom, transport, and water) in six developing Asian economies. Their appraisal scheme is composed of two variables related to the formal (institutional design) and informal (regulatory processes and practices) aspects of regulation. Results indicate middle-low levels of regulatory governance for all the sectors and countries included in the research. Moreover, results are relatively uniform by country across the industries, with the exception of India. Gilardi (2002) develops an independence index, covering regulators from five sectors in seven European countries. The author attempts to prove that governments delegate their regulatory powers and competences to independent regulatory agencies to enhance the credibility of their policies. Johannsen (2003) measures the formal independence of energy regulators in eight European countries. Using information collected through surveys, she assesses the independence of energy regulatory agencies through four main variables: (i) independence from government; (ii) independence from stakeholders; (iii) independence in the decision-making process; and (iv) organizational autonomy. The survey’s questions reflect formal regulation with no consideration for the practices of regulatory agencies. Gutierrez (2003) develops a Regulatory Framework Index (RFI) to asses the evolution of regulatory governance in the telecommunications sector during the period 1980–2001 in 25 LAC countries. According to Gutierrez, the RFI shows that most countries embraced
- 6 -
strong regulatory reforms along the lines recommended by experts and practitioners. In another article, Gilardi (2005) proposes three ways of evaluating independent regulators: the impact of an agency’s independence on regulatory quality, an agency’s respect for accountability standards, and the impact of agency’s independence on the performance of the market it regulates. Few have been the efforts to measure the practices of agencies’ governance, in addition to their formal design. In addition to Stern and Holder’s attempt to measure informal regulation, Magetti (2005) develops a framework to assess the real independence of regulatory agencies. His framework is composed of two main features: (i) the degree of self-determination of agencies’ preferences; and (ii) the degree to which those preferences are translated into regulatory acts. He applies his approach to the Swiss Federal Banking Commission (SFBC), finding that the SFBC has higher levels of informal independence from political authorities than from the regulatees. With regards to the degree of influence of relevant actors on the legislative process, Magetti finds the informal independence of the SFBC to be quite low, particularly vis-à-vis political decision makers. Three comprehensive approaches to assessing the governance of regulatory agencies have been those developed by Correa et al. (2006), Brown et al. (2006), and Andres et al. (2007b). Correa et al. provide a detailed analysis of Brazilian regulatory agencies. The authors select four aspects of agencies’ governance and, based on information collected through surveys, construct three indexes. The first index, the Regulatory Governance Index, is the base-line indicator and represents the most comprehensive dataset of all the indexes. The second index, the Parsimonious Index, captures those variables of the survey that are less subjective. The third index, the Facto Index, is related to actual practices of regulatory agencies. The report finds that independence and accountability are more developed than regulatory means and instruments (particularly qualified personnel and regulatory tools) and decision-making procedures (particularly with respect to those mechanisms that can guarantee consistency of decisions and reduce arbitrariness). It also finds that there is a clear difference between federal and state regulatory agencies, with the former achieving higher results in the autonomy, decision-making, and decision tools components of the Regulatory Governance Index. Brown et al. (2006) develop a framework to assess the effectiveness of a regulatory system. They aim to provide the policy-maker with different types of evaluations (quick, mid-level, and in-depth) to carry out these assessments. The authors include aspects related not only to the governance of the regulatory system (independence, transparency, and accountability of the regulator) but also to the substance or content of the regulation (decisions about tariff levels and structures, network access conditions for new and existing customers). Using the independent regulator model as the benchmark of analysis, they select 10 principles that should be followed in order to create an independent regulatory agency. The principles are accompanied by standards that establish the details for their implementation. In Andres et al. (2007b) we evaluate and benchmark electricity agencies of the region based on four main attributes of their governance: autonomy, transparency, accountability, and tools/capacities. Using a unique database, we develop an index of regulatory governance and rank all the agencies in the LAC countries. The index is an aggregate number of the evaluation of four key governance characteristics: autonomy, transparency, accountability, and regulatory tools, including not only formal aspects of regulation but also indicators related to actual implementation. Based on 18 different
- 7 -
indexes, we analyze the positions of agencies with regard to different aspects of their regulatory governance, considering not only performance in each variable but also scores in the different components of each category. This evaluation allows for the identification of particular country shortcomings regarding governance, and indicates needed improvements. A few papers have focused on the relationship between regulatory characteristics and performance. Sirtaine et al. (2004) that define a Regulatory Quality Index, considering three key aspects of regulatory quality: legal solidity, financial strength, and decision-making autonomy. Despite their small sample sizes, three out of the four models show that the regulatory quality variables are significant in overall terms, and that are on their own capable of explaining 20-25 percent of the internal rate of return of private investment in infrastructure projects in LAC. More recently, Estache and Rossi (2007) explored the causal relation between the establishment of a regulatory agency and the performance of the electricity sector. They exploit a unique dataset comprising firm-level information on a representative sample of 220 electric utilities from 51 developing and transition countries for the years 1985 to 2005. Their results indicate that regulatory agencies are associated with more efficient firms and with higher consumer welfare.
3. REGULATORY GOVERNANCE FRAMEWORK We base on our work on the governance of electricity agencies. In our paper, we selected a theoretical framework of analysis and designed a survey that was completed by nineteen countries of the region. The evaluation of agencies’ governance was done through several indexes that reflect different dimensions of agencies’ organization and functioning. Building upon Correa et al. (2006) and the majority of the research on the subject, we evaluate the electricity agencies’ governance structure. We develop two related indexes of regulatory governance--an aggregated measure (Electricity Regulatory Governance Index, ERGI) and a principal components based governance index that includes autonomy, transparency, and accountability-and evaluate the impact of agencies’ governance on the performance of the sector. Exploring this dimension is the objective of this section. Our conceptual framework or benchmark model of analysis is the independent regulator model. This decision was based on two main factors. The first factor is related to the use of independent regulatory agencies as the model for electricity regulation in the majority of the region. According to their database,2 almost 70 percent of the countries in the region have adopted a separate regulator from the line ministry as the preferred institutional arrangement for electricity regulation. The second factor is related to empirical evidence that considers the independent regulator model as the most effective approach in the regulation of privatized infrastructure industries (Brown et al., 2006). Following our work on the subject, we conceive regulatory agencies as both public bodies that are part of the public administration—and as such in charge of the delivery of public services—and as instruments to implement regulatory policies. This approach to assessing electricity agencies’ governance led us to consider not only existing research on
2 Based on the information collected through the surveys submitted by countries, Andres et al. (2007b) designed a database composed of 46 electricity regulators (including both federal and national regulators).

- 8 -
infrastructure agencies’ designs (documented in the literature review), but also notions and tools of public sector governance applied to decentralized structures of government. The regulatory governance of independent agencies is defined and assessed according to four variables of their design and functioning: autonomy, transparency, accountability, and tools. Each of the variables, with the exception of accountability, is composed of several elements, reflecting different aspects of autonomy, transparency, and tools. Variables for agencies’ governance reflect not only formal aspects (procedures and tools established in the agency’s statute or laws) but also the practices that derive from their implementation (informal regulation). Indicators for the informal elements of autonomy, accountability, and transparency represent the operationalization of some aspects of these variables. The variable “tools” is excluded from this analysis as the mere existence of these instruments implies their actual implementation. The first variable of agencies’ regulatory governance is autonomy. We define autonomy as the procedures, mechanisms, and instruments aimed at guaranteeing the independence of the agency from political authorities (political autonomy), the autonomous management of its resources (managerial autonomy), and the regulation of the sector (regulatory autonomy). Political autonomy represents the level of independence of the agency from government authorities and is measured by indicators that reflect the autonomy of the agency’s decision-making. Managerial autonomy involves the freedom of the agency to determine the administration of its resources and is measured by indicators that reflect the powers of the agency to determine its organizational structure and the use of its budget. Regulatory autonomy is defined by the extension of the agency’s regulatory powers in the electricity sector and is represented by indicators that capture agencies’ responsibilities in electricity regulation. The second aspect of agency’s governance is accountability, which we define as the procedures, mechanisms, and instruments aimed at guaranteeing an adequate level of control of the agency’s budget and performance by political authorities, namely the Parliament. Despite the successful use of mechanisms to assess the performance of agencies by governments, we prioritize the accountability of the agency before the Parliament. We based this decision on two main reasons: First, the fact that the institutional design model we follow is that of a US independent commission, where agencies are subject to parliamentary oversight. Second, the history of political interference of LAC line ministries in utilities underscores the importance of including other political stakeholders, such as the Parliament, in the regulatory process. We consider an institutional perspective of accountability only as defined by the relationships of the agency with the three branches of government (Executive, Legislative and the Judiciary) and do not further dissect the variable. The third variable is transparency. We define transparency as the procedures, mechanisms, and instruments aimed at guaranteeing the disclosure and publication of relevant regulatory and institutional information, the participation of stakeholders in the agency’s regulatory decisions and decision-making, and the application of rules aimed at governing the integrity and behavior of agency officials. We cover two dimensions of transparency: social transparency and institutional transparency. Social transparency is composed of indicators related to the involvement of non-institutional actors in the agency’s policy-making, including their access to the agency’s information. Institutional transparency is composed of indicators related to the transparent management of the agency that are not directly linked to stakeholder involvement, and includes issues such
- 9 -
as the publication of the agency’s annual report, the use of norms of ethics, and the existence of public exams for hiring employees. The fourth variable is tools, which we define as the instruments and mechanisms that contribute to the strengthening of different aspects of an agency’s functioning and the quality of its regulations. We include not only regulatory tools (e.g. mechanisms for tariff revision, regulatory accountability, instruments for monitoring technical standards), but also those instruments aimed at improving the institutional quality of the agency, or institutional tools (e.g. audits of agencies’ accounts, electronic files for consumer complaints, performance-based payments for employees, regulatory quality standards). This is the only variable whose analysis does not consider its formal and informal aspects; the sole existence of agencies’ tools implies their actual implementation. The pooling together of these indicators defines the Electricity Regulatory Governance Index (ERGI). This index was the main indicator in Andres et al. (2007b) and it is composed of 74 questions. The index is a single average of their seven main indexes: (i) formal autonomy; (ii) informal autonomy; (iii) formal transparency; (iv) informal transparency; (v) formal accountability; (vi) informal accountability; and (vii) tools. The rankings across the regulatory agencies were tested with other weights across the indexes3; however, the rakings were similar to the one chosen in the paper as a simple average of the indexes. According to our results, the region shows a reasonable governance design of their regulatory agencies. Nevertheless, the implementation of the independent regulator model still faces several challenges. This is particularly evident in political autonomy and in the informal aspects of governance, where the region shows the largest number of countries with the lowest scores. In our main index, ERGI, Trinidad and Tobago, Brazil, Bolivia, and Peru show the best results and Ecuador, Honduras, and Chile the worst performances. The rest of the countries vary according to the different indexes. Table 1 presents their main results and rankings.
3 Among other robust analysis the paper assigned different weights to the seven indexes. First they put double weight to the variables related to set and enforce tariffs. As many sector specialists argue, this is, per se, the main attribute of a regulatory agency. A second approach was based on the Principal Component Analysis approach. The methodology develops a composite index by defining a real valued function over the relevant variables objectively. The principle of this method lies in the fact that when different characteristics are observed about a set of events, the characteristic with higher variation explains a higher proportion of the variation in the dependent variable compared to a variable with lesser variation in it. Therefore, the issue is one of finding weights to be given to each of the concerned variables determined on the principle that the objective is to maximize the variation in the linear composite of these variables. In other words, this approach allows for identifying patterns in data, and expressing the data in such a way as to highlight their similarities and differences.
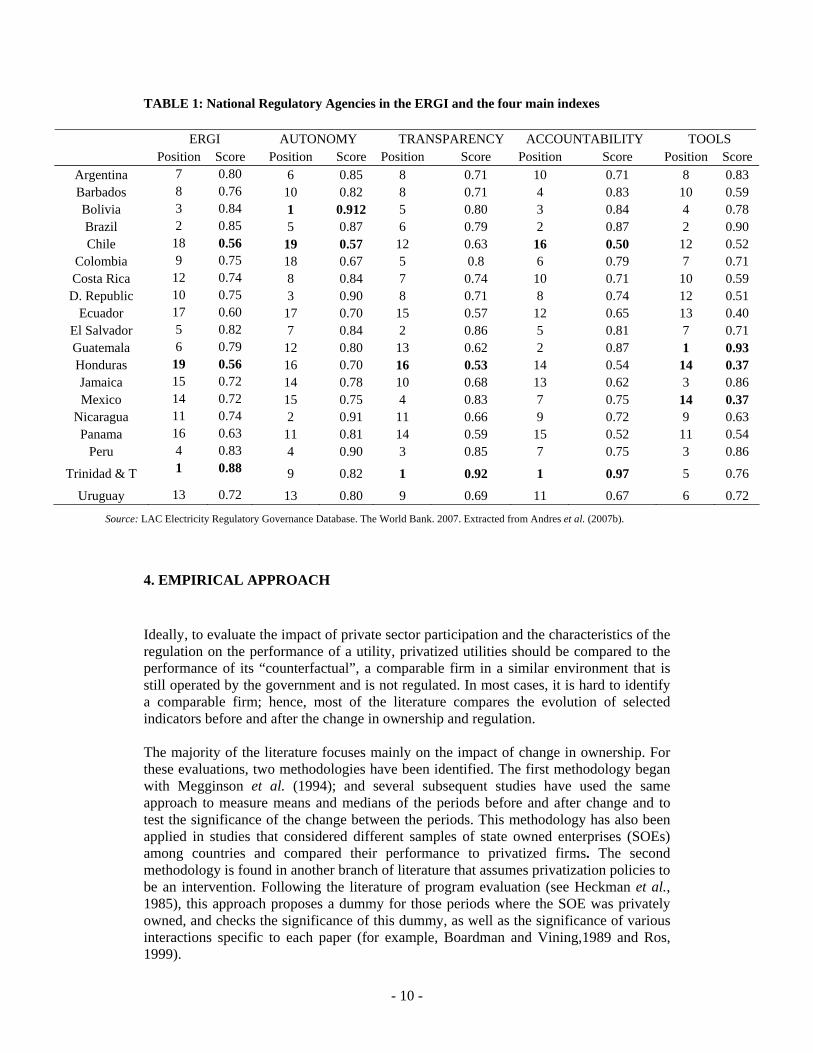
TABLE 1: National Regulatory Agencies in the ERGI and the four main indexes
ERGI AUTONOMY TRANSPARENCY ACCOUNTABILITY TOOLS Position Score Position Score Position Score Position Score Position Score
Argentina 7 0.80 6 0.85 8 0.71 10 0.71 8 0.83 Barbados 8 0.76 10 0.82 8 0.71 4 0.83 10 0.59 Bolivia 3 0.84 1 0.912 5 0.80 3 0.84 4 0.78 Brazil 2 0.85 5 0.87 6 0.79 2 0.87 2 0.90 Chile 18 0.56 19 0.57 12 0.63 16 0.50 12 0.52
Colombia 9 0.75 18 0.67 5 0.8 6 0.79 7 0.71 Costa Rica 12 0.74 8 0.84 7 0.74 10 0.71 10 0.59 D. Republic 10 0.75 3 0.90 8 0.71 8 0.74 12 0.51
Ecuador 17 0.60 17 0.70 15 0.57 12 0.65 13 0.40 El Salvador 5 0.82 7 0.84 2 0.86 5 0.81 7 0.71 Guatemala 6 0.79 12 0.80 13 0.62 2 0.87 1 0.93 Honduras 19 0.56 16 0.70 16 0.53 14 0.54 14 0.37 Jamaica 15 0.72 14 0.78 10 0.68 13 0.62 3 0.86 Mexico 14 0.72 15 0.75 4 0.83 7 0.75 14 0.37
Nicaragua 11 0.74 2 0.91 11 0.66 9 0.72 9 0.63 Panama 16 0.63 11 0.81 14 0.59 15 0.52 11 0.54
Peru 4 0.83 4 0.90 3 0.85 7 0.75 3 0.86
Trinidad & T 1 0.88 9 0.82 1 0.92 1 0.97 5 0.76
Uruguay 13 0.72 13 0.80 9 0.69 11 0.67 6 0.72 ASource: L C Electricity Regulatory Governance Database. The World Bank. 2007. Extracted from Andres et al. (2007b).
4. EMPIRICAL APPROACH Ideally, to evaluate the impact of private sector participation and the characteristics of the regulation on the performance of a utility, privatized utilities should be compared to the performance of its “counterfactual”, a comparable firm in a similar environment that is still operated by the government and is not regulated. In most cases, it is hard to identify a comparable firm; hence, most of the literature compares the evolution of selected indicators before and after the change in ownership and regulation. The majority of the literature focuses mainly on the impact of change in ownership. For these evaluations, two methodologies have been identified. The first methodology began with Megginson et al. (1994); and several subsequent studies have used the same approach to measure means and medians of the periods before and after change and to test the significance of the change between the periods. This methodology has also been applied in studies that considered different samples of state owned enterprises (SOEs) among countries and compared their performance to privatized firms. The second methodology is found in another branch of literature that assumes privatization policies to be an intervention. Following the literature of program evaluation (see Heckman et al., 1985), this approach proposes a dummy for those periods where the SOE was privately owned, and checks the significance of this dummy, as well as the significance of various interactions specific to each paper (for example, Boardman and Vining,1989 and Ros, 1999).
- 10 -
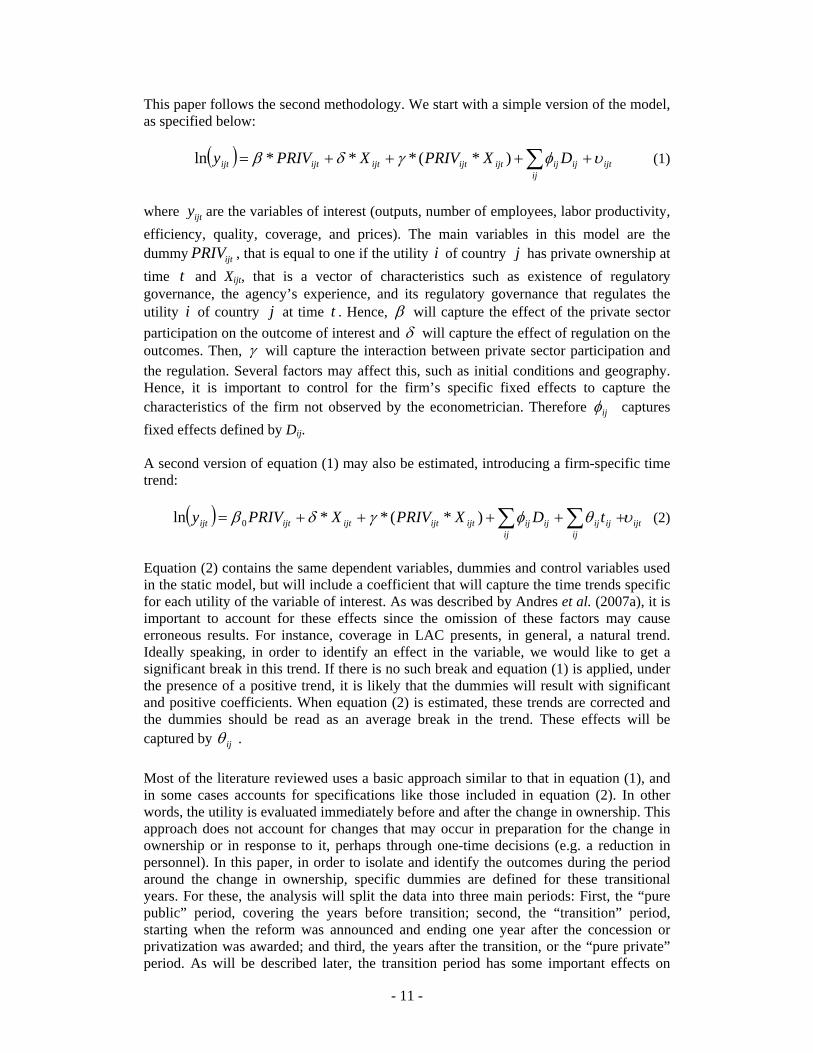
This paper follows the second methodology. We start with a simple version of the model, as specified below:
( ) ∑ ++++=
ijijtijijijtijtijtijtijt DXPRIVXPRIVy υφγδβ )*(***ln (1)
where ijty are the variables of interest (outputs, number of employees, labor productivity, efficiency, quality, coverage, and prices). The main variables in this model are the dummy , that is equal to one if the utility of country ijtPRIV i j has private ownership at time and Xijt, that is a vector of characteristics such as existence of regulatory governance, the agency’s experience, and its regulatory governance that regulates the utility of country
t
i j at time t . Hence, β will capture the effect of the private sector participation on the outcome of interest and δ will capture the effect of regulation on the outcomes. Then, γ will capture the interaction between private sector participation and the regulation. Several factors may affect this, such as initial conditions and geography. Hence, it is important to control for the firm’s specific fixed effects to capture the characteristics of the firm not observed by the econometrician. Therefore ijφ captures fixed effects defined by Dij. A second version of equation (1) may also be estimated, introducing a firm-specific time trend:
( ) ∑ ∑ +++++=ij
ijtij
ijijijijijtijtijtijtijt tDXPRIVXPRIVy υθφγδβ )*(**ln 0 (2)
Equation (2) contains the same dependent variables, dummies and control variables used in the static model, but will include a coefficient that will capture the time trends specific for each utility of the variable of interest. As was described by Andres et al. (2007a), it is important to account for these effects since the omission of these factors may cause erroneous results. For instance, coverage in LAC presents, in general, a natural trend. Ideally speaking, in order to identify an effect in the variable, we would like to get a significant break in this trend. If there is no such break and equation (1) is applied, under the presence of a positive trend, it is likely that the dummies will result with significant and positive coefficients. When equation (2) is estimated, these trends are corrected and the dummies should be read as an average break in the trend. These effects will be captured by ijθ . Most of the literature reviewed uses a basic approach similar to that in equation (1), and in some cases accounts for specifications like those included in equation (2). In other words, the utility is evaluated immediately before and after the change in ownership. This approach does not account for changes that may occur in preparation for the change in ownership or in response to it, perhaps through one-time decisions (e.g. a reduction in personnel). In this paper, in order to isolate and identify the outcomes during the period around the change in ownership, specific dummies are defined for these transitional years. For these, the analysis will split the data into three main periods: First, the “pure public” period, covering the years before transition; second, the “transition” period, starting when the reform was announced and ending one year after the concession or privatization was awarded; and third, the years after the transition, or the “pure private” period. As will be described later, the transition period has some important effects on
- 11 -
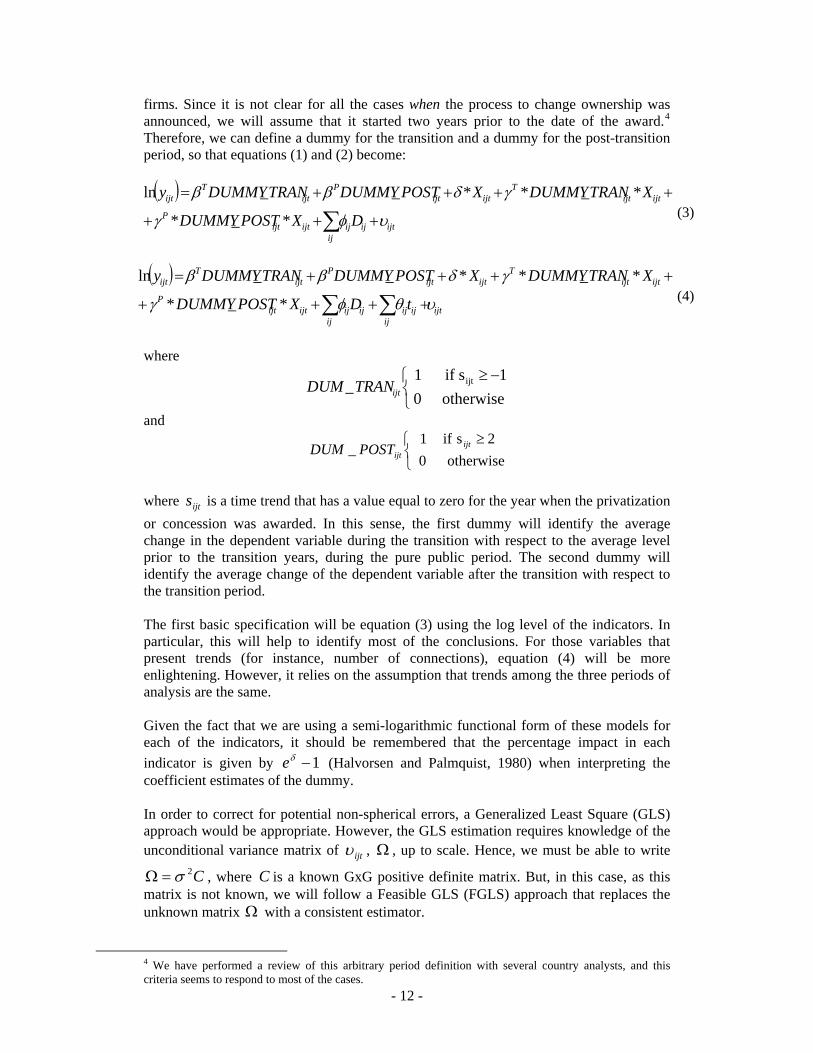
firms. Since it is not clear for all the cases when the process to change ownership was announced, we will assume that it started two years prior to the date of the award.4 Therefore, we can define a dummy for the transition and a dummy for the post-transition period, so that equations (1) and (2) become:
( )
∑ +++
++++=
ijijtijijijtijt
P
ijtijtT
ijtijtP
ijtT
ijt
DXPOSTDUMMY
XTRANDUMMYXPOSTDUMMYTRANDUMMYy
υφγ
γδββ
*_*
*_**__ln (3)
( )
∑ ∑ ++++
++++=
ijijt
ijijijijijijtijt
P
ijtijtT
ijtijtP
ijtT
ijt
tDXPOSTDUMMY
XTRANDUMMYXPOSTDUMMYTRANDUMMYy
υθφγ
γδββ
*_*
*_**__ln (4)
where
⎩⎨⎧ −≥
otherwise 0 1s if 1
_ ijtijtTRANDUM
and
⎩⎨⎧ ≥
otherwise 0 2s if 1
_ ijtijtPOSTDUM
where is a time trend that has a value equal to zero for the year when the privatization or concession was awarded. In this sense, the first dummy will identify the average change in the dependent variable during the transition with respect to the average level prior to the transition years, during the pure public period. The second dummy will identify the average change of the dependent variable after the transition with respect to the transition period.
ijts
The first basic specification will be equation (3) using the log level of the indicators. In particular, this will help to identify most of the conclusions. For those variables that present trends (for instance, number of connections), equation (4) will be more enlightening. However, it relies on the assumption that trends among the three periods of analysis are the same.
Given the fact that we are using a semi-logarithmic functional form of these models for each of the indicators, it should be remembered that the percentage impact in each indicator is given by (Halvorsen and Palmquist, 1980) when interpreting the coefficient estimates of the dummy.
1−δe
In order to correct for potential non-spherical errors, a Generalized Least Square (GLS) approach would be appropriate. However, the GLS estimation requires knowledge of the unconditional variance matrix of ijtυ , Ω , up to scale. Hence, we must be able to write
, where C is a known GxG positive definite matrix. But, in this case, as this matrix is not known, we will follow a Feasible GLS (FGLS) approach that replaces the unknown matrix Ω with a consistent estimator.
C2σ=Ω
- 12 -
4 We have performed a review of this arbitrary period definition with several country analysts, and this criteria seems to respond to most of the cases.
- 13 -
5. DATA We work with two unique databases. In terms of performance, we use the Electricity Benchmarking data (World Bank, 2007). This benchmarking initiative contributes primarily with the collection and analysis of detailed data for 26 countries and 250 utilities that represent 88 percent of the electricity connections in the Latin American and Caribbean region. Through in-house and field data collection, this work compiled data on the electricity distribution sector based on accomplishments in output, coverage, labor productivity, input, operating performance, service quality, and tariffs. Based on the results of these performance indicators, the World Bank (2007) benchmarks the performance of electricity distribution at the regional, country, and utility-level. Among the utilities in this database we selected those utilities that had a change in ownership and/or present a regulatory agency. Out of the 250 utilities 216 were retained. The definitions of the variables selected for this report can be found in Annex 1. For the data on regulatory governance we used the one collected in our previous work Andres et al. (2007). As previously stated, we designed a survey that was distributed to all electricity regulatory agencies in the region, including not only national but also provincial or state regulators (particularly in the cases of Argentina and Brazil). The questionnaire was composed of 97 questions (for the full version of the survey, see Appendix 1 in Andres et al. 2007b) reflecting the 4 variables of agencies’ governance and both formal and informal aspects of their functioning. We also included a general section aimed at capturing characteristics of electricity markets such as the methodology for tariff calculation, the degree of market liberalization, and social tariffs. We received responses from 43 electricity regulatory agencies, whose coverage in terms of electricity consumers exceeds 90 percent of the region. Annex 2 presents the list of the national regulatory agencies with some selected characteristics. Each country or state was represented by its own regulatory agency, with the exception of Colombia and Chile, for which we assigned unique values since they each have two different agencies with regulatory functions. In both Colombia and Chile, regulatory responsibilities are shared between a National Energy Commission in charge of the main regulatory aspects (tariffs, approval of contracts) and an Oversight Electricity Agency (in the case of Chile, the Superintendencia de Electricidad y Combustibles and in the case of Colombia, the Superintendencia de Servicios Públicos) in charge of the sector’s oversight (service quality, sanctions’ enforcing, consumer complaints). Considering that both agencies perform different tasks that in other countries are undertaken by only one regulator, we “merged” both administrative bodies and assigned a unique value for the country. For those institutional aspects that should be reflected in both agencies, such as the independence of their decision-making (e.g.. the appointment of directors) or the transparency of their management (e.g. account audits), we assigned the country an average score calculated from both agencies’ scores on the same question. For instance, if the Comisión Nacional de Energía of Chile was assigned 0 for not auditing its accounts and the Superintendencia de Electricidad y Combustibles was assigned 1 for auditing its accounts, then Chile would obtain 0.5 in that question. In those aspects where the agencies had separate responsibilities (e.g. the regulation of tariffs by the Comisión Reguladora de la Energía of Colombia and the reception of consumers’ claims by the Superintendencia de Servicios Públicos), we assigned the country the score achieved by the agency with responsibility in that issue, regardless of the score obtained by the other agency for the same issue. Table 2 presents the summary statistics.
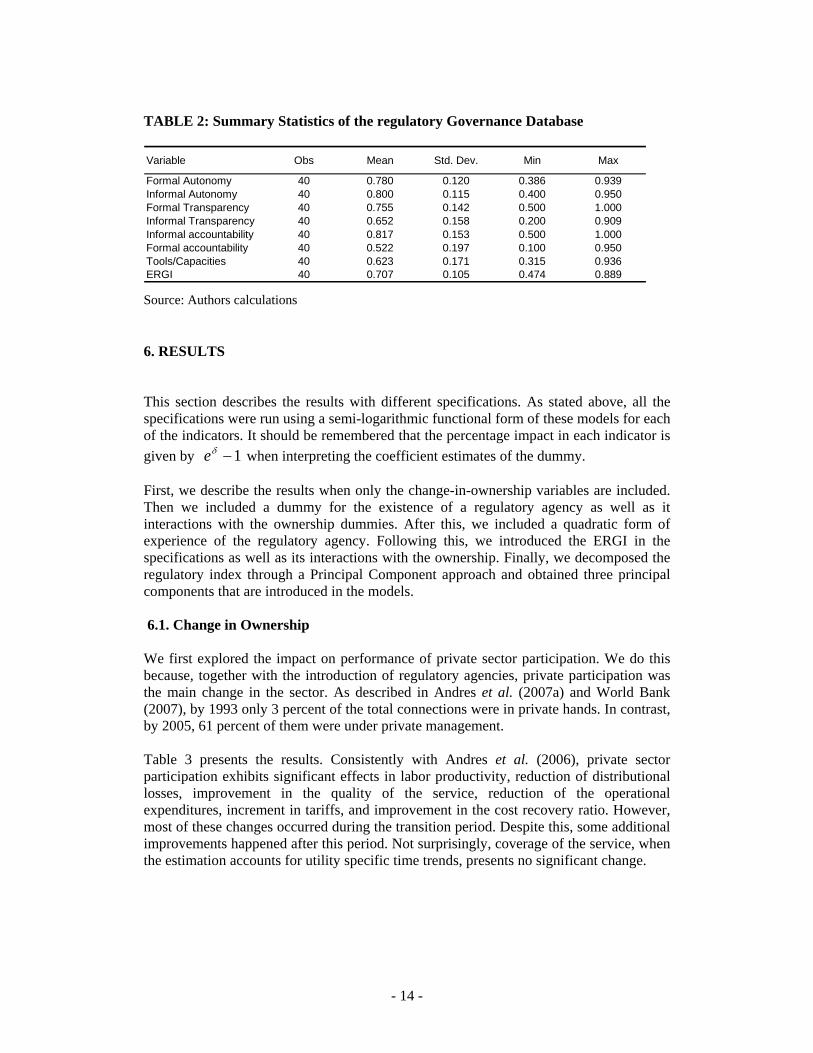
TABLE 2: Summary Statistics of the regulatory Governance Database Variable Obs Mean Std. Dev. Min Max
Formal Autonomy 40 0.780 0.120 0.386 0.939Informal Autonomy 40 0.800 0.115 0.400 0.950Formal Transparency 40 0.755 0.142 0.500 1.000Informal Transparency 40 0.652 0.158 0.200 0.909Informal accountability 40 0.817 0.153 0.500 1.000Formal accountability 40 0.522 0.197 0.100 0.950Tools/Capacities 40 0.623 0.171 0.315 0.936ERGI 40 0.707 0.105 0.474 0.889 Source: Authors calculations
6. RESULTS This section describes the results with different specifications. As stated above, all the specifications were run using a semi-logarithmic functional form of these models for each of the indicators. It should be remembered that the percentage impact in each indicator is given by when interpreting the coefficient estimates of the dummy. 1−δe First, we describe the results when only the change-in-ownership variables are included. Then we included a dummy for the existence of a regulatory agency as well as it interactions with the ownership dummies. After this, we included a quadratic form of experience of the regulatory agency. Following this, we introduced the ERGI in the specifications as well as its interactions with the ownership. Finally, we decomposed the regulatory index through a Principal Component approach and obtained three principal components that are introduced in the models. 6.1. Change in Ownership We first explored the impact on performance of private sector participation. We do this because, together with the introduction of regulatory agencies, private participation was the main change in the sector. As described in Andres et al. (2007a) and World Bank (2007), by 1993 only 3 percent of the total connections were in private hands. In contrast, by 2005, 61 percent of them were under private management. Table 3 presents the results. Consistently with Andres et al. (2006), private sector participation exhibits significant effects in labor productivity, reduction of distributional losses, improvement in the quality of the service, reduction of the operational expenditures, increment in tariffs, and improvement in the cost recovery ratio. However, most of these changes occurred during the transition period. Despite this, some additional improvements happened after this period. Not surprisingly, coverage of the service, when the estimation accounts for utility specific time trends, presents no significant change.
- 14 -
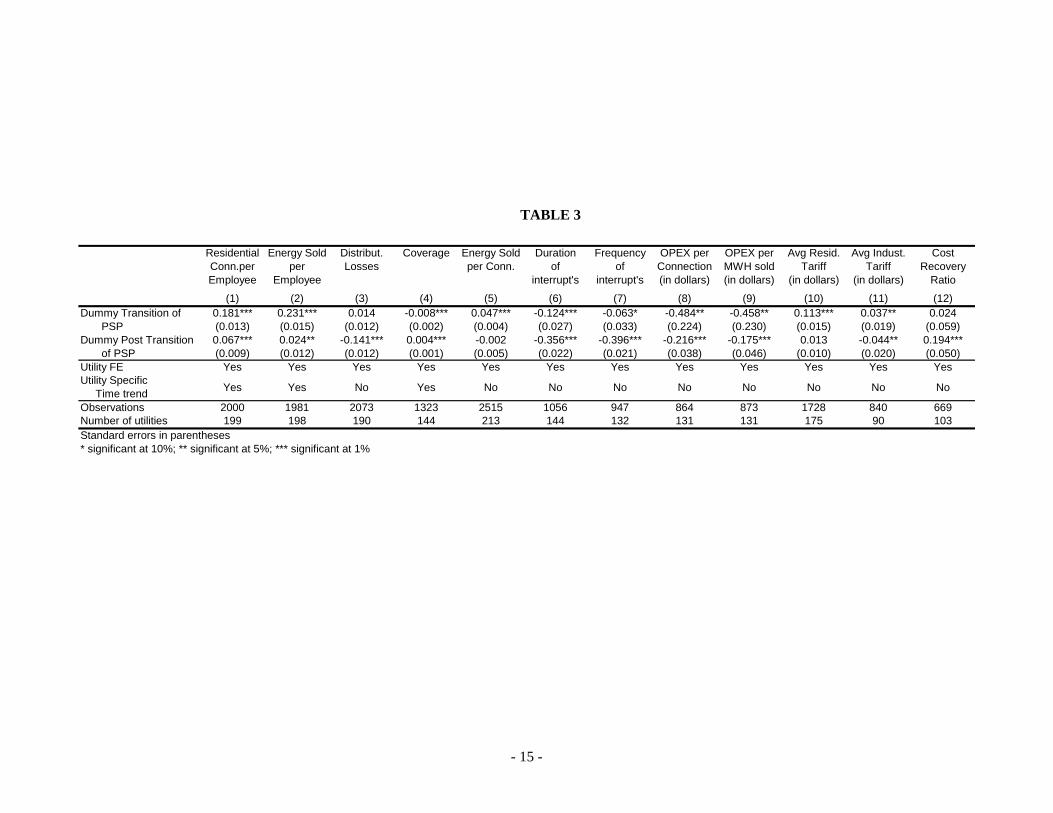
TABLE 3
Residential Conn.per Employee
Energy Sold per
Employee
Distribut. Losses
Coverage Energy Sold per Conn.
Duration of
interrupt's
Frequency of
interrupt's
OPEX per Connection (in dollars)
OPEX per MWH sold (in dollars)
Avg Resid. Tariff
(in dollars)
Avg Indust. Tariff
(in dollars)
Cost Recovery
Ratio
(1) (2) (3) (4) (5) (6) (7) (8) (9) (10) (11) (12)Dummy Transition of 0.181*** 0.231*** 0.014 -0.008*** 0.047*** -0.124*** -0.063* -0.484** -0.458** 0.113*** 0.037** 0.024 PSP (0.013) (0.015) (0.012) (0.002) (0.004) (0.027) (0.033) (0.224) (0.230) (0.015) (0.019) (0.059)Dummy Post Transition 0.067*** 0.024** -0.141*** 0.004*** -0.002 -0.356*** -0.396*** -0.216*** -0.175*** 0.013 -0.044** 0.194*** of PSP (0.009) (0.012) (0.012) (0.001) (0.005) (0.022) (0.021) (0.038) (0.046) (0.010) (0.020) (0.050)Utility FE Yes Yes Yes Yes Yes Yes Yes Yes Yes Yes Yes YesUtility Specific Time trend Yes Yes No Yes No No No No No No No No
Observations 2000 1981 2073 1323 2515 1056 947 864 873 1728 840 669Number of utilities 199 198 190 144 213 144 132 131 131 175 90 103Standard errors in parentheses* significant at 10%; ** significant at 5%; *** significant at 1%
- 15 -
- 16 -
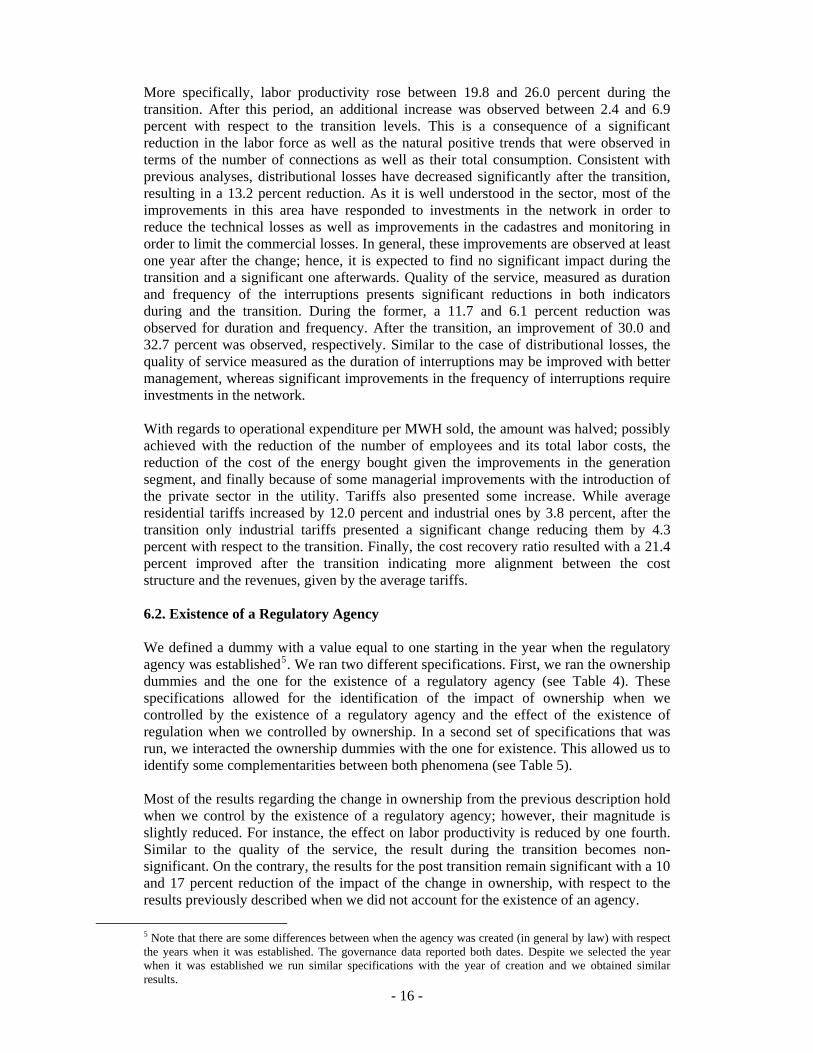
More specifically, labor productivity rose between 19.8 and 26.0 percent during the transition. After this period, an additional increase was observed between 2.4 and 6.9 percent with respect to the transition levels. This is a consequence of a significant reduction in the labor force as well as the natural positive trends that were observed in terms of the number of connections as well as their total consumption. Consistent with previous analyses, distributional losses have decreased significantly after the transition, resulting in a 13.2 percent reduction. As it is well understood in the sector, most of the improvements in this area have responded to investments in the network in order to reduce the technical losses as well as improvements in the cadastres and monitoring in order to limit the commercial losses. In general, these improvements are observed at least one year after the change; hence, it is expected to find no significant impact during the transition and a significant one afterwards. Quality of the service, measured as duration and frequency of the interruptions presents significant reductions in both indicators during and the transition. During the former, a 11.7 and 6.1 percent reduction was observed for duration and frequency. After the transition, an improvement of 30.0 and 32.7 percent was observed, respectively. Similar to the case of distributional losses, the quality of service measured as the duration of interruptions may be improved with better management, whereas significant improvements in the frequency of interruptions require investments in the network. With regards to operational expenditure per MWH sold, the amount was halved; possibly achieved with the reduction of the number of employees and its total labor costs, the reduction of the cost of the energy bought given the improvements in the generation segment, and finally because of some managerial improvements with the introduction of the private sector in the utility. Tariffs also presented some increase. While average residential tariffs increased by 12.0 percent and industrial ones by 3.8 percent, after the transition only industrial tariffs presented a significant change reducing them by 4.3 percent with respect to the transition. Finally, the cost recovery ratio resulted with a 21.4 percent improved after the transition indicating more alignment between the cost structure and the revenues, given by the average tariffs. 6.2. Existence of a Regulatory Agency We defined a dummy with a value equal to one starting in the year when the regulatory agency was established5. We ran two different specifications. First, we ran the ownership dummies and the one for the existence of a regulatory agency (see Table 4). These specifications allowed for the identification of the impact of ownership when we controlled by the existence of a regulatory agency and the effect of the existence of regulation when we controlled by ownership. In a second set of specifications that was run, we interacted the ownership dummies with the one for existence. This allowed us to identify some complementarities between both phenomena (see Table 5). Most of the results regarding the change in ownership from the previous description hold when we control by the existence of a regulatory agency; however, their magnitude is slightly reduced. For instance, the effect on labor productivity is reduced by one fourth. Similar to the quality of the service, the result during the transition becomes non-significant. On the contrary, the results for the post transition remain significant with a 10 and 17 percent reduction of the impact of the change in ownership, with respect to the results previously described when we did not account for the existence of an agency.
5 Note that there are some differences between when the agency was created (in general by law) with respect the years when it was established. The governance data reported both dates. Despite we selected the year when it was established we run similar specifications with the year of creation and we obtained similar results.
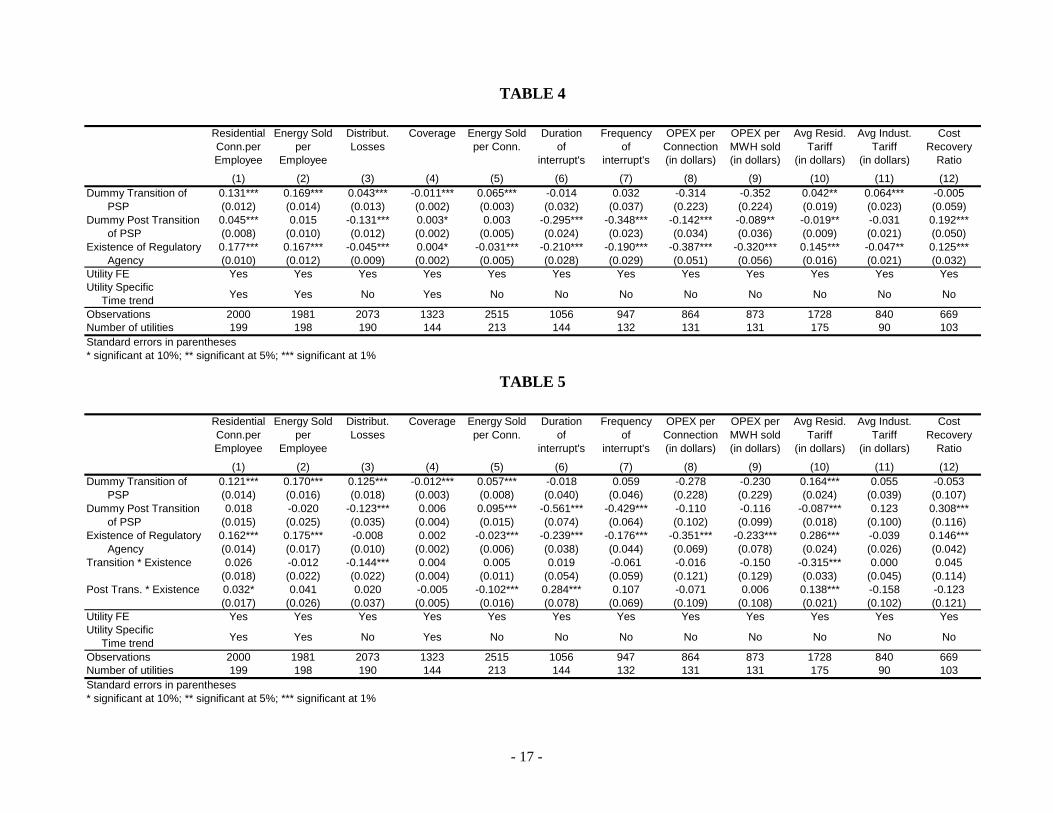
TABLE 4
Residential Conn.per Employee
Energy Sold per
Employee
Distribut. Losses
Coverage Energy Sold per Conn.
Duration of
interrupt's
Frequency of
interrupt's
OPEX per Connection (in dollars)
OPEX per MWH sold (in dollars)
Avg Resid. Tariff
(in dollars)
Avg Indust. Tariff
(in dollars)
Cost Recovery
Ratio
(1) (2) (3) (4) (5) (6) (7) (8) (9) (10) (11) (12)Dummy Transition of 0.131*** 0.169*** 0.043*** -0.011*** 0.065*** -0.014 0.032 -0.314 -0.352 0.042** 0.064*** -0.005 PSP (0.012) (0.014) (0.013) (0.002) (0.003) (0.032) (0.037) (0.223) (0.224) (0.019) (0.023) (0.059)Dummy Post Transition 0.045*** 0.015 -0.131*** 0.003* 0.003 -0.295*** -0.348*** -0.142*** -0.089** -0.019** -0.031 0.192*** of PSP (0.008) (0.010) (0.012) (0.002) (0.005) (0.024) (0.023) (0.034) (0.036) (0.009) (0.021) (0.050)Existence of Regulatory 0.177*** 0.167*** -0.045*** 0.004* -0.031*** -0.210*** -0.190*** -0.387*** -0.320*** 0.145*** -0.047** 0.125*** Agency (0.010) (0.012) (0.009) (0.002) (0.005) (0.028) (0.029) (0.051) (0.056) (0.016) (0.021) (0.032)Utility FE Yes Yes Yes Yes Yes Yes Yes Yes Yes Yes Yes YesUtility Specific Time trend Yes Yes No Yes No No No No No No No No
Observations 2000 1981 2073 1323 2515 1056 947 864 873 1728 840 669Number of utilities 199 198 190 144 213 144 132 131 131 175 90 103Standard errors in parentheses* significant at 10%; ** significant at 5%; *** significant at 1%
TABLE 5
Residential Conn.per Employee
Energy Sold per
Employee
Distribut. Losses
Coverage Energy Sold per Conn.
Duration of
interrupt's
Frequency of
interrupt's
OPEX per Connection (in dollars)
OPEX per MWH sold (in dollars)
Avg Resid. Tariff
(in dollars)
Avg Indust. Tariff
(in dollars)
Cost Recovery
Ratio
(1) (2) (3) (4) (5) (6) (7) (8) (9) (10) (11) (12)Dummy Transition of 0.121*** 0.170*** 0.125*** -0.012*** 0.057*** -0.018 0.059 -0.278 -0.230 0.164*** 0.055 -0.053 PSP (0.014) (0.016) (0.018) (0.003) (0.008) (0.040) (0.046) (0.228) (0.229) (0.024) (0.039) (0.107)Dummy Post Transition 0.018 -0.020 -0.123*** 0.006 0.095*** -0.561*** -0.429*** -0.110 -0.116 -0.087*** 0.123 0.308*** of PSP (0.015) (0.025) (0.035) (0.004) (0.015) (0.074) (0.064) (0.102) (0.099) (0.018) (0.100) (0.116)Existence of Regulatory 0.162*** 0.175*** -0.008 0.002 -0.023*** -0.239*** -0.176*** -0.351*** -0.233*** 0.286*** -0.039 0.146*** Agency (0.014) (0.017) (0.010) (0.002) (0.006) (0.038) (0.044) (0.069) (0.078) (0.024) (0.026) (0.042)Transition * Existence 0.026 -0.012 -0.144*** 0.004 0.005 0.019 -0.061 -0.016 -0.150 -0.315*** 0.000 0.045
(0.018) (0.022) (0.022) (0.004) (0.011) (0.054) (0.059) (0.121) (0.129) (0.033) (0.045) (0.114)Post Trans. * Existence 0.032* 0.041 0.020 -0.005 -0.102*** 0.284*** 0.107 -0.071 0.006 0.138*** -0.158 -0.123
(0.017) (0.026) (0.037) (0.005) (0.016) (0.078) (0.069) (0.109) (0.108) (0.021) (0.102) (0.121)Utility FE Yes Yes Yes Yes Yes Yes Yes Yes Yes Yes Yes YesUtility Specific Time trend Yes Yes No Yes No No No No No No No No
Observations 2000 1981 2073 1323 2515 1056 947 864 873 1728 840 669Number of utilities 199 198 190 144 213 144 132 131 131 175 90 103Standard errors in parentheses* significant at 10%; ** significant at 5%; *** significant at 1%
- 17 -
- 18 -
With respect to the existence of a regulatory agency when we controlled by change in ownership we found a significant and desirable impact in most of the indicators. For instance, under the presence of a regulatory agency, utilities resulted with 19.4 and 18.2 percent higher labor productivity. Similarly, utilities reported 18.9 percent less average duration and 17.3 percent less frequency of interruptions. With respect to operational expenditures, utilities regulated by an agency resulted between 27.4 and 32.1 percent less expenditures. Residential tariffs reported a 13.5 percent increase under the presence of a regulatory agency while industrial ones presented a 4.6 percent reduction. Consistent with the previous results, the cost recovery ratio resulted significantly higher with 13.3 percent. 6.3. Experience of the Regulatory Agency We defined an experience variable as the years since the establishment of the regulatory agency. We argue that agencies can learn “by doing” in order to obtain the desired outcomes. We assumed a quadratic form for this experience acquisition. As expected, these results are correlated with the ones with the existence of a regulatory agency. However, these estimations support the hypothesis of gradual improvements of utilities’ performance under the presence of regulatory agencies. As before, most of the results on the change in ownership from the previous description hold when we control by the experience of a regulatory agency; however, we also observed reductions in the magnitude of their effect when we introduced experience variables in the model. The linear coefficient of experience variables resulted significant and with the expected signs in all the models. For instance, after controlling for the change in ownership, utilities resulted with 1.4 additional increments per year in labor productivity. Similarly, distributional losses and average consumption per connection reported a 1.8 percent reduction per year. Both quality indicators resulted with an annual improvement of 9.0 percent. Operational expenditures presented between 1.6 and 5.5 percent per year. Consistent with the previous results, residential tariffs reported an increase of 2.6 percent per year while industrial ones reported a 1.3 percent annual reduction. Consequently, the cost recovery ratio resulted with significant annual improvements.
TABLE 6
Residential Conn.per Employee
Distribut. Losses
Coverage Energy Sold per Conn.
Duration of
interrupt's
Frequency of
interrupt's
OPEX per Connection (in dollars)
OPEX per MWH sold (in dollars)
Avg Resid. Tariff
(in dollars)
Avg Indust. Tariff
(in dollars)
Cost Recovery
Ratio
(1) (2) (3) (4) (5) (6) (7) (8) (9) (10) (11)Dummy Transition of 0.175*** 0.030*** -0.013*** 0.062*** -0.022 0.044 -0.463** -0.451** 0.053*** 0.027 0.043 PSP (0.014) (0.011) (0.002) (0.005) (0.027) (0.033) (0.220) (0.228) (0.016) (0.019) (0.059)Dummy Post Transition 0.101*** -0.091*** 0.006*** 0.024*** -0.112*** -0.167*** -0.152*** -0.158*** -0.089*** -0.058*** 0.157*** of PSP (0.008) (0.012) (0.002) (0.006) (0.025) (0.024) (0.036) (0.046) (0.011) (0.021) (0.049)Duration of the Regulat. -0.014*** -0.018*** 0.004*** -0.018*** -0.094*** -0.094*** -0.057*** -0.016*** 0.026*** -0.013*** 0.040*** Agency (0.003) (0.002) (0.001) (0.001) (0.008) (0.007) (0.005) (0.004) (0.004) (0.003) (0.005)Duration of the Regulat. -0.000 0.001*** -0.001*** 0.001*** 0.004*** 0.004*** 0.003*** 0.001*** 0.001*** 0.002*** -0.001*** Agency (Sq.) (0.000) (0.000) (0.000) (0.000) (0.001) (0.001) (0.000) (0.000) (0.000) (0.000) (0.000)Utility FE Yes Yes Yes Yes Yes Yes Yes Yes Yes Yes YesUtility Specific Time trend Yes No Yes No No No No No No No No
Observations 2000 2073 1323 2515 1056 947 864 873 1728 840 669Number of utilities 199 190 144 213 144 132 131 131 175 90 103Standard errors in parentheses* significant at 10%; ** significant at 5%; *** significant at 1%
- 19 -
- 20 -
6.4. Electricity Regulatory Governance Index We included in the models the index developed in our previous work. The ERGI was defined as an index between zero and one. The average of this index was 0.483 with a standard deviation of 0.343. The purpose of these models is to test not just the existence of a regulatory agency but also the governance of these agencies. As seen in the previous sections, the sole existence of a regulatory agency has a significant impact on performance. However, we would like to test if there are additional effects that protrude under the presence of an agency with good regulatory governance. For this end, this section reports the results with an increase of one standard deviation in governance. Our data is cross section; hence, the underlined assumption is that once the agency was created it resulted with a similar institutional design and, therefore, its governance is assumed constant. As in the previous sections, most of the results on change in ownership from the previous description hold when we control by the regulatory governance of a regulatory agency; however, we also observed some reduction in the magnitude of their effect when we introduce the ERGI in the model. A standard deviation in the ERGI is associated with a 8.7 and 9.1 percent additional increase in labor productivity, between a 7.5 and 8.2 reduction in duration and frequency of interruptions. Furthermore, operational expenditures resulted with more than a 10 percent reduction while a 5.7 percent increase was observed in residential tariffs. Consequently there was also an improvement in the cost recovery ratio.
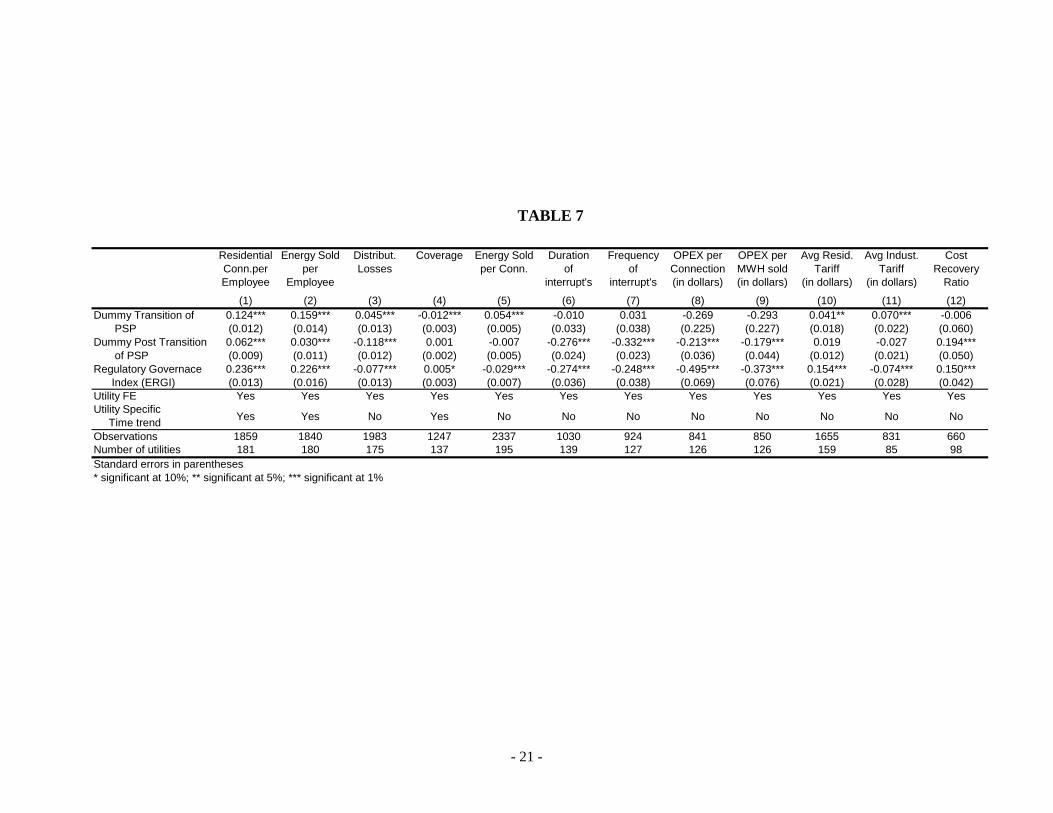
TABLE 7
Residential Conn.per Employee
Energy Sold per
Employee
Distribut. Losses
Coverage Energy Sold per Conn.
Duration of
interrupt's
Frequency of
interrupt's
OPEX per Connection (in dollars)
OPEX per MWH sold (in dollars)
Avg Resid. Tariff
(in dollars)
Avg Indust. Tariff
(in dollars)
Cost Recovery
Ratio
(1) (2) (3) (4) (5) (6) (7) (8) (9) (10) (11) (12)Dummy Transition of 0.124*** 0.159*** 0.045*** -0.012*** 0.054*** -0.010 0.031 -0.269 -0.293 0.041** 0.070*** -0.006 PSP (0.012) (0.014) (0.013) (0.003) (0.005) (0.033) (0.038) (0.225) (0.227) (0.018) (0.022) (0.060)Dummy Post Transition 0.062*** 0.030*** -0.118*** 0.001 -0.007 -0.276*** -0.332*** -0.213*** -0.179*** 0.019 -0.027 0.194*** of PSP (0.009) (0.011) (0.012) (0.002) (0.005) (0.024) (0.023) (0.036) (0.044) (0.012) (0.021) (0.050)Regulatory Governace 0.236*** 0.226*** -0.077*** 0.005* -0.029*** -0.274*** -0.248*** -0.495*** -0.373*** 0.154*** -0.074*** 0.150*** Index (ERGI) (0.013) (0.016) (0.013) (0.003) (0.007) (0.036) (0.038) (0.069) (0.076) (0.021) (0.028) (0.042)Utility FE Yes Yes Yes Yes Yes Yes Yes Yes Yes Yes Yes YesUtility Specific Time trend Yes Yes No Yes No No No No No No No No
Observations 1859 1840 1983 1247 2337 1030 924 841 850 1655 831 660Number of utilities 181 180 175 137 195 139 127 126 126 159 85 98Standard errors in parentheses* significant at 10%; ** significant at 5%; *** significant at 1%
- 21 -
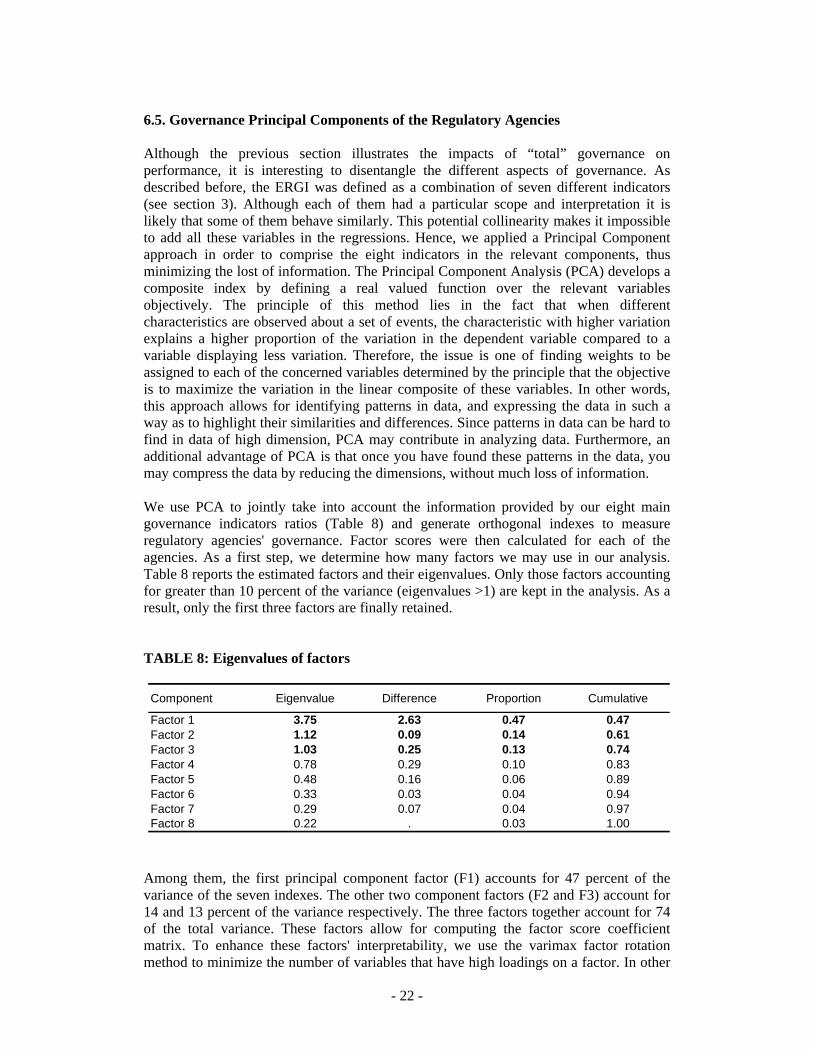
6.5. Governance Principal Components of the Regulatory Agencies Although the previous section illustrates the impacts of “total” governance on performance, it is interesting to disentangle the different aspects of governance. As described before, the ERGI was defined as a combination of seven different indicators (see section 3). Although each of them had a particular scope and interpretation it is likely that some of them behave similarly. This potential collinearity makes it impossible to add all these variables in the regressions. Hence, we applied a Principal Component approach in order to comprise the eight indicators in the relevant components, thus minimizing the lost of information. The Principal Component Analysis (PCA) develops a composite index by defining a real valued function over the relevant variables objectively. The principle of this method lies in the fact that when different characteristics are observed about a set of events, the characteristic with higher variation explains a higher proportion of the variation in the dependent variable compared to a variable displaying less variation. Therefore, the issue is one of finding weights to be assigned to each of the concerned variables determined by the principle that the objective is to maximize the variation in the linear composite of these variables. In other words, this approach allows for identifying patterns in data, and expressing the data in such a way as to highlight their similarities and differences. Since patterns in data can be hard to find in data of high dimension, PCA may contribute in analyzing data. Furthermore, an additional advantage of PCA is that once you have found these patterns in the data, you may compress the data by reducing the dimensions, without much loss of information. We use PCA to jointly take into account the information provided by our eight main governance indicators ratios (Table 8) and generate orthogonal indexes to measure regulatory agencies' governance. Factor scores were then calculated for each of the agencies. As a first step, we determine how many factors we may use in our analysis. Table 8 reports the estimated factors and their eigenvalues. Only those factors accounting for greater than 10 percent of the variance (eigenvalues >1) are kept in the analysis. As a result, only the first three factors are finally retained. TABLE 8: Eigenvalues of factors
Component Eigenvalue Difference Proportion Cumulative
Factor 1 3.75 2.63 0.47 0.47Factor 2 1.12 0.09 0.14 0.61Factor 3 1.03 0.25 0.13 0.74Factor 4 0.78 0.29 0.10 0.83Factor 5 0.48 0.16 0.06 0.89Factor 6 0.33 0.03 0.04 0.94Factor 7 0.29 0.07 0.04 0.97Factor 8 0.22 . 0.03 1.00
Among them, the first principal component factor (F1) accounts for 47 percent of the variance of the seven indexes. The other two component factors (F2 and F3) account for 14 and 13 percent of the variance respectively. The three factors together account for 74 of the total variance. These factors allow for computing the factor score coefficient matrix. To enhance these factors' interpretability, we use the varimax factor rotation method to minimize the number of variables that have high loadings on a factor. In other
- 22 -
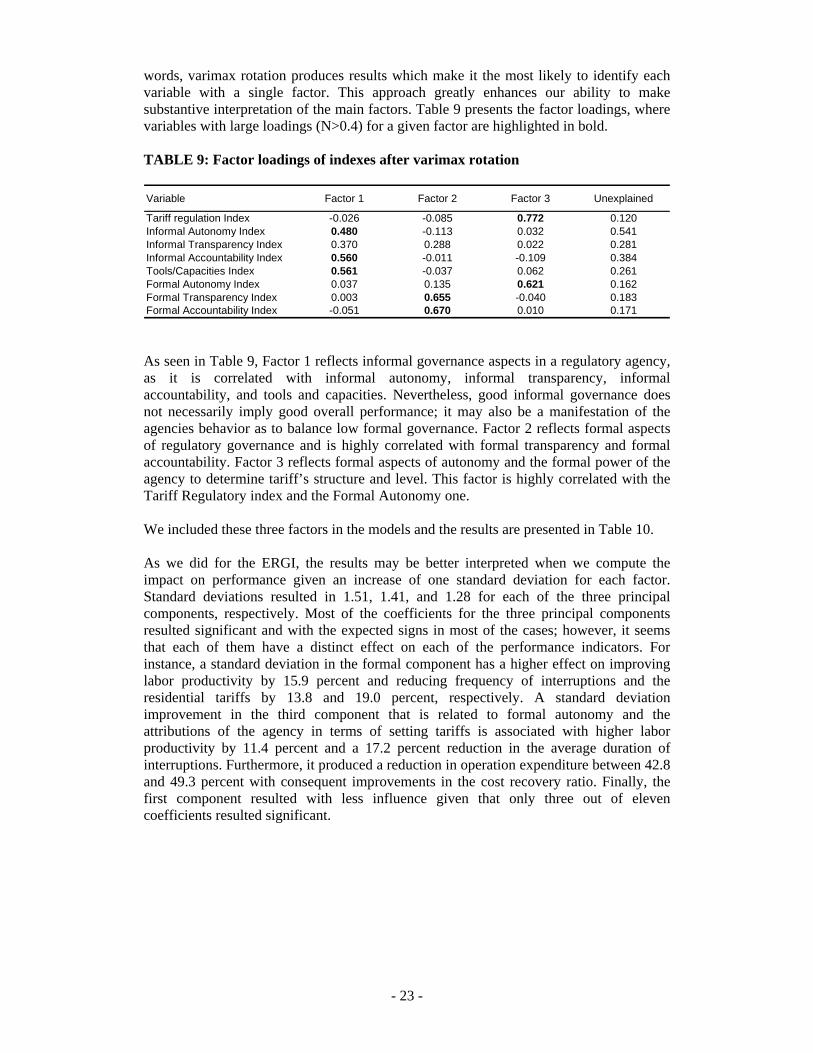
words, varimax rotation produces results which make it the most likely to identify each variable with a single factor. This approach greatly enhances our ability to make substantive interpretation of the main factors. Table 9 presents the factor loadings, where variables with large loadings (N>0.4) for a given factor are highlighted in bold. TABLE 9: Factor loadings of indexes after varimax rotation Variable Factor 1 Factor 2 Factor 3 Unexplained
Tariff regulation Index -0.026 -0.085 0.772 0.120Informal Autonomy Index 0.480 -0.113 0.032 0.541Informal Transparency Index 0.370 0.288 0.022 0.281Informal Accountability Index 0.560 -0.011 -0.109 0.384Tools/Capacities Index 0.561 -0.037 0.062 0.261Formal Autonomy Index 0.037 0.135 0.621 0.162Formal Transparency Index 0.003 0.655 -0.040 0.183Formal Accountability Index -0.051 0.670 0.010 0.171 As seen in Table 9, Factor 1 reflects informal governance aspects in a regulatory agency, as it is correlated with informal autonomy, informal transparency, informal accountability, and tools and capacities. Nevertheless, good informal governance does not necessarily imply good overall performance; it may also be a manifestation of the agencies behavior as to balance low formal governance. Factor 2 reflects formal aspects of regulatory governance and is highly correlated with formal transparency and formal accountability. Factor 3 reflects formal aspects of autonomy and the formal power of the agency to determine tariff’s structure and level. This factor is highly correlated with the Tariff Regulatory index and the Formal Autonomy one. We included these three factors in the models and the results are presented in Table 10.
As we did for the ERGI, the results may be better interpreted when we compute the impact on performance given an increase of one standard deviation for each factor. Standard deviations resulted in 1.51, 1.41, and 1.28 for each of the three principal components, respectively. Most of the coefficients for the three principal components resulted significant and with the expected signs in most of the cases; however, it seems that each of them have a distinct effect on each of the performance indicators. For instance, a standard deviation in the formal component has a higher effect on improving labor productivity by 15.9 percent and reducing frequency of interruptions and the residential tariffs by 13.8 and 19.0 percent, respectively. A standard deviation improvement in the third component that is related to formal autonomy and the attributions of the agency in terms of setting tariffs is associated with higher labor productivity by 11.4 percent and a 17.2 percent reduction in the average duration of interruptions. Furthermore, it produced a reduction in operation expenditure between 42.8 and 49.3 percent with consequent improvements in the cost recovery ratio. Finally, the first component resulted with less influence given that only three out of eleven coefficients resulted significant.
- 23 -
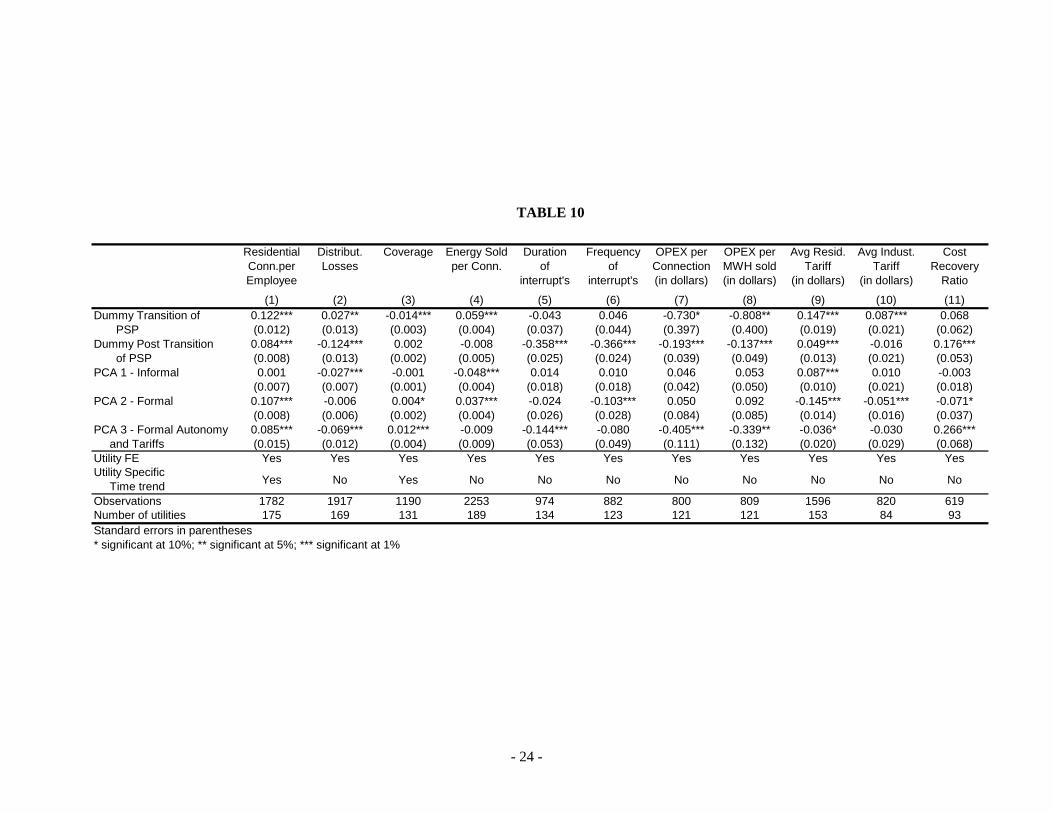
TABLE 10
Residential Conn.per Employee
Distribut. Losses
Coverage Energy Sold per Conn.
Duration of
interrupt's
Frequency of
interrupt's
OPEX per Connection (in dollars)
OPEX per MWH sold (in dollars)
Avg Resid. Tariff
(in dollars)
Avg Indust. Tariff
(in dollars)
Cost Recovery
Ratio
(1) (2) (3) (4) (5) (6) (7) (8) (9) (10) (11)Dummy Transition of 0.122*** 0.027** -0.014*** 0.059*** -0.043 0.046 -0.730* -0.808** 0.147*** 0.087*** 0.068 PSP (0.012) (0.013) (0.003) (0.004) (0.037) (0.044) (0.397) (0.400) (0.019) (0.021) (0.062)Dummy Post Transition 0.084*** -0.124*** 0.002 -0.008 -0.358*** -0.366*** -0.193*** -0.137*** 0.049*** -0.016 0.176*** of PSP (0.008) (0.013) (0.002) (0.005) (0.025) (0.024) (0.039) (0.049) (0.013) (0.021) (0.053)PCA 1 - Informal 0.001 -0.027*** -0.001 -0.048*** 0.014 0.010 0.046 0.053 0.087*** 0.010 -0.003
(0.007) (0.007) (0.001) (0.004) (0.018) (0.018) (0.042) (0.050) (0.010) (0.021) (0.018)PCA 2 - Formal 0.107*** -0.006 0.004* 0.037*** -0.024 -0.103*** 0.050 0.092 -0.145*** -0.051*** -0.071*
(0.008) (0.006) (0.002) (0.004) (0.026) (0.028) (0.084) (0.085) (0.014) (0.016) (0.037)PCA 3 - Formal Autonomy 0.085*** -0.069*** 0.012*** -0.009 -0.144*** -0.080 -0.405*** -0.339** -0.036* -0.030 0.266*** and Tariffs (0.015) (0.012) (0.004) (0.009) (0.053) (0.049) (0.111) (0.132) (0.020) (0.029) (0.068)Utility FE Yes Yes Yes Yes Yes Yes Yes Yes Yes Yes YesUtility Specific Time trend Yes No Yes No No No No No No No No
Observations 1782 1917 1190 2253 974 882 800 809 1596 820 619Number of utilities 175 169 131 189 134 123 121 121 153 84 93Standard errors in parentheses* significant at 10%; ** significant at 5%; *** significant at 1%
- 24 -
- 25 -
7. CONCLUSIONS This paper contributes to the literature that explores the link between regulatory governance and sector performance. We develop indexes of regulatory governance and using cross country data about regulatory agencies and sector performance, we have shown that regulation matters and in particular that the governance structure of regulatory agencies matters significantly. We use two unique databases: (i) the World Bank’s recently published Electricity Performance Database (World Bank, 2007) that contains detailed data for 26 countries and 250 utilities that represent 88 percent of the electricity connections in the Latin American and Caribbean region. The compiled data on the electricity distribution sector includes information on output, coverage, labor productivity, input, operating performance, service quality, and tariffs; and (ii) we have used also Electricity Regulatory Governance Database (Andres et al. (2007b) for the development of the governance indexes. Based on an analytical framework to assess the governance of electricity agencies we designed a survey which was submitted to most of the regulatory agencies of the LAC region. The questionnaire was composed of 97 questions reflecting the four variables of agencies’ governance and both formal and informal aspects of their functioning. In assessing this relationship, we developed a methodology where we ran different models to explain the impacts of the change in ownership and different characteristics of the regulatory agency on the performance of the utilities. The results suggest that the mere existence of a regulatory agency, independent of the utilities’ ownership has a significant impact on performance. Furthermore, after controlling for the existence of a regulatory agency, the ownership dummies are still significant and with the expected signs. We also proposed an experience measure in order to identify the gradual impact of the regulatory agency on utility performance. Our results confirm this hypothesis. In addition, this paper explores two different measures of governance; we used the ERGI, an aggregated measure of regulatory governance and then we decomposed the regulatory governance indexes into three main principal components related to informal and formal aspects of the agencies’ governance, also considering the regulation of tariffs by agencies as an independent variable of their governance. The results suggest that governance matters and has significant impacts on performance when we simulated a standard deviation in each of these indexes. In summary, we have shown that regulation matters for sector performance, on three aspects. We have shown that the existence of a regulatory agency matters, that the experience of the regulatory agency matters and that its governance matters as well. The results are consistent with the literature on the impact of private sector participation and show the relevance of the existence of a regulatory agency and its governance, defined as the agency’s institutional design and structure that allows it to carry its functions as an independent regulator. Our results indicate a significant improvement in utility performance through the involvement of a regulatory agency even in the case of state owned enterprises. The results strongly support that the highest achievements are reached with the combination of private sector participation regulated through a regulatory agency that exhibits good governance.
- 26 -
6. REFERENCES
Andres, Luis, Vivien Foster, and J. Luis Guasch (2006), “The Impact of Privatization on the Performance of the Infrastructure Sector: The Case of Electricity Distribution in Latin American Countries,” Policy Research Working Paper 3936, The World Bank, Washington, D.C.
Andres, Luis, Vivien Foster, J. Luis Guasch, and Thomas Haven (2007a), “The Impact of Privatization on Firms in the Infrastructure Sector in Latin America Countries.” The World Bank.
Andres, Luis, J. Luis Guasch, Makhtar Dip, and Sebastian Lopez Azumendi (2007b) “Assessing the Governance of Electricity Regulatory Agencies in the Latin American and the Caribbean Region: a Benchmarking Analysis,” The World Bank, Washington, DC.
Aron, Janine (2000), "Growth and Institutions: A review of the evidence." The World Bank. Washington, DC.
Bacon, R. W., and J. E. Besant-Jones (2001), "Global Electric Power Reform, Privatization and Liberalization of the Electric Power Industry in Developing Countries." Annual Review of Energy and the Environment 26, 331-59.
Boardman, Anthony and Aidan R. Vining (1989), “Ownership and Performance in Competitive Environments: A Comparison of the Performance of Private, Mixed, and State-Owned Enterprises,” Journal of Law and Economics, 32, pp. 1-33.
Brown Ashley C., J. Stern, B. Tenenbaum, and D. Gencer (2006), “Handbook for Evaluating Infrastructure Regulatory Systems.” The World Bank, Washington DC.
Chisari, Omar, Antonio Estache, and Carlos Romero (1997), "Winners and Losers from Utility Privatization in Argentina: Lessons from a General Equilibrium Model." Policy Research Working Paper 1824, The World Bank, Washington, D.C.
Correa, Paulo, C. Pereira, B. Mueller, and M. Melo (2006), “Regulatory Governance in Infrastructure Industries: Assessment and Measurement of Brazilian Regulators.” The World Bank/Public-Private Infrastructure Advisory Facility, Washington DC.
Cubbin, John and J. Stern (2006), "The Impact of Regulatory Governance and Privatization on Electricity Industry Generation Capacity in Developing Countries." The World Bank Economic Review Advance Access published. Washington.
Dussan, M. (1996). “Electric Power Sector Reform in Latin America and the Caribbean.” Working Papers Series IFM-104.
Estache, Antonio and Martin Rodriguez-Pardina (1998), "Light and Lightening at the End of the Public Tunnel: The Reform of the Electricity Sector in the Southern Cone," World Bank Working Paper, May.
- 27 -
Estache, Antonio and Martin Rossi (2004), “Have Consumers Benefited from the reforms in the Electricity Distribution Sector in Latin America?” Unpublished manuscript, The World Bank.
Estache, Antonio and Martin Rossi (2007) “Regulatory Agencies: Impact on Firm Performance and Consumer Welfare,” Unpublished manuscript, The World Bank.
Frydman, Roman, Cheryl W. Gray, Marek Hessel, and Andrzej Rapaczynski (1999), “When Does Privatization Work? The Impact of Private Ownership on Corporate Performance in Transition Economies,” Quarterly Journal of Economics, 114:4, pp. 1153-1191.
Galal, Ahmed, Leroy Jones, Pankaj Tandon and Ingo Vogelsang (1994), “Welfare Consequences of Selling Public Enterprises,” Oxford: Oxford University Press.
Gilardi, Fabrizio (2002), “Policy credibility and delegation to independent regulatory agencies: a comparative empirical analysis.” Journal of European Public Policy.
Gilardi, Fabrizio (2005), “Evaluating Independent Regulators,” in “Designing Independent and Accountable Regulatory Authorities for High Quality Regulation.” Organization for Economic Cooperation and Development, Paris.
Guach, Jose Luis and P. Spiller (1999), “Managing the Regulatory Process: Design, Concepts, Issues and the Latin America and Caribbean Story.” World Bank and Caribbean Studies, Washington DC.
Gutierrez, Luis H. (2003), “Regulatory Governance in the Latin American Telecommunications Sector.” Utilities Policies. Obtained at www.sciencedirect.com.
Halvorsen, R and R. Palmquist (1980), “The interpretation of dummy variables in semi-logarithmic equations,” American Economic Review, 70, 474-475.
Heckman, James and Richard Robb (1985), “Alternative Methods of Evaluating the Impact of Interventions.” In James Heckman and Burton Singer, eds., Longitudinal Analysis of Labmy Market Data. New York: Cambridge University Press. 156-245.
Johannsen, Katja Sander (2003), “Regulatory Independence in Theory and Practice –a Survey of Independent Energy Regulators in Eight European Countries.” AKF, Denmark.
Joskow, Paul (2003) “Electricity Sector Restructuring and Competition: Lessons Learned.” Cuadernos de Economía, Año 40, N° 121, pp. 548-558 (December).
La Porta, Rafael and Florencio López-de-Silanes (1999), “Benefits of Privatization--Evidence From Mexico,” Q. J. Econ., 114:4, pp. 1193-1242.
Laurin, Claude and Yves Bozec (2000), “Privatization and Productivity Improvement: The Case of Canadian National (CN),” working paper, Ecoles de HEC, Montreal.
Maggetti, Martino (2005), “Towards a Framework to Assess the Informal Independence of Regulatory Agencies.” University of Lausanne, Switzerland.
- 28 -
Megginson, William, Robert Nash, and Matthias van Randenborgh (1994), “The Financial and Operating Performance of Newly Privatized Firms: An International Empirical Analysis.” Journal of Finance XLIX: 403-452.
Millan, J., E. Lora and Alejandro Micco (2001), “Sustainability of the Electricity Sector Reforms in Latin America.” Research Department, Inter-American Development Bank.
Oliveira, Gesner, E. Machado, L. Novaes, L. Martins, G. Ferreira, and C. Beatriz (2005), “Aspects of the Independence of regulatory Agencies and Competition Advocacy.” Getulio Vargas Foundation, Rio de Janeiro.
Organization for Economic Cooperation and Development (OECD) (2005), "OECD Guiding Principles for Regulatory Quality and Performance." Paris.
Ramamurti, Ravi (1996), “Privatizing Monopolies: Lessons from the Telecommunications and Transport Sector in Latin America,” Baltimore: Johns Hopkins University Press
Rodrick, Dani (2004), "Getting Institutions Right." Harvard University.
Ros, Agustin (1999), “Does ownership or Competition Matter? The effects of telecommunications Reform on the Network Expansion and Efficiency.” Journal of Regulatory Economics; 15:65-92.
Ros, Agustin and A. Banerjee (2000), “Telecommunications privatizations and tariff rebalancing: evidence from Latin America.” Telecommunications Policy 20 233-252.
Rossi, Martin (2004), “Ownership and Efficiency: Evidence from Latin American Electric Utilities.” Unpublished manuscript. University of Oxford.
Sirtaine, Sophie, Maria Elena Pinglo, Vivien Foster, and J. Luis Guasch (2004), “How profitable are private infrastructure concessions in Latin America? Empirical evidence and regulatory implications.” The World Bank.
Stern, Jon and J. Cubbin (2005), "Regulatory Effectiveness: The Impact of Regulation and Regulatory Governance Arrangements on Electricity Industry Outcomes". The World Bank Policy Research Working Paper 3536. Washington.
Stern, Jon and S. Holder (1999), “Regulatory Governance: Criteria for Assessing the Performance of Regulatory Systems: An application to Infrastructure in Developing Countries of Asia”. Regulation Initiative Discussion Paper Series Number 20.
World Bank (2007), “Benchmarking Analysis of the Electricity Distribution Sector in the Latin American and Caribbean Region,” The World Bank, Washington, DC.
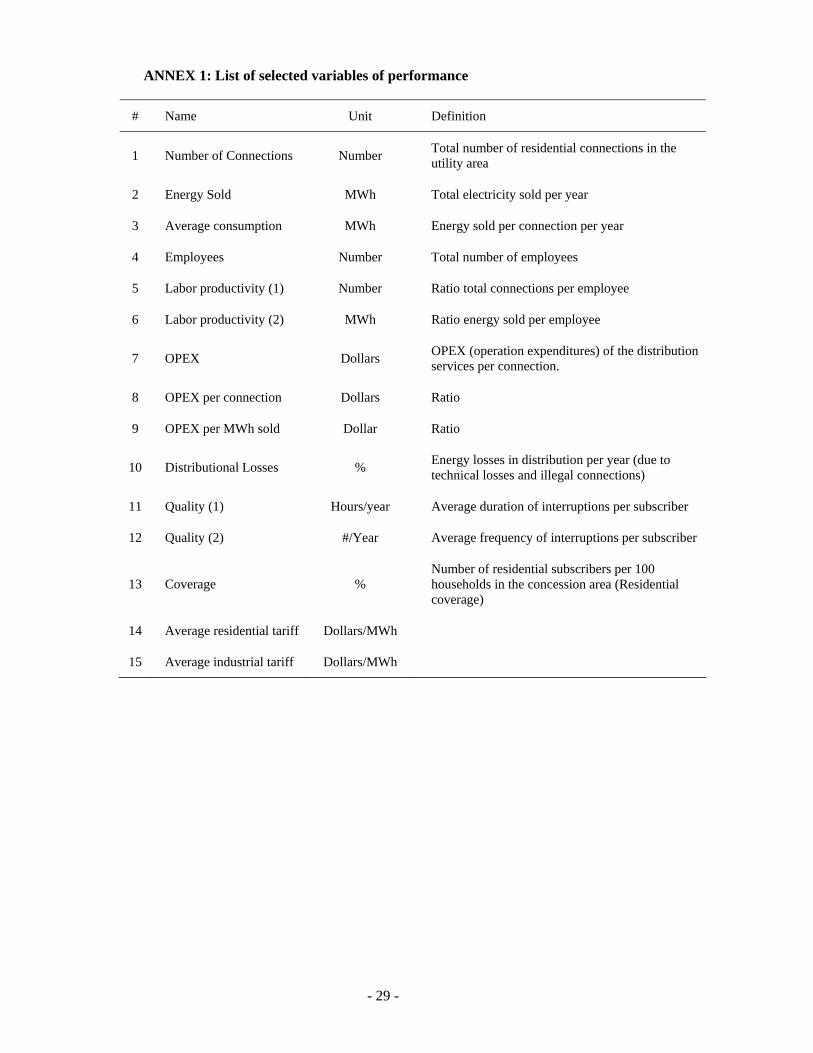
- 29 -
ANNEX 1: List of selected variables of performance
# Name Unit Definition
1 Number of Connections Number Total number of residential connections in the utility area
2 Energy Sold MWh Total electricity sold per year
3 Average consumption MWh Energy sold per connection per year
4 Employees Number Total number of employees
5 Labor productivity (1) Number Ratio total connections per employee
6 Labor productivity (2) MWh Ratio energy sold per employee
7 OPEX Dollars OPEX (operation expenditures) of the distribution services per connection.
8 OPEX per connection Dollars Ratio
9 OPEX per MWh sold Dollar Ratio
10 Distributional Losses % Energy losses in distribution per year (due to technical losses and illegal connections)
11 Quality (1) Hours/year Average duration of interruptions per subscriber
12 Quality (2) #/Year Average frequency of interruptions per subscriber
13 Coverage % Number of residential subscribers per 100 households in the concession area (Residential coverage)
14 Average residential tariff Dollars/MWh
15 Average industrial tariff Dollars/MWh
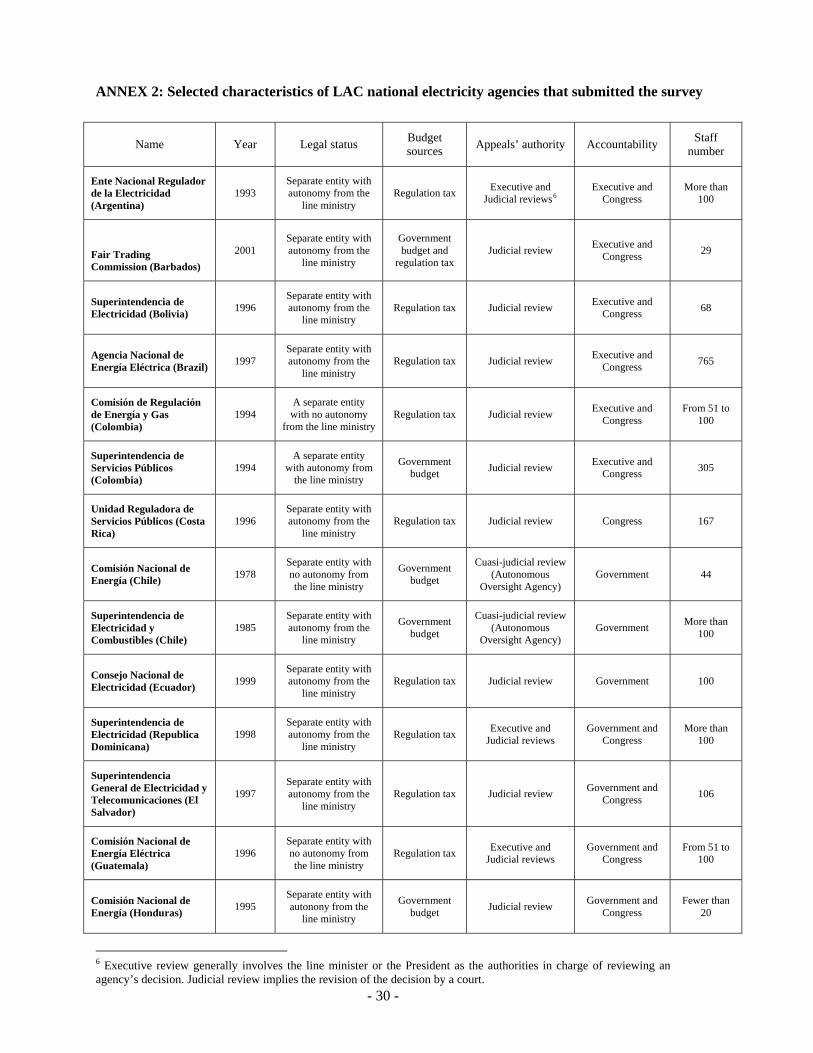
- 30 -
ANNEX 2: Selected characteristics of LAC national electricity agencies that submitted the survey
Name Year Legal status Budget sources Appeals’ authority Accountability Staff
number
Ente Nacional Regulador de la Electricidad (Argentina)
1993 Separate entity with autonomy from the
line ministry Regulation tax Executive and
Judicial reviews6
Executive and Congress
More than 100
Fair Trading Commission (Barbados)
2001 Separate entity with autonomy from the
line ministry
Government budget and
regulation tax Judicial review Executive and
Congress 29
Superintendencia de Electricidad (Bolivia) 1996
Separate entity with autonomy from the
line ministry Regulation tax Judicial review Executive and
Congress 68
Agencia Nacional de Energía Eléctrica (Brazil) 1997
Separate entity with autonomy from the
line ministry Regulation tax Judicial review Executive and
Congress 765
Comisión de Regulación de Energía y Gas (Colombia)
1994 A separate entity with no autonomy
from the line ministry Regulation tax Judicial review Executive and
Congress From 51 to
100
Superintendencia de Servicios Públicos (Colombia)
1994 A separate entity
with autonomy from the line ministry
Government budget Judicial review Executive and
Congress 305
Unidad Reguladora de Servicios Públicos (Costa Rica)
1996 Separate entity with autonomy from the
line ministry Regulation tax Judicial review Congress 167
Comisión Nacional de Energía (Chile) 1978
Separate entity with no autonomy from the line ministry
Government budget
Cuasi-judicial review (Autonomous
Oversight Agency) Government 44
Superintendencia de Electricidad y Combustibles (Chile)
1985 Separate entity with autonomy from the
line ministry
Government budget
Cuasi-judicial review (Autonomous
Oversight Agency) Government More than
100
Consejo Nacional de Electricidad (Ecuador) 1999
Separate entity with autonomy from the
line ministry Regulation tax Judicial review Government 100
Superintendencia de Electricidad (Republica Dominicana)
1998 Separate entity with autonomy from the
line ministry Regulation tax Executive and
Judicial reviews Government and
Congress More than
100
Superintendencia General de Electricidad y Telecomunicaciones (El Salvador)
1997 Separate entity with autonomy from the
line ministry Regulation tax Judicial review Government and
Congress 106
Comisión Nacional de Energía Eléctrica (Guatemala)
1996 Separate entity with no autonomy from the line ministry
Regulation tax Executive and Judicial reviews
Government and Congress
From 51 to 100
Comisión Nacional de Energía (Honduras) 1995
Separate entity with autonony from the
line ministry
Government budget Judicial review Government and
Congress Fewer than
20
6 Executive review generally involves the line minister or the President as the authorities in charge of reviewing an agency’s decision. Judicial review implies the revision of the decision by a court.

- 31 -
Office of Utilities Regulation (Jamaica) 1997
Separate entity with autonomy from the
line ministry No answer Judicial review Government and
Congress 45
Comisión Reguladora de Energía (México) 1995
Separate entity with autonomy from the
line ministry
Government budget Judicial review Government and
Congress 130
Instituto Nicaragüense de Electricidad (Nicaragua) 1994
Separate entity with autonomy from the
line ministry Regulation tax Judicial review Government and
Congress 200
Autoridad Nacional de los Servicios Públicos (Panamá)
1996 Separate entity with autonomy from the
line ministry Regulation tax Judicial review Government More than
100
Organismo Supervisor de la Inversión en Energía (Perú)
1996 Separate entity with autonomy from the
line ministry Regulation tax Judicial review Government and
Congress 187
Regulated Industries Commission (Trinidad and Tobago)
2000 Separate entity with autonomy from the
line ministry Regulation tax Judicial review Government and
Congress Fewer than
20
Unidad Reguladora de Servicios de Energía y Agua (Uruguay)
2000 Separate entity with no autonomy from the line ministry
Regulation tax Executive and Judicial review
Government and Congress 18