regulation et risque systémique - monica billio. april, 7-11 2013
TRANSCRIPT
Regulationetrisque systémique
SYstemic Risk TOmography:Signals, Measurements, Transmission Channels, and Policy Interventions
M. Billio, Ca’ Foscari University of Venice (ITALY)M. Getmansky, Isenberg School of Management, University of Massachusetts (USA)D. Gray, International Monetary Fund (IMF)A.W. Lo, MIT Sloan School of Management (USA)R.C. Merton, MIT Sloan School of Management (USA)L. Pelizzon, Ca' Foscari University of Venice (Italy) and Goethe University Frankfurt (Germany)
University of Orléans – Paris. November 5, 2013.
Sovereign, Bank, and Insurance Credit Spreads: Connectedness and System Networks
M. Billio, M. Getmansky, D. Gray A.W. Lo, R.C. Merton, L. Pelizzon
The research leading to these results has received funding from the European Union, Inquire Europe, and Seventh Framework Programme FP7/2007-2013 under grant agreement SYRTO-SSH-2012-320270.
Funded by the European Union7th Framework Programme (FP7)
SYRTO
1
Objectives
• The risks of the banking and insurance systems have become increasingly interconnected with sovereign risk
• Highlight interconnections: • Among countries and financial
institutions • Consider both explicit and implicit
connections
2
Methodology
• We propose to measure and analyze interactions between banks, insurers, and sovereigns using:
– Contingent claims analysis (CCA)
– Network approach
3
Background
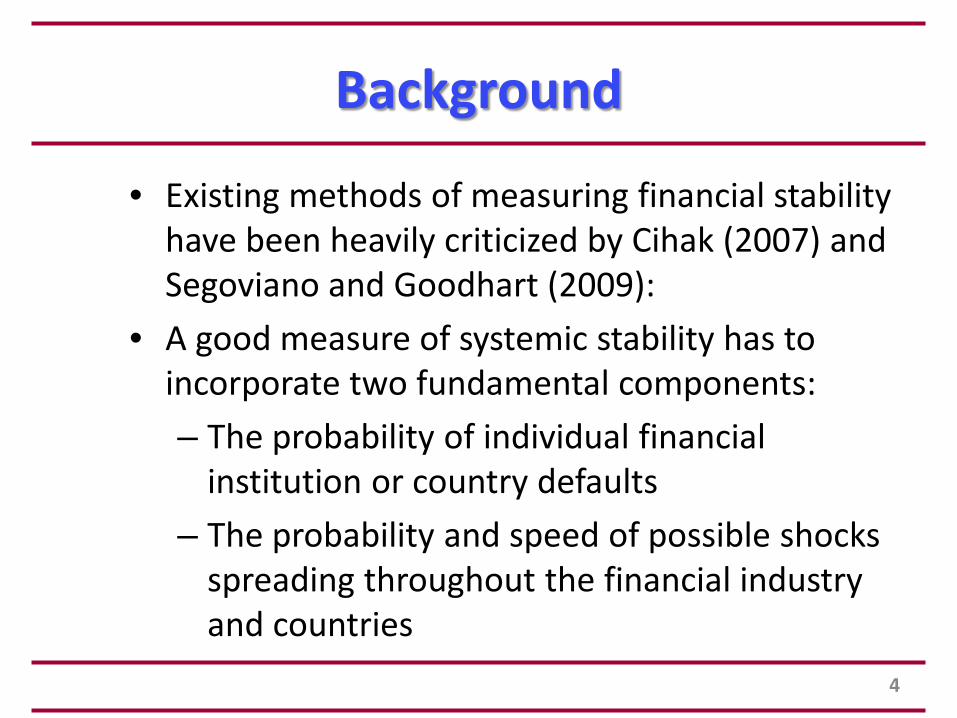
• Existing methods of measuring financial stability have been heavily criticized by Cihak (2007) and Segoviano and Goodhart (2009):
• A good measure of systemic stability has to incorporate two fundamental components: – The probability of individual financial
institution or country defaults– The probability and speed of possible shocks
spreading throughout the financial industry and countries
4
Background
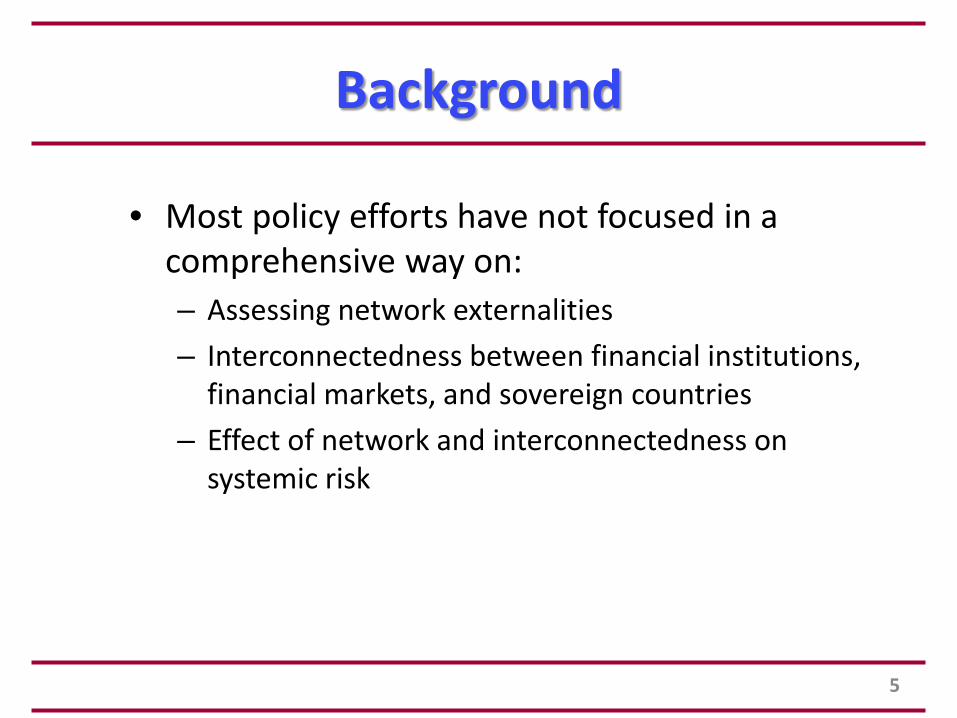
• Most policy efforts have not focused in a comprehensive way on: – Assessing network externalities – Interconnectedness between financial institutions,
financial markets, and sovereign countries – Effect of network and interconnectedness on
systemic risk
5
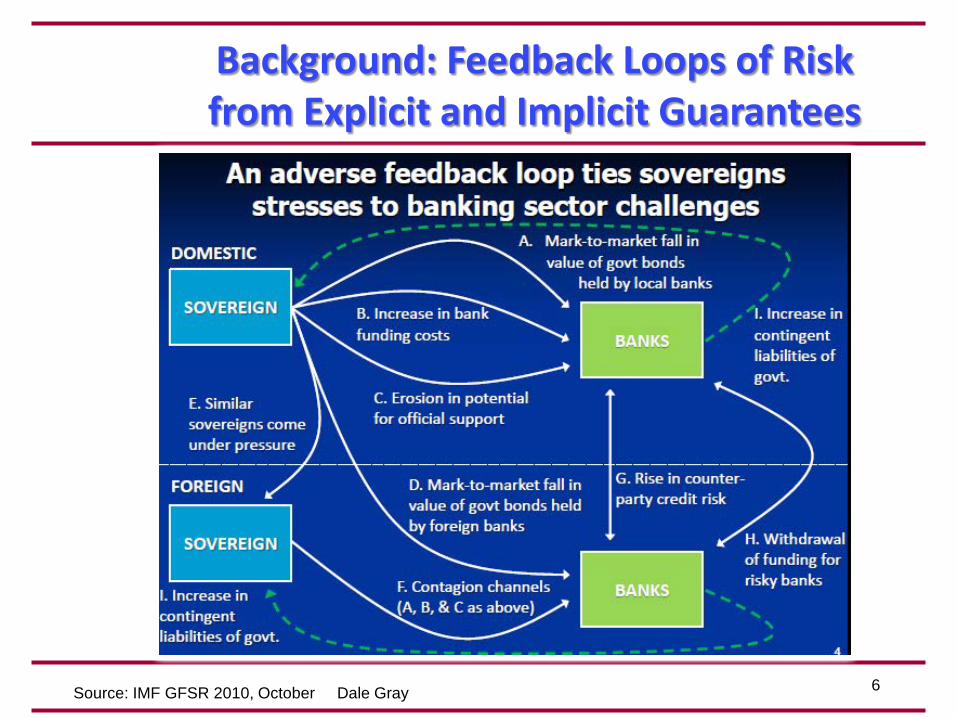
Background: Feedback Loops of Risk from Explicit and Implicit Guarantees
Source: IMF GFSR 2010, October Dale Gray 6
Background
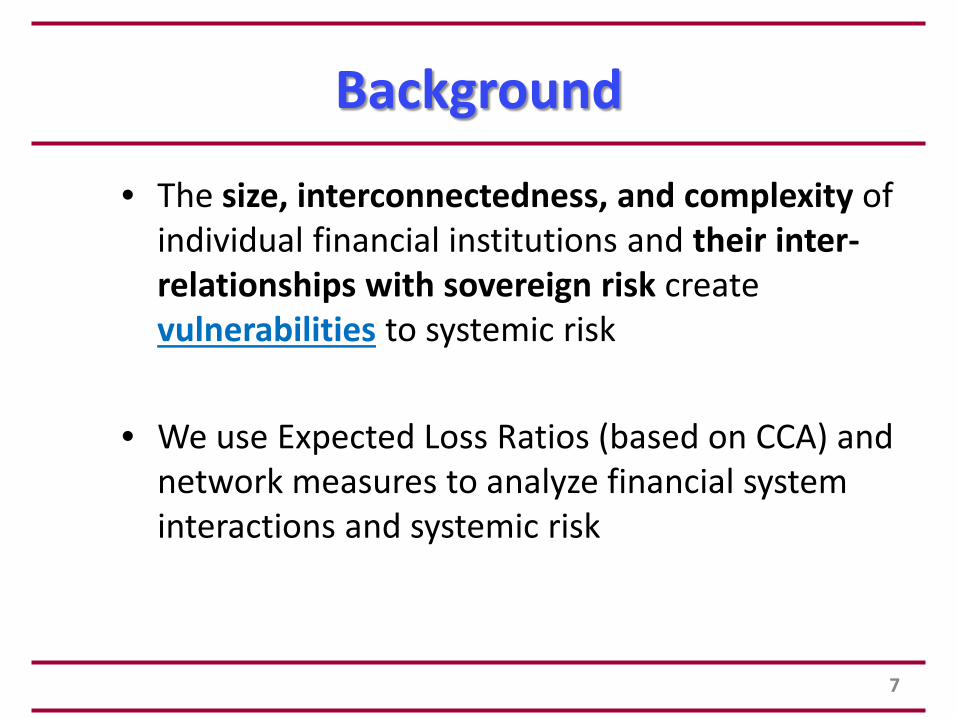
• The size, interconnectedness, and complexity of individual financial institutions and their inter-relationships with sovereign risk create vulnerabilities to systemic risk
• We use Expected Loss Ratios (based on CCA) and network measures to analyze financial system interactions and systemic risk
7
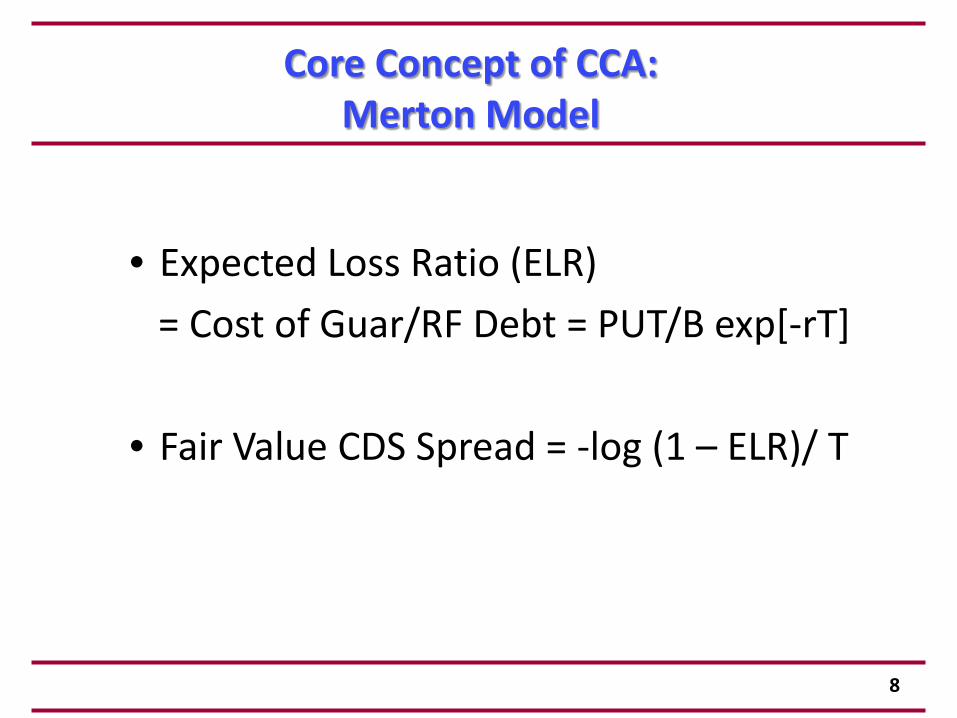
Core Concept of CCA: Merton Model
• Expected Loss Ratio (ELR) = Cost of Guar/RF Debt = PUT/B exp[-rT]
• Fair Value CDS Spread = -log (1 – ELR)/ T
8
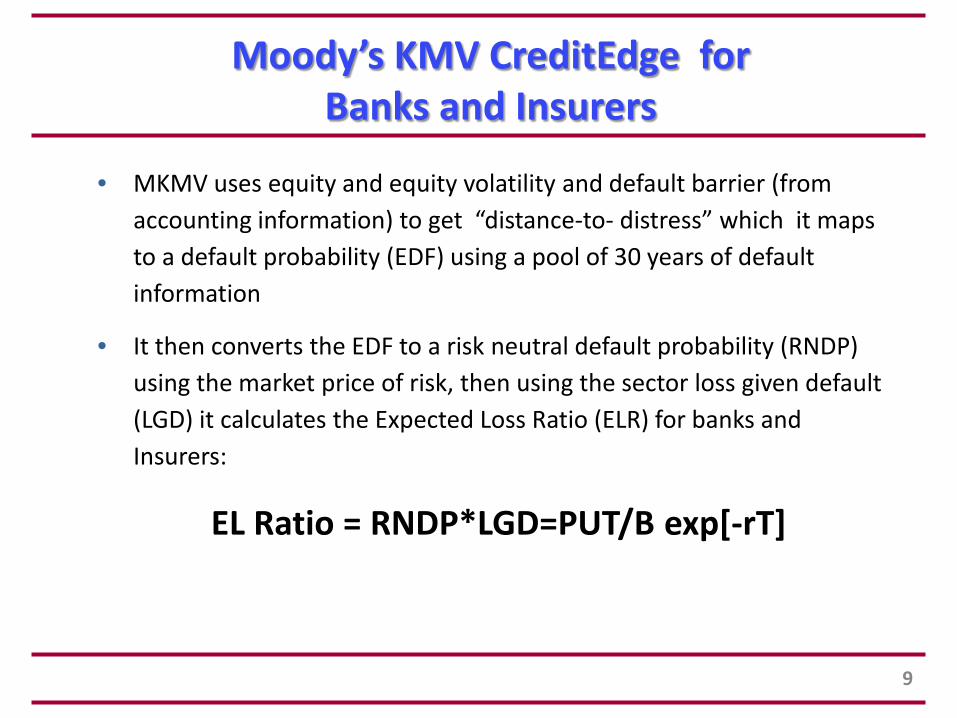
Moody’s KMV CreditEdge for Banks and Insurers
• MKMV uses equity and equity volatility and default barrier (from accounting information) to get “distance-to- distress” which it maps to a default probability (EDF) using a pool of 30 years of default information
• It then converts the EDF to a risk neutral default probability (RNDP) using the market price of risk, then using the sector loss given default (LGD) it calculates the Expected Loss Ratio (ELR) for banks and Insurers:
EL Ratio = RNDP*LGD=PUT/B exp[-rT]
9
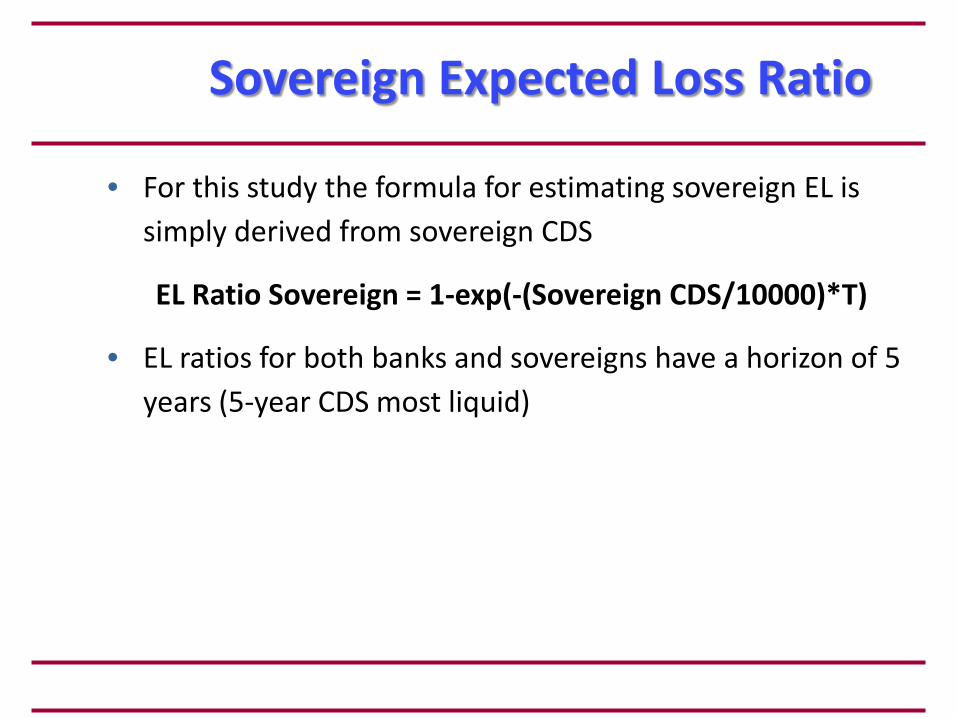
Sovereign Expected Loss Ratio
• For this study the formula for estimating sovereign EL is simply derived from sovereign CDS
EL Ratio Sovereign = 1-exp(-(Sovereign CDS/10000)*T)
• EL ratios for both banks and sovereigns have a horizon of 5 years (5-year CDS most liquid)
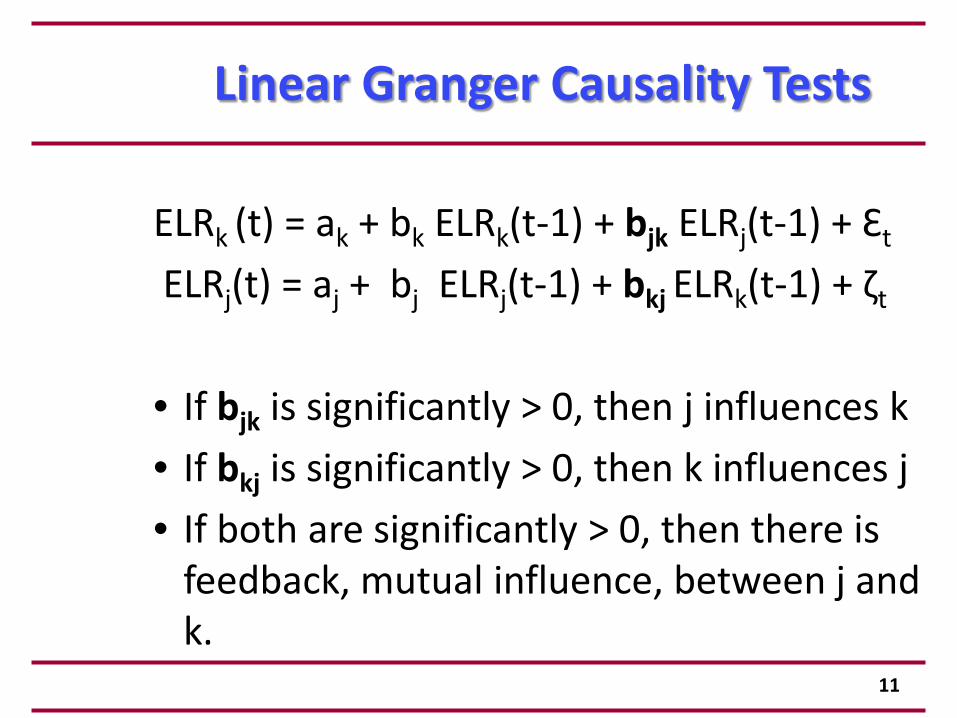
Linear Granger Causality Tests
ELRk (t) = ak + bk ELRk(t-1) + bjk ELRj(t-1) + Ɛt
ELRj(t) = aj + bj ELRj(t-1) + bkj ELRk(t-1) + ζt
• If bjk is significantly > 0, then j influences k• If bkj is significantly > 0, then k influences j• If both are significantly > 0, then there is
feedback, mutual influence, between j and k.
11
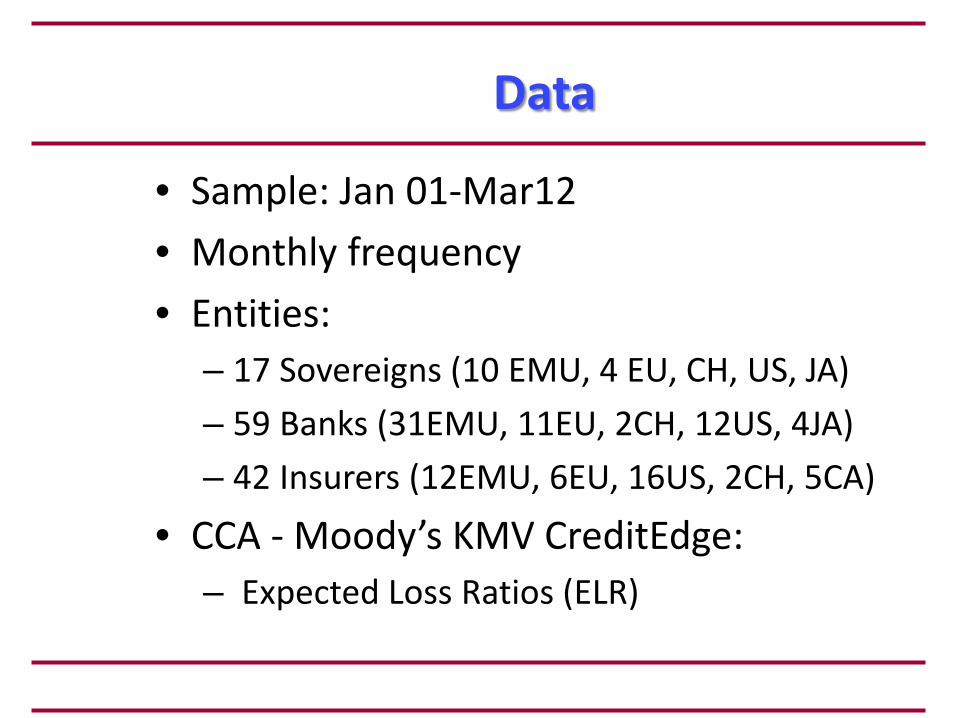
Data
• Sample: Jan 01-Mar12• Monthly frequency• Entities:
– 17 Sovereigns (10 EMU, 4 EU, CH, US, JA)– 59 Banks (31EMU, 11EU, 2CH, 12US, 4JA)– 42 Insurers (12EMU, 6EU, 16US, 2CH, 5CA)
• CCA - Moody’s KMV CreditEdge:– Expected Loss Ratios (ELR)
Mar 12
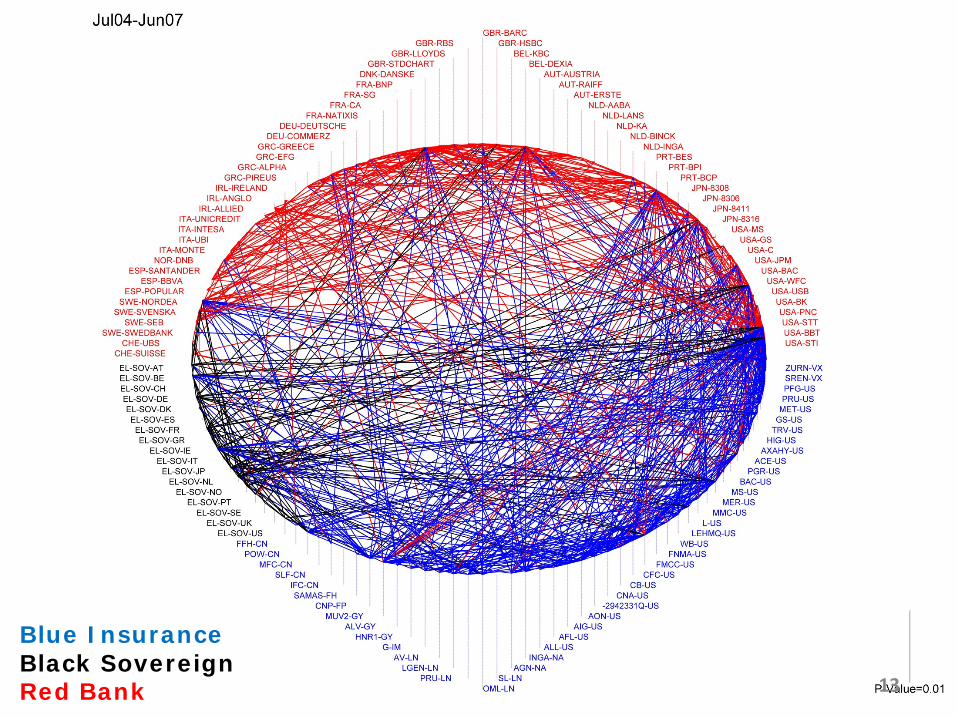
Blue InsuranceBlack SovereignRed Bank
Blue InsuranceBlack SovereignRed Bank 13
Mar 12
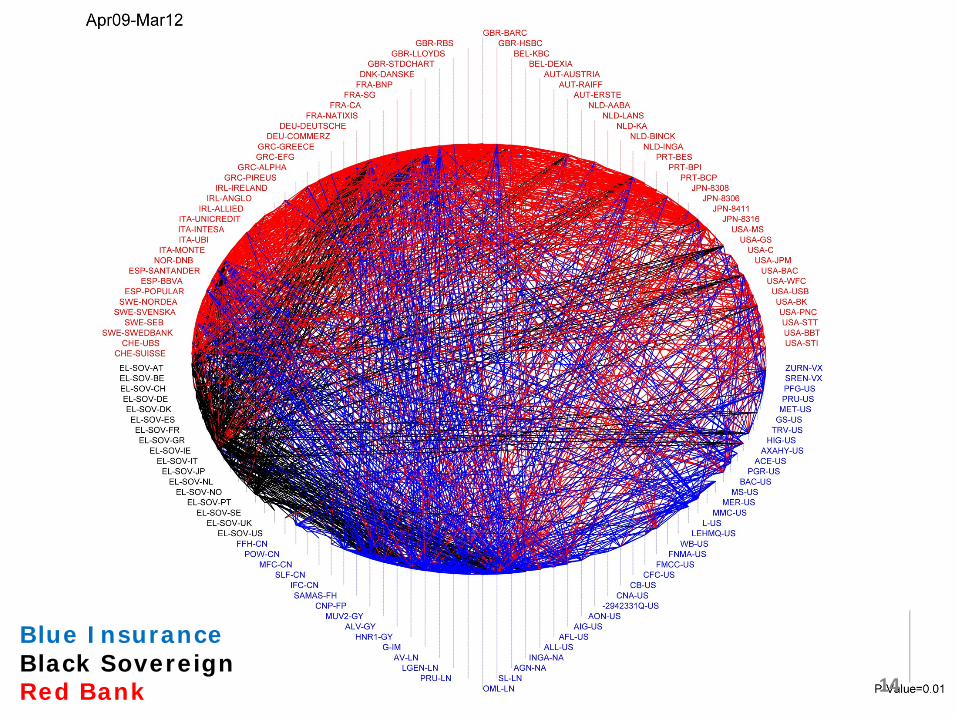
Blue InsuranceBlack SovereignRed Bank
Blue InsuranceBlack SovereignRed Bank 14
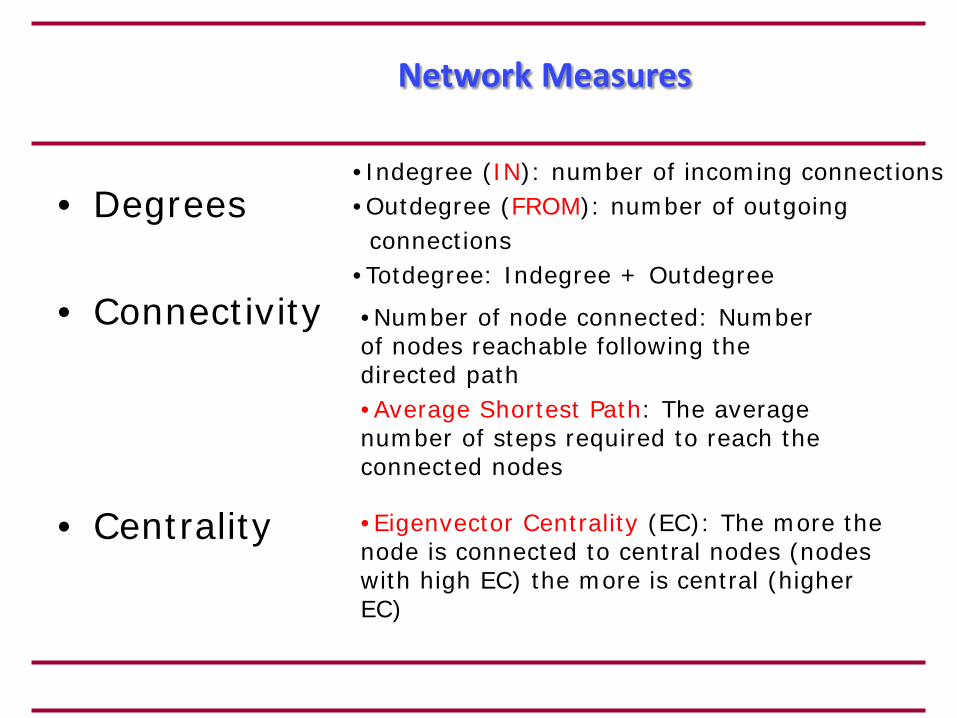
Network Measures
• Degrees
• Connectivity
• Centrality
•Indegree (IN): number of incoming connections •Outdegree (FROM): number of outgoing
connections•Totdegree: Indegree + Outdegree
•Number of node connected: Number of nodes reachable following the directed path•Average Shortest Path: The average number of steps required to reach the connected nodes
•Eigenvector Centrality (EC): The more the node is connected to central nodes (nodes with high EC) the more is central (higher EC)
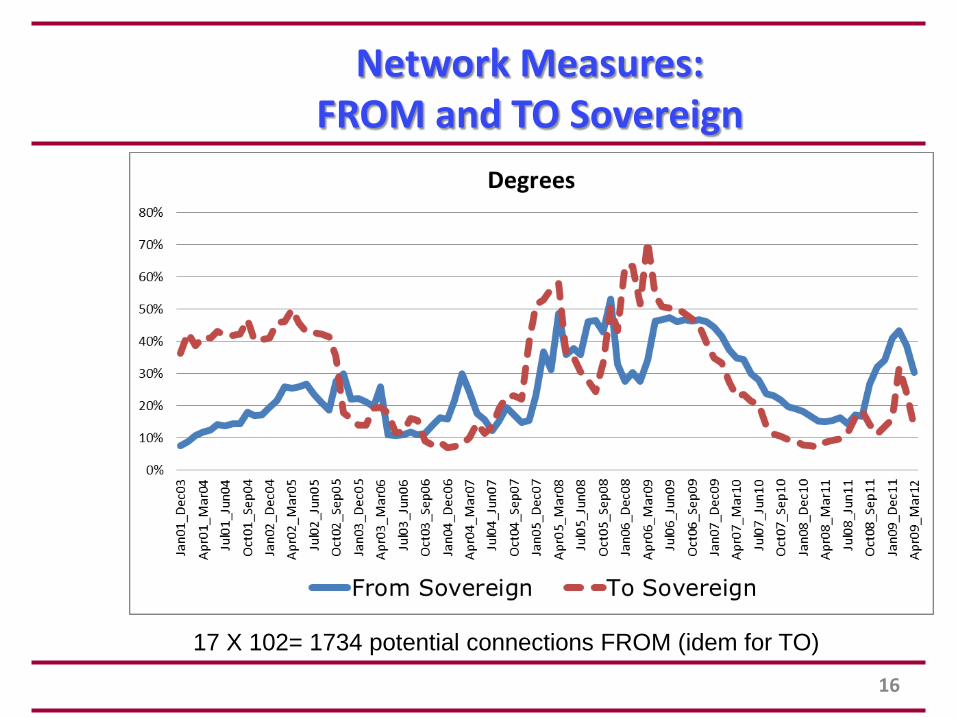
Network Measures: FROM and TO Sovereign
17 X 102= 1734 potential connections FROM (idem for TO)
16
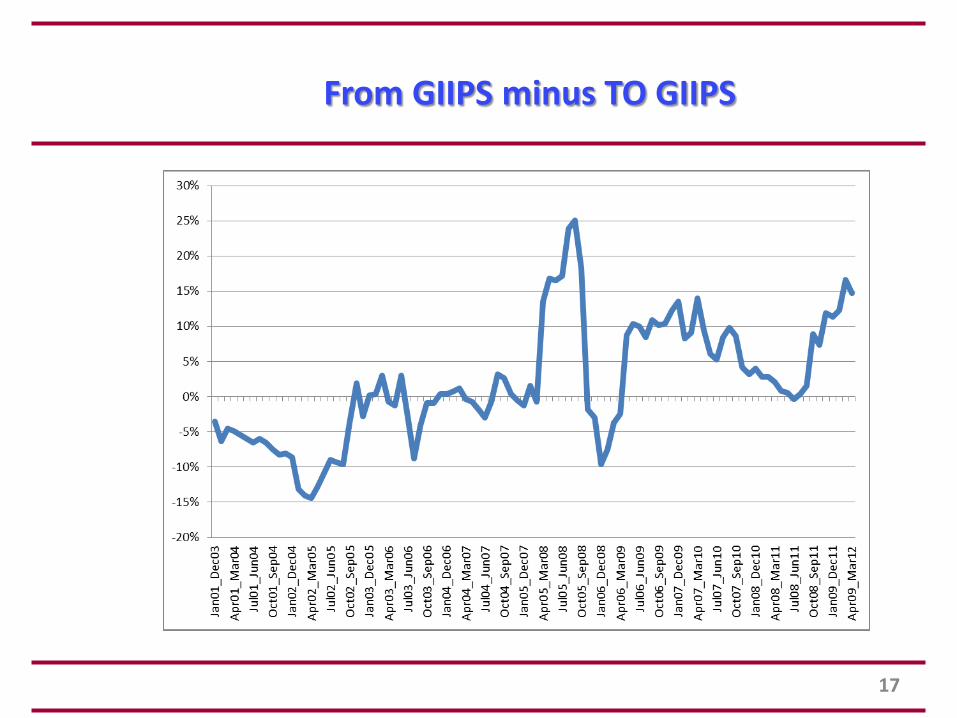
From GIIPS minus TO GIIPS
17
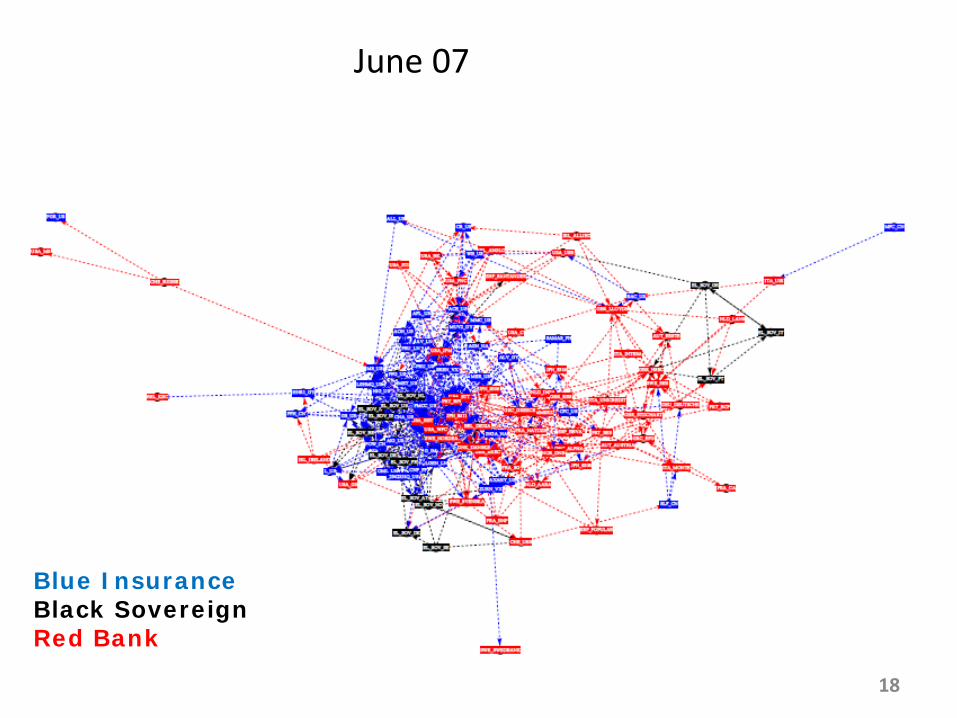
June 07
Blue InsuranceBlack SovereignRed Bank
18
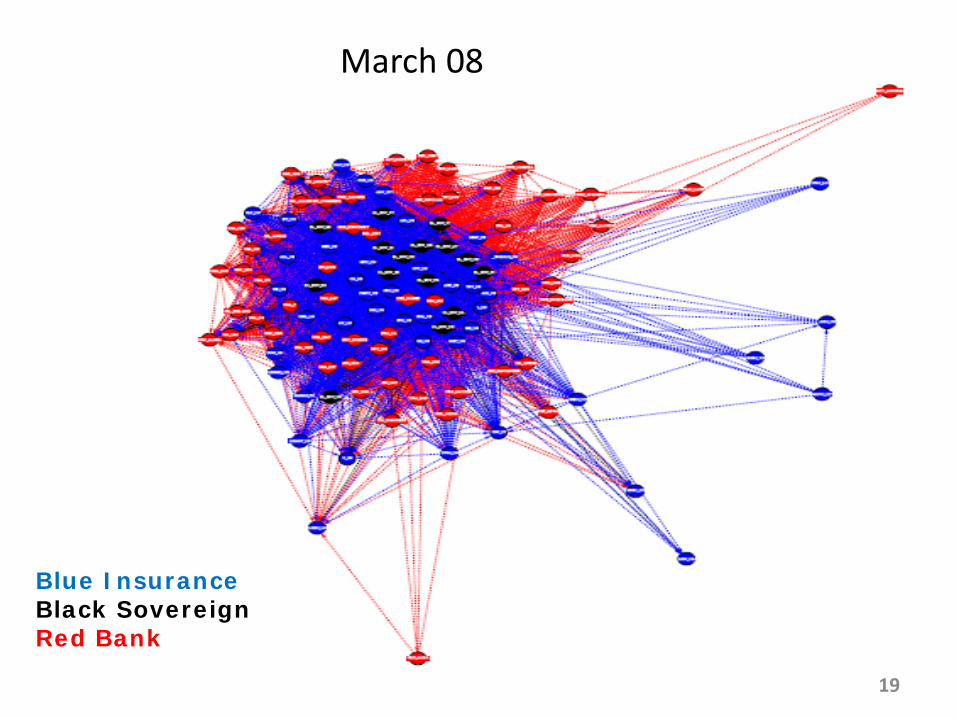
March 08
Blue InsuranceBlack SovereignRed Bank
19
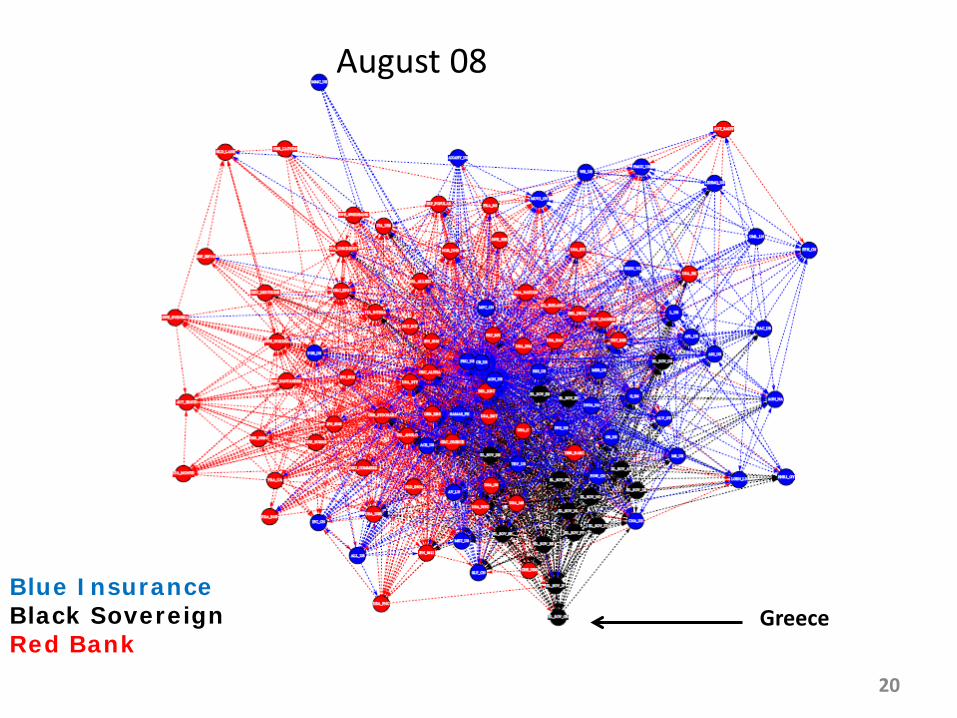
August 08
GreeceBlue InsuranceBlack SovereignRed Bank
20
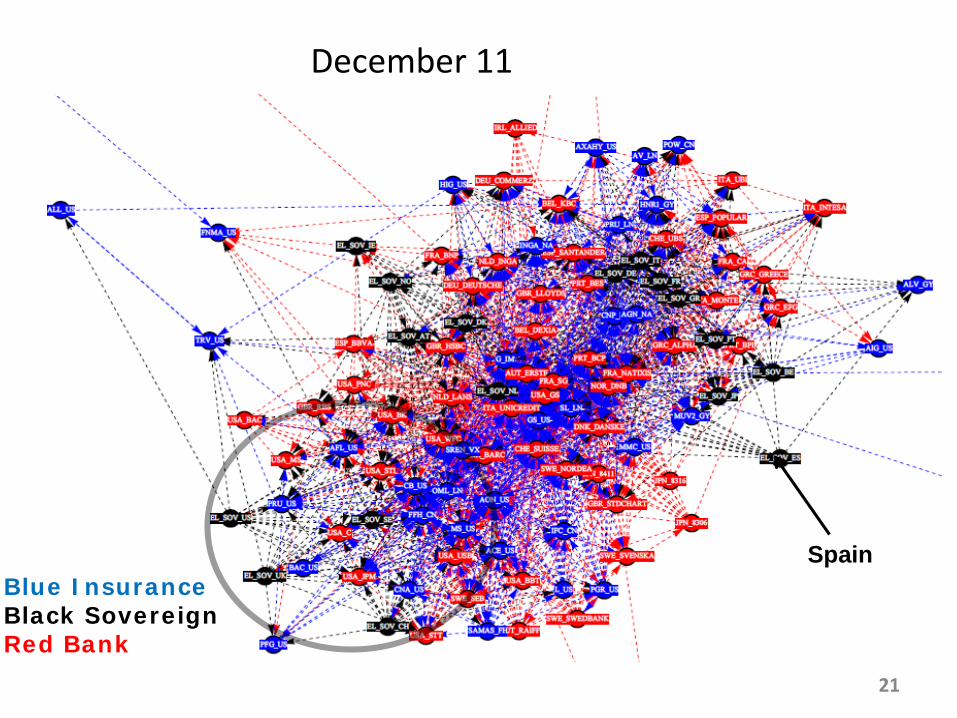
SpainBlue InsuranceBlack SovereignRed Bank
December 11
21

March 12US
Blue InsuranceBlack SovereignRed Bank
IT
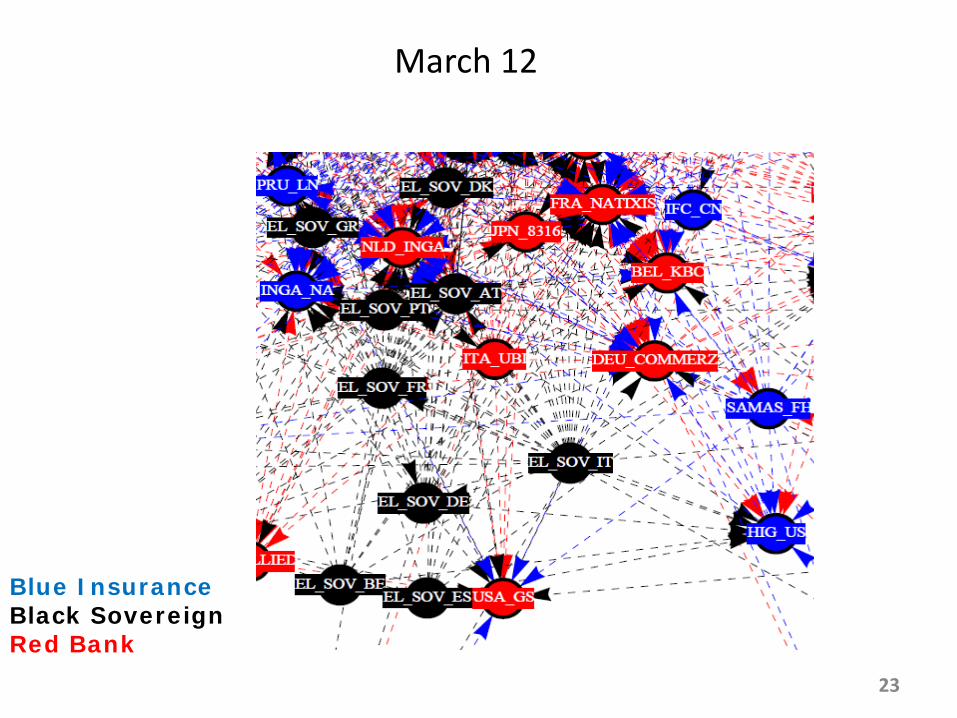
March 12
Blue InsuranceBlack SovereignRed Bank
23
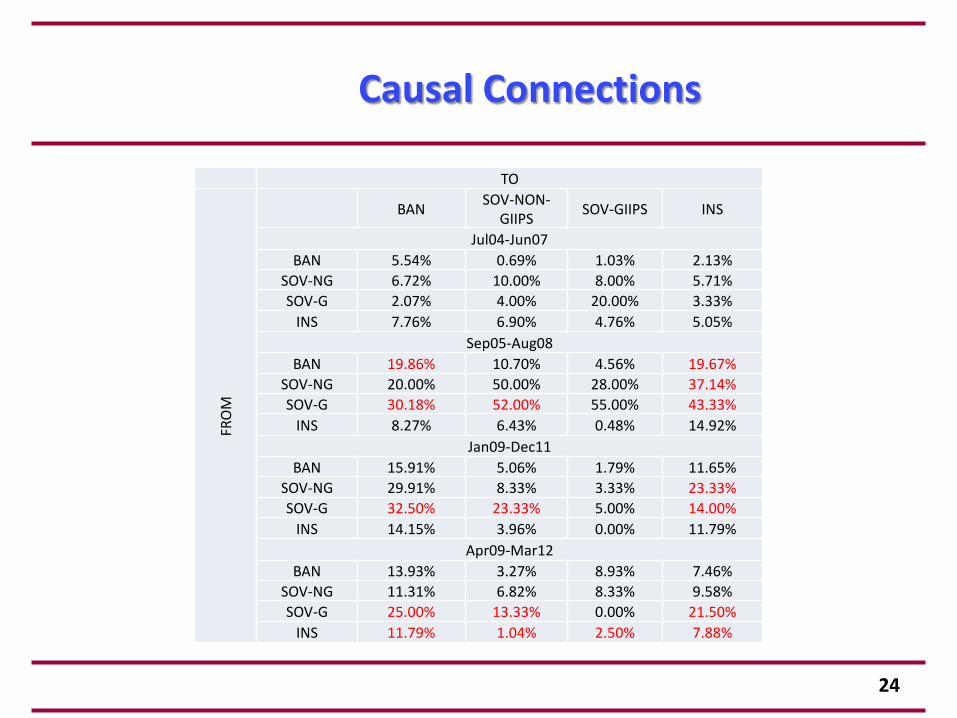
Causal Connections
TO
FRO
MBAN SOV-NON-
GIIPS SOV-GIIPS INS
Jul04-Jun07BAN 5.54% 0.69% 1.03% 2.13%
SOV-NG 6.72% 10.00% 8.00% 5.71%SOV-G 2.07% 4.00% 20.00% 3.33%
INS 7.76% 6.90% 4.76% 5.05%Sep05-Aug08
BAN 19.86% 10.70% 4.56% 19.67%SOV-NG 20.00% 50.00% 28.00% 37.14%SOV-G 30.18% 52.00% 55.00% 43.33%
INS 8.27% 6.43% 0.48% 14.92%Jan09-Dec11
BAN 15.91% 5.06% 1.79% 11.65%SOV-NG 29.91% 8.33% 3.33% 23.33%SOV-G 32.50% 23.33% 5.00% 14.00%
INS 14.15% 3.96% 0.00% 11.79%Apr09-Mar12
BAN 13.93% 3.27% 8.93% 7.46%SOV-NG 11.31% 6.82% 8.33% 9.58%SOV-G 25.00% 13.33% 0.00% 21.50%
INS 11.79% 1.04% 2.50% 7.88%
24
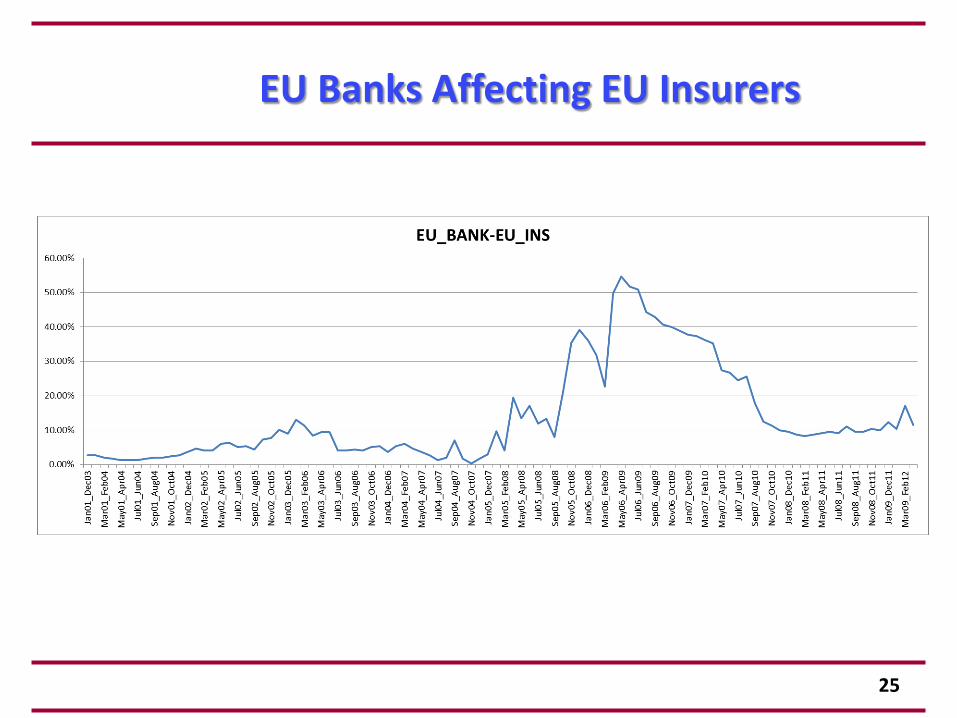
EU Banks Affecting EU Insurers
25
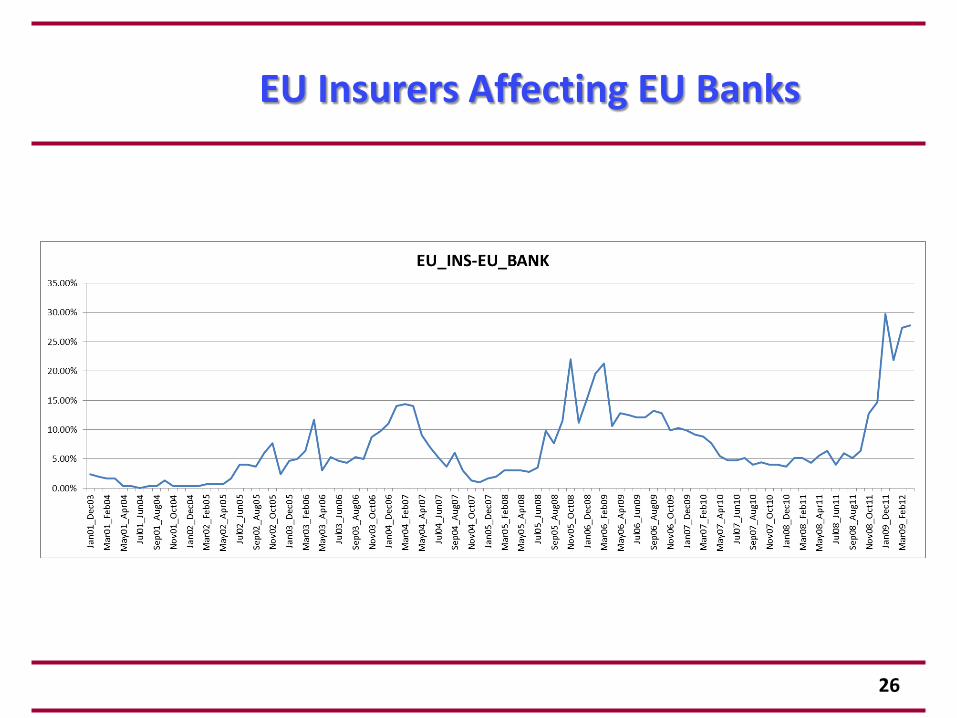
EU Insurers Affecting EU Banks
26
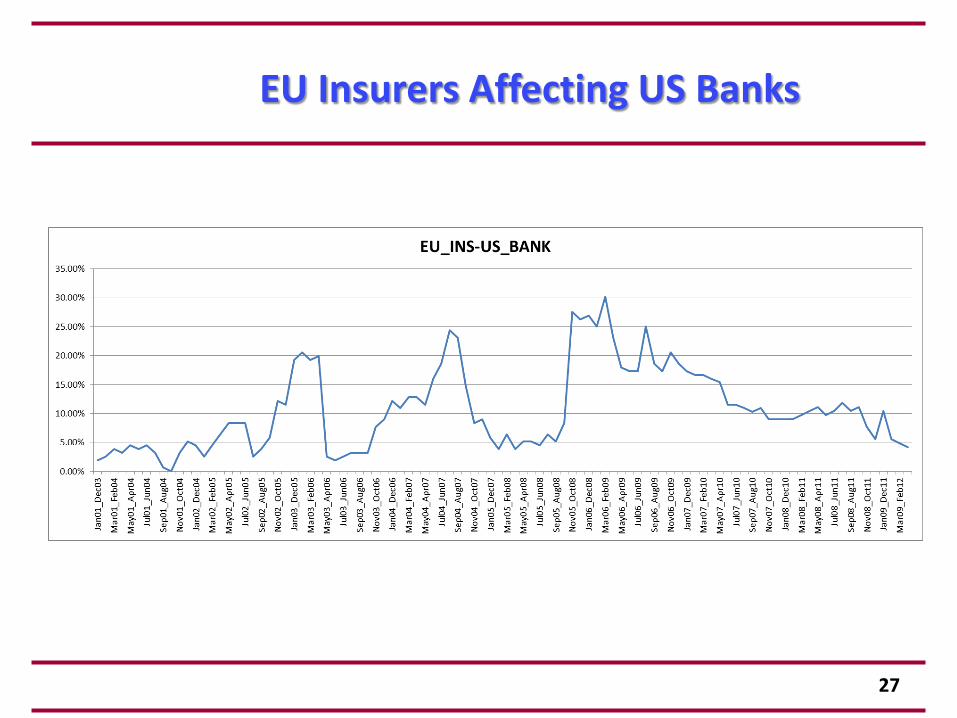
EU Insurers Affecting US Banks
27
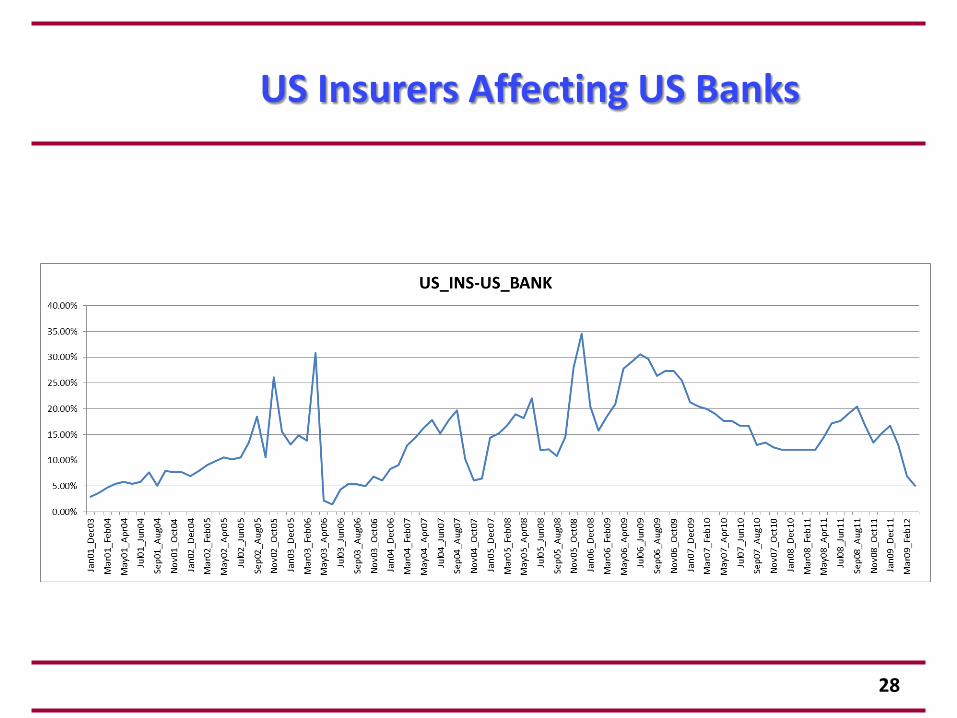
US Insurers Affecting US Banks
28
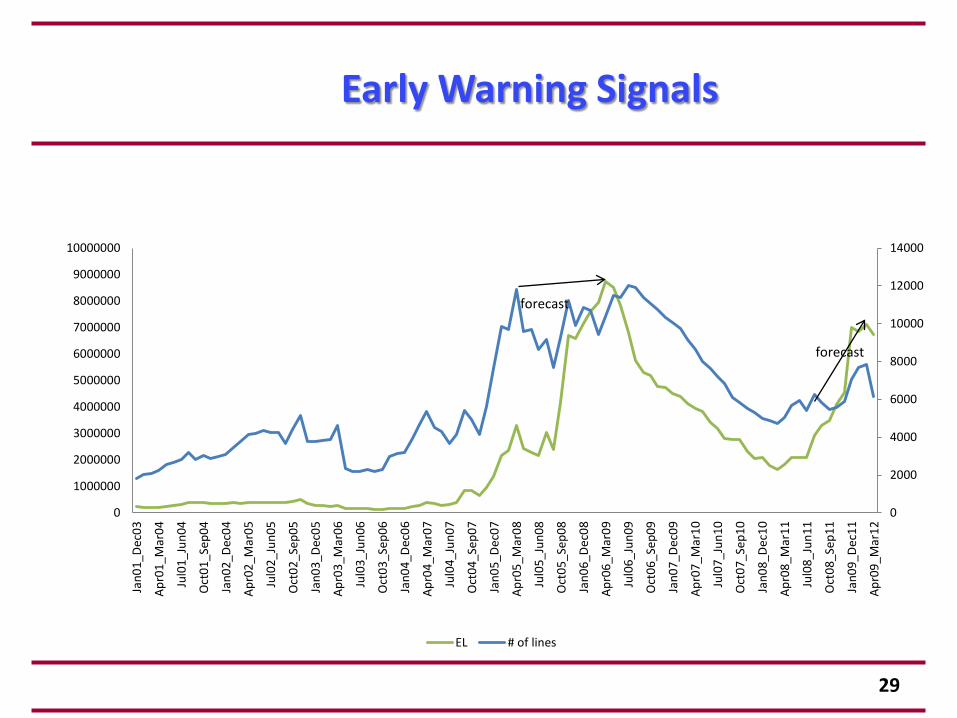
Early Warning Signals
0
2000
4000
6000
8000
10000
12000
14000
0
1000000
2000000
3000000
4000000
5000000
6000000
7000000
8000000
9000000
10000000
Jan0
1_De
c03
Apr0
1_M
ar04
Jul0
1_Ju
n04
Oct
01_S
ep04
Jan0
2_De
c04
Apr0
2_M
ar05
Jul0
2_Ju
n05
Oct
02_S
ep05
Jan0
3_De
c05
Apr0
3_M
ar06
Jul0
3_Ju
n06
Oct
03_S
ep06
Jan0
4_De
c06
Apr0
4_M
ar07
Jul0
4_Ju
n07
Oct
04_S
ep07
Jan0
5_De
c07
Apr0
5_M
ar08
Jul0
5_Ju
n08
Oct
05_S
ep08
Jan0
6_De
c08
Apr0
6_M
ar09
Jul0
6_Ju
n09
Oct
06_S
ep09
Jan0
7_De
c09
Apr0
7_M
ar10
Jul0
7_Ju
n10
Oct
07_S
ep10
Jan0
8_De
c10
Apr0
8_M
ar11
Jul0
8_Ju
n11
Oct
08_S
ep11
Jan0
9_De
c11
Apr0
9_M
ar12
EL # of lines
forecast
forecast
29
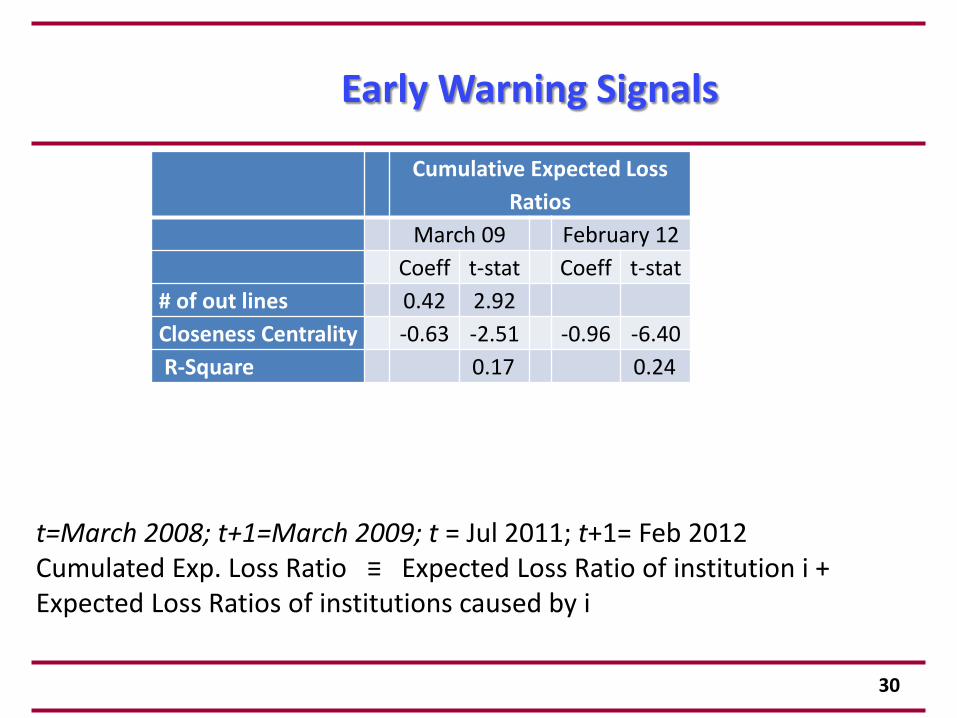
t=March 2008; t+1=March 2009; t = Jul 2011; t+1= Feb 2012Cumulated Exp. Loss Ratio ≡ Expected Loss Ratio of institution i + Expected Loss Ratios of institutions caused by i
Early Warning Signals
Cumulative Expected LossRatios
March 09 February 12Coeff t-stat Coeff t-stat
# of out lines 0.42 2.92Closeness Centrality -0.63 -2.51 -0.96 -6.40R-Square 0.17 0.24
30
Conclusion
• The system of banks, insurance companies, and countries in our sample is highly dynamically connected
• We show how one sovereign/financial institution is spreading risk to another sovereign/financial institution
• Network measures allow for early warnings and assessment of the system complexity
31
Implications
• The decision to bail out a bank or sovereign affects not only the sovereign and its own banks but also other sovereigns and foreign banks in a significant way
• Stress tests are not adequate. Need to account for interconnectedness and non-linearity in exposures
32

Thank You!
33
This project has received funding from the European Union’s Seventh Framework Programme for research, technological
development and demonstration under grant agreement n° 320270
www.syrtoproject.eu