regional precipitation and temperature scenarios for climate change
TRANSCRIPT
This article was downloaded by: [Marshall University]On: 16 August 2013, At: 13:29Publisher: Taylor & FrancisInforma Ltd Registered in England and Wales Registered Number: 1072954 Registeredoffice: Mortimer House, 37-41 Mortimer Street, London W1T 3JH, UK
Hydrological Sciences JournalPublication details, including instructions for authors andsubscription information:http://www.tandfonline.com/loi/thsj20
Regional precipitation andtemperature scenarios for climatechangeANDRAS BARDOSSY a & JAN M. C. VAN MIERLO aa Institut für Wasserbau, Universität Stuttgart, Pfaffenwaldring61, D-70550, Stuttgart, Germany E-mail:Published online: 25 Dec 2009.
To cite this article: ANDRAS BARDOSSY & JAN M. C. VAN MIERLO (2000) Regional precipitation andtemperature scenarios for climate change, Hydrological Sciences Journal, 45:4, 559-575, DOI:10.1080/02626660009492357
To link to this article: http://dx.doi.org/10.1080/02626660009492357
PLEASE SCROLL DOWN FOR ARTICLE
Taylor & Francis makes every effort to ensure the accuracy of all the information (the“Content”) contained in the publications on our platform. However, Taylor & Francis,our agents, and our licensors make no representations or warranties whatsoever as tothe accuracy, completeness, or suitability for any purpose of the Content. Any opinionsand views expressed in this publication are the opinions and views of the authors,and are not the views of or endorsed by Taylor & Francis. The accuracy of the Contentshould not be relied upon and should be independently verified with primary sourcesof information. Taylor and Francis shall not be liable for any losses, actions, claims,proceedings, demands, costs, expenses, damages, and other liabilities whatsoeveror howsoever caused arising directly or indirectly in connection with, in relation to orarising out of the use of the Content.
This article may be used for research, teaching, and private study purposes. Anysubstantial or systematic reproduction, redistribution, reselling, loan, sub-licensing,systematic supply, or distribution in any form to anyone is expressly forbidden. Terms& Conditions of access and use can be found at http://www.tandfonline.com/page/terms-and-conditions
Hydrological Stiences-Journal-des Sciences Hydrologiques, 45(4) August 2000 559
Regional precipitation and temperature scenarios for climate change
ANDRAS BARDOSSY & JAN M. C. VAN MIERLO Institutfîir Wasserbau, Universitàt Stuttgart, Pfaffenwaldring 61, D-Î'05'50 Stuttgart, Germany e-mail: [email protected]
Abstract To investigate the consequences of climate change on the water budget in small catchments, it is necessary to know the change of local precipitation and temperature. General Circulation Models (GCM) cannot provide regional climate parameters yet, because of their coarse resolution and imprecise modelling of precipitation. Therefore downscaling of precipitation and temperature has to be carried out from the GCM grids to a small scale of a few square kilometres. Daily rainfall and temperature are modelled as processes conditioned on atmospheric circulation. Rainfall is linked to the circulation patterns (CPs) using conditional probabilities and conditional rainfall amount distribution. Both temperature and precipitation are downscaled to several locations simultaneously taking into account the CP dependent spatial correlation. Temperature is modelled using a simple autoregressive approach, conditioned on atmospheric circulation and local areal precipitation. The model uses the classification scheme of the German Weather Service and a fuzzy rule-based classification. It was applied in the Aller catchment for validation using observed rainfall and temperature, and observed classified geopotential pressure heights. GCM scenarios of the ECHAM model were used to make climate change predictions (using classified GCM geopotential heights); simulated values agree fairly well with historical data. Results for different GCM scenarios are shown.
Scénarios régionaux de précipitations et de températures dans la perspective d'un changement climatique Résumé Afin d'étudier les conséquences d'un changement climatique sur le bilan en eau de petits bassins, il est nécessaire de connaître les changements des précipitations et des températures à l'échelle locale. Les modèles de circulation générale ne peuvent pas à l'heure actuelle fournir de telles données en raison de leur résolution grossière et d'une médiocre modélisation des précipitations. Il est donc nécessaire de désagréger les précipitations et les températures depuis l'échelle du maillage des modèles de circulation générale jusqu'à une échelle de quelques kilomètres carrés. Les précipitations et températures journalières sont modélisées comme des processus conditionnés par la circulation atmosphérique. Les précipitations ont été reliées aux structures de la circulation générale en utilisant des probabilités conditionnelles et des distributions conditionnelles de hauteurs de pluie. Les précipitations comme les températures locales ont été simultanément estimées en différents lieux par une désagrégation tenant compte des corrélations spatiales existantes. La température a été modélisée en utilisant une approche autorégressive, conditionnée par la circulation générale et la précipitation spatiale locale. Le modèle utilise la typologie du service météorologique allemand et un système de classification basé sur des règles de logique floue. Le modèle a été validé sur le bassin de l'Aller, en utilisant les observations des précipitations, des températures ainsi que des champs de pression atmosphérique. Différents scénarios de circulation du modèle ECHAM ont été utilisés pour prédire les changements climatiques; les valeurs simulées s'accordent très bien avec les valeurs historiques. Les résultats correspondant à différents scénarios de modèles de circulation générale sont présentés.
* This paper is dedicated to Professor Erich Plate in honour of his 70th birthday.
Open for discussion until 1 February 2001
Dow
nloa
ded
by [
Mar
shal
l Uni
vers
ity]
at 1
3:29
16
Aug
ust 2
013
560 Andrâs Bârdossy & Jan M. C. van Mierlo
INTRODUCTION
A space-time model for simultaneous simulation of daily precipitation and daily mean temperature using atmospheric circulation patterns as synoptic information has been developed. The purpose of this paper is to obtain regional precipitation and temperature scenarios for climate change conditions. The space-time model is not only sought for the description of local meteorological processes, but it enables the space-time simulation of daily precipitation and daily mean temperature.
In the past 100 years, the average temperature in Europe has increased about 0.6°C due to the rise in concentration of greenhouse gases in the atmosphere. Given human activities, the concentration of these gases will continue to rise. Climate is thus expected to change in the long term. The increased temperature will presumably influence the hydrological cycle. Nonstationary conditions caused by climate change can be observed for global climate, as well as for smaller areas. Therefore it is impossible to infer future conditions from past hydrological events by assuming stationary conditions.
It is obvious that there is a close relationship between atmospheric circulation and climatic variables. Burger (1958) studied the relationship between the atmospheric circulation patterns and mean, maximum and minimum daily temperatures, PRECIPITA
TION amounts and cloudiness using the time series from 1890 to 1950 measured at four German cities (Berlin, Bremen, Karlsruhe and Munich). He found a good correspondence between climatic variables and atmospheric circulation. Lamb (1972, 1977) stated that even the highly varying precipitation is strongly linked to the atmospheric circulation. Trenberth (1990) has analysed the importance of atmospheric dynamics in climate change. He also states that atmospheric circulation is the major link between regional change in climate variables.
Bârdossy & Caspary (1990) have analysed a long time series of classified atmospheric circulation patterns (CP). Statistically significant changes in the occurrence frequencies were observed. Wet CPs increased during the winter season in the last two decades, whereas cold CPs decreased. Warmer and rainier winters can already be inferred in Europe.
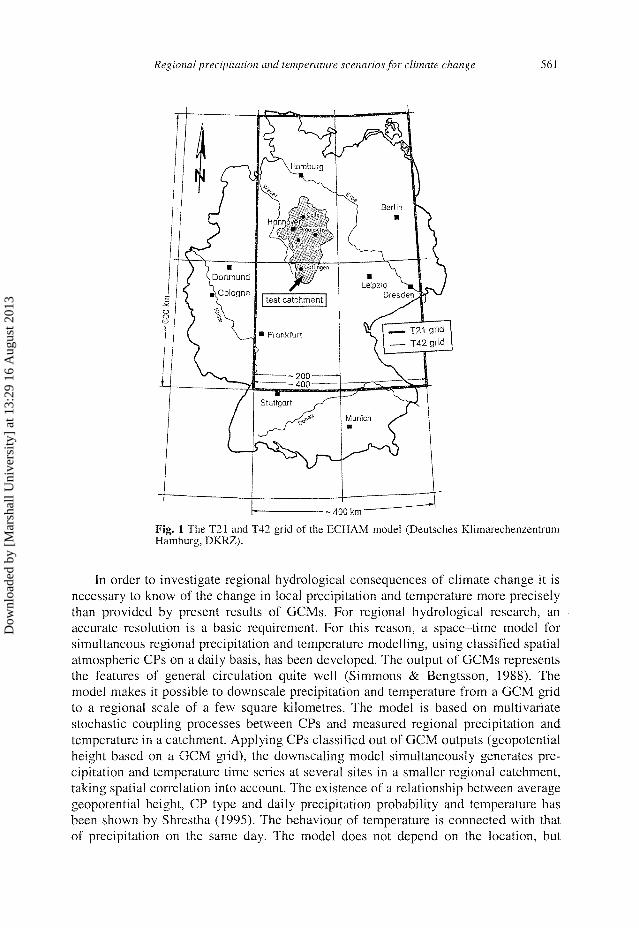
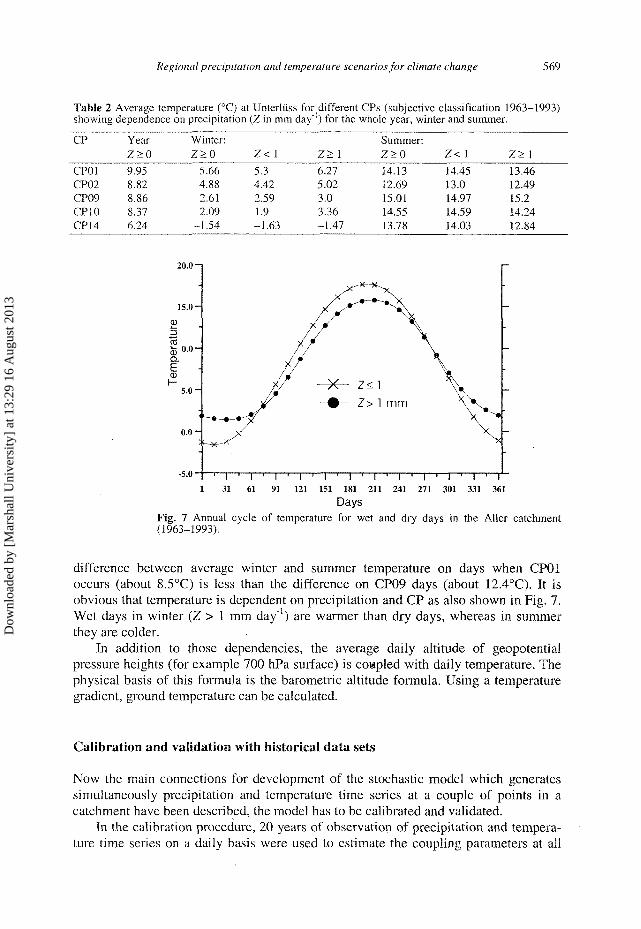
Physically-based hydrological models coupled with General Circulation Models (GCM) can be used for calculating the hydrological consequences of climate change. Present GCMs cannot yet provide regional climate parameters very well, because of their low spatial resolution and imprecise modelling of precipitation. For this reason a downscaling approach is used in the space-time model. Figure 1 shows the T21 and T42 grid of the ECHAM model (Deutsches Klimarechenzentrum (DKRZ)) and the Aller catchment, Germany. The catchment is used in a case study in this paper in order to determine regional consequences of climate change. The GCM cells (T21:400 x 600 km, T42: 200 x 300 km) may include several gauge sites, but due to the high heterogeneity within them they cannot be used to provide a description of regional or local climate change.
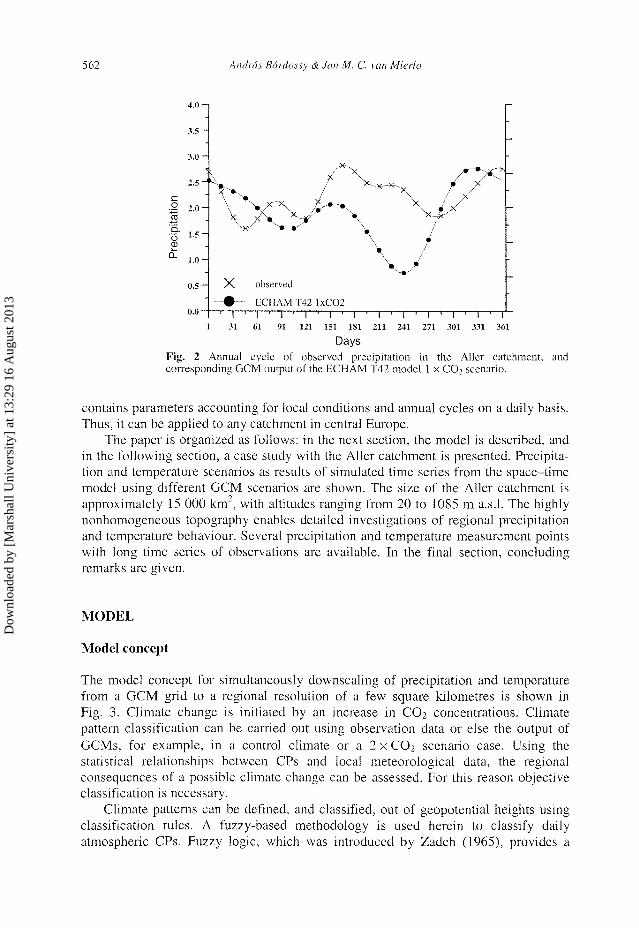
Figure 2 shows the average annual cycle of observed precipitation in the Aller catchment in the period 1963-1993 as well as the direct GCM output of the ECHAM T42 model out of the 1 X CO2 scenario in the period 1987-2016. Unfortunately, precipitation values estimated by GCMs are imprecise. In the summer, ECHAM T42 underestimates precipitation by 2 mm day"1 !
Dow
nloa
ded
by [
Mar
shal
l Uni
vers
ity]
at 1
3:29
16
Aug
ust 2
013
Regional precipitation and temperature scenarios for climate change 561
400 km "
Fig. 1 The T21 and T42 grid of the ECHAM model (Deutsches Klimarechenzentrum Hamburg, DKRZ).
In order to investigate regional hydrological consequences of climate change it is necessary to know of the change in local precipitation and temperature more precisely than provided by present results of GCMs. For regional hydrological research, an accurate resolution is a basic requirement. For this reason, a space-time model for simultaneous regional precipitation and temperature modelling, using classified spatial atmospheric CPs on a daily basis, has been developed. The output of GCMs represents the features of general circulation quite well (Simmons & Bengtsson, 1988). The model makes it possible to downscale precipitation and temperature from a GCM grid to a regional scale of a few square kilometres. The model is based on multivariate stochastic coupling processes between CPs and measured regional precipitation and temperature in a catchment. Applying CPs classified out of GCM outputs (geopotential height based on a GCM grid), the downscaling model simultaneously generates precipitation and temperature time series at several sites in a smaller regional catchment, taking spatial correlation into account. The existence of a relationship between average geopotential height, CP type and daily precipitation probability and temperature has been shown by Shrestha (1995). The behaviour of temperature is connected with that of precipitation on the same day. The model does not depend on the location, but
Dow
nloa
ded
by [
Mar
shal
l Uni
vers
ity]
at 1
3:29
16
Aug
ust 2
013
562 Andrâs Bârdossv & Jan M. C. van Mierlo
4.0 —|
3.5
3.0 H
2-5"V 2.0-.2 i n - I
S '5. 1.5-
~7\— observed
- # — ECHAMT42 lxC02 °-° I ' I ' I ' I ' I ' I ' I ' I ' I ' I '
1 31 61 91 121 151 181 211 241 271 301 331 361
Days Fig. 2 Annual cycle of observed precipitation in the Aller catchment, and corresponding GCM output of the ECHAM T42 model 1 x C 0 2 scenario.
contains parameters accounting for local conditions and annual cycles on a daily basis. Thus, it can be applied to any catchment in central Europe.
The paper is organized as follows: in the next section, the model is described, and in the following section, a case study with the Aller catchment is presented. Precipitation and temperature scenarios as results of simulated time series from the space-time model using different GCM scenarios are shown. The size of the Aller catchment is approximately 15 000 km2, with altitudes ranging from 20 to 1085 m a.s.l. The highly nonhomogeneous topography enables detailed investigations of regional precipitation and temperature behaviour. Several precipitation and temperature measurement points with long time series of observations are available. In the final section, concluding remarks are given.
MODEL
Model concept
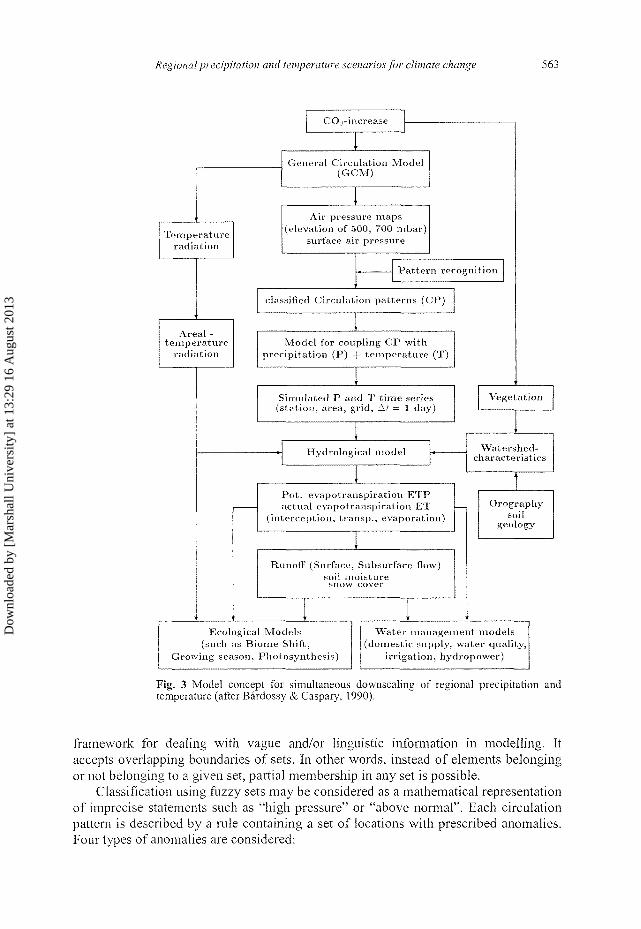
The model concept for simultaneously downscaling of precipitation and temperature from a GCM grid to a regional resolution of a few square kilometres is shown in Fig. 3. Climate change is initiated by an increase in CO2 concentrations. Climate pattern classification can be carried out using observation data or else the output of GCMs, for example, in a control climate or a 2 x COz scenario case. Using the statistical relationships between CPs and local meteorological data, the regional consequences of a possible climate change can be assessed. For this reason objective classification is necessary.
Climate patterns can be defined, and classified, out of geopotential heights using classification rules. A fuzzy-based methodology is used herein to classify daily atmospheric CPs. Fuzzy logic, which was introduced by Zadeh (1965), provides a
Dow
nloa
ded
by [
Mar
shal
l Uni
vers
ity]
at 1
3:29
16
Aug
ust 2
013
Regional precipitation and temperature scenarios for climate change 563
Temperature radiation
Areal -temperature
radiation
CO ^-increase
General Circulation Model (GCM)
Air pressure maps (elevation of 500, 700 mbar)
surface air pressure
Pat tern recognition
classified Circulation patterns (CP)
Model for coupling CP with precipitation (P) + tempera ture (T)
Simulated P and T t ime series (station, area, grid, At = 1 day)
Vegetation
Hydrological model Watershed-characteristics
Pot. évapotranspiration ETP actual évapotranspiration ET
(interception, transp., evaporation)
Runoff (Surface, Subsurface flow) soil moisture snow cover
Ecological Models (such as Biome Shift,
Growing season, Photosynthesis)
Orography soil
geology
Water management models (domestic supply, water quality,
irrigation, hydropower)
Fig. 3 Model concept for simultaneous downscaling of regional precipitation and temperature (after Bârdossy & Caspary, 1990).
framework for dealing with vague and/or linguistic information in modelling. It
accepts overlapping boundaries of sets. In other words, instead of elements belonging
or not belonging to a given set, partial membership in any set is possible.
Classification using fuzzy sets may be considered as a mathematical representation
of imprecise statements such as "high pressure" or "above normal". Each circulation
pattern is described by a rule containing a set of locations with prescribed anomalies.
Four types of anomalies are considered:
Dow
nloa
ded
by [
Mar
shal
l Uni
vers
ity]
at 1
3:29
16
Aug
ust 2
013
564 Andrâs Bârdossy & Jan M. C. van Mierlo
Legend:
Points with very high air pressure
Points with low air pressure
Points with high air pressure
Points with very low air pressure
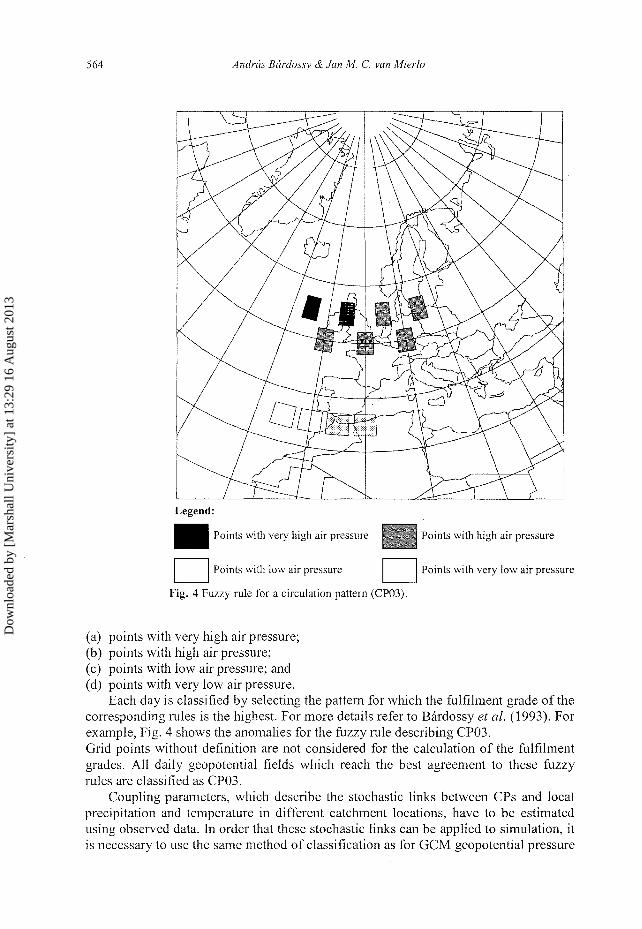
Fig. 4 Fuzzy rule for a circulation pattern (CP03).
(a) points with very high air pressure; (b) points with high air pressure; (c) points with low air pressure; and (d) points with very low air pressure.
Each day is classified by selecting the pattern for which the fulfilment grade of the corresponding rules is the highest. For more details refer to Bârdossy et al. (1993). For example, Fig. 4 shows the anomalies for the fuzzy rule describing CP03. Grid points without definition are not considered for the calculation of the fulfilment grades. All daily geopotential fields which reach the best agreement to these fuzzy rules are classified as CP03.
Coupling parameters, which describe the stochastic links between CPs and local precipitation and temperature in different catchment locations, have to be estimated using observed data. In order that these stochastic links can be applied to simulation, it is necessary to use the same method of classification as for GCM geopotential pressure
Dow
nloa
ded
by [
Mar
shal
l Uni
vers
ity]
at 1
3:29
16
Aug
ust 2
013
Regional precipitation and temperature scenarios for climate change 565
heights. With the attained parameters of precipitation and temperature, time series (scenarios, time step At - 1 day) can be simulated using the GCM CPs. Note, the behaviour of temperature is connected to that of precipitation. The simulated time series can be used in different models to investigate regional consequences of climate change.
PRECIPITATION
A major problem in the mathematical description of precipitation is the spatial and temporal intermittence. Dry days occur with high probability, and on rainy days a continuous distribution describes the rainfall amounts at a selected location. Therefore random variables with mixed distributions are required to describe daily precipitation. Another problem arises in the clustering of the occurrence of wet and dry days. This clustering has natural causes and was usually modelled with the help of appropriate distributions, for example obtained using Neymann-Scott models. In the time-space model, clustering is the consequence of the persistence of atmospheric circulation patterns.
Let A = {cti,..., cc„} be the set of possible atmospheric circulation patterns. Let A\
be the random variable describing the actual atmospheric circulation, taking its values from A. Let the daily precipitation amount at time t and point u in the region U be modelled as the random function Z(t, u), u e U. The distribution of rainfall amounts at a selected location is skewed. In order to relate it to a simple normally distributed random function W(t, u) (for any locations u\,..., un the vector W(0 = Wit, u\),..., Wit, u„) is a multivariate normal random vector), the following power transformation relationship is introduced:
0 if Wit,u)<0 (1)
W*it,u) if Wit,u)>0
Here P is an appropriate positive exponent. This way the mixed (discrete-continuous) distribution of Zif, u) is related to a normal distribution. As the process Zit, u) depends on the atmospheric circulation pattern, the same applies to Wit, u). The reason for this transformation is that multivariate processes can be modelled much easier if the process is normal. The problem of intermittence can also be handled this way, as the negative values of W are declared as dry days and dry locations. The exponent j3 is needed as the distribution of precipitation amounts is usually much more skewed than the truncated normal distribution.
The relationship between Wit, u) and the circulation pattern A\ is obtained through
the rainfall process Z(f, u) using equation (1). The probability of rainfall at time t and
location u depends on At:
p\vit,u)>0\At =a , . ]=p[z(M0>0| i4 , =a\=p,(u,t) (2)
The distribution of daily rainfall amount at location u, F;(Z|M), also depends on A, and
the time (day of a year) t:
Zit,u) •
Dow
nloa
ded
by [
Mar
shal
l Uni
vers
ity]
at 1
3:29
16
Aug
ust 2
013
566 Andrâs Bârdossy & Jan M. C. van Mierlo
p[z(t,u)<z\Ât=ai,Z(t,u)>o\=Fi(z\u,t) (3)
Equation (1) establishes the link between W(0 and the rainfall Z(f), thus the multidimensional rainfall process is fully described. The parameters of W(0 depend on the CP and the day of the year t. The dependence on t is described by using Fourier series.
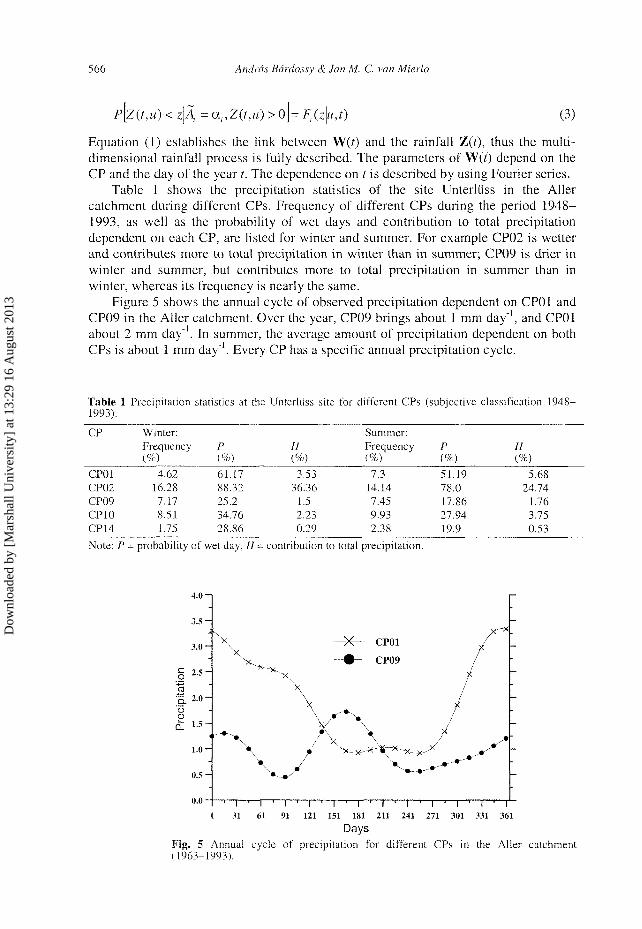
Table 1 shows the precipitation statistics of the site Unterliiss in the Aller catchment during different CPs. Frequency of different CPs during the period 1948-1993, as well as the probability of wet days and contribution to total precipitation dependent on each CP, are listed for winter and summer. For example CP02 is wetter and contributes more to total precipitation in winter than in summer; CP09 is drier in winter and summer, but contributes more to total precipitation in summer than in winter, whereas its frequency is nearly the same.
Figure 5 shows the annual cycle of observed precipitation dependent on CP01 and CP09 in the Aller catchment. Over the year, CP09 brings about 1 mm day"1, and CP01 about 2 mm day" . In summer, the average amount of precipitation dependent on both CPs is about 1 mm day"1. Every CP has a specific annual precipitation cycle.
Table 1 Precipitation statistics at the Unterliiss site for different CPs (subjective classification 1948-1993).
CP
CP01 CP02 CP09 CP10 CP14
Winter: Frequency (%)
4.62 16.28 7.17 8.51 1.75
P
61.17 88.32 25.2 34.76 28.86
H (%) 3.53
36.36 1.5 2.23 0.29
Summer: Frequency (%) 7.3
14.14 7.45 9.93 2.38
P (%) 51.19 78.0 17.86 27.94 19.9
H (%)
5.68 24.74
1.76 3.75 0.53
Note: P = probability of wet day, H = contribution to total precipitation.
°-° I ' I ' I ' I ' I ' I ' I ' I ' I ' I ' I ' I ' I 1 31 61 91 121 151 181 211 241 271 301 331 361
Days Fig. 5 Annual cycle of precipitation for different CPs in the Aller catchment (1963-1993).
Dow
nloa
ded
by [
Mar
shal
l Uni
vers
ity]
at 1
3:29
16
Aug
ust 2
013
Regional precipitation and temperature scenarios for climate change 567
The model has been developed on the basis of coupling multivariate stochastic processes between CPs and measured regional precipitation distribution as described above. The present model is an improvement of the precipitation model developed by Bârdossy & Plate (1992). This model included winter and summer seasons only, whereas the new model includes a "smooth" annual cycle and generates precipitation time series for several sites in a smaller regional catchment taking into consideration spatial correlation. It is now possible to simulate precipitation for a set of points simultaneously.
Temperature
Unlike precipitation, daily mean temperature is much less variable in space, and much of the variability can be described by the topography. The clear annual cycle has to be taken into account. For this purpose, the average elevation of a pressure level (such as 700 or 500 hPa) Hp is used. Further, the temperature depends on the previous day's temperature and the CP, and is also connected to the precipitation of the same day.
T(u,t) ^F(U,Hp(t),Àl,T(u,t -ï),Z(u,t)) (4)
The link between precipitation and temperature is established using an indicator:
Iz(t) = 1 r
1 if -,—r \ Z(t,u)du> zn
\G\l ° (5) 0 else
The indicator depends on the areal precipitation, which is estimated from the observation points by ordinary kriging (Matheron, 1973) using the spatial correlation function of precipitation. Thus the kriging weights À,- do not depend on the time t.
r^Jz(?,M)dM = ^X,Z(a,,0 (6) | G | G M
Using the notation T(f) = {T{ii\, t), ..., (T(um, ?)), c(/) = (ci(7), •••, (c,„(/)) and d(7) = (d\(I),..., (dm(I)), two versions of the temperature model have been developed.
Version 1: CP dependent T-Hp(t) relationship For this model version it was assumed that the relationship between temperature and elevation of the pressure surface is specific for each CP. This means that the expected temperature can be estimated with a linear relationship:
E[T(t)] = L{i, Hp (f))= c,. (lz {t))Hp (t) + d, (lz (0) (7)
The time continuity is assured with an AR(1) model described as:
T(?) = L(i,Hp(t))+ P,{T(t -1) - L{i,Hp(t -1))+ S,¥(?) (8)
Here, the index /' represents the CP: A, = cc, for day t; T(?) = \\f(t, wi),..., \\f(t, um) is a
random vector of independent N(0, 1) random variables; and P, is the CP dependent
Dow
nloa
ded
by [
Mar
shal
l Uni
vers
ity]
at 1
3:29
16
Aug
ust 2
013
568 Andrâs Bârdossy & Jan M. C, van Mierlo
mx m matrix of the autoregressive part of the process. The model is simpler than that for precipitation, as no transformation of the variables is required. The annual cycle of temperature is included in the annual cycle of the average elevation of the pressure surface Hp(t); c(7) and d(7) are the vectors of the coefficients used to describe this relationship.
Version 2: direct T-Hp(t) relationship Another possibility is to assume a general relationship between the elevation and the pressure surface, with residuals depending on the circulation pattern and the annual cycle.
E[T(t)] = c(/z {t))Hp (0 + d(/2 (0) + R, if) (9)
with R,-(0 being the residual depending on the zth CP and the time of year t. The components Ri(u, t) of this function are expressed with Fourier series:
Rt{u,t) = ̂ j(ak(Ri,u)sin(kwt) + bk(Ri,u)cos(kwt)) (10)
In order to obtain a model producing natural variability, an AR(1) type process is used:
T(r) = c(/z (t))Hp (t) + d(/ z (t)) + R, (t) +
P,JT(7 -1) - [c(lz(t - l))Hp(t -1) + d(/z(? -1))+ R,(f -1)]}+ S,.Y(0 (11)
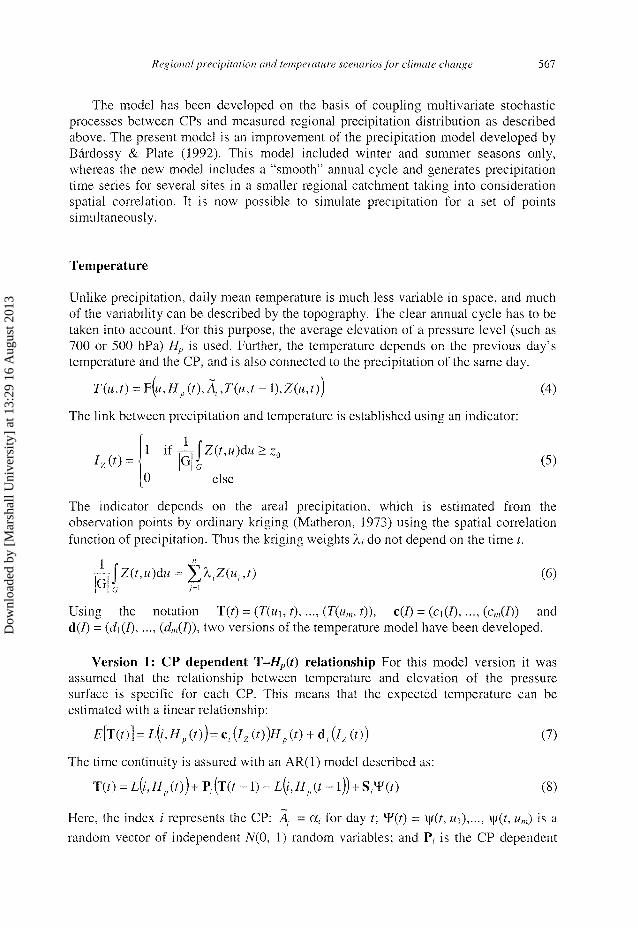
Note that the expectation of the previous day is calculated using the present day's CP. Figure 6 shows the average annual cycle of observed temperature dependent on
CPs in the Aller catchment in the period from 1963 to 1993. It is clear that temperature is dependent on geopotential height pressure maps, i.e. CPs. The average temperature in winter during occurrence of CP01 is higher than that when CP09 occurs. In summer it is just the opposite. Here the average temperature is higher during CP09 days than during CP01 days. Table 2 shows average temperatures during different CPs. The
20.0-1
15.0-
10.0
m a .
-5-0 I ' I ' I ' I ' I ' I ' I ' I ' I ' I ' I ' I ' I" 1 31 61 91 121 151 181 211 241 271 301 331 361
Days Fig. 6 Annual cycle of temperature for different CPs in the Aller catchment (1963-1993).
Dow
nloa
ded
by [
Mar
shal
l Uni
vers
ity]
at 1
3:29
16
Aug
ust 2
013
Regional precipitation and temperature scenarios for climate change 569
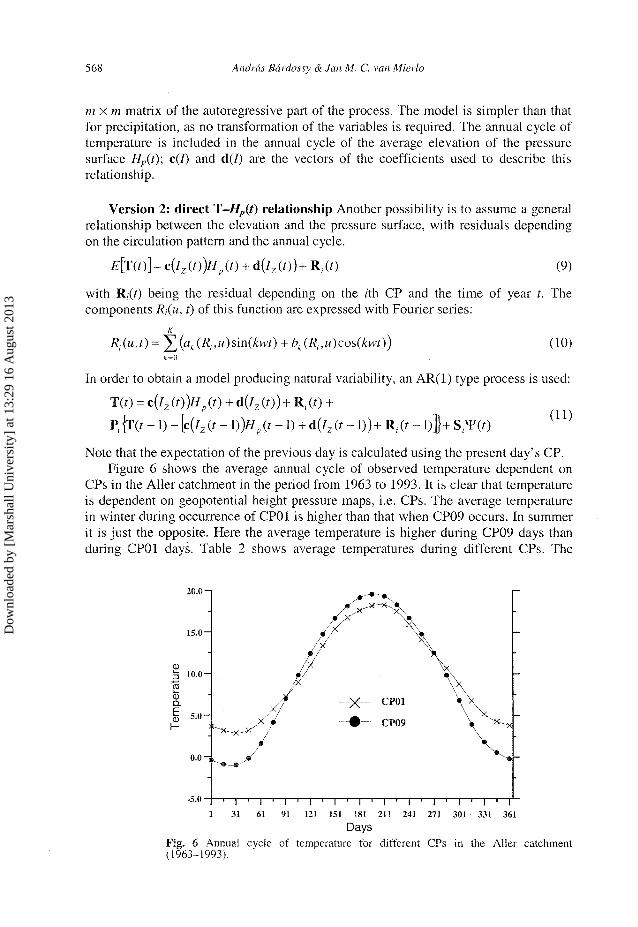
Table 2 Average temperature (°C) at Unterliiss for different CPs (subjective classification 1963-1993) showing dependence on precipitation (Z in mm day"1) for the whole year, winter and summer.
CP
CP01 CP02 CP09 CP10 CP14
Year Z > 0 9.95 8.82 8.86 8.37 6.24
Winter: Z > 0
5.66 4.88 2.61 2.09
-1.54
Z<1
5.3 4.42 2.59 1.9 -1.63
Z> 1 6.27 5.02 3.0 3.36 -1.47
Summer: Z > 0 14.13 12.69 15.01 14.55 13.78
Z<\
14.45 13.0 14.97 14.59 14.03
Z > 1
13.46 12.49 15.2 14.24 12.84
20.0-1
-5-0 I ' I ' I ' I ' I ' I ' 1 ' 1 ' I ' I ' I ' I • I 1 31 61 91 121 151 181 211 241 271 301 331 361
Days Fig. 7 Annual cycle of temperature for wet and dry days in the Aller catchment (1963-1993).
difference between average winter and summer temperature on days when CP01 occurs (about 8.5°C) is less than the difference on CP09 days (about 12.4°C). It is obvious that temperature is dependent on precipitation and CP as also shown in Fig. 7. Wet days in winter (Z > 1 mm day"1) are warmer than dry days, whereas in summer they are colder.
In addition to those dependencies, the average daily altitude of geopotential pressure heights (for example 700 hPa surface) is coapled with daily temperature. The physical basis of this formula is the barometric altitude formula. Using a temperature gradient, ground temperature can be calculated.
Calibration and validation with historica! data sets
Now the main connections for development of the stochastic model which generates simultaneously precipitation and temperature time series at a couple of points in a catchment have been described, the model has to be calibrated and validated.
In the calibration procedure, 20 years of observation of precipitation and temperature time series on a daily basis were used to estimate the coupling parameters at all
Dow
nloa
ded
by [
Mar
shal
l Uni
vers
ity]
at 1
3:29
16
Aug
ust 2
013
570 Andrâs Bârdossy & Jan M. C. van Mierlo
measurement points with available data sets in the Aller catchment. Using these estimated parameters, precipitation and temperature time series were generated by the model for 10 more years. The simulated and observed time series were then compared. It was shown that the model simulates time series which match very well the measured time series for precipitation and temperature behaviour. Observed (31 mm day"1) and simulated (30 mm day4) average daily maximum precipitation on a yearly basis agree very well. Standard deviations of these quantities (8.5 mm day"1 (observed) and 10.5 mm day"1 (simulated)) also show good agreement. Average deviation between observed and simulated temperature is about 0.1 °C. Variability and average behaviour of precipitation and temperature distribution is well described over the annual cycle and also in its spatial structure. Dry periods during the growing season and maximum daily precipitation show good agreement with the measured data.
ALLER CATCHMENT CASE STUDY: REGIONAL PRECIPITATION AND TEMPERATURE SCENARIOS
Data description
For generating regional precipitation and temperature time series, downscaling using GCM output (ECHAM T42) was carried out for the Aller catchment. Two climate scenarios have been used: (a) geopotential pressure heights of the 1 x C0 2 scenario (control climate), which
were available for 30 years; and (b) geopotential pressure heights of the 2 x C0 2 scenario (changed climate), which
were available for 40 years. The geopotential pressure heights (700 hPa altitude) of both scenarios were
classified as described in the previous section. These classified CPs were used as forcing conditions in the model, which generates precipitation time series first. Simulated precipitation time series and CP time series were jointly used to generate temperature time series.
Scenarios
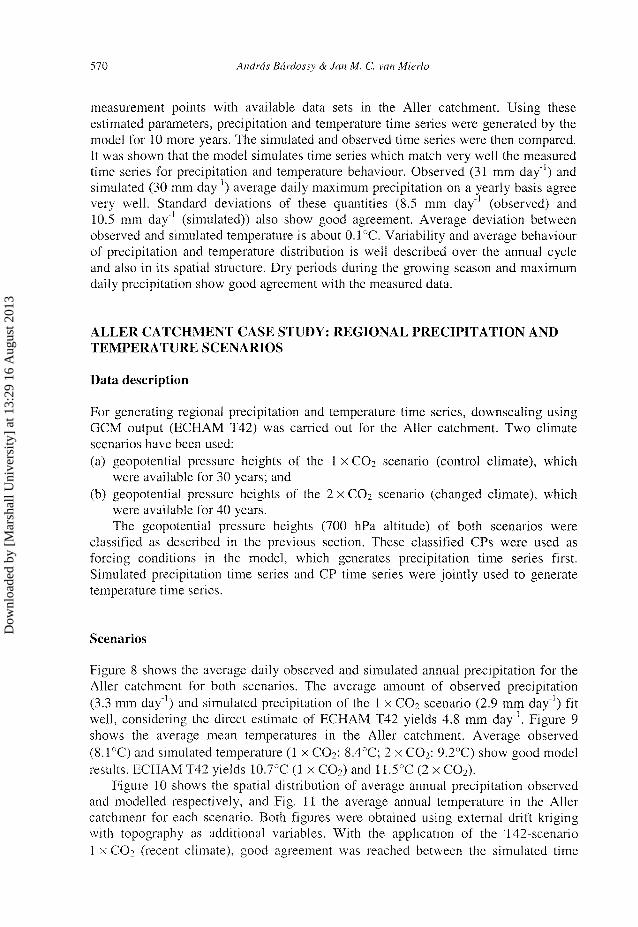
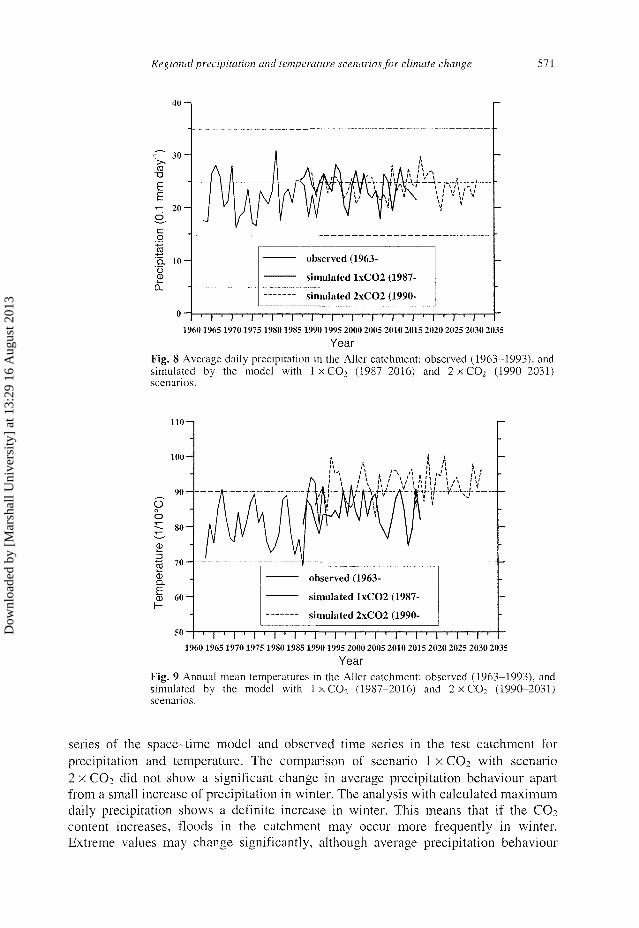
Figure 8 shows the average daily observed and simulated annual precipitation for the Aller catchment for both scenarios. The average amount of observed precipitation (3.3 mm day"1) and simulated precipitation of the 1 x CO2 scenario (2.9 mm day"1) fit well, considering the direct estimate of ECHAM T42 yields 4.8 mm day"1. Fi gure y shows the average mean temperatures in the Aller catchment. Average observed (8.1°C) and simulated temperature (1 x C0 2 : 8.4°C; 2 x C02 : 9.2°C) show good model results. ECHAM T42 yields 10.7°C (1 x COz) and 11.5°C (2 x C02).
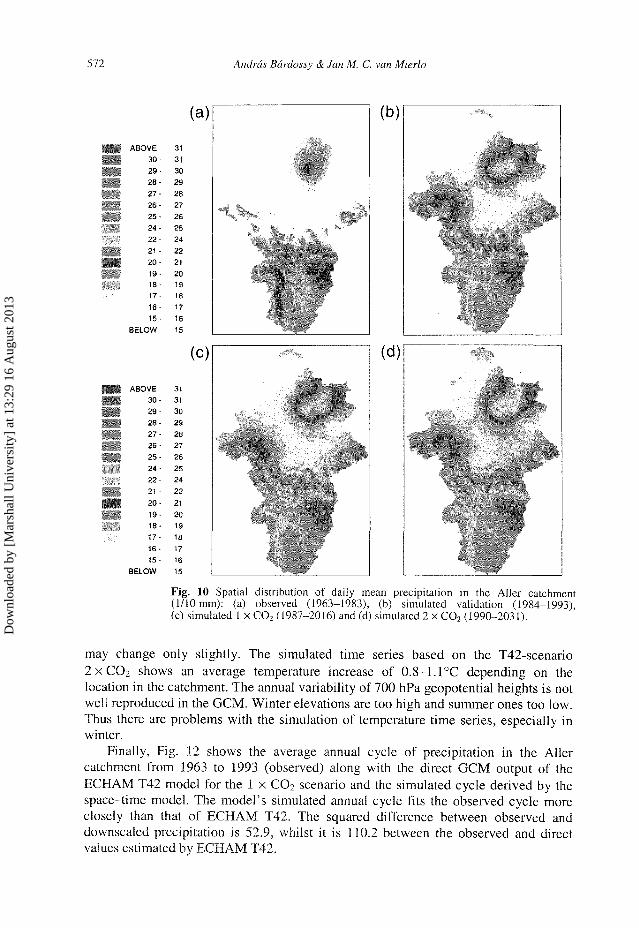
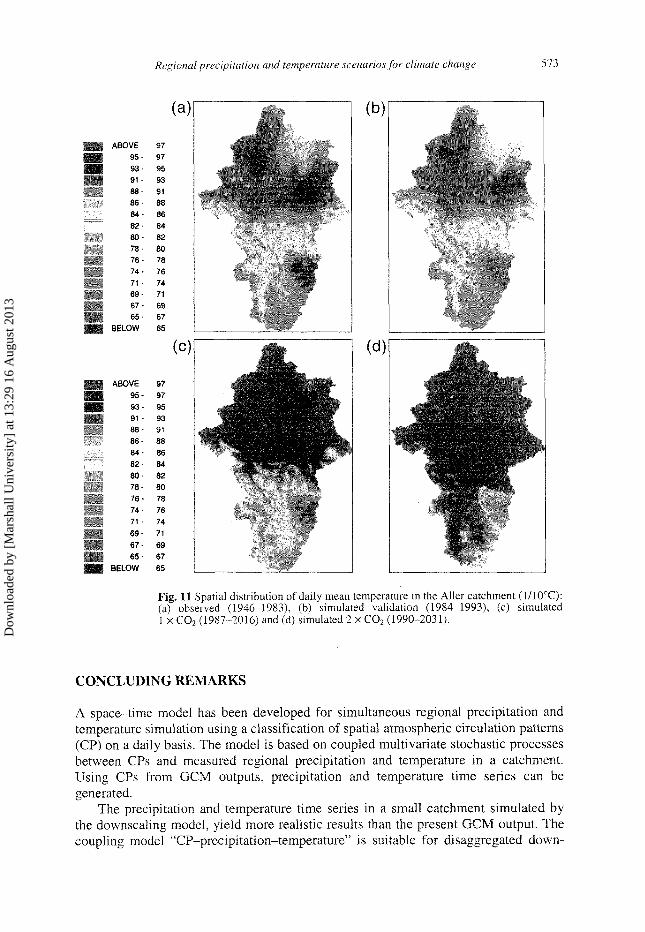
Figure 10 shows the spatial distribution of average annual precipitation observed and modelled respectively, and Fig. 11 the average annual temperature in the Aller catchment for each scenario. Both figures were obtained using external drift kriging with topography as additional variables. With the application of the T42-scenario 1 x C0 2 (recent climate), good agreement was reached between the simulated time
Dow
nloa
ded
by [
Mar
shal
l Uni
vers
ity]
at 1
3:29
16
Aug
ust 2
013
Regional precipitation and temperature scenarios for climate change 571
v 30-CD
T3
E E i - 20-
g m "g. 1 0 -'o <D
0 -
observed (1963-
simulated lxC02 (1987-
simulated 2xC02 (1990-
,-),
1 I ' I ' I ' I ' I ' I ' I ' I ' I ' I ' I ' I ' I 19601965 1970 1975 1980 1985 1990 1995 2000 2005 2010 2015 2020 2025 2030 203=
Year Fig. 8 Average daily precipitation in the Aller catchment: observed (1963-1993), and simulated by the model with 1 x C 0 2 (1987-2016) and 2 x C 0 2 (1990-2031) scenarios.
110-
1 0 0 -
o b
«
9 0 -
7 0 - '
<D Q.
I 60-
50-
ïXMm+J :
observed (1963-
simulated l x C 0 2 (1987-
simulated 2 x C 0 2 (1990-
I ' I ' I ' I ' I ' I ' I ' I ' I ' I ' I ' I ' I 1960 1965 1970 1975 1980 1985 1990 1995 2000 2005 2010 2015 2020 2025 2030 2035
Year Fig. 9 Annual mean temperatures in the Aller catchment: observed (1963-1993), and simulated by the model with 1 x C 0 2 (1987-2016) and 2 x C 0 2 (1990-2031) scenarios.
series of the space-time model and observed time series in the test catchment for precipitation and temperature. The comparison of scenario 1 x CO2 with scenario 2 x C0 2 did not show a significant change in average precipitation behaviour apart from a small increase of precipitation in winter. The analysis with calculated maximum daily precipitation shows a definite increase in winter. This means that if the CO2 content increases, floods in the catchment may occur more frequently in winter. Extreme values may change significantly, although average precipitation behaviour
Dow
nloa
ded
by [
Mar
shal
l Uni
vers
ity]
at 1
3:29
16
Aug
ust 2
013
572 Andrâs Bârdossy & Jan M. C. van Mierlo
ABOVE 30-29-28-27 -26-25-24-22-
21 -20-
19-18-17-16-
15-BELOW
31 31
30 29 28 27
26 25 24
22 21
20 19 18 17
16 15
ABOVE 30-29-28-27-26-25-24-
22-21 -
20-19-18-17-16-15-
BELOW
31 31 30 29 28 27
26 25 24 22
21 20 19 18 17 16 15
(b)
(d)
Fig. 10 Spatial distribution of daily mean precipitation in the Aller catchment (1/10 mm): (a) observed (1963-1983), (b) simulated validation (1984-1993), (c) simulated 1 x C02 (1987-2016) and (d) simulated 2 x C02 (1990-2031).
may change only slightly. The simulated time series based on the T42-scenario 2 x C 0 2 shows an average temperature increase of 0.8-1.1°C depending on the location in the catchment. The annual variability of 700 hPa geopotential heights is not well reproduced in the GCM. Winter elevations are too high and summer ones too low. Thus there are problems with the simulation of temperature time series, especially in winter.
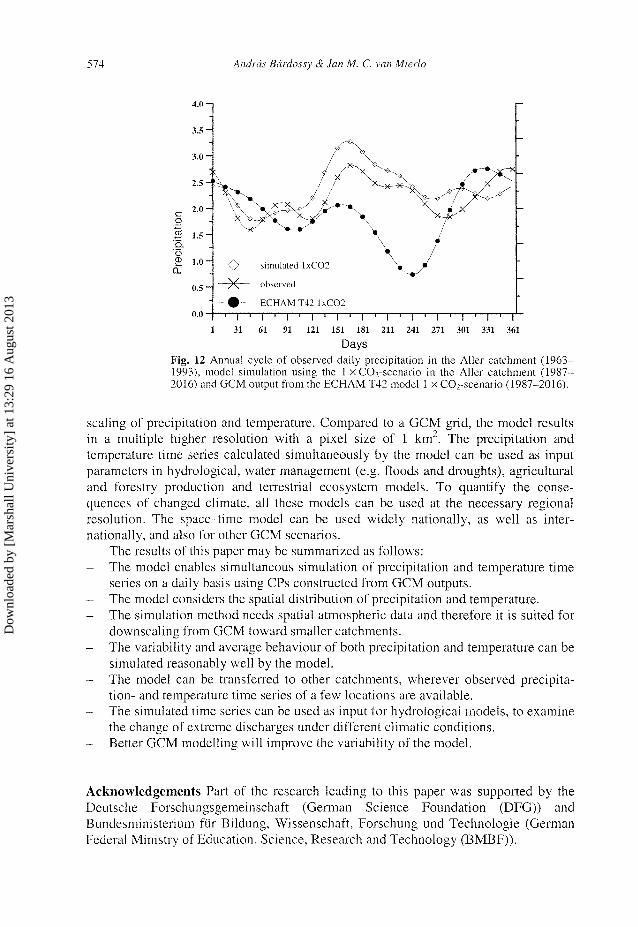
Finally, Fig. 12 shows the average annual cycle of precipitation in the Aller catchment from 1963 to 1993 (observed) along with the direct GCM output of the ECHAM T42 model for the 1 x C0 2 scenario and the simulated cycle derived by the space-time model. The model's simulated annual cycle fits the observed cycle more closely than that of ECHAM T42. The squared difference between observed and downscaled precipitation is 52.9, whilst it is 110.2 between the observed and direct values estimated by ECHAM T42.
Dow
nloa
ded
by [
Mar
shal
l Uni
vers
ity]
at 1
3:29
16
Aug
ust 2
013
Regional precipitation and temperature scenarios for climate change 573
(a)
A. ABOVE
95-93-9 1 -
88-86-84-
82-80-78-76-74-
71 -69-67-65-
BELOW
97 97
95 93 91 88 86 84 82 80 78 76 74 71
69 67
65
i
WE
ABOVE 95-93-91 -88-86-84-
82-80-78-
76-74-71 -
69-67-
65-BELOW
97 97 95 93 91
88 86 84
82 80 78 76 74 71
69 67
65
(b)
mrf
T^V-
(d)
Fig. 11 Spatial distribution of daily mean temperature in the Aller catchment (1/10°C): (a) observed (1946-1983), (b) simulated validation (1984-1993), (c) simulated 1 x C02 (1987-2016) and (d) simulated 2 X C02 (1990-2031).
CONCLUDING REMARKS
A space-time model has been developed for simultaneous regional precipitation and temperature simulation using a classification of spatial atmospheric circulation patterns (CP) on a daily basis. The model is based on coupled multivariate stochastic processes between CPs and measured regional precipitation and temperature in a catchment. Using CPs from GCM outputs, precipitation and temperature time series can be generated.
The precipitation and temperature time series in a small catchment simulated by the downscaling model, yield more realistic results than the present GCM output. The coupling model "CP-precipitation-temperature" is suitable for disaggregated down-
Dow
nloa
ded
by [
Mar
shal
l Uni
vers
ity]
at 1
3:29
16
Aug
ust 2
013
Andrâs Bârdossy & Jan M. C. van Mierlo
3 . 0 -
B 1.5-'ÇL o £ 1.0 H
Q.
0.0-
— simulated lxC02
-^— observed
- # — ECHAMT42 lxC02
31 61 91 ~~r
121 181 I
271 I ' I '~~T
301 331 361
Days Fig. 12 Annual cycle of observed daily precipitation in the Aller catchment (1963-1993), model simulation using the 1 x C02-scenario in the Aller catchment (1987-2016) and GCM output from the ECHAM T42 model 1 x CO rscenario (1987-2016).
scaling of precipitation and temperature. Compared to a GCM grid, the model results in a multiple higher resolution with a pixel size of 1 km2. The precipitation and temperature time series calculated simultaneously by the model can be used as input parameters in hydrological, water management (e.g. floods and droughts), agricultural and forestry production and terrestrial ecosystem models. To quantify the consequences of changed climate, all these models can be used at the necessary regional resolution. The space-time model can be used widely nationally, as well as internationally, and also for other GCM scenarios.
The results of this paper may be summarized as follows: - The model enables simultaneous simulation of precipitation and temperature time
series on a daily basis using CPs constructed from GCM outputs. - The model considers the spatial distribution of precipitation and temperature. - The simulation method needs spatial atmospheric data and therefore it is suited for
downscaling from GCM toward smaller catchments. - The variability and average behaviour of both precipitation and temperature can be
simulated reasonably well by the model. - The model can be transferred to other catchments, wherever observed precipita
tion- and temperature time series of a few locations are available. - The simulated time series can be used as input for hydrological models, to examine
the change of extreme discharges under different climatic conditions. - Better GCM modelling will improve the variability of the model.
Acknowledgements Part of the research leading to this paper was supported by the Deutsche Forschungsgemeinschaft (German Science Foundation (DFG)) and Bundesministerium fur Bildung, Wissenschaft, Forschung und Technologie (German Federal Ministry of Education, Science, Research and Technology (BMBF)).
Dow
nloa
ded
by [
Mar
shal
l Uni
vers
ity]
at 1
3:29
16
Aug
ust 2
013

Regional precipitation and temperature scenarios for climate change 575
REFERENCES
Bârdossy, A. & Caspary, H. (1990) Detection of climate change in Europe by analyzing European circulation patterns from 1881 to 1989. Theoret. Appl. Climatol. 42, 155-167.
Bârdossy, A. & Plate, E. J. (1992) Space-time model of daily rainfall using atmospheric circulation patterns. Wat. Resour. Res. 28(5), 1247-1259.
Bârdossy, A., Duckstein, L. & Bogardi, I. (1993) Combination of fuzzy numbers representing expert opinions. Fuzzy Sets and Systems 57(2), 173-181.
Burger, K. (1958) Zur Klimatologie der Grosswetterlagen. Ber. Deutschen Wetterdienstes 45(6), Offenbach a. Main, Germany.
Lamb, H. H. (1972) British Isles weather types and a register of daily sequence of circulation patterns, 1861-1971. Geophys. Mem., no. 110, Meteorol. Office, London, UK.
Lamb, H. H. (1977) Climate, Present, Past and Future, vol. 2: Climatic History and the Future. Methuen, London, UK. Matheron, G. (1973) The intrinsic random functions and their applications. Adv. Appl. Prob. 5, 439^168. Shrestha, B. P. (1995) Downscaling precipitation and temperature under climate change over semi-arid regions of
southwestern USA. Unpublished dissertation, Department of Systems and Industrial Engineering, The University of Arizona, Tucson, USA.
Simmons, A. J. & Bengtsson, L. (1988) Atmospheric general circulation models: the design and use for climate studies. In: Physically-Based Modelling and Simulation of Climate and Climatic Change, vol. II, NATO ASI series E, vol. 254, (ed. by M. Schlesinger), 627-652, Kluwer Academic, Dordrecht, The Netherlands.
Trenberth, K. E. (1990) Recent observed interdecadal climate changes in the Northern Hemisphere. Bull. Am. Met. Soc. 71, 988-993.
Zadeh, L. A. (1965) Probability measures of fuzzy events. J. Math. Analyl. Applicat. 23, 421^27 .
Received 6 April 1999; accepted 28 February 2000
Dow
nloa
ded
by [
Mar
shal
l Uni
vers
ity]
at 1
3:29
16
Aug
ust 2
013