regional groundwater modelling of the cambrian … groundwater modelling of the cambrian limestone...
TRANSCRIPT

Regional Groundwater Modelling
of the Cambrian Limestone Aquifer System
of the Wiso Basin, Georgina Basin and Daly Basin
Report No.: 29/2006A
Anthony Knapton
Land and Water Division
Alice Springs

Groundwater Modelling of the Tindall Limestone
Date printed: 30 July 2008 Status: FINAL Department of Natural Resources, Environment and The Arts Date Last Modified: 30 July 2008 Page i
Department of Natural Resources, Environment & The Arts
Technical Report No. 29/2006A
Regional Groundwater Modelling of the Cambrian Limestone Aquifer System
of the Wiso Basin, Georgina Basin and Daly Basin
A report prepared by NRETA Land and Water Division
Author: Anthony Knapton
Department of Natural Resources, Environment & The Arts, Alice Springs

Groundwater Modelling of the Tindall Limestone
Date printed: 30 July 2008 Status: FINAL Department of Natural Resources, Environment and The Arts Date Last Modified: 30 July 2008 Page ii
Department of Natural Resources, Environment & The Arts
Technical Report No. 29/2006A
Copyright
© 2006 Northern Territory Government Copyright resides with the Northern Territory Government, 2006. Information contained in this publication may be copied or reproduced for study, research, information, or educational purposes, subject to inclusion of an acknowledgment of the source.
Cover Image: Looking downstream along the Katherine River at Galloping Jacks.

Groundwater Modelling of the Tindall Limestone
Date printed: 30 July 2008 Status: FINAL Department of Natural Resources, Environment and The Arts Date Last Modified: 30 July 2008 Page iii
Executive Summary Background
The Cambrian Limestone aquifer system is the major aquifer in the Wiso, Georgina and Daly
Basins. It represents the source of the majority of the baseflow in the Katherine, Roper, Flora and
Douglas Rivers.
The impending development of nearby horticultural districts reliant on water from the Tidal
Limestone aquifer of the Daly Basin, represent a threat to the environmental flow regime of the
rivers particularly in low flow periods.
This report documents an ambitious attempt at modelling the entire Cambrian Limestone Aquifer
System, with an emphasis on the area surrounding Katherine.
Conceptual Model of the Tindall Limestone
The conceptual model was developed by the Water Resources section of NRETA from the
available groundwater and surface water data and observations. It can be summarized as:
• The Limestone aquifer may be represented as a single unconfined layer.
• Mapped occurrence of the Jinduckin Formation confines the Limestone aquifer and is expected
to have lower transmissivities and storage coefficient than the unconfined Limestone aquifer.
• The limestone aquifer was expected to have greatest permeability within the weathered zone,
confined to the upper 150 metres from the surface. For the purposes of this exercise the
aquifer was considered to have a constant thickness below the groundwater table. That is a
single layer of variable transmissivity was used instead of varying hydraulic conductivity and
aquifer thickness. This is considered valid as the variations in the groundwater level are
considered small compared to the saturated thickness of the Aquifer.
• Aquifer transmissivity of 5,000 m2/d based on the Water Studies modelling results.
• A single estimate of transmissivity in the Venn region indicate that lower values (around
2000 m2/d) may be applicable in this area.
• The confined regions of the Aquifer were assigned a single value of 100 m3/d/m.
• The unconfined aquifer storage coefficient was 0.04. This is considered a reasonable estimate
as previous experience (Jolly, pers comm.) indicates that this value should be between 0.01
and 0.07.
• Confined aquifer storage coefficient was assigned 0.0001 based on typical confined aquifer
storage coefficients.

Groundwater Modelling of the Tindall Limestone
Date printed: 30 July 2008 Status: FINAL Department of Natural Resources, Environment and The Arts Date Last Modified: 30 July 2008 Page iv
• The dominant recharge mechanism is via sinkholes, however, this is not well understood, so
the recharge was estimated as diffuse recharge.
• The main influence of the Cretaceous sediments is to reduce the recharge to the Tindall
Limestone aquifer. This is based on the subdued response of hydrographs for bores located in
areas with the Cretaceous cover (eg RN22006).
• Initial estimates of the steady state annual recharge over the two areas were 150 mm/yr
(0.41 mm/d) for the outcropping limestone and 40 mm/yr (0.11 mm/d) for the Cretaceous cover.
• Based on the steady state recharge estimates the potential recharge model developed using
the Katherine rainfall record (Jolly et al, 2000) was scaled to provide transient recharge values.
The recharge model estimates the soil moisture deficit and daily evapotranspiration to derive
the potential recharge due to deep drainage.
• Recharge occurs from the Katherine River when stage height > groundwater level.
• The dominant discharge from the aquifer is through the streambed and via springs. Discharge
occurs along the length of the Katherine River where it intersects the Aquifer.
• Over the long term the late dry season discharge to the river via spring flows range from 1 to 2
cumecs, with an average discharge rate of 1.33 cumecs, with approximately 17% or
0.23 cumecs discharging downstream of the low level weir.
• The Cretaceous rocks in the King River area where they overlie impermeable basement rocks
act as a constant flux boundary, which, during transient conditions with no stresses manifest as
a relatively constant head.
• Evapotranspiration from the riparian zone is estimated at approximately 3 mm/day. The ET
has not been explicitly considered in this model. Based on the ET value a riparian zone width
of approximately 200 metres and a length 12 kilometres of river the total ET is 720 m3/d.
Model Calibration Results
Based on the conceptual model developed, calibration of both the steady state model and the
transient model to the observation data was possible. Relatively good fits were obtained for both
the head and discharge data available.
Conclusions
Initial modeling of the Aquifer indicates that the conceptual model is largely valid:
• Initial modeling of the Limestone Aquifer indicates that the conceptual model is largely
valid, however;
• The mapped occurrence of the Limestone Aquifer in the area of the Flora River has been
identified as being incorrect. Initial re-examination of the geological information in the area

Groundwater Modelling of the Tindall Limestone
Date printed: 30 July 2008 Status: FINAL Department of Natural Resources, Environment and The Arts Date Last Modified: 30 July 2008 Page v
indicates that the mapped geology used in the modelling is incorrect this issue will be
resolved by re-examining the mapped geology in the area and with future investigation
drilling.
• The regional model has been developed to the level that provides the boundary conditions
for the more detailed modelling in the Katherine study area.
• The recharge distribution and the proportionate values proposed within this report are
indicated to be plausible. Improved definition of rainfall distribution over the basin will
enable refinement of this aspect of the model.
• The Cretaceous rocks in the King River area where they overlie impermeable basement
rocks act as a constant flux boundary, which, during transient conditions with no stresses
manifest as a relatively constant head.
• The modelling of the development Scenario A indicate the primary effect of groundwater
extraction in the Katherine area is to reduce flows in the Katherine River (refer Table 3).

Groundwater Modelling of the Tindall Limestone
Date printed: 30 July 2008 Status: FINAL Department of Natural Resources, Environment and The Arts Date Last Modified: 30 July 2008 Page vi
Contents
Executive Summary ........................................................................................................................... iii 1 Introduction ................................................................................................................................11
1.1 Background ........................................................................................................................11 1.2 Objectives...........................................................................................................................11 1.3 Model Steps........................................................................................................................11 1.4 Location..............................................................................................................................12 1.5 Climate ...............................................................................................................................14 1.6 Geomorphology..................................................................................................................15
1.6.1 Topography ................................................................................................................15 1.7 Previous Modelling ............................................................................................................16
2 Hydrogeological Setting and Conceptual Model .......................................................................18 2.1 Regional Geology...............................................................................................................18
2.1.1 Cretaceous Rocks of the Dunmarra Basin..................................................................18 2.1.2 Oolloo Dolostone .......................................................................................................18 2.1.3 Jinduckin Formation and Anthony Lagoon Beds.......................................................19 2.1.4 Tindall Limestone, Gum Ridge Formation and Montejinni Limestone.....................19 2.1.5 Antrim Plateau Volcanics...........................................................................................20 2.1.6 Groundwater Flow......................................................................................................21 2.1.7 Discharge from the Cambrian Aquifer System..........................................................22
2.2 Study Area Hydrogeology..................................................................................................23 2.2.1 Limestone Aquifer Saturated Thickness ....................................................................23 2.2.2 Hydraulics of the Cretaceous Sediments in the Area of the King River....................24 2.2.3 Groundwater Flow......................................................................................................24 2.2.4 Groundwater Discharge..............................................................................................24
2.3 Study Area Observation Data.............................................................................................25 2.3.1 Rainfall and Potential Recharge.................................................................................25 2.3.2 Observation Bores ......................................................................................................25 2.3.3 Groundwater Level Hydrographs...............................................................................26 2.3.4 Potentiometric Head Distribution...............................................................................27 2.3.5 River Stage Height Data.............................................................................................28 2.3.6 River Gauging Data....................................................................................................29
2.4 Conceptual Model ..............................................................................................................32 3 Model Development ...................................................................................................................34
3.1 Model Specifications..........................................................................................................34 3.1.1 Numerical Model Code ..............................................................................................34 3.1.2 Spatial Discretisation..................................................................................................35
3.2 Layers .................................................................................................................................36 3.3 Boundary Conditions..........................................................................................................36
3.3.1 Recharge (Specified Flux at the Model Surface) .......................................................37 3.3.2 Transfer (Cauchy) Boundary......................................................................................37 3.3.3 Well Boundary Conditions.........................................................................................38
3.4 Hydraulic Parameters .........................................................................................................38 3.4.1 Transmissivity Distribution........................................................................................39 3.4.2 Recharge Distribution ................................................................................................40
4 Steady State Model Development ..............................................................................................42 4.1 Steady State Model Calibration..........................................................................................42 4.2 Steady State Calibration Results ........................................................................................43
4.2.1 Calibrated Water Levels.............................................................................................43 4.2.2 Steady State Water Budget.........................................................................................44

Groundwater Modelling of the Tindall Limestone
Date printed: 30 July 2008 Status: FINAL Department of Natural Resources, Environment and The Arts Date Last Modified: 30 July 2008 Page vii
5 Transient Model Development...................................................................................................45 5.1 Model Specifications..........................................................................................................45 5.2 Boundary Conditions..........................................................................................................45
5.2.1 Recharge (Specified Flux)..........................................................................................46 5.2.2 Transfer (Cauchy) Boundary......................................................................................46 5.2.3 Well Boundary Conditions.........................................................................................46
5.3 Transient Model Development...........................................................................................46 5.3.1 Temporal Discretisation .............................................................................................46
5.4 Transient Model Calibration ..............................................................................................47 5.5 Calibrated Model Results ...................................................................................................47
5.5.1 Groundwater Level Hydrographs...............................................................................47 5.5.2 Groundwater Discharge Hydrographs........................................................................49
6 Discussion ..................................................................................................................................50 6.1 Introduction ........................................................................................................................50
6.1.1 Surface-water / Groundwater Interaction Considerations..........................................50 6.2 Development Scenarios......................................................................................................51
6.2.1 Scenario with No Pumping ........................................................................................51 6.2.2 Effect of Pumping Proximity on Groundwater Discharge to River ...........................52 6.2.3 Effects of Current (2004) Licensed Entitlements on Groundwater Discharge to the Katherine River ..........................................................................................................................53 6.2.4 Steady State Analysis Scenario “A” Current - (2004) Pumping................................53 6.2.5 Transient Analysis of Scenario “A” – 2004 (Current) Pumping................................55
6.3 Bore Capture Zones............................................................................................................55 7 Conclusions ................................................................................................................................58 8 Recommendations ......................................................................................................................59 9 References ..................................................................................................................................60

Groundwater Modelling of the Tindall Limestone
Date printed: 30 July 2008 Status: FINAL Department of Natural Resources, Environment and The Arts Date Last Modified: 30 July 2008 Page viii
List of Figures
Figure 1 Location and extent of the model domain. .....................................................................13 Figure 2 Variation in the average annual rainfall across the model domain. ...............................14 Figure 3 3sec (90 metre) Shuttle Radar Topographic Model of the model domain showing
drainage. .........................................................................................................................16 Figure 4 Regional surface geology and the locations of Tindall Limestone Aquifer discharge
zones. ..............................................................................................................................21 Figure 5 Groundwater flow and average late dry season discharge from the Tindall Limestone.
........................................................................................................................................22 Figure 6 Groundwater / surface water interactions indicating the bank storage effects during a)
dry season and b) wet season. ........................................................................................24 Figure 7 Relationship between rainfall at Katherine and potential recharge modified from Jolly,
(2000). ............................................................................................................................25 Figure 8 Location of observation bores and bores used to calibrate the model. Hydrographs of
selected bores indicate the effect of the Cretaceous sediments......................................26 Figure 9 Typical hydrographs across the study area. Green traces indicate bores located where
the Limestone Aquifer is overlain by Cretaceous sediments, Blue traces indicate bores where minimal cover exists over the Limestone Aquifer...............................................27
Figure 10 Groundwater level contours, November 2003. ..............................................................28 Figure 11 Katherine Railway Bridge stage height data (G8140001)..............................................29 Figure 12 Current Gauging Station Locations along the Katherine River .....................................30 Figure 13 Gauged flows (cumecs) in the Katherine River at the Railway Bridge (G8140001) and
the total estimated groundwater discharge to the Katherine River from the aquifer at Galloping Jacks (G8140301)..........................................................................................31
Figure 14 Gauged flows at Seventeen Mile Creek (G8140159), indicating flows in the Katherine River not due to discharge from the Limestone Aquifer................................................31
Figure 15 Model mesh geometry showing region of mesh refinement in the study area...............36 Figure 16 Transfer boundary conceptualization for a losing stream (Diersch, 2004). ...................37 Figure 17 Distribution of transmissivity across the study area based on the mapped occurrence of
the Limestone Aquifer. Region of greater than expected transmissivity in the Flora River identified...............................................................................................................40
Figure 18 Recharge zones, higher recharge rates associated with the outcropping Limestone Aquifer, lower recharge rate in areas where Cretaceous cover exists and no recharge where the Jinduckin exists..............................................................................................41
Figure 19 Steady state water levels for calibrated model. ..............................................................43 Figure 20 Study area location, based on Puhalovich, (2005) TLA model extents. ........................45 Figure 21 Comparison of modelled heads vs observed heads for RN007821. The response from
the calibrated model is in blue........................................................................................47 Figure 22 Comparison of modelled heads vs observed heads for RN022006. The response from
the calibrated model is in blue........................................................................................47 Figure 23 Comparison of modelled heads vs observed heads for RN022397. The response from
the calibrated model is in blue........................................................................................48 Figure 24 Comparison of modelled heads vs observed heads for RN23427. The response from
the calibrated model is in blue........................................................................................48 Figure 25 Comparison of modelled heads vs observed heads for RN29429. The response from
the calibrated model is in blue........................................................................................48 Figure 26 Comparison of modelled discharge vs observed discharge along the Katherine River. 49 Figure 27 In a schematic hydrologic setting where ground water discharges to a stream under
natural conditions (a), placement of a well pumping at a rate (Q1) near the stream will intercept part of the ground water that would have discharged to the stream (b). If the

Groundwater Modelling of the Tindall Limestone
Date printed: 30 July 2008 Status: FINAL Department of Natural Resources, Environment and The Arts Date Last Modified: 30 July 2008 Page ix
well is pumped at an even greater rate (Q2), it can intercept additional water that would have discharged to the stream in the vicinity of the well and can draw water from the stream to the well (c). .....................................................................................................51
Figure 28 Effects of pumping distance on groundwater discharge to the Katherine River............52 Figure 29 Production bore locations for Scenario “B” ...................................................................53 Figure 29 Comparison of the steady state water balance components for no pumping and
Scenario “A”...................................................................................................................54 Figure 31 Reduction in the dry season flows in the Katherine River due to extraction based on
pumping scenario “A”. ...................................................................................................55 Figure 32 Particle tracking isochrones, NTG and Commonwealth land holdings are identified for
comparison. ....................................................................................................................57

Groundwater Modelling of the Tindall Limestone
Date printed: 30 July 2008 Status: FINAL Department of Natural Resources, Environment and The Arts Date Last Modified: 30 July 2008 Page x
List of Tables
Table 1 Discharge areas of the Tindall Limestone Aquifer and estimated end of dry average discharge rates and associated elevation of the river along the discharge zone.............23
Table 2 Steady state water balance for the calibrated model with no pumping. .........................44 Table 3 Steady state water balance for the calibrated model with no pumping and with pumping
using Scenario “A”.........................................................................................................54

Groundwater Modelling of the Tindall Limestone
Date printed 30 July 2008 Status: FINAL Department of Natural Resources, Environment and The Arts Date Last Modified: 30 July 2008 Page 11
1 Introduction
1.1 Background
The Cambrian Limestone aquifer system is the major aquifer in the Wiso, Georgina and Daly
Basins. It represents the source of the majority of the baseflow in the Katherine, Roper, Flora and
Douglas Rivers.
Proposed development in nearby horticultural districts reliant on water from the Tindall Limestone
aquifer, represent a threat to the environmental flow regime of the river particularly in low flow
periods.
This report documents an ambitious attempt at modelling the entire Cambrian Limestone aquifer
system within the Northern Territory, with an emphasis on the area surrounding Katherine.
1.2 Objectives
The objectives of this study were to:
• Develop a regional steady state model that will provide a framework for the development of a
regional transient groundwater model for the whole of the Cambrian Limestone Aquifer System.
• Extend the steady state model to incorporate transient conditions in the area of interest
identified by Puhalovich, (2005). The regional steady state model will provide the boundary
conditions for the detailed transient model.
• Provide a basis for the assessment of development with respect to pumping scenarios and the
effects on the dry season flows in the Katherine River ie during periods when base flows are
lowest
A groundwater model has been developed based on the conceptual hydrogeological model
proposed by Water Studies, (2001) and Puhalovich, (2005).
This work has provided affirmation of a viable hydrogeological model and a tool to be applied
under various development scenarios to assess impacts on groundwater levels and spring flows.
This report presents the model’s basis for development and identifies areas in which data
deficiencies exist.
1.3 Model Steps
The groundwater model was developed using the following steps:
1) Conceptual model development;
2) Numerical model implementation;

Groundwater Modelling of the Tindall Limestone
Date printed 30 July 2008 Status: FINAL Department of Natural Resources, Environment and The Arts Date Last Modified: 30 July 2008 Page 12
3) Development of a regional steady state model;
4) Calibration of the regional steady state model;
5) Extension of the calibrated steady state model to the transient domain in the Katherine region
of the study area;
6) Calibration of the transient model to the hydrologic data from 1994 to 2004 including
rainfall/recharge data, water levels hydrographs, stream flow data and pumping data;
7) Sensitivity analysis of the calibrated model to determine what are the key assumptions which
have a significant impact on the model;
8) Prediction of effects of various pumping scenarios on the Katherine River discharge for the flow
record from July 1963 to June 2004.
1.4 Location
The study area for the groundwater modelling comprises the full extent of the Cambrian Limestone
in the Daly Basin, the northern Wiso Basin and the northern Georgina Basin (Figure 1). The
Cambrian Limestone aquifer covers an area of greater than 159,000 km2 and is bounded
approximately by the latitudes -13.41°S and -20.48°S and the longitudes 130.72°E and 137.74°E.
In the Daly Basin the Cambrian Limestone is termed the Tindall Limestone Aquifer and provides
dry season baseflow to the Katherine, Edith, Flora, Douglas, Ferguson, and Daly Rivers.
The study area is located in the vicinity of Katherine and is predominantly located within the
catchment of the Daly Basin.

Groundwater Modelling of the Tindall Limestone
Date printed 30 July 2008 Status: FINAL Department of Natural Resources, Environment and The Arts Date Last Modified: 30 July 2008 Page 13
"
"
"
Arafura Sea
Wiso Basin
Georgina Basin
Dunmarra Basin
Daly Basin
DAL Y RIVER
VICTORIA RIVER
ROBI
NSO
N R
IVE
R
MANN RIV
ER
MAR
Y R
IVER
CAL
VE
RT RIVER
KATHERINE R
IVER
SANDOVER RIVER
DRY
RIVE
R
H
ANSON RIVER
EAST ALLIGATOR RIVER
KING
RIV
ER
WICKHAM RIVER
COX RIVER
MAINORU RIVER
REYNOLDS RIVER
FOE
LSC
HE
RIV
ER
ADELAIDE RIVER
MCA
R
THUR RIVER
TOWNS RIVER
WALKER RIVER
CATO RIVERWOOLEN RIVER
ARMSTRONG RIVER
ROPER RIVER
WILDMAN RIVER
FISH R
IVE
R
BUNDEY RIV
ER
ARNO
LD R
IVER
FINNISS RIVER
GO
SSE
RIVE
R
JAM
ES R
IVER
NATH
AN R
IVER
GLY
DE
RIV
ER
MOYLE RIVER
TOMKINSON
RIVE
R
FREW RIVER
ELKEDRA RIVER
CU
LLE
N R
IVE
R
HOW
ARD RIVER
GLYD
E RIVER
DARWIN
KATHERINE
TENNANT CREEK
130°0'0"E
130°0'0"E
135°0'0"E
135°0'0"E
20°0
'0"S
20°0
'0"S
15°0
'0"S
15°0
'0"S
" Town
Major Drainage
Major Road
Model Extent
NT Coastline
Arafura Sea
0 50 100 150 200 25025Kilometres
Geological RegionsOther Regions
Daly Basin
Dunmarra Basin
Georgina Basin
Wiso Basin²
Figure 1 Location and extent of the model domain.

Groundwater Modelling of the Tindall Limestone
Date printed 30 July 2008 Status: FINAL Department of Natural Resources, Environment and The Arts Date Last Modified: 30 July 2008 Page 14
1.5 Climate
The study area falls within the wet-dry tropics in the northwest and semi-arid to the southeast. In
the wet-dry tropics there are two distinct seasons, the wet season from December to April and the
dry season spans the remainder of the year. Annual rainfall increases to the northwest from an
average of 980 mm at Katherine (119 yrs of record) to 1,156 mm at Oolloo Crossing (44 yrs of
record) and 1,328 mm at Adelaide River (66 yrs of record). The variation in annual rainfall across
the whole model domain is presented in Figure 2.
"
"
300 - 400
400 - 500
600 - 700
500 - 600
700 - 800
800 - 900
1000 - 1100
1100 - 1200
900 - 1000KATHERINE
TENNANT CREEK
0 50 100 150 200 25025Kilometres
²
Median Rainfall (mm)100101 - 200201 - 300301 - 400401 - 500501 - 600601 - 700701 - 800801 - 900901 - 10001001 - 11001101 - 12001201 - 14001401 - 1500
Figure 2 Variation in the average annual rainfall across the model domain.
Analysis of rainfall vs recharge indicates that minimum rainfall of approximately 700 mm/yr is
required before appreciable annual recharge (Jolly et al., 2000).

Groundwater Modelling of the Tindall Limestone
Date printed 30 July 2008 Status: FINAL Department of Natural Resources, Environment and The Arts Date Last Modified: 30 July 2008 Page 15
1.6 Geomorphology
The major drainage within the study area shows a rectangular drainage pattern, where both the
main stream and its tributaries exhibit right-angle bends, indicating that geological structures (ie
faulting and jointing) have strongly influenced the development of the drainage, especially where
the drainage incises the Tindall Limestone. The Daly River is orientated sub-parallel to the strike
of the Daly Basin. The ephemeral drainage shows a more dendritic pattern.
1.6.1 Topography
The study area varies in topography from approximately 30 to 300 metres above Australian Height
Datum (Figure 3). The low lying areas are along the main drainage, and the highest topography is
located in the central Wiso and Georgina Basin. Topography is relatively rugged on the dissected
flanks of the plateaux, where steep gullies have been incised into the soft Cretaceous rocks. In
contrast the areas where the Tindall Limestone is exposed have low undulating karstic topography
with generally sparse outcrop.

Groundwater Modelling of the Tindall Limestone
Date printed 30 July 2008 Status: FINAL Department of Natural Resources, Environment and The Arts Date Last Modified: 30 July 2008 Page 16
Bulman
Ngukurr
KATHERINE
Mataranka
Roper Bar
Daly Waters
TENNANT CREEK
Adelaide River
0 60 120 180 240 30030Kilometres
TownRoadHighwayCreekRiverArafura SeaModel ExtentNT Boundary
Elevation (mAHD)High : 500 Low : 0
²
Figure 3 3sec (90 metre) Shuttle Radar Topographic Model of the model domain showing drainage.
1.7 Previous Modelling
Documented groundwater models of the Tindall Limestone in the Katherine area have been
developed by Water Studies, (2001) and Puhalovich, (2005). Some of the salient components of
these models are discussed below:
Water Studies developed a detailed model centred on the Katherine River where the occurrence of
the Tindall Limestone was within the Daly River surface water catchment. The objective of the
model was to determine the effects of pumping in the Venn Horticultural sub-division on
groundwater levels and flows in the Katherine River.

Groundwater Modelling of the Tindall Limestone
Date printed 30 July 2008 Status: FINAL Department of Natural Resources, Environment and The Arts Date Last Modified: 30 July 2008 Page 17
Puhalovich, (2005) developed a model based on the work of Water Studies, (2001). The model
was extended to the south east to include the groundwater divide between the Katherine and
Roper River and the discharge zones at the Roper River. It incorporated the contribution to the
Tindall aquifer from the inflows from the Cretaceous aquifers in the vicinity of the head waters of
the King River using a General Head Boundary condition.
• Groundwater levels in monitoring bores in the Venn Horticultural area and the Cretaceous
rocks in the King River area were derived from incorrect surface RL values, this resulted in
data which could not be adequately calibrated against.
• Calibration of water levels to very wet years using discharge estimates from average years.
Calibration was conducted using 2001 water levels and average groundwater flows.
Hydrograph data and flows in the Katherine River during this period are well above the
average (approx. 2.5 cumecs compared with an estimated 1.33 cumecs for an average
year).
• The input from the Cretaceous rocks to the east of the Venn Horticultural area has been
simulated using a general head boundary. However, when examining the components of
the water budget for the model it can be seen that the extraction due to pumping is not
reflected by a reduction in the discharge to the Katherine River. It is inferred that the
shortfall in the water balance is due to water being supplied to the model at the general
head boundary. It is suggested that the Cretaceous rocks act as a constant flux boundary
ie controlled by recharge to the Cretaceous rocks, which, would still manifest as a relatively
constant head in this region.

Groundwater Modelling of the Tindall Limestone
Date printed 30 July 2008 Status: FINAL Department of Natural Resources, Environment and The Arts Date Last Modified: 30 July 2008 Page 18
2 Hydrogeological Setting and Conceptual Model
2.1 Regional Geology
The major hydrogeological features of the region are the Cambrian-Ordovician Daly Basin , Wiso
Basin and Georgina Basin. Early Cretaceous rocks of the Dunmarra Basin overlie much of the
region and obscures the contact between the basins.
The surface geology of the Daly Basin is depicted in Figure 4. The major unit of interest in the
study area is the, Tindall Limestone, which, is the lower unit of the Daly River Group and the major
aquifer with respect to base flows in the Roper, Flora, Katherine, Douglas and Daly Rivers.
2.1.1 Cretaceous Rocks of the Dunmarra Basin
The Cretaceous aged Mullaman Beds of the Dunmarra Basin forms a mantle of lateritised
claystone and sandstone covering approximately 50% of the study area. The beds are sub-
horizontal and may be divided into an upper cream coloured claystone and siltstone unit and a
basal marine sandstone unit.
Outcrop is generally sparse due to the soft nature of the rock but in places silicification has altered
them to porcellanite and quartzite which outcrop reasonably well. The thickest accumulations in
the Daly Basin are preserved along its axis, running from the north side of the King River, through
Florina Station and then following the north east side of the Daly River as far as Stray Creek
(Tickell, 2002).
The Mullaman Beds are thickest on the Sturt Plateau in the Dry River area and across the
southern map area parallel to the Buchanan Highway, the formation may be up to 75 metres thick
with the clayey upper unit comprising 60m of its thickness. The thickness of the sandy unit is
variable and ranges from less than 5 metres thick, up to 25 metres thick in parts of the central
plateau area. The sandstone is generally friable, however, siliceous outcrops of the unit are
located in the vicinity of Gorrie Station. Where the upper claystone is thin and eroded, the potential
recharge to the underlying limestone aquifer is increased. In all places, the Mullaman Beds are
above the regional water level.
The main influence of the Cretaceous sediments is to reduce the recharge to the Tindall Limestone
aquifer. This assertion is based on the lithology of the unit, which is predominantly clay/clayey
sand and the subdued response of groundwater hydrographs for the bores located in areas with
Cretaceous cover (eg RN022006 - Figure 8 and Figure 9).
2.1.2 Oolloo Dolostone
The Oolloo Dolostone is the uppermost formation in the Cambrian-Ordovician Daly Basin, a largely
undeformed sequence of shallow water carbonate rocks. Outcrop is generally poor due to the

Groundwater Modelling of the Tindall Limestone
Date printed 30 July 2008 Status: FINAL Department of Natural Resources, Environment and The Arts Date Last Modified: 30 July 2008 Page 19
extensive cover of Cretaceous rocks. The main exposures occur at the northwestern and
southeastern ends of the Daly Basin (Tickell, 2002).
2.1.3 Jinduckin Formation and Anthony Lagoon Beds
The laterally equivalent formations of the Jinduckin Formation and Anthony Lagoon Beds occur in
the Wiso Basin, Daly Basin and Georgina Basins respectively.
The Jinduckin Formation overlies the Tindall Limestone and Montejinni Limestone and the Anthony
Lagoon Beds overlie the Gum Ridge Formation. They are mainly of dolomitic siltstone, interbeds of
dolomitic sandstone-siltstone and dolostone. The Jinduckin Formation has eroded off over most of
the Sturt Plateau and only exists in the Daly Basin and in the north of the Wiso Basin, where it is
overlain by Mullaman Beds. Similarly, a partial section of the Anthony Lagoon Beds is seen in the
Larrimah area where highly weathered remnants may be detected in gamma logs. The formation
continues to thicken towards the south-east into the Georgina Basin where approximately 60m of
its lower section may be identified in bore RN27958 east of Dunmarra.
These formations overlie and confine the major limestone aquifers of the region. Where they exist
below the water table, they may host viable aquifers, however, are generally of low permeability
and yield. Dissolution of evaporite beds within these formations result in water with significant
levels of sulphate and sodium chloride salts.
2.1.4 Tindall Limestone, Gum Ridge Formation and Montejinni Limestone
The time equivalent Cambrian limestone formations – the Tindall Limestone, the Montejinni
Limestone and Gum Ridge Formations host the vast majority of the water resources in the region
and have many stratigraphic similarities.
The Tindall Limestone of the Daly Basin is a massive, thinly bedded, multi-coloured crystalline,
dolomitised limestone with some chert nodules and mudstone bands, particularly in the lower
layers. The Tindall Limestone becomes shaley to the northwest in the Douglas River area.
The Montejinni Limestone of the Wiso Basin consists of limestone, dolomitic limestone, dolomite
and calcareous mudstone and siltstone. In many parts of the basin, a threefold division has been
recognised with an upper and lower limestone unit each approximately 25 metres thick and an
intervening red/brown mudstone about 10 metres thick.
The Gum Ridge Formation of the Georgina Basin, although similarly sequenced to the Tindall
Limestone Formation, is generally described as consisting of limestone, fine grained sandstone
and siliclastic mudstone and nodular chert. The depositional environment of this formation has
resulted in a greater proportion of carbonate sediment.

Groundwater Modelling of the Tindall Limestone
Date printed 30 July 2008 Status: FINAL Department of Natural Resources, Environment and The Arts Date Last Modified: 30 July 2008 Page 20
For the purposes of this study, no hydrogeological distinction is made between each of the
formations as they represent a single, extensive aquifer system and are referred to generally in this
report as the ‘Limestone Aquifer’.
2.1.5 Antrim Plateau Volcanics
The early Cambrian Antrim Plateau Volcanics is generally a flat lying, dark grey/green coarse
grained tholeiitic basalt that underlies the Tindall Limestone, Montejinni Limestone and Gum Ridge
Formations and forms the hydrogeological basement. The overall thickness of the volcanics is in
the order of 150 metres. The Helen Springs Volcanics are also flat-lying tholeiitic basalts and are
correlatives of the Antrim Plateau Volcanics. These basalts exist beneath the great majority of the
Sturt Plateau but due to lack of outcrop and distinguishing features, it is not possible to determine
the location of the different basalt units.
The basement high creates division of groundwater flow to the Flora River and Roper River from
the Wiso Basin and Georgina Basin (refer Figure 5).

Groundwater Modelling of the Tindall Limestone
Date printed 30 July 2008 Status: FINAL Department of Natural Resources, Environment and The Arts Date Last Modified: 30 July 2008 Page 21
"
"
"
Daly River
Roper River
Katherine River
Douglas River
Flora River
Elsey Creek
Hayes Creek
KATHERINE
Mataranka
Daly Waters0 20 40 60 80 10010Kilometres
" TownMajor RoadCreekRiverDischarge Zones
CretaceousUpper Oolloo DolostoneLower Oolloo DolostoneJinduckin FormationTindall LimestoneAntrim Plateau VolcanicsUndifferentiated Proterozoic
²
Figure 4 Regional surface geology and the locations of Tindall Limestone Aquifer discharge zones.
2.1.6 Groundwater Flow
The basement high where the Antrim Plateau Volcanics occurs above the water table creates a
division of groundwater flow to the Flora River and Roper River from the Wiso Basin and Georgina
Basin.
Groundwater divide between the Katherine and Roper Rivers effectively separate the two regions.

Groundwater Modelling of the Tindall Limestone
Date printed 30 July 2008 Status: FINAL Department of Natural Resources, Environment and The Arts Date Last Modified: 30 July 2008 Page 22
"
"
"
Douglas River(1.0 cumecs)
Daly River(1.0 cumecs) Katherine River
(1.33 cumecs)
Flora River(2.3 cumecs)
Roper River(3.1 cumecs)
KATHERINE
Mataranka
Daly Waters
Flow Direction
[mAHD]5051 - 6061 - 7071 - 8081 - 9091 - 100101 - 110111 - 120121 - 130131 - 140141 - 150151 - 160161 - 170171 - 190
" TownsMajor RoadDischarge ZonesRiverModel Extent
0 20 40 60 80 10010Kilometres
²
Figure 5 Groundwater flow and average late dry season discharge from the Tindall Limestone.
2.1.7 Discharge from the Cambrian Aquifer System
Major discharge from the Cambrian – Ordovician aquifer system occurs predominantly from the
Tindall Limestone and Oolloo Dolostone units of the Daly Basin. The majority of the observed
discharges from the Limestone Aquifer in the Daly Basin occur at the Douglas River and Hayes
Creek, the Daly River south of Beeboom Crossing, Flora River and along the Katherine River
(Tickell et al., 2002).
Major discharges from the Limestone Aquifer also occur in the vicinity of Mataranka at the
Mataranka Hot Springs, The Bitter Springs and along the Roper River and Elsey Creek. The
locations of the major discharge zones are indicated in Figure 5. A summary of the estimated

Groundwater Modelling of the Tindall Limestone
Date printed 30 July 2008 Status: FINAL Department of Natural Resources, Environment and The Arts Date Last Modified: 30 July 2008 Page 23
average discharge from each of the identified areas and their estimated Stage Height elevations
derived from the SRTM data are presented in Table 1.
Table 1 Discharge areas of the Tindall Limestone Aquifer and estimated end of dry average discharge rates and associated elevation of the river along the discharge zone.
Location Gauging
Station
Estimated Average Discharge
[cumecs]
Estimated RL of River Stage Height
[mAHD]
Seventeen Mile
Creek*
G8140159 0.3 N/A
Katherine at Low
Level Crossing
G8140001 1.14 86.5
Katherine River at
Galloping Jacks
G8140301 1.33 81
Roper River / Elsey
Creek
G9030176 3.1 120 - 130
Douglas River /
Hayes Creek
G8140063 1 55
Flora River G8140044 2.3 80
Daly River at Mt
Nancar
G8140040 1 30
* Dry season flows in Seventeen Mile Creek are not sourced from the Tindall Limestone Aquifer and have been
added to identify major end of dry season flow inputs to the Katherine River.
2.2 Study Area Hydrogeology
The study area is within the Katherine River catchment (Figure 1). The major geological units in
the study area are the Cretaceous sediments, Jinduckin Formation and Limestone Aquifer.
2.2.1 Limestone Aquifer Saturated Thickness
The hydrogeological units within the study area comprises the Limestone Aquifer overlain by the
Jinduckin Formation and Cretaceous rocks.
Pidsley, (1987) provides an estimate of the saturated thickness in the region of the Venn
Horticultural Subdivision. Puhalovich, (2005) identified from geological cross-sections that the
saturated thickness of the Limestone Aquifer varies across the area. Based on the cross-sections
presented and the work by Pidsley, (1987) the saturated thickness is seen to vary from greater

Groundwater Modelling of the Tindall Limestone
Date printed 30 July 2008 Status: FINAL Department of Natural Resources, Environment and The Arts Date Last Modified: 30 July 2008 Page 24
than 100 metres along the southwestern margin of the Limestone Aquifer, to less than 30 metres to
the northeast of the Venn Horticultural Subdivision.
It has been assumed, based on current knowledge, that in the area to the west of the Venn area
the transmissivity are assumed to be at a maximum of approximately 5000 m2/d. In the Venn
region the transmissivity is assumed to be approximately 2000 m2/d.
2.2.2 Hydraulics of the Cretaceous Sediments in the Area of the King River
Hydrograph dynamics indicate that the recharge to the Cretaceous sediments is relatively constant
and that the inputs to the Limestone Aquifer are similarly constant.
2.2.3 Groundwater Flow
In the study area groundwater flows from the groundwater divide in the King River area and
discharges to the southeast at the Roper River and to the northwest at the Katherine River.
Groundwater also flows to the Roper River from the Georgina Basin.
2.2.4 Groundwater Discharge
Jolly et al., (2000), identified two components to the dry season recessions in the stream discharge
hydrographs. These recessions were interpreted to signify two different sources for the water, river
bank storage and regional groundwater flow. Bank storage is described as where a large
permanent stream undergoes an increase in river stage under the influence of an arriving
floodwave, flow may be induced into the stream banks and the adjoining aquifer. As the stage
declines, the flow is reversed (Freeze and Cherry, 1979). River bank storage effects along the
Katherine River are expected to be most evident during years of above average rain, flood heights
and recharge events.
Dry Season Dynamics
a)
Dry SeasonFlow Height
River Bank
Flow from the aquiferinto the river.
Groundwater level
Wet Season Dynamics
b)
Wet SeasonFlow/Flood Height
River Bank
Flow from the riverinto the aquifer.
Groundwater level
Figure 6 Groundwater / surface water interactions indicating the bank storage effects during a) dry season and b) wet season.

Groundwater Modelling of the Tindall Limestone
Date printed 30 July 2008 Status: FINAL Department of Natural Resources, Environment and The Arts Date Last Modified: 30 July 2008 Page 25
2.3 Study Area Observation Data
2.3.1 Rainfall and Potential Recharge
Rainfall data is available in the Katherine area from the Katherine Post Office site, DR014902.
Data is available from 1887 to present. The methodology for determining the potential recharge to
the aquifers in the Katherine region, based on these rainfall records, was developed by Jolly et al.,
(2000). The potential recharge record derived from this work was used as a basis for the recharge
to the Limestone Aquifer system.
The potential recharge was calculated from the daily rainfall record, using estimates for the end of
dry season soil moisture deficit and daily losses (evapotranspiration etc). A soil moisture deficit of
150 mm and wet season evapotranspiration (ET) of 5 mm/day were chosen. It was also assumed
that there was little surface runoff from the ground overlying the Limestone Aquifer (Jolly et al.,
2000).
The relationship between the daily rainfall and daily potential recharge from 1960 to 2004 is
presented in Figure 7.
Jan-
60
Jan-
62
Jan-
64
Jan-
66
Jan-
68
Jan-
70
Jan-
72
Jan-
74
Jan-
76
Jan-
78
Jan-
80
Jan-
82
Jan-
84
Jan-
86
Jan-
88
Jan-
90
Jan-
92
Jan-
94
Jan-
96
Jan-
98
Jan-
00
Jan-
02
Jan-
04
Date
0
50
100
150
200
250
Rai
nfal
l / P
ot. R
echa
rge
(mm
)
Daily RainfallDaily Potential Recharge
Figure 7 Relationship between rainfall at Katherine and potential recharge modified from Jolly, (2000).
2.3.2 Observation Bores
25 bores within the Study Area have time series water level data. The list of bores is provided in
Appendix A. The hydrographs of 6 bores RN007821, RN022002, RN022006, RN022397,
RN023427 and RN029429, form a transect away from the Katherine River, were used to provide
the basis for the transient calibration.

Groundwater Modelling of the Tindall Limestone
Date printed 30 July 2008 Status: FINAL Department of Natural Resources, Environment and The Arts Date Last Modified: 30 July 2008 Page 26
"
"
KATHERINE RIV ER
KIN
G R
IVER
WATERHO
USE R
IVER
EDITH RIVER
ROPER RIV ER
RN022287
RN029429
RN024613
RN023428RN023427
RN023425
RN023424
RN022006RN022002
RN022001RN007821
RN005032
KATHERINE
Mataranka
0 10 20 30 40 505Kilometres
" TownMonitoring BoresRoadMajor RoadCreekRiverCretaceous
GraniteJinduckinOolloo_lowerOolloo_upperTindall
²
Jan-
80
Jan-
82
Jan-
84
Jan-
86
Jan-
88
Jan-
90
Jan-
92
Jan-
94
Jan-
96
Jan-
98
Jan-
00
Jan-
02
Jan-
04
Date
100
110
120
130
140
150SW
L (m
AHD
)
RN007821 (unconfined, bore collar surveyed)
Measuring Point RL = 196.465 mAHD
Jan-
80
Jan-
82
Jan-
84
Jan-
86
Jan-
88
Jan-
90
Jan-
92
Jan-
94
Jan-
96
Jan-
98
Jan-
00
Jan-
02
Jan-
04
Date
100
110
120
130
140
150
SWL
(mAH
D)
RN022006 (unconfined, bore collar surveyed)
Measuring Point RL = 188.25 mAHD
Figure 8 Location of observation bores and bores used to calibrate the model. Hydrographs of selected bores indicate the effect of the Cretaceous sediments.
2.3.3 Groundwater Level Hydrographs
Groundwater hydrographs of the study area are presented in Appendix B. The six hydrographs
used to calibrate the model are discussed below and presented in Figure 9.
RN007821 is located approximately 17.5 kilometers to the east southeast of the Katherine River.
The bore is located in an area where the Limestone Aquifer outcrops.
RN022002 is located to the southeast of the Venn Horticultural sub-division and is in an area with
approximately 10-20 metres Cretaceous cover (Britten, 1983), the subdued response to the
seasonal recharge events is interpreted to be due to lower recharge rate through the Cretaceous
layer.
RN022006 is located to the southeast of the Venn Horticultural sub-division and is in an area with
with approximately 10-20 metres Cretaceous cover (Britten, 1983), the subdued response to the
seasonal recharge events is interpreted to be due to lower recharge rate through the Cretaceous
layer.
RN022397 is located near the Katherine River, the groundwater level response shows strong
influence from the seasonal levels in the river.

Groundwater Modelling of the Tindall Limestone
Date printed 30 July 2008 Status: FINAL Department of Natural Resources, Environment and The Arts Date Last Modified: 30 July 2008 Page 27
RN023427 is located to the east of the Venn Horticultural sub-division and is constructed in
Cretaceous sediments (Yin Foo, 1985). The response is relatively flat and shows no evidence of
seasonal recharge events.
RN029429 is located between the Venn Horticultural sub-division and the Katherine River. It is
located in an area where the Limestone Aquifer outcrops, which, like RN007821, is reflected in the
groundwater level response to recharge.
Jan-
80
Jan-
82
Jan-
84
Jan-
86
Jan-
88
Jan-
90
Jan-
92
Jan-
94
Jan-
96
Jan-
98
Jan-
00
Jan-
02
Jan-
04
80
90
100
110
120
130
140
150
160
Wat
er L
evel
(mA
HD
)
RN023427RN022006RN007821RN029429RN022397
Figure 9 Typical hydrographs across the study area. Green traces indicate bores located where the Limestone Aquifer is overlain by Cretaceous sediments, Blue traces indicate bores where minimal cover exists over the Limestone Aquifer.
2.3.4 Potentiometric Head Distribution
The groundwater levels for November 2003 were collated and contours of the head distribution are
presented in Figure 10.

Groundwater Modelling of the Tindall Limestone
Date printed 30 July 2008 Status: FINAL Department of Natural Resources, Environment and The Arts Date Last Modified: 30 July 2008 Page 28
"
"
Katherine River(1.33 cumecs)
Roper River(3.1 cumecs)
KATHERINE
Mataranka
Flow Direction
[mAHD]5051 - 6061 - 7071 - 8081 - 9091 - 100101 - 110111 - 120121 - 130131 - 140141 - 150151 - 160161 - 170171 - 190
" TownsMajor RoadDischarge ZonesRiverModel Extent
0 10 20 30 40 505Kilometres
²
Figure 10 Groundwater level contours, November 2003.
2.3.5 River Stage Height Data
River stage height data is available at the Katherine Railway Bridge (G8140001) from 02/03/1959
to 07/08/2004. There are some gaps in the early portion of the record (1960 – 1962 and 1971) as
can be seen from Figure 11. Total discharge from the Limestone Aquifer to the Katherine River is
derived from Galloping Jacks (G8140301).
It should be noted that the river stage heights of the two stations during the dry season differ by
approximately 5-6 metres. The stage height during the end of the dry season, upstream of the
Katherine Railway Bridge, is approximately 86.5 mAHD (due to the weir), whilst the stage height at

Groundwater Modelling of the Tindall Limestone
Date printed 30 July 2008 Status: FINAL Department of Natural Resources, Environment and The Arts Date Last Modified: 30 July 2008 Page 29
Galloping Jacks at the end of the dry season has been estimate to be approximately 81 mAHD
(from the 1:5000 Flood Mapping for Katherine, March 2005).
Jan-
1960
Jan-
1965
Jan-
1970
Jan-
1975
Jan-
1980
Jan-
1985
Jan-
1990
Jan-
1995
Jan-
2000
Jan-
2005
Date
85
90
95
100
105
110
Sta
ge H
eigh
t(m
etre
s A
HD)
Figure 11 Katherine Railway Bridge stage height data (G8140001)
Maximum daily recorded height data has been extracted from the corporate database Hydsys for
G8140001 at daily intervals. The lowest levels of 86.54 mAHD occurred in late 1962. The flow
measured at this time was 0.69 cumecs. During 1996 the level reached a minimum of
86.56 mAHD, which, corresponds to a flow of 0.94 cumecs.
2.3.6 River Gauging Data
Stream discharge flow gaugings are available at two locations Katherine Railway Bridge
(G8140001) and Galloping Jacks (G8140301). Continuous gauging data exist at the Katherine
Railway Bridge generated from the stage height data rated to the manual gauged flows. The
locations of these two river flow stations are depicted in Figure 12.
Groundwater Modelling of the Tindall Limestone
Date printed 30 July 2008 Status: FINAL Department of Natural Resources, Environment and The Arts Date Last Modified: 30 July 2008 Page 30
#
#
#
#
"
"
Seve
ntee
n Mile
Cre
ek
KATHER IN
E RIVER
KIN
G R
IVER
DRY R
IVER
EDITH RIVER
WATERHOUSE RIVER
ROPER RIVER
G8140301
G8140159
G8140002G8140001KATHERINE
Mataranka
0 10 20 30 40 505Kilometres
²" Towns# Gauging Stations
Major RoadCreekRiverModel Extent
Cretaceous RocksUpper Oolloo DolostoneLower Oolloo DolostoneJinduckin FormationTindall LimestoneUndifferetiated
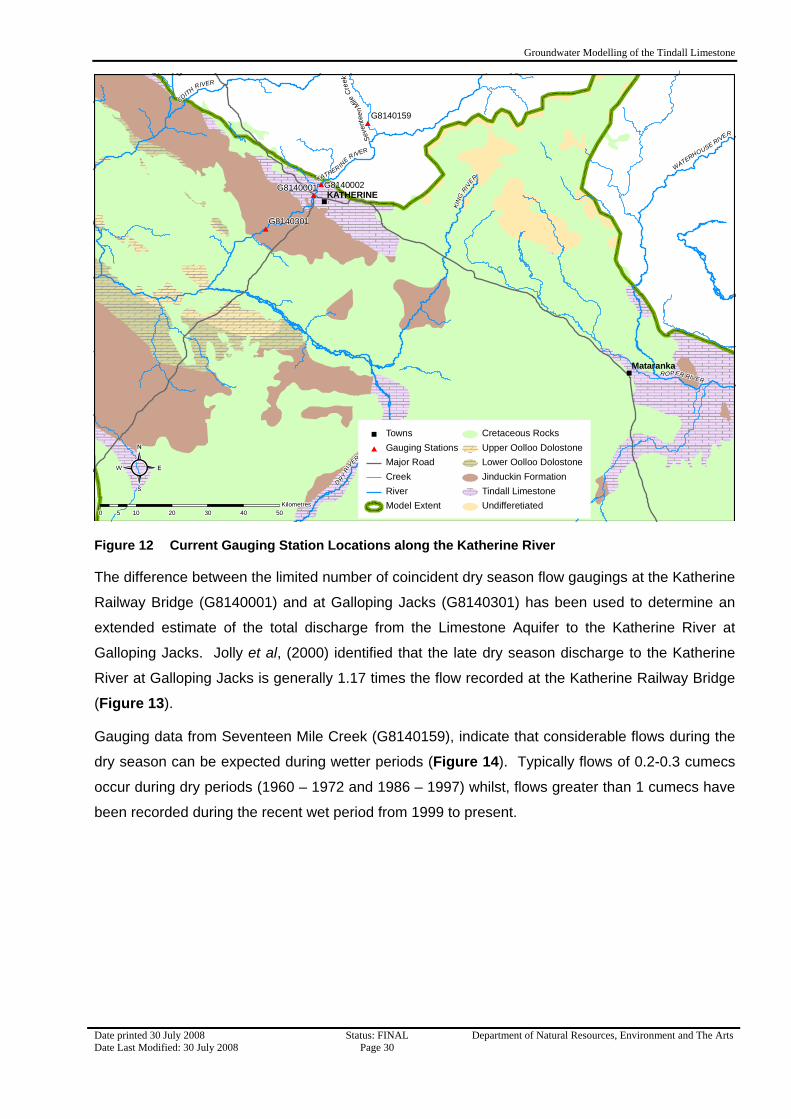
Figure 12 Current Gauging Station Locations along the Katherine River
The difference between the limited number of coincident dry season flow gaugings at the Katherine
Railway Bridge (G8140001) and at Galloping Jacks (G8140301) has been used to determine an
extended estimate of the total discharge from the Limestone Aquifer to the Katherine River at
Galloping Jacks. Jolly et al, (2000) identified that the late dry season discharge to the Katherine
River at Galloping Jacks is generally 1.17 times the flow recorded at the Katherine Railway Bridge
(Figure 13).
Gauging data from Seventeen Mile Creek (G8140159), indicate that considerable flows during the
dry season can be expected during wetter periods (Figure 14). Typically flows of 0.2-0.3 cumecs
occur during dry periods (1960 – 1972 and 1986 – 1997) whilst, flows greater than 1 cumecs have
been recorded during the recent wet period from 1999 to present.

Groundwater Modelling of the Tindall Limestone
Date printed 30 July 2008 Status: FINAL Department of Natural Resources, Environment and The Arts Date Last Modified: 30 July 2008 Page 31
Jan-
1960
Jan-
1962
Jan-
1964
Jan-
1966
Jan-
1968
Jan-
1970
Jan-
1972
Jan-
1974
Jan-
1976
Jan-
1978
Jan-
1980
Jan-
1982
Jan-
1984
Jan-
1986
Jan-
1988
Jan-
1990
Jan-
1992
Jan-
1994
Jan-
1996
Jan-
1998
Jan-
2000
Jan-
2002
Jan-
2004
0.1
1
10Ka
ther
ine
Riv
er D
isch
arge
(cum
ecs)
G8140001- Measured FlowG8140301- Estimated Flow
G8140001 - Gauged Flows
Figure 13 Gauged flows (cumecs) in the Katherine River at the Railway Bridge (G8140001) and the total estimated groundwater discharge to the Katherine River from the aquifer at Galloping Jacks (G8140301).
Jan-
60
Jan-
62
Jan-
64
Jan-
66
Jan-
68
Jan-
70
Jan-
72
Jan-
74
Jan-
76
Jan-
78
Jan-
80
Jan-
82
Jan-
84
Jan-
86
Jan-
88
Jan-
90
Jan-
92
Jan-
94
Jan-
96
Jan-
98
Jan-
00
Jan-
02
Jan-
040.1
1
10
Seve
ntee
n M
ile C
reek
Dis
char
ge(c
umec
s)
G8140159 - Gauging StationG8140159 - Gauged Flows
G8140159 - Gauged Flows
Figure 14 Gauged flows at Seventeen Mile Creek (G8140159), indicating flows in the Katherine River not due to discharge from the Limestone Aquifer.

Groundwater Modelling of the Tindall Limestone
Date printed 30 July 2008 Status: FINAL Department of Natural Resources, Environment and The Arts Date Last Modified: 30 July 2008 Page 32
2.4 Conceptual Model
The conceptual model for the Limestone Aquifer was developed by the Water Resources section of
NRETA from the available data and observations outlined in the previous sections. The
conceptual model for the Limestone system can be summarized as:
• The Limestone aquifer may be represented as a single unconfined layer. At the regional scale
the karstic nature of the aquifer can be represented as an equivalent porous medium, with
effective transmissivity and storage values used to simulate the overall aquifer characteristics.
• Mapped occurrence of the Jinduckin Formation confines the Limestone aquifer and is expected
to have lower transmissivities and storage coefficient than the unconfined Limestone aquifer.
• The Limestone aquifer was expected to have greatest permeability within the weathered zone,
confined to the upper 150 metres from the surface. For the purposes of this exercise the
aquifer was considered to have a constant thickness below the groundwater table. That is the
system can be represented as a single layer with zones of constant transmissivity instead of
varying the hydraulic conductivity and aquifer thickness. This is considered valid as the
variations in the groundwater level are considered small compared to the saturated thickness
of the Limestone Aquifer.
• Aquifer transmissivity of 5,000 m2/d based on the Water Studies modelling results.
• A single estimate of transmissivity in the Venn region indicate that lower values (around
2000 m2/d) may be applicable in this area.
• The confined regions of the Limestone Aquifer were assigned a single value of 100 m3/d/m.
• Unconfined aquifer storage coefficient was 0.04. This is considered a reasonable estimate as
previous experience (Jolly, pers comm.) indicates that this value should be between 0.01 and
0.07.
• Confined aquifer storage coefficient was assigned 0.0001 based on typical confined aquifer
storage coefficients.
• The dominant recharge is mechanism is via sinkholes, however, this is not well understood, so
the recharge was estimated as diffuse recharge.
• The main influence of the Cretaceous sediments is to reduce the recharge to the Limestone
Aquifer. This is based on the subdued response of hydrographs for bores located in areas with
the Cretaceous cover (eg RN22006).
• Initial estimates of the steady state annual recharge over the two areas were 150 mm/yr
(0.41 mm/d) for the outcropping limestone and 40 mm/yr (0.11 mm/d) for the Cretaceous cover.

Groundwater Modelling of the Tindall Limestone
Date printed 30 July 2008 Status: FINAL Department of Natural Resources, Environment and The Arts Date Last Modified: 30 July 2008 Page 33
• Based on the steady state recharge estimates the potential recharge model developed using
the Katherine rainfall record (Jolly et al, 2000) was scaled to provide transient recharge values.
The recharge model estimates the soil moisture deficit and daily evapotranspiration to derive
the potential recharge due to deep drainage.
• Recharge occurs from the Katherine River when stage height > groundwater level.
• The dominant discharge from the aquifer is through the streambed and via springs. Discharge
occurs along the length of the Katherine River where it intersects the Limestone Aquifer. Bank
storage mechanism, beyond scope of this model.
• Over the long term the late dry season discharge to the river via spring flows range from 1 to 2
cumecs, with an average discharge rate of 1.33 cumecs, with approximately 17% or
0.23 cumecs discharging downstream of the low level weir.
• Contributions to the groundwater from the Cretaceous rocks near King River are considered as
being relatively constant and as such constitute a constant flux boundary.
• Evapotranspiration from the riparian zone is estimated at approximately 3 mm/day. The ET
has not been explicitly considered in this model. Based on the ET value a riparian zone width
of approximately 200 metres and a length 12 kilometres of river the total ET is 720 m3/d
(0.0083 cumecs or <0.001% of the flow in the river). Assuming this is all derived from
groundwater this is a relatively small component of the water balance.

Groundwater Modelling of the Tindall Limestone
Date printed 30 July 2008 Status: FINAL Department of Natural Resources, Environment and The Arts Date Last Modified: 30 July 2008 Page 34
3 Model Development
3.1 Model Specifications
The model encompasses the mapped occurrence of the Cambrian Limestone Aquifer of the Daly,
Wiso and Georgina Basins. The entire model covers an area of approximately 195,000 km2. The
south western boundary in the Georgina Basin was selected to coincide with the interpreted
groundwater divide evident from groundwater levels (Tickell, 2003).
The model mesh was developed to facilitate two levels of detail in the modelling.
• The first being a regional model encompassing the entire Limestone Aquifer. The regional
mesh was refinement along the major rivers where baseflow from the Limestone Aquifer has
been identified. The coarse nature of the model at this regional level was considered
reasonable as these areas are to provide steady state boundary conditions outside of the study
area.
• The second area with the greater level of detail encompasses the Limestone Aquifer within the
area reported by Puhalovich, (2005). The extent of TLA model is presented in Figure 20. The
model mesh in this region was refined to allow for the incorporation of transient boundary
conditions such as pumping bores and groundwater / surface water interactions along the
Katherine River.
The difference in the density of mesh elements between the regional area and the study area can
be seen in Figure 15.
3.1.1 Numerical Model Code
The finite element package FEFLOW® v5.205 from WASY was used to simulate the saturated flow
processes. FEFLOW® is a fully three dimensional finite-element package capable of simulating
unsaturated and saturated flow and contaminant transport. FEFLOW® also has built-in mesh-
design, problem editing and graphical post processing display modules that allow rapid model
development, execution and analysis (Diersch, 2004). A 32-bit PC laptop under Windows XP was
used as the platform for the numerical simulations (transient simulations over 41 years typical took
70-80 minutes).
The high-level graphical interface, the Geographic Information System (GIS) capabilities, and the
capacity for detailed mesh generation built into FEFLOW are important features that have allowed
the rapid development and testing of the models described in this report.
Finite elements provide greater flexibility in the mesh design than the rectilinear grids employed by
finite difference code, allowing for the refinement of the mesh around points such as bores and
linear features such as rivers. The code proprietary and as such has limitations because the

Groundwater Modelling of the Tindall Limestone
Date printed 30 July 2008 Status: FINAL Department of Natural Resources, Environment and The Arts Date Last Modified: 30 July 2008 Page 35
software requires a licence to run – unlike the core code for Modflow which is “freeware” from the
US Geological Survey.
3.1.2 Spatial Discretisation
The superelement, mesh and model were developed with the FEFLOW® package. The mesh was
generated using the automatic Triangle option (Shewchuk, 2002). This feature offers the ability to
define the local variation of mesh density by allowing for the refinement of the mesh around
specified point and line features. Node placement and refinement of the mesh was defined at the
locations of the production bores and monitoring bores. Refinement of the model mesh was also
defined along the major drainage features previously identified, where significant discharge from
the Limestone Aquifer occurs. Geological boundaries were also incorporated to provide accurate
assignment of model parameters using the “JOIN” feature in the FEFLOW.
The regional mesh was generated using the following settings for the Triangle (Delaunay)
generator in the Mesh Generator Options:
• Quality mesh, minimum angle <= 30 degrees
• Force all triangles to be Delaunay
• Fill all possible holes in mesh
• Divide-and-conquer meshing algorithm
An initial mesh density of 1000 elements was used in the Generate Automatically option to
generate the mesh.
The regional mesh was then refined in the vicinity of the study area using the Mesh Geometry
Editor.
The resultant mesh used in the modelling is presented in Figure 15 and comprises 29,258
elements and 15,068 nodes.

Groundwater Modelling of the Tindall Limestone
Date printed 30 July 2008 Status: FINAL Department of Natural Resources, Environment and The Arts Date Last Modified: 30 July 2008 Page 36
Figure 15 Model mesh geometry showing region of mesh refinement in the study area.
3.2 Layers
It was considered that the Cambrian Limestone Aquifer could be approximated as a single layer
system, with spatially variable transmissivity. This is considered valid as the variations in the
groundwater level are considered small compared to the saturated thickness of the Limestone
Aquifer.
3.3 Boundary Conditions
The following boundary conditions have been used to simulate the various input/output features in
the model.
• The diffuse recharge to the aquifer is a variable flux boundary describing the proportion of the
potential recharge entering the model.
• Groundwater / surface water interactions. The conceptual model assumes that the dominant
mechanism for discharge of groundwater from the system is through spring flow to the rivers.
Based on this assumption the discharge to the rivers has been implemented using a transfer
boundary. As identified in the conceptual that localized recharge occurs along the Katherine
River during periods when the river height exceeds the groundwater level.

Groundwater Modelling of the Tindall Limestone
Date printed 30 July 2008 Status: FINAL Department of Natural Resources, Environment and The Arts Date Last Modified: 30 July 2008 Page 37
• Pumping bores were implemented using Well BC’s
• The boundary of the model domain where the Antrim Plateau Volcanics outcrop or occurs
above the groundwater level is implemented as no-flow boundaries.
3.3.1 Recharge (Specified Flux at the Model Surface)
Recharge was applied to the entire model based on the surface geology. In areas were the
Cretaceous unit occurred the recharge rate was reduced by a factor of 3-4 (refer to Section 2.1.1).
Also, the groundwater table has been modelled to be in direct connection to the recharge from the
surface (ie no time lag has been introduced to simulate the time for the deep drainage to travel
through the Cretaceous unit, which, can be up to 100 metres thick).
3.3.2 Transfer (Cauchy) Boundary
The groundwater/surface water interactions along river features are simulated using transfer
(Cauchy) boundary conditions. The transfer boundary is similar to the RIV package used by
MODFLOW (Anderson and Woessner, 2002). The transfer boundary condition (Figure 16)
describes a reference hydraulic head which has an imperfect hydraulic contact with the
groundwater body caused by a colmation layer (related to the stream bed conductance).
Additionally to the reference head for the Transfer boundary condition you have to assign a
transfer rate (leakage) to describe the hydraulic properties of the colmation layer (Diersch, 2004).
Figure 16 Transfer boundary conceptualization for a losing stream (Diersch, 2004).
The flux through the colmation layer as shown above can be described using the Darcy equation:
dhhK
lhKq
Rinin
nh
−−=
∆∆
−≈ 200

Groundwater Modelling of the Tindall Limestone
Date printed 30 July 2008 Status: FINAL Department of Natural Resources, Environment and The Arts Date Last Modified: 30 July 2008 Page 38
The transfer rate ( inhΦ ) can be estimated by:
dK in
inh
0≈Φ in (d-1)
The reference hydraulic ( Rh2 ) was initially determined from the 3 second (90 metre) digital terrain
model. Steady state modelling assumed that the stage height for the Katherine River upstream of
the Low Level Crossing is 86.5 mAHD and upstream of Galloping Jacks is 81 mHD.
3.3.3 Well Boundary Conditions
Well boundary conditions describe the injection or withdrawal of water at a single node in m3/d.
Pumping rates were applied either as at a steady state value equal to the annual pumped volume
for the bore converted to m3/d by dividing by 365 days or as a variable pumping rate using power
functions to define the transient pumping schedule at each bore.
3.4 Hydraulic Parameters
The hydraulic parameters of interest in the steady state model were the transmissivity and
recharge rate and the reference hydraulic heads and the transfer out rate associated with the
Transfer Boundary condition. The methodology for the choice of initial values for the major
hydraulic parameters is discussed below.
• Transmissivity was zoned according to the identified unconfined and confined areas of the
Aquifer.
o The unconfined Aquifer was initially defined as being consistent across the model with
an estimated initial value of 5,000 m3/d/m.
o Where the Aquifer is confined by the Jinduckin Formation and equivalents, it is thought
that the Aquifer has developed less permeability and as such has been assigned a
considerably lower constant transmissivity value of 100 m3/d/m.
• Recharge was zoned according to the occurrence of the Jinduckin Formation and equivalents,
the Cretaceous cover and outcropping Limestone Aquifer.
o No recharge was applied to the model where the Jinduckin Formation has been
mapped.
o Highest recharge rates were applied where the Aquifer outcrops.
o Lower recharge rates (approximately 3-4 times lower) were applied to areas with
Cretaceous cover directly overlies the Aquifer.
o Initial estimates of the annual recharge over the two areas were 140 mm/yr (0.38 mm/d)
for the outcropping dolostone and 40 mm/yr (0.11 mm/d) for the Cretaceous cover.

Groundwater Modelling of the Tindall Limestone
Date printed 30 July 2008 Status: FINAL Department of Natural Resources, Environment and The Arts Date Last Modified: 30 July 2008 Page 39
• Transfer Rate describes the connection between the Transfer Boundary and the model and in
this instance is considered to be controlled by the surficial geology. Areas where the
Limestone Aquifer outcrop is assigned 1,000,000 d-1.
3.4.1 Transmissivity Distribution
The steady state model initially used a single value across the entire model domain for the
transmissivity. These were then adjusted to more closely represent the mapped occurrence of the
various hydrogeological units (refer Error! Reference source not found.).
The transmissivity distribution for the calibrated model (Figure 17) is based on the mapped
occurrence of the Cambrian Limestone Aquifer.
In the area of the Sturt Plateau the water table is close to the Antrim Plateau Volcanics and the
limestone aquifer has minimal submergence, transmissivities have been reduced to reflect this.
Areas where the Limestone is confined by the Jinduckin Formation transmissivity was set to
100 m3/d/m.
No flow was assigned to the area to the west of the Stuart Highway between Mataranka and Daly
Waters where the Antrim Plateau Volcanics occurs above the groundwater level. This feature has
been mapped by Yin Foo and Mathews, (2003).
The higher than expected transmissivities in the Flora River region raised questions as to the
reason for these values. It has been suggested that the mapped width of the Limestone Aquifer in
this area is less than the actual width, initial appraisal of geological data has confirmed this
assessment. Further work to provide greater control on this contact is planned.

Groundwater Modelling of the Tindall Limestone
Date printed 30 July 2008 Status: FINAL Department of Natural Resources, Environment and The Arts Date Last Modified: 30 July 2008 Page 40
0 50 100 150 200 25025Kilometres
Transmissivity(m2/day)
No Flow171004301,3002,1602,6004,3205,01017,28041,800
²
Figure 17 Distribution of transmissivity across the study area based on the mapped occurrence of the Limestone Aquifer. Region of greater than expected transmissivity in the Flora River identified.
3.4.2 Recharge Distribution
As discussed previously, the steady state recharge to the model was zoned depending on the
occurrence of the Jinduckin Formation and the Cretaceous units. In areas where the Jinduckin
Formation occurs recharge is set to 0 mm. In areas where the Cretaceous layer is absent higher
recharge rates were applied (up to 150 mm/yr), in areas where the Cretaceous cover exists the
recharge was reduced by approximately 3-4 times (~40 mm/yr).
The trend in steady state recharge can be seen to increase from the southeast to the northwest.
This is in line with what would be expected, given the rainfall patterns discussed in section 1.5.

Groundwater Modelling of the Tindall Limestone
Date printed 30 July 2008 Status: FINAL Department of Natural Resources, Environment and The Arts Date Last Modified: 30 July 2008 Page 41
0 50 100 150 200 25025Kilometres
Recharge(mm/d)
00.00010.0020.0030.0040.0050.040.170.20.220.250.3
²
Figure 18 Recharge zones, higher recharge rates associated with the outcropping Limestone Aquifer, lower recharge rate in areas where Cretaceous cover exists and no recharge where the Jinduckin exists.

Groundwater Modelling of the Tindall Limestone
Date printed 30 July 2008 Status: FINAL Department of Natural Resources, Environment and The Arts Date Last Modified: 30 July 2008 Page 42
4 Steady State Model Development The initial conceptual model described in section 2.2 was implemented using a single semi-
unconfined layer with inputs from regional/diffuse recharge (implemented as source/sink on the
upper slice of the model) and due to flows in the Katherine River and outputs as discharge along
the river features (both implemented using the transfer boundary condition applied at the nodes
along the rivers).
The 1996 late dry season water levels were considered as slightly below average and constituted a
reasonable approximation of the system in steady state.
4.1 Steady State Model Calibration
The dependent variables considered in the steady state calibration process were the hydraulic
heads and the groundwater discharge. The 1996 late dry season water levels were considered as
slightly below average and constituted a reasonable approximation of the system in steady state.
The discharge to the Katherine River was estimated from the gauged flows at the Low Level
crossing and multiplied by 1.17 the estimated dry season flow for 1996 was 1.1 cumecs.
The measure of the “goodness” of fit of the heads is the root mean square error (RMS error)
where:
RMS error = ( )
n
hhn
i∑
=
−1
2model(i)obs(i)
and
RMS error is the root mean square error (metres)
hobs(i) is the ith observed water level (metres)
hmodel(i) is the ith modelled water level (metres)
n is the number of observations
The target for calibration was to adjust the transmissivity and recharge rates to minimise the overall
RMS error and provide a discharge from the transfer boundary, in line with the estimate of
1.1 cumecs (section 2.3.6).
As stated previously the steady state model has been calibrated against the observed heads for
the late dry season of 1996.

Groundwater Modelling of the Tindall Limestone
Date printed 30 July 2008 Status: FINAL Department of Natural Resources, Environment and The Arts Date Last Modified: 30 July 2008 Page 43
4.2 Steady State Calibration Results
4.2.1 Calibrated Water Levels
The results of the calibrated steady state model provides a reasonable fit to the observation data,
with the RMS error for the observed versus modelled heads of 8 metres. This is an error of
approximately 6% considering the head distribution across the site ranges from 60 – 180 metres
above Australian Height Datum.
40 60 80 100 120 140 160 180 200Observed Head (mAHD)
40
60
80
100
120
140
160
180
200
Mod
elle
d H
ead
(mA
HD
)
RN005032
RN023425
RN023427
RN023428
RN024556
RN024613
RN029429
RN022287
RN020850
RN007876
RN000319
RN005898
RN032950
RN026553
RN006326
RN007821
RN022001
RN022002RN022006
RN022397
RN023424
Modelled vs Observed1:1
Confined Bores
Bores constructedin Cretaceous
Douglas River Bores
Figure 19 Steady state water levels for calibrated model.

Groundwater Modelling of the Tindall Limestone
Date printed 30 July 2008 Status: FINAL Department of Natural Resources, Environment and The Arts Date Last Modified: 30 July 2008 Page 44
4.2.2 Steady State Water Budget
The water budget for the calibrated steady state model is presented in Table 2.
Table 2 Steady state water balance for the calibrated model with no pumping.
Water Budget Component
Recharge [cumecs]
Storage [m3]
Discharge [cumecs]
Recharge – Total 10.17
Storage 2.91 x 10¹⁰
Discharge – Daly River
1.75
Discharge – Douglas River
2.03
Discharge – Flora River
1.97
Discharge - Katherine River
1.15
Discharge - Roper River
3.22
Discharge from Cretaceous
0.05
Total 10.17 2.91 x 10¹⁰ 10.17

Groundwater Modelling of the Tindall Limestone
Date printed 30 July 2008 Status: FINAL Department of Natural Resources, Environment and The Arts Date Last Modified: 30 July 2008 Page 45
5 Transient Model Development
5.1 Model Specifications
The study area is roughly coincident with the model developed by Puhalovich, (2005) and covers
an area of approximately 6,400 km2 (Figure 20).
"
"
K
ATHERINE RIVER
KI
NG RIV
ER
DRY R
IVER
LIMESTONE CREEK
SCO
TT CRE
EK
E LSE Y CREEK
WATE
RHOUS
E RIV
ER
DOOK CREEK
WES
T BR
ANC
H
GUNDI CR
E EK
ROPER CREEK
BESWICK CREEK
LEIGHT CREEK
MATHISON
CR
EEK
CAVE CREEK
FE RGUSSO
N R
IVER
BONDI CREEK
EDITH RIVER
ROPER RIV ER
MCADDENS C REEK
CHAINMAN CREEK
EMIL
Y CREEK
YUJULLOWAN CREEK
SALT
CR
EEK
REDB
ANK CREEK
EMU CR
EEKDIAM
OND CREEK
MARANBOY CREEK
WURUNL UH CREEK
BONE CREEK
BULL CREEK
DURRINYAN CREEK
GRANITE CREEK
KATHERINE
Mataranka
0 10 20 30 40 505Kilometres
" TownRoadMajor RoadCreekRiverTLA model extent
CretaceousUpper Oolloo DolostoneLower Oolloo DolostoneJinduckin FormationTindall LimestoneAntrim Plateau VolcanicsUndifferetiated
²
LOCALITY MAP
Figure 20 Study area location, based on Puhalovich, (2005) TLA model extents.
5.2 Boundary Conditions
Four boundary conditions have been employed in the implementation of the transient model:
• The entire surface of the model is a variable flux boundary describing the recharge to the
aquifer.
• Transfer BC’s which simulate the groundwater/surface water interactions along the rivers.
• Well BC’s.
• No flow boundary along the edges of the model and where the Antrim Plateau Volcanics
occurs above the groundwater table.

Groundwater Modelling of the Tindall Limestone
Date printed 30 July 2008 Status: FINAL Department of Natural Resources, Environment and The Arts Date Last Modified: 30 July 2008 Page 46
5.2.1 Recharge (Specified Flux)
The recharge distribution was applied to the entire model based on the surface geology. In areas
were the Cretaceous unit occurred the recharge rate was reduced by a factor of 3-4 (refer to
Section 2.1.1). Also, the groundwater table has been modelled to be in direct connection to the
recharge from the surface (ie no time lag has been introduced to simulate the time for the deep
drainage to travel through the Cretaceous unit, which, can be up to 100 metres thick).
No recharge is applied to the model where the confining Jinduckin Formation is present along the
south east portion of the study area.
5.2.2 Transfer (Cauchy) Boundary
The groundwater/surface water interactions were implemented using transfer (Cauchy) boundary
conditions. As identified previously, the transfer boundary describes a reference hydraulic head
which has an imperfect hydraulic contact with the groundwater body caused by a colmation layer
(related to the stream bed conductance) (Diersch, 2004). The height of the river is considered to
“drive” the inflow/outflow of water from the Limestone aquifer.
5.2.3 Well Boundary Conditions
Discharge due to bores was modelled using Well boundary conditions with pump rate schedules
Scenario “A” and Scenario “B” as described by Puhalovich, (2005).
5.3 Transient Model Development
The initial conceptual model described in section 2.4 was implemented using a single unconfined
layer with inputs from regional/diffuse recharge (implemented as source/sink on the upper slice of
the model) and outputs, as discharge along the river features using the transfer boundary condition
applied at the nodes along the rivers.
The model was converted from a steady state model to a transient model. The main addition to
the model were the storage coefficients, the time variable recharge rates and the river stage height
along the Katherine River.
5.3.1 Temporal Discretisation
The transient simulation uses the automatic time step control in FEFLOW®, which employs the
forward Adams Bashforth / backward trapezoid time integration scheme (Diersch, 2004) using a
minimum possible time step of 0.001 days. Model inputs such as recharge and river stage height
data were applied on a daily basis.

Groundwater Modelling of the Tindall Limestone
Date printed 30 July 2008 Status: FINAL Department of Natural Resources, Environment and The Arts Date Last Modified: 30 July 2008 Page 47
5.4 Transient Model Calibration
As with the steady state calibration process the dependent variables considered were the hydraulic
heads and the groundwater discharge along the Katherine River where it intersects the Limestone
Aquifer. The transient model was modified to minimize the difference between the observed heads
and the modelled heads at the 5 observation bores (RN007821, RN022006, RN022397,
RN023427 and RN029429), which, are considered typical of the groundwater response in the
aquifer system.
5.5 Calibrated Model Results
5.5.1 Groundwater Level Hydrographs
The resultant calibrated hydrographs for the period 1963 – 2004 for the monitoring bores
RN007821, RN022006, RN022397, RN023427 and RN029429 are presented below.
Jan-
60
Dec
-64
Jan-
70
Jan-
75
Jan-
80
Dec
-84
Jan-
90
Jan-
95
Jan-
00
Dec
-04
100
110
120
130
140
150
Wat
er L
evel
(mA
HD
) RN007821
Figure 21 Comparison of modelled heads vs observed heads for RN007821. The response from the
calibrated model is in blue.
Jan-
60
Dec
-64
Jan-
70
Jan-
75
Jan-
80
Dec
-84
Jan-
90
Jan-
95
Jan-
00
Dec
-04
110
120
130
140
150
160
Wat
er L
evel
(mA
HD
) RN022006
Figure 22 Comparison of modelled heads vs observed heads for RN022006. The response from the
calibrated model is in blue.

Groundwater Modelling of the Tindall Limestone
Date printed 30 July 2008 Status: FINAL Department of Natural Resources, Environment and The Arts Date Last Modified: 30 July 2008 Page 48
Jan-
60
Dec
-64
Jan-
70
Jan-
75
Jan-
80
Dec
-84
Jan-
90
Jan-
95
Jan-
00
Dec
-04
70
80
90
100
110
120
Wat
er L
evel
(mA
HD
) RN022397
Figure 23 Comparison of modelled heads vs observed heads for RN022397. The response from the
calibrated model is in blue.
Jan-
60
Dec
-64
Jan-
70
Jan-
75
Jan-
80
Dec
-84
Jan-
90
Jan-
95
Jan-
00
Dec
-04
140
150
160
170
180
190
Wat
er L
evel
(mA
HD
) RN023427
Figure 24 Comparison of modelled heads vs observed heads for RN23427. The response from the
calibrated model is in blue.
Jan-
60
Dec
-64
Jan-
70
Jan-
75
Jan-
80
Dec
-84
Jan-
90
Jan-
95
Jan-
00
Dec
-04
100
110
120
130
140
150
Wat
er L
evel
(mA
HD
) RN029429
Figure 25 Comparison of modelled heads vs observed heads for RN29429. The response from the calibrated model is in blue.

Groundwater Modelling of the Tindall Limestone
Date printed 30 July 2008 Status: FINAL Department of Natural Resources, Environment and The Arts Date Last Modified: 30 July 2008 Page 49
5.5.2 Groundwater Discharge Hydrographs
The modelled and observed discharges to the Katherine River are presented in Figure 26. The
modelled response shows a reasonable fit to the observed data. It is noted that the model
generally underestimates the higher flows >2 cumecs during the periods 1974 to 1987 and 1999 to
2004. It is suspected that the deviation of the modelled discharges from the observed discharges
during very wet years is due to increased flows in Seventeen Mile Creek (Figure 14), which hasn’t
been subtracted from the flows at Galloping Jacks.
The low flow years are reasonably well predicted, which, is the aim of this model.
Jan-
1960
Jan-
1962
Jan-
1964
Jan-
1966
Jan-
1968
Jan-
1970
Jan-
1972
Jan-
1974
Jan-
1976
Jan-
1978
Jan-
1980
Jan-
1982
Jan-
1984
Jan-
1986
Jan-
1988
Jan-
1990
Jan-
1992
Jan-
1994
Jan-
1996
Jan-
1998
Jan-
2000
Jan-
2002
Jan-
2004
0.1
1
10
Kat
herin
e R
iver
Dis
char
ge(c
umec
s)
G8140001 - Measured Flow x 1.17Katherine River - Modelled Discharge
G8140001 - Gauged Flows x 1.17
Figure 26 Comparison of modelled discharge vs observed discharge along the Katherine River.

Groundwater Modelling of the Tindall Limestone
Date printed 30 July 2008 Status: FINAL Department of Natural Resources, Environment and The Arts Date Last Modified: 30 July 2008 Page 50
6 Discussion
6.1 Introduction
The effects of pumping on the groundwater discharge to the Katherine River due to variables such
as distance to the pumped well from the river have been developed based on hypothetical
pumping scenarios.
6.1.1 Surface-water / Groundwater Interaction Considerations
Withdrawing water from an aquifer that is directly connected to surface-water bodies can have a
significant effect on the movement of water between the groundwater and the surface water. The
effects of pumping a single well or a small group of wells on the hydrologic regime are local in
scale. However, the effects of many wells withdrawing water from an aquifer over large areas may
be regional in scale.
Withdrawing water from aquifers near surface-water bodies can diminish the available surface-
water supply by capturing some of the groundwater flow that otherwise would have discharged to
surface water or by inducing flow from surface-water into the surrounding aquifer system. A
qualitative analysis of the sources of water to a pumping well in an aquifer that discharges to a
stream is provided here to gain insight into how a pumping well can change the quantity and
direction of flow between the shallow aquifer and the stream. Although a stream is used in this
example, the results apply to all surface-water bodies, including lakes and wetlands.
A groundwater system under predevelopment conditions is in a state of dynamic equilibrium—for
example, recharge at the water table is equal to groundwater discharge to a stream (Figure 27a).
Assume a well is installed and is pumped continually at a rate, Q1. After a new state of dynamic
equilibrium is achieved, inflow to the groundwater system from recharge will equal outflow to the
stream plus the withdrawal from the well. In this new equilibrium, some of the groundwater that
would have discharged to the stream is intercepted by the well, and a groundwater divide, which is
a line separating directions of flow, is established locally between the well and the stream (Figure
27b). If the well is pumped at a higher rate, Q2, at a later time a new equilibrium is reached. Under
this condition, the groundwater divide between the well and the stream is no longer present and
withdrawals from the well induce movement of water from the stream into the aquifer (Figure 27c).
Thus, pumpage reverses the hydrologic condition of the stream in this reach from a groundwater
discharge feature to a groundwater recharge feature.
This hypothetical withdrawal of water from a shallow aquifer that discharges to a nearby surface-
water body is a simplified but compelling illustration of the concept that groundwater and surface
water are one resource. In the long term, the quantity of groundwater withdrawn is approximately
equal to the reduction in streamflow that is potentially available to downstream users.

Groundwater Modelling of the Tindall Limestone
Date printed 30 July 2008 Status: FINAL Department of Natural Resources, Environment and The Arts Date Last Modified: 30 July 2008 Page 51
Figure 27 In a schematic hydrologic setting where ground water discharges to a stream under natural conditions (a), placement of a well pumping at a rate (Q1) near the stream will intercept part of the ground water that would have discharged to the stream (b). If the well is pumped at an even greater rate (Q2), it can intercept additional water that would have discharged to the stream in the vicinity of the well and can draw water from the stream to the well (c).
6.2 Development Scenarios
6.2.1 Scenario with No Pumping
The results of the groundwater model calibration (section 5.5) have been used as the “baseline”
data to compare the various scenarios of development pumping.

Groundwater Modelling of the Tindall Limestone
Date printed 30 July 2008 Status: FINAL Department of Natural Resources, Environment and The Arts Date Last Modified: 30 July 2008 Page 52
6.2.2 Effect of Pumping Proximity on Groundwater Discharge to River
The first of these series of hypothetical pumping scenarios will be used to determine the relative
effects of pumping at various distances from the Katherine River. The three scenarios employ a
single bore pumped at 10,000 kL/d for the entire duration of the transient simulation (1963 – 2004).
The results of the three runs are presented in Figure 28.
10 100 1000 10000 100000Time[days]
0
20
40
60
80
100
Dis
char
ge D
eple
tion
Rat
e (a
s %
of p
umpi
ng ra
te)
Bore 1km from Katherine RiverBore 10km from Katherine RiverBore 20km from Katherine River
Figure 28 Effects of pumping distance on groundwater discharge to the Katherine River.
It can be seen that a bore located approximately 1 kilometre from the river has an almost
instantaneous effect on the discharge to the river with a decrease in the discharge of
approximately 60% of the pumping rate after only 30 days.
Increasing the distance between the bore and the river to 10 kilometres results in a time lag of
between 80 – 90 days before the effects of pumping are observed at the river. The results
presented here follow a power rule where the time lag for the effects of the bore to be “felt” by the
river is proportional to the square of the distance between the bore and the river.
In the above example the effect of the pumping at 10 km is 80 days
80 days = x * (10)2
Therefore x = 0.8
For the bore at 20 km the expected time for the effect to be observed is:
0.8 * (20)2 = 320 to 360 days

Groundwater Modelling of the Tindall Limestone
Date printed 30 July 2008 Status: FINAL Department of Natural Resources, Environment and The Arts Date Last Modified: 30 July 2008 Page 53
6.2.3 Effects of Current (2004) Licensed Entitlements on Groundwater Discharge to the Katherine River
The first of the pumping scenarios employed by Puhalovich, (2005) has been considered.
Scenario “A” was applied to the model to predict the effect on the end of dry season flows in the
Katherine River. Each scenario was run from 1963 to 2004 with
Scenario “A” considers the current pump licensing as of November 2004
Scenario “B” considers the current pump licensing (Nov. 2004) and includes new applications
These two pumping scenarios were then compared to a “baseline” scenario where no pumping
was applied.
"
Venn HorticulturalSubdivision
KATHERINE
RN040001
RN034125
RN033830
RN033804
RN033728
RN033343
RN033275
RN033263
RN032681
RN032614
RN032417
RN031879
RN031865
RN031746
RN031625
RN031332
RN031105
RN031104RN031068
RN030947
RN030946
RN030697
RN030662
RN030648
RN030493
RN029739
RN029243
RN029217RN028900
RN028879
RN028348
RN027286 RN026360
RN026356
RN026308
RN026142RN026139
RN026083
RN025975RN025974
RN025768
RN025633
RN025434
RN025089
RN024951
RN024868
RN024724
RN023640RN023638
RN022836
RN022487
RN022398
RN022391
RN022286 RN022027RN022025
RN022001
RN021421
RN021170
RN021096
RN005042
RN005032
RN002377
RN001440
0 2 4 6 8 101Kilometres
" TownRoadMajor RoadCreekRiverCadastre
CretaceousGraniteJinduckinTindall
²
Figure 29 Production bore locations for Scenario “B”
6.2.4 Steady State Analysis Scenario “A” Current - (2004) Pumping
The water budget for Scenario “A” is presented compared with the water budget where no pumping
occurs. The steady state model identifies the long term effects that would be expected over the
entire Daly Basin.

Groundwater Modelling of the Tindall Limestone
Date printed 30 July 2008 Status: FINAL Department of Natural Resources, Environment and The Arts Date Last Modified: 30 July 2008 Page 54
Table 3 Steady state water balance for the calibrated model with no pumping and with pumping using Scenario “A”
Water Budget Component
No Pumping [cumecs]
Scenario A [cumecs]
Recharge – Total 10.17 10.17
Discharge - Wells 0.00 0.62
Discharge – Daly River
1.75 1.75
Discharge – Douglas River
2.03 2.03
Discharge – Flora River
1.97 1.96
Discharge - Katherine River
1.15 0.61
Discharge - Roper River
3.22 3.16
Discharge from Cretaceous
0.05 0.04
Imbalance 0 0
To demonstrate the changes in the water budget components the tabulated results are presented
as a bar graph (Figure 30). It can be seen that the greatest impact due to the pumping is to
reduce discharge to the Katherine River, with the balance of the flow reductions observed in the
Roper and Flora Rivers.
Recharge Wells Douglas Flora Katherine RoperWater Balance Component
-5
0
5
10
15
Wat
er F
lux
[cum
ecs]
0.0% 0.8%
47.0%
1.9%
No PumpingScenario A
Steady State Water Balance
Figure 30 Comparison of the steady state water balance components for no pumping and
Scenario “A”.

Groundwater Modelling of the Tindall Limestone
Date printed 30 July 2008 Status: FINAL Department of Natural Resources, Environment and The Arts Date Last Modified: 30 July 2008 Page 55
6.2.5 Transient Analysis of Scenario “A” – 2004 (Current) Pumping
Scenario “A” is the same as that used by Puhalovich, (2005). The initial head distribution for the
simulation employed the Scenario A steady state head conditions (section 6.2.4). The monthly
pumping rates in ML/month as documented by Puhalovich, (2005), were converted to kL/day and
applied to the model over the period 1963 - 2004. The total extraction for this scenario is
19,861 ML/yr (0.63 cumecs), which, is approximately 47% of the average late dry season flows in
the Katherine River.
The results of this scenario are presented in Figure 31.
Jan-
60
Jan-
62
Jan-
64
Jan-
66
Jan-
68
Jan-
70
Jan-
72
Jan-
74
Jan-
76
Jan-
78
Jan-
80
Jan-
82
Jan-
84
Jan-
86
Jan-
88
Jan-
90
Jan-
92
Jan-
94
Jan-
96
Jan-
98
Jan-
00
Jan-
02
Jan-
04
0
0.2
0.4
0.6
0.8
1
Dis
char
ge (c
umec
s)
Total Pump DischargeReduction in River Discharge
0
10
20
30
40
50
% D
iffer
ence
% difference at late dry season low flows% difference between flows
1
10
Dis
char
ge (c
umec
s)
Discharge - No PumpingDischarge - Scenario "A"Late Dry Season Flow
Scenario "A"
Figure 31 Reduction in the dry season flows in the Katherine River due to extraction based on pumping scenario “A”.
6.3 Bore Capture Zones
The bore capture zone is the surface and subsurface area surrounding a water bore or borefield,
through which contaminants are reasonably likely to move toward and reach the water bore or

Groundwater Modelling of the Tindall Limestone
Date printed 30 July 2008 Status: FINAL Department of Natural Resources, Environment and The Arts Date Last Modified: 30 July 2008 Page 56
borefield within a specified period of time. The delineation of well capture zones is a basic
component of ground water protection. The conventional methodology for capture zone
delineation is backward advective particle tracking, often applied under the assumption of a two-
dimensional aquifer.
The particle tracking computation methods are based on the Darcian velocity distributions
determined from the steady state head distribution (Anderson and Woessner, 2002).
lhKVd δ
δε
.=
where
Vd = darcy velocity
K = hydraulic conductivity
ε = specific yield
lh
δδ
= groundwater gradient
This technique can provide point related information about groundwater age in the form of
isochrones, which are often used to delineate well capture zones. It should be noted that particle
tracking simulates advective transport and neglects to include dispersion processes.
The hydraulic head determined from the steady state simulation is independent of porosity,
however, as noted above, to determine the particle track of the plume migration using the Darcy
velocity a specific yield of 0.04 and aquifer thickness of 150 meters were employed.
The simulations have been presented in isochrones (the distance covered by a “particle” for a
given time) to show the migration of multiple water “particles”. The capture zones are presented in
Figure 32 as shaded zones representing 365, 730, 1095, 1460 and 1825 days.
The model developed here is for a homogeneous and isotropic aquifer system, however, the actual
Limestone Aquifer is karstic in nature and preferential pathways are known to exist. It is therefore
expected that the actual capture zones may be much more extensive than those presented.
Statistical analysis of the effects of preferential pathways on the flow paths and travel times could
be investigated with the inclusion of fracture features.

Groundwater Modelling of the Tindall Limestone
Date printed 30 July 2008 Status: FINAL Department of Natural Resources, Environment and The Arts Date Last Modified: 30 July 2008 Page 57
0 1 2 3 4 50.5Kilometres
Production BoresRoadMajor RoadRiverEphemeral Drainage
All Other TenureCommonwealth of AustraliaCrownNorthern Territory of AustraliaPower and Water AuthorityPower and Water Corporation
²
Scenario "A"Isochrone [days]
365
730
1095
1460
1825
Figure 32 Particle tracking isochrones, NTG and Commonwealth land holdings are identified for comparison.

Groundwater Modelling of the Tindall Limestone
Date printed 30 July 2008 Status: FINAL Department of Natural Resources, Environment and The Arts Date Last Modified: 30 July 2008 Page 58
7 Conclusions Initial modeling of the Limestone Aquifer indicates that the conceptual model is largely valid,
however;
• The mapped occurrence of the Limestone Aquifer in the area of the Flora River has been
identified as being incorrect. Initial re-examination of the geological information in the area
indicates that the mapped geology used in the modelling is incorrect.
The regional model has been developed to the level that provides the boundary conditions for the
more detailed modelling in the Katherine study area.
The recharge distribution and the proportionate values proposed within this report are indicated to
be plausible. Improved definition of rainfall distribution over the basin will enable refinement of this
aspect of the model.
The modelling of the development Scenario A indicate the primary effect of groundwater extraction
in the Katherine area is to reduce flows in the Katherine River (refer Table 3).

Groundwater Modelling of the Tindall Limestone
Date printed 30 July 2008 Status: FINAL Department of Natural Resources, Environment and The Arts Date Last Modified: 30 July 2008 Page 59
8 Recommendations It is recommended that the following work is undertaken in terms of data capture to improve
definition and calibration of the model:
• Strategic groundwater monitoring points in the Tindall Limestone are required, this item will be
addressed by the NWI funded project to develop Daly Basin Integrated Hydrologic Model /
Integrated Hydrologic Monitoring Network;
• Locate and measure spring discharges and productive zones along the river;
• Development of a methodology to utilise the model to inform the planning / allocation process.

Groundwater Modelling of the Tindall Limestone
Date printed 30 July 2008 Status: FINAL Department of Natural Resources, Environment and The Arts Date Last Modified: 30 July 2008 Page 60
9 References Anderson, M. P. and Woessner, W. W., (2002), Applied groundwater modelling: simulation of flow
and advective transport, Elsevier (USA)
Diersch, H.-J.G., (2004), FEFLOW® 5.1 Users Manual, WASY - Institute for Water Resources
Planning and System Research, Berlin, Germany.
Freeze, R.A. and Cherry, J.A., (1979), Groundwater, Prentice Hall of Australia Pty. Limited, Sydney
Jolly, P.J., (2002), Daly River Catchment Water Balance, Technical Report No. 10/2002
Jolly, P.J., George, D., Jolly, I., and Z Spiers, (2000), Analysis of Groundwater Fed Flows for the
Flora, Katherine, Douglas and Daly Rivers, Technical Report No. 36/2000
Pidsley, D., (1987), Investigation and Development of Groundwater Irrigation Source for Lot 3252,
Venn Horticultural Subdivision, Power and Water Authority, Water Resources Group,
Technical Report No. 11/1987
Puhalovich, A., (2005), Groundwater Modelling of the Tindall Limestone Aquifer, Report for the
Department of Infrastructure, Planning & Environment (NT), Technical Report No. 02/2005
Tickell, S.J., (2002), Water Resources of the Oolloo Dolostone, NTG Report No. 17/2002
Tickell, S., Cruikshank, S., E Kerle, E. and Willis, G., (2002), Stream Baseflows in the Daly Basin,
Department of Infrastructure, Planning & Environment, (NT), Technical Report No. 36/2002
Tickell, S., (2003), Water Resource Mapping of the Barkly Tablelands, Natural Systems Division
Department of Infrastructure, Planning & Environment (NT), Technical Report No. 23/2003
Water Studies, (2001), Regional Groundwater Impact Modelling, Venn Agricultural Area, Report for
the Northern Territory Land Corporation, Report No. WSDJ00188/DF1
Yin Foo, D., (1985), Katherine Groundwater Investigations 1984, Cretaceous Sediments Near King
River. Water Resources Division, Department of Mines & Energy, Technical Report No.
03/1985.
Yin Foo, D., and Matthews, I., (2001), Hydrogeology of the Sturt Plateau: 1:250,000 Scale Map
Explanatory Notes, Department of Infrastructure, Planning & Environment, Darwin, NT,
Technical REPORT 17/2000D