regional digital economy plan - coastal regional ... digital economy plan august 1, 2014 2 | page...
TRANSCRIPT

REGIONAL DIGITAL ECONOMY PLAN August 1, 2014
1 | P a g e
[This page intentionally left blank.]

REGIONAL DIGITAL ECONOMY PLAN August 1, 2014
2 | P a g e
Table of Figures ............................................................................................................................................................. 4
List of Tables .................................................................................................................................................................. 5
Executive Summary ....................................................................................................................................................... 6
Introduction and Background ......................................................................................................................................... 7
Broadband Defined .................................................................................................................................................... 7
Why Broadband Matters ............................................................................................................................................ 7
Broadband Planning’s Importance to the Coastal Region ......................................................................................... 7
Project Background ................................................................................................................................................... 9
Key Stakeholders....................................................................................................................................................... 9
Digital Economy Planning Team from the CRC Council ............................................................................................ 9
The Planning Process .............................................................................................................................................. 10
Public-Private Partnerships ..................................................................................................................................... 13
Avoiding Conflict Between Public- and Private-Sector Providers ............................................................................ 13
Vision and Goals .......................................................................................................................................................... 14
Vision ....................................................................................................................................................................... 14
Goals ....................................................................................................................................................................... 14
Existing Conditions....................................................................................................................................................... 16
Socioeconomic Conditions ...................................................................................................................................... 17
Demographics ......................................................................................................................................................... 17
Population Density and Projected Growth ............................................................................................................... 22
Employment Growth and Industry Clusters ............................................................................................................. 26
Life Sciences, Medical Services, and Healthcare .................................................................................................... 27
Business Services ................................................................................................................................................... 27
Financial Services.................................................................................................................................................... 27
Logistics and Supply Chain Management................................................................................................................ 27
Construction and Real Estate .................................................................................................................................. 27
Research, Development, and Engineering Services ............................................................................................... 27
Agriculture and Agribusiness ................................................................................................................................... 28
Broadband Assets ........................................................................................................................................................ 28
Wireline .................................................................................................................................................................... 28
Wireless Broadband ................................................................................................................................................ 34
Spectrum Availability for Mobile Broadband ............................................................................................................ 36
Policies and Regulations ......................................................................................................................................... 36

REGIONAL DIGITAL ECONOMY PLAN August 1, 2014
3 | P a g e
Funding Opportunities ............................................................................................................................................. 36
Community Anchor Institutions ................................................................................................................................ 36
Areas of Greatest Broadband Need (Current) ......................................................................................................... 44
GIS Analysis Procedure ........................................................................................................................................... 48
Future Land Use Patterns ........................................................................................................................................ 48
Vision, Goals, Strategies, and Action Items ................................................................................................................. 51
Vision ....................................................................................................................................................................... 51
Strategies ................................................................................................................................................................ 52
Action Items ............................................................................................................................................................. 53
Glossary of Terms ........................................................................................................................................................ 55

REGIONAL DIGITAL ECONOMY PLAN August 1, 2014
4 | P a g e
Table of Figures Figure 1: Planning Process Diagram ........................................................................................................................... 13 Figure 2: Population Growth Rates, 1980-2010 ........................................................................................................... 17 Figure 3: Municipalities in Coastal Region ................................................................................................................... 19 Figure 4: Race and ethnicity, 2010 .............................................................................................................................. 20 Figure 5: Age groups, 2010 .......................................................................................................................................... 20 Figure 6: Educational attainment for persons aged 25 and older, 2010 ....................................................................... 21 Figure 7: Annual unemployment rates, not seasonally adjusted, 2000-2012 ............................................................... 21 Figure 8: Median household income, 2010 .................................................................................................................. 22 Figure 9: Percent of the population living below the poverty threshold, 2010 .............................................................. 22 Figure 10. Population Density, 2010 ............................................................................................................................ 23 Figure 11. Coastal Region’s actual and projected population, 1980-2040 ................................................................... 24 Figure 12. Projected percent change in population per square mile by county, 2010-2030 ......................................... 25 Figure 13. Commercial wireline broadband coverage by service type ......................................................................... 29 Figure 14: Wireline broadband mapped by provider .................................................................................................... 30 Figure 15: Commercial Wireline Broadband: Maximum Advertised Download Speeds ............................................... 32 Figure 16: Wireless broadband providers .................................................................................................................... 35 Figure 17: Locations of Reponses by CAI’s with Connection Type .............................................................................. 38 Figure 18: Reported Download Speeds for Survey Response Locations .................................................................... 39 Figure 19. Colleges and Universities ........................................................................................................................... 41 Figure 20: Healthcare Facilities .................................................................................................................................... 43 Figure 21: Estimated broadband connections per 1,000 households (C) .................................................................... 46 Figure 22: Areas of Greatest Broadband Need ........................................................................................................... 47 Figure 23: Future Land Use ......................................................................................................................................... 49

REGIONAL DIGITAL ECONOMY PLAN August 1, 2014
5 | P a g e
List of Tables Table 1. Coastal Region Population Growth, 2000-2010 ............................................................................................... 8 Table 2: Data for Broadband Planning ......................................................................................................................... 11 Table 3: Populations of Municipalities in Coastal Region, 2010 ................................................................................... 17 Table 4: Changes in Employment by Industry, 2000 to 2010 ....................................................................................... 26 Table 5: Broadband Applications with Typical Speed Ranges Required ..................................................................... 33 Table 6: List of Survey Respondents and Locations .................................................................................................... 37 Table 7: Generalized FLU Category Descriptions ........................................................................................................ 50 Table 8: Goals, Strategies, and Action Items ............................................................................................................... 51

REGIONAL DIGITAL ECONOMY PLAN August 1, 2014
6 | P a g e
Executive Summary [This is a placeholder for the Executive Summary, which will be written after the initial review of the draft plan.]

REGIONAL DIGITAL ECONOMY PLAN August 1, 2014
7 | P a g e
Introduction and Background Broadband Defined
According to the definition in the National Broadband Plan, the term broadband refers to “high-speed Internet access that is always on and faster than the traditional dial-up access.”1 Broadband provides higher speeds of data transmission, access to high-quality internet services such as streaming media and interactive services, uninterrupted access that does not block phone lines, and less delay in transmission than dial-up access. From health care to education, public safety to commerce, broadband networks have the potential to dramatically change, enhance, and transform the way we live, work, and play.
Why Broadband Matters
Throughout history, infrastructure networks have served to connect people, places, ideas and products. The development of every great infrastructure network has facilitated American innovation, progress and prosperity. Before the 1800s, port cities were the world’s economic and educational hubs. In the 19th century, the transcontinental railroad system allowed people, goods and ideas to branch out into new territories, creating new opportunities and encouraging entrepreneurship and prosperity. The 20th century saw the development of large scale electric grids and the interstate highway system—innovations that, once again, allowed Americans to be more productive, mobile and opportunistic. Similarly, communications infrastructure—telephony, radio and television—also transformed the American economy and culture. In many ways, the development of the internet at the end of the 20th century represented the culmination of these communication technologies.
As stated by Julius Genachowski, Chairman of the Federal Communications Commission, “Broadband is the indispensable infrastructure of our 21st century economy.”2 Communities and regions that develop their broadband infrastructure will have better, faster access to new ideas, innovations, and technologies. Being connected means having more and better jobs, a stronger educational system, a more efficient government, more effective public safety and health care providers, and a higher quality of life. Planning now to ensure that Coastal Region’s future broadband infrastructure needs will be met is essential for sustainable economic development and prosperity within the region.
Broadband Planning’s Importance to the Coastal Region
Like many areas, Coastal Region’s major industries have become more dependent on technology. Furthermore, there is a wide variety of industries due to the fact that some counties are located further inland than others. The economies of the inland counties are more based around agribusiness and manufacturing, and in Bulloch County’s case, education. The six counties located on the Atlantic coast have economies based more on tourism, logging, seafood, and port transportation.3 Although partly the effect of the global recession that began in 2008, there is also a general shift in employment in the United States away from goods-producing industries toward service-providing industries. As employment continues to shift toward industries that require more advanced technological skills and more connectivity, an up-to-date broadband network will be essential for securing economic opportunities and preserving quality of life in the region. Additionally, industries that traditionally have not utilized broadband are
1 Federal Communications Commission. “What is Broadband?” http://www.broadband.gov/about_broadband.html 2 Federal Communications Commission. “Genachowski Remarks On Plan To Create 100,000 Jobs.” http://www.fcc.gov/document/genachowski-remarks-plan-create-100000-jobs 3 Bureau of Labor Statistics. Employment data. http://www.bls.gov/data/

REGIONAL DIGITAL ECONOMY PLAN August 1, 2014
8 | P a g e
becoming more dependent on it. For example, in the agribusiness industry, mobile devices with broadband connections are used for purposes such as logging worker hours and tracking vehicle locations.
Coastal Region is geographically large, (5,863 square miles), and consists of ten counties including urban, suburban, and rural areas, 35 municipalities of varying population, and large areas of very low population density. Planning is essential for any region with such a wide variety of development patterns, in order to ensure that all populations—rural, suburban, and urban—have equitable access to infrastructure and services. In addition, planning is important for any region with a large number of jurisdictions, in order to encourage cooperation and collaboration between them.
With the exception of metropolitan Atlanta, the Coastal Region has experienced the most rapid population growth in the state over the past decade. From 2000 to 2010, Coastal Region’s population grew by 17.3 percent, compared to 18.3 percent for the State of Georgia4 (see Table 1). This pattern of growth is projected to continue in Coastal Region, especially considering that seven of the ten counties of Coastal Region are included in one of the three metropolitan statistical areas: Savannah, Brunswick, and Hinesville-Fort Stewart. When growth occurs as rapidly as it has in Coastal Region, sound planning, including broadband planning, is essential for preserving quality of life and opportunities for all people.
Table 1. Coastal Region Population Growth, 2000-2010 2000 2010 Percent Change 2000-2010 Bryan County 23,417 30,233 29.1% Bulloch County 55,983 70,217 25.4% Camden County 43,664 50,513 15.7% Chatham County 232,048 265,128 14.3% Effingham County 37,535 52,250 39.2% Glynn County 67,568 79,626 17.8% Liberty County 61,610 63,453 3.0% Long County 10,304 14,464 40.4% McIntosh County 10,847 14,333 32.1% Screven County 15,374 14,593 -5.1% Total for Coastal Region 558,350 654,810 17.3% Georgia 8,186,453 9,687,653 18.3%
There are numerous institutions of higher education in Coastal Region, granting undergraduate and graduate degrees: Armstrong Atlantic State University, College of Coastal Georgia, Georgia Southern University, Savannah College of Arts and Design, Savannah State University, other technical colleges, as well as satellite campuses of larger universities. Education is critical to quality of life, and broadband is critical to education. Broadband planning is necessary to ensure that the educational institutions in the county (not only the colleges and universities, but also K-12 schools) have access to the best bandwidth possible.
As such, the region has considerable potential to develop and sustain a vibrant economy and a world-class quality of life. However, sound infrastructure planning is necessary for the county to live up to this potential, adapt to economic changes, and keep up with the anticipated growth. 4 U.S. Census Bureau American FactFinder. http://factfinder2.census.gov/faces/nav/jsf/pages/index.xhtml

REGIONAL DIGITAL ECONOMY PLAN August 1, 2014
9 | P a g e
Project Background
Broadband Digital Economy is a collaborative broadband planning effort involving the Coastal Region’s citizens, business leaders, local governments, civic organizations, non-profits, educational institutions, economic development professionals, high tech experts, and key representatives from various segments of the local economy. Facilitated cooperatively Coastal Regional Commission, the Broadband CRC Advisory Committee is working to raise awareness of the importance of robust broadband infrastructure in the 21st century economy and to develop a comprehensive broadband plan to address the current and future broadband needs of Coastal Region. The plan’s time horizon is the year 2020. Broadband Digital Economy also includes an organization of citizens from across the Coastal Region, led by private, public, and civic leaders, committed to addressing critical issues facing the community and developing a common purpose. The CRC works to cultivate a sense of community that fosters diversity, innovation, and pride in the Coastal Region while emphasizing a sense of place and recognizing the many physical assets and unique cultures of the area.
Key Stakeholders
• Broadband providers • Businesses • Citizens of the Coastal Region • Colleges and universities • Economic development organizations • Healthcare facilities • Libraries • Local governments • Public safety departments (police and fire) • Schools (K-12, public and private, vocational) • Utility companies
Digital Economy Planning Team from the CRC Council
County First Name Last Name Title (if applicable)
Bryan County Sean Register
Bulloch County Walter Gibson Chairman
Camden County Craig Root
Chatham County Edna Jackson Mayor of Savannah
Effingham County Reggie Loper Chairman
Glynn County Shaw McVeigh
Liberty County Jim Thomas Mayor of Hinesville
Long County Robert Long
McIntosh County Kelly Spratt Chair
Screven County Margaret Evans Mayor of Sylvania

REGIONAL DIGITAL ECONOMY PLAN August 1, 2014
10 | P a g e
The Planning Process
In general terms, comprehensive planning is an all-inclusive effort to guide the long-range future of a community, with a focus on physical development. A comprehensive plan typically consists of a study of existing conditions and a discussion of future trends, goals, and objectives, covering elements such as land use, housing, roadways and other infrastructure, population growth, economic development, and conservation.5 In addition to having a comprehensive plan, many communities have separate plans for specific elements (for example, many cities have transportation plans). The comprehensive planning process is the set of actions that are performed in order to complete the plan; this typically includes data collection, data analysis, goal setting, citizen and stakeholder participation, writing the final plan, and evaluation the effort in retrospect.
The Coastal Region Broadband Plan was developed following a Broadband Demand Planning Process that was established as part of the Local/Regional Broadband Planning Toolkit and Training Manual. The process has four major steps: Identification of community champions, data collection, needs analysis, and plan creation. The steps are described in detail in this section.
1. Identify Community Champion(s) a. Utilize an existing community organization
Or b. Form a broadband committee
Or c. Both
A community or regional broadband planning effort will require the dedication of an organization or group of individuals who are committed to the effort of planning for their region’s future broadband needs. These people will be the “Champions” of the effort. An existing community organization may be utilized or a committee of broadband experts and influential community leaders may be formed. In some cases it may be appropriate to utilize both a community organization and a broadband committee. The goal is to bring together a diverse group of individuals, from both the public and the private sector, who care about broadband planning and have sufficient time and expertise to commit to the project.
1. Data Collection i. Community profile ii. Assets analysis iii. Broadband utilization/penetration
2. Surveys 3. ii. Discussion Guides 4. iii. Interviews 5. iv. Federal Communication Commission broadband data
i. Projections ii. Population iii. Employment
5 John B. Conglose. Ohio State University Comprehensive Planning Fact Sheet. http://ohioline.osu.edu/cd-fact/1269.html

REGIONAL DIGITAL ECONOMY PLAN August 1, 2014
11 | P a g e
The data collection step involves acquiring the data necessary for broadband planning. This includes not only broadband coverage data, but also a community profile containing background data regarding the demographic, economic, and social characteristics of the region. Such data are generally available from federal sources such as the U.S. Census Bureau and from state sources such as the Department of Economic Opportunity. GIS data are available from the U.S. Census Bureau’s Tiger site and from local jurisdictions, various state agencies, and federal sources. Table 2 outlines the basic data necessary for broadband demand planning, where to find it, and how it will be utilized.
Table 2: Data for Broadband Planning Data Source Data Utilization
• Socioeconomic data (age, race, income, education, employment)
• U.S. Census Bureau • Bureau of Labor
Statistics • Bureau of Economic
and Business Research
Data will be used to gain an understanding of the general socioeconomic characteristics of the region in order to provide background for the broadband planning project.
• Business and population growth projections
• Local/regional planning agencies/departments
• Bureau of Economic and Business Research
Projected future business and population growth will be a factor in estimating future broadband needs.
• Future Land Use • Local governments • Regional Planning
Councils
Used to project future broadband needs; can be included in a land-use-based broadband demand model.
• Community anchor institutions, employment clusters, and target industries
• Local/regional planning agencies/departments
• Economic development organizations
• Regional Planning Councils
Community anchor institutions, employment clusters, and target industries are the region’s main large-scale current and future broadband users. Identifying them will be helpful for the assessment of current and future broadband needs.
• Broadband assets inventory (wireline, wireless, vertical assets, providers, public-owned spectrums, policies and regulations, funding opportunities)
• National Broadband Map project
• Local broadband providers
• Local government entities (school boards, etc.)
The region’s existing broadband assets form the core network on which to build future broadband infrastructure. Reviewing these assets is an important step in defining broadband planning resources and strategies.
• Broadband utilization/penetration data (residential and non-residential) (speeds, applications, cost)
• Future broadband needs
• Surveys • Focused
discussions/interviews • Public workshops • Economic development
groups
Current utilization and penetration data and projections of future utilization will be used to identify appropriate strategies for the planning project.

REGIONAL DIGITAL ECONOMY PLAN August 1, 2014
12 | P a g e
(residential and non-residential)
• Federal Communication Commission
3. Needs Analysis a. Gap identification
i. Current gaps ii. Future gaps
The Needs Analysis identifies gaps between broadband supply and demand—in other words, areas within a community or region where the current broadband availability does not meet current needs, or is anticipated not to meet future needs. The information collected in the Needs Analysis should be analyzed to determine where broadband infrastructure will be required within the planning period (10 years is suggested). Geographic areas of need can be identified using the following parameters:
• Projected population growth • Projected employment growth • Future land use (land-use-based broadband demand model) • Known locations with current or predicted future broadband deficiencies • Broadband adoption (use) data
Additionally, analysis should be conducted to identify need within employment sectors, industries and people groups. For example, it may be noted from the data that the health care industry is projected to grow tremendously within the planning area. As a heavy user of broadband infrastructure, this growth must be accommodated in the broadband plan. As another example, it may be noted from the surveys that people with household incomes below the poverty level typically do not utilize broadband in the home. Therefore, the plan may outline some strategies to increase broadband usage within that demographic.

REGIONAL DIGITAL ECONOMY PLAN August 1, 2014
13 | P a g e
Figure 1: Planning Process Diagram
4. Plan Creation a. Vision b. Goals c. Strategies d. Implementation e. Evaluation
The basic framework of the strategic broadband plan is similar to that of plans for other types of infrastructure. The Vision is the framework for the community/region and its development and utilization of broadband. Goals are developed to guide the community/region in the direction of its Vision. Strategies are specific methods to achieve the identified Goals. Implementation means putting the strategies into effect (the action phase of the plan). Evaluation is concerned with looking back at what strategies were effective and what strategies were not. The Evaluation is used to identify failed efforts and eliminate or modify them to make the plan more effective over time.
Public-Private Partnerships
Public-private partnerships are indispensable to the future of broadband in Coastal Region. In most communities and regions, government (federal, state, or local) is generally responsible for overseeing and regulating infrastructure, while broadband service is mostly provided by private companies in competition with one another. It is vital for government and the private sector to cooperate and collaborate with each other in order for new and improved broadband infrastructure to be put in place. Although no municipal broadband networks have yet been developed in the Coastal Region, several nearby Georgia cities, like Tifton, Dublin, and Sandersville do provide such networks.6
Avoiding Confl ict between Public- and Private-Sector Providers 6 Institute for Local Self-Reliance. “Community Broadband Networks.” http://www.muninetworks.org/communitymap

REGIONAL DIGITAL ECONOMY PLAN August 1, 2014
14 | P a g e
Municipal broadband networks have the potential to provide high-quality, affordable broadband service to homes, businesses, and anchor institutions. Municipal broadband has been endorsed by the FCC as a “best practice.”7 Luckily, Georgia’s regulations of municipal broadband are very loose, as indicated by the 2013 defeat of a house bill that would have restricted some cities from offering public broadband.8 Despite some opposition to municipal broadband, rather than “crowding out” private investment, the reality has shown that where municipalities invest in broadband, there are more private providers of broadband services. Municipalities frequently sell services to private communications firms, resulting in a symbiotic environment that benefits both consumers and the private sector. In addition, municipal broadband networks generally do not rely on tax exemptions or subsidies to any greater extent than private providers, and their tax burden is similar to that of private telecom firms.9 Generally speaking, broadband deployment by any entity—public or private—should be encouraged in order to spur economic development, expand educational opportunities, and provide all the other benefits that come with broadband access.
The keys to avoiding conflict between public- and private-sector providers are communication and cooperation. Properly coordinated public and private broadband investment can exist side-by-side, benefitting one another, and the community at large.
Vision and Goals At the start of the planning process, it is important to establish a vision that describes what the plan is intended to accomplish, and goals that state specific things to be achieved. Normally, the visions should be broad and qualitative, while the goals should be specific and quantitatively measurable. This section contains the vision and goals of the Coastal Region Broadband Plan.
In a typical planning process, the goals that are set will require significant amounts of time and resources to achieve. Therefore, creative and strategic thinking is necessary in order to devise ways to achieve challenging goals while making optimal use of resources. To guide the implementation of goals, it is helpful to develop strategies. These strategies are described in Section 7. The strategies are accompanied by specific action items that will be undertaken by those who will implement the plan, in order to close identified current and future gaps in broadband coverage and to fulfill the vision and goals of the plan.
Vision
Broadband Digital Economy's vision is to facilitate increased opportunity, innovation, and efficiency by ensuring that every individual, corporation, non-profit, visitor, government entity, and community partner in Coastal Region has access to affordable high-speed internet service.
Goals
Broadband Digital Economy has six established goals, listed below in order of priority.
7 Federal Communications Commission. “Deployment of Advanced Telecommunications Capability: Second Report.” http://transition.fcc.gov/Bureaus/Common_Carrier/Orders/2000/fcc00290.pdf 8 WTOC Savannah. “Municipal broadband bill shot down by state house.” http://www.wtoc.com/story/21551038/municipal-broadband-bill-shot-down-by-state-house 9 “The Case for Municipal Broadband in Florida,” p. 4.

REGIONAL DIGITAL ECONOMY PLAN August 1, 2014
15 | P a g e
1. Anchor Institutions such as schools, hospitals, libraries, and government buildings will have affordable access to a minimum of 1 gigabit per second broadband services.
This goal is intended to emphasize the importance of anchor institutions in our communities and the enhanced services that they can provide to communities given the best broadband service possible. From improved internet access at libraries to streamlined medical care and more efficient government services, better broadband can transform the way anchor institutions serve communities. The full NTIA definition of community anchor institutions is “schools, libraries, medical and healthcare providers, public safety, community colleges and other institutions of higher education, and any other community support organizations and entities that facilitate greater use of broadband services.”
2. Every resident of Coastal Region will have access to affordable high-speed internet services and the skills to utilize it, if they choose.
This goal emphasizes the combination of access and skills. Currently, not all areas of the Coastal Region have high quality, affordable internet services. At the same time, not all residents of the county have access to high-quality, affordable computer training. In order to maximize the potential positive impact of broadband for the county’s residents, training opportunities should be made available for those residents who wish to acquire the skills necessary to utilize broadband. At the same time, competition among providers should be increased and alternatives offered so that all residents who wish to include broadband in their household budgets can do so.
3. Anchor Institutions (including energy providers) will maximize utilization of broadband services and technologies in order to increase efficiency, maximize resources, and provide the best services possible to the businesses and residents of Coastal Region.
This goal places emphasis upon the necessity for anchor institutions to make the best use possible of broadband. Even the fastest broadband connections in the world are useful only when those who are connected utilize them effectively. If community anchor institutions increase their efficiency and maximize the resources they provide, they will be able to provide better services to the community, using technology to improve many aspects of life.
4. Every business and non-profit in Coastal Region will have access to affordable high-speed internet services and the skills to utilize it, if they choose.
This goal goes hand in hand with goal #2. In terms of broadband, what will be beneficial for residents will also be beneficial for businesses; and at the same time, high quality training is needed in order for workers to develop the new skillsets that enable them to maximize use of broadband technology.
5. Coastal Region will have the fastest, most affordable, and most accessible mobile networks possible.
This goal relates to the mobile sector of broadband. Mobile broadband connections are important in many sectors, from agriculture (where machinery and personnel are often

REGIONAL DIGITAL ECONOMY PLAN August 1, 2014
16 | P a g e
managed through mobile broadband connections) to the office environment (where workers often use mobile broadband to stay connected during meetings). A cutting-edge mobile network will allow people in the county to stay connected in any place, at any time.
6. 192,000 households (79% of households) in Coastal Region will have affordable access to actual download speeds of at least 100 megabits per second and actual upload speeds of at least 50 megabits per second.
This goal mirrors the national long-term goal set forth in the National Broadband Plan: “At least 100 million U.S. homes should have affordable access to actual download speeds of at least 100 megabits per second and actual upload speeds of at least 50 megabits per second.”10 The goal was adjusted for Coastal Region based on the total number of households projected for the year 2020. Since 100 million represents approximately 79 percent of homes in the United States, an equivalent figure was calculated for Coastal Region.
Goal prioritization and strategy development are the result of a collective effort by the Digital Economy Planning team, The Georgia Coastal Regional Commission planning staff, and the public.
Existing Conditions Coastal Region is located in the easternmost part of the State of Georgia, comprising all six coastal counties and a few inland counties to the north. It is a large region geographically (with a land area of 5,863 square miles) but smaller in terms of population (654,810 as of the 2010 Census). 11
Coastal Region contains areas that are urban, suburban, and rural in nature. The largest city is Savannah (population 136,286 as of the 2010 Census). 79 percent of the population resides within the Census-designated Savannah, Hinesville-Fort Stewart, and Brunswick Metropolitan Areas, which include several smaller communities in addition to their principal cities, some of which are more rural in nature. Bulloch, Camden, and Screven counties are the only three not included in any metropolitan area.
Large areas of Coastal Georgia are considered Regionally Important Resources by the Department of Natural Resources, meaning that the areas are set aside for conservation and protection from further development.12 There are five main rivers that empty into the Atlantic Ocean in this region: the Savannah River, Ogeechee River, Altamaha River, Satilla River, and St. Marys River. Large swaths of land bordering these rivers are now protected wetlands and marshes. Furthermore, the Georgia barrier islands are all at least partially made up of conservation areas. Only Tybee Island, Saint Simons Island, and Jekyll Island area accessible by automobile and thus contain significant development. Due to Coastal Georgia being the earliest settled region of the state in colonial times, there are also many areas and parks protected for historical reasons.
10 Federal Communications Commission. National Broadband Plan Executive Summary. http://www.broadband.gov/plan/executive-summary/ 11 United States Census Bureau, “State & County QuickFacts” (http://quickfacts.census.gov/qfd/index.html). 12 Georgia Dept of Community Affairs, “Regionally Important Resources” http://www.dca.state.ga.us/development/planningqualitygrowth/programs/rir.asp

REGIONAL DIGITAL ECONOMY PLAN August 1, 2014
17 | P a g e
Socioeconomic Conditions
Demographics
According to 2010 Census Bureau estimates, Coastal Region’s population is 654,810. Like much of Georgia, Coastal Region has experienced considerable population growth in the last few decades. Population growth has been consistently higher than the national growth rate, and comparable to Georgia’s population growth as a whole (see Figure 2).
Figure 2: Population Growth Rates, 1980-2010 Data source: U.S. Census Bureau
There are 35 municipalities in Coastal Region. The municipalities and their populations as of the 2010 Census are listed in Table 3. Their locations are shown in Figure 3.
Table 3: Populations of Municipalities in Coastal Region, 2010
Data source: U.S. Census Bureau
Municipality 2000 Population 2010 Population Percent Change, 2000-2010 Allenhurst 788 695 -11.8%
Bloomingdale 2,665 2,713 1.8% Brooklet 1,113 1,395 25.3%
Brunswick 15,600 15,383 -1.4% Darien 1,719 1,975 14.9%
Flemington 369 743 101.4% Garden City 11,289 8,778 -22.2% Gumbranch 273 264 -3.3%
Guyton 917 1,684 83.6% Hiltonia 421 342 -18.8%
Hinesville 30,392 33,437 10.0% Kingsland 10,506 15,946 51.8% Ludowici 1,440 1,703 18.3%
0.0%
5.0%
10.0%
15.0%
20.0%
25.0%
30.0%
1980-1990 1990-2000 2000-2010
Coastal RegionGeorgiaUSA

REGIONAL DIGITAL ECONOMY PLAN August 1, 2014
18 | P a g e
Midway 1,100 2,121 92.8% Newington 322 274 -14.9%
Oliver 253 239 -5.5% Pembroke 2,379 2,196 -7.7%
Pooler 6,239 19,140 206.8% Portal 597 638 6.9%
Port Wentworth 3,276 5,359 63.6% Register 164 175 6.7% Riceboro 736 809 9.9%
Richmond Hill 6,959 9,281 33.4% Rincon 4,376 8,836 101.9%
Rocky Ford 186 144 -22.6% Savannah 131,510 136,286 3.6% Springfield 1,821 2,852 56.6% Statesboro 22,698 28,422 25.2% St. Marys 13,761 17,121 24.4% Sylvania 2,675 2,956 10.5%
Thunderbolt 2,340 2,668 14.0% Tybee Island 3,392 2,990 -11.9% Vernonburg 138 122 -11.6%
Walthourville 4,030 4,111 2.0% Woodbine 1,218 1,412 15.9%
Unincorporated 270,688 321,600 18.8%

REGIONAL DIGITAL ECONOMY PLAN August 1, 2014
19 | P a g e
Figure 3: Municipalities in Coastal Region
Data source: CRC

REGIONAL DIGITAL ECONOMY PLAN August 1, 2014
20 | P a g e
As of 2010, Coastal Region’s population was 66.8 percent White; 28.9 percent Black; 1.4 percent Asian; 0.5 percent American Indian and Alaska Native; 0.2 percent Native Hawaiian and Other Pacific Islander; and 2.3 percent reporting two or more races. Hispanic or Latino of any race made up 5.7 percent of the population. (See Figure 4).
Figure 4: Race and ethnicity, 2010 Data source: U.S. Census Bureau
As of the 2010 Census, 16.4 percent of Coastal Region’s population was over age 65 and 19.8 percent was under age 18. Measured in these categories, Coastal Region has a proportionally larger youth population when compared to Georgia and the United States, as well as a proportionally smaller senior population than Georgia and the United States (see Figure 5).
Figure 5: Age groups, 2010
Data source: U.S. Census Bureau According to the Census Bureau’s 2011 three-year American Community Survey estimates, 14.7 percent of Coastal Region’s population age 25 and older lacks a high school diploma, and 20.4 percent have a bachelor’s degree or higher degree (see Figure 6). Compared to the United States and Georgia, Coastal Region has a comparable proportion of adults lacking a high school diploma and a smaller proportion holding a tertiary degree.
0% 20% 40% 60% 80% 100%
United States
Georgia
Coastal Region White
Black
Asian
American Indian and Alaska Native
Native Hawaiian and Other PacificIslanderPersons reporting two or more races
19.8% 6.8% 6.4%
63.8%
68.1% 70.1%
16.4% 25.1% 23.5%
0%
10%
20%
30%
40%
50%
60%
70%
80%
90%
100%
Coastal Region Georgia USA
Age 65+Age 18-64Under 18

REGIONAL DIGITAL ECONOMY PLAN August 1, 2014
21 | P a g e
Figure 6: Educational attainment for persons aged 25 and older, 2010
Data source: U.S. Census Bureau
According to the Bureau of Labor Statistics, the annual unemployment rate in Coastal Region in 2012 was 9.2 percent, up from 4.2 percent in 2006 (see Figure 7). In the years before the 2008 recession, Coastal Region’s unemployment was slightly lower than that of Georgia or the US. Since 2010, however, Coastal Region has had a comparable unemployment rate compared to Georgia and the US.
Figure 7: Annual unemployment rates, not seasonally adjusted, 2000-2012
Data source: Bureau of Labor Statistics
According to 2011 three-year Census estimates, the median household income in Coastal Region was $46,945 (see Figure 8).
14.7%
15.6%
14.3%
64.9%
56.8%
57.2%
20.4%
27.8%
28.5%
0% 20% 40% 60% 80% 100%
Coastal Region
Georgia
USA
No HS DiplomaHS Diploma onlyBachelor's Degree or higher
0.0%
2.0%
4.0%
6.0%
8.0%
10.0%
12.0%
2000 2001 2002 2003 2004 2005 2006 2007 2008 2009 2010 2011 2012
Coastal RegionGeorgiaUSA

REGIONAL DIGITAL ECONOMY PLAN August 1, 2014
22 | P a g e
Figure 8: Median household income, 2010
Data source: U.S. Census Bureau 18.5 percent of the population and 27.1 percent of those under 18 were living in poverty, according to the same estimates. Coastal Region and Georgia as a whole have a higher poverty rates than the United States (see Figure 9).
Figure 9: Percent of the population living below the poverty threshold, 2010
Data source: U.S. Census Bureau Population Density and Projected Growth
Figure 10 shows the population density by census block in the county, in terms of the number of residents per square mile. The areas of higher population density correspond roughly to the areas that are incorporated into municipalities, especially areas near Statesboro, Savannah, Hinesville, Brunswick, Kingsland and St. Marys.
$46,945 $49,604 $53,046
$0
$10,000
$20,000
$30,000
$40,000
$50,000
$60,000
Coastal Region Georgia United States
0% 10% 20% 30%
United States
Georgia
Coastal Region
All People
Under 18

REGIONAL DIGITAL ECONOMY PLAN August 1, 2014
23 | P a g e
Figure 10. Population Density, 2010 Data Source: U.S. Census Bureau

REGIONAL DIGITAL ECONOMY PLAN August 1, 2014
24 | P a g e
Population projections are provided by ProximityOne. Given the level of projected growth, the Coastal Region is expected to gain over 400,000 new residents between 2010 and 2060, which means the rate of growth will be significantly higher than what was observed between 1980 and 2010. (see Figure 11).
Figure 11. Coastal Region’s actual and projected population, 1980-2040
Data source: Bureau of Economic and Business Research Figure 12 shows the projected percent change in population per square mile for each county in the Coastal Region from 2010 to 2030. Most counties in the region are expected to see growth rates of over 40% by 2030, and only McIntosh County is expected to see a drop in population.
0
200000
400000
600000
800000
1000000
1200000
1400000
1980 1990 2000 2010 2030 2060
Population
Population

REGIONAL DIGITAL ECONOMY PLAN August 1, 2014
25 | P a g e
Figure 12. Projected percent change in population per square mile by county, 2010-2030 Data source: ProximityOne

REGIONAL DIGITAL ECONOMY PLAN August 1, 2014
26 | P a g e
Employment Growth and Industry Clusters
The Coastal Georgia Comprehensive Economic Development Strategy reports the results from surveys to track changes in employment over time. As expected, certain industries have expanded in terms of quantity of employees and others have shrunk. Table 5 lists changes in employment by industry between 2000 and 2010.
Table 4: Changes in Employment by Industry, 2000 to 2010 Data source: Coastal Georgia Comprehensive Economic Development Strategy
There is a definite trend shift towards increased employment in the education, health services, public administration, and leisure and hospitality industries and away from the manufacturing, construction, natural resources, and mining industries in the region. Therefore, it is important to focus on providing reliable up-to-date broadband service to establishments involved in these ever-growing industries.

REGIONAL DIGITAL ECONOMY PLAN August 1, 2014
27 | P a g e
Life Sciences, Medical Services, and Healthcare
This field, especially medical services, is a growing industry in the Coastal region. Broadband applications for medical services include telemedicine and data management. Telemedicine allows some medical services to be provided at a distance. Patient assessment and other forms of clinical healthcare can be provided remotely, allowing multiple physicians to diagnose, collaborate, and determine treatment in a shorter amount of time. Telemedicine requires the sharing of data and images, as well as real-time interactive communication. Broadband is necessary for this, and the use of telemedicine is expected to increase.
Business Services
Business services that utilize broadband include data management, communication, and many information technology applications. For example, broadband can be used to conduct remote videoconferencing and data sharing between separate branches of a business. Remote computer access is also crucial for IT support applications.
Financial Services
Some applications of broadband in financial services include electronic fund transfers, communication between financial institutions, and online banking. When funds are being transferred, instant or near-instant communication between financial institutions is desirable in order to avoid errors. Online banking also has positive implications for the residents of any given region, allowing them to better manage their finances.
Logistics and Supply Chain Management
Broadband is used in logistics and supply chain management to communicate between transportation hubs and vehicles, coordinate the movement of goods, and keep track of inventories. Broadband connectivity can greatly increase efficiency in these industries. For example, the movement of freight through an intermodal transportation facility can be made more efficient when data are available regarding what shipments are in which location. The existence of two major Atlantic coast ports in the Coastal Region (Brunswick and Savannah) makes reliable broadband service critical to the region.
Construction and Real Estate
The construction industry and real estate business may have suffered losses due to the economic downturn beginning in 2008, and may have fewer employees involved, but they will still require reliable broadband service in the coming years. Applications of broadband for construction and real estate include the sharing of construction plans, project coordination and scheduling, budget management, and general communication. In addition, broadband is important for marketing purposes in the real estate industry, and may be necessary for electronic permitting processes in some areas.
Research, Development, and Engineering Services
Broadband access is important for research because it provides instant access to needed information. For example, given a high bandwidth, universities where research is conducted can share library resources and research databases instantly, either between branches of a single university or between multiple universities. The same is true for engineering services.

REGIONAL DIGITAL ECONOMY PLAN August 1, 2014
28 | P a g e
Agriculture and Agribusiness
Broadband has become very important for agriculture in recent years. When food production takes place on a large scale, broadband connectivity allows for better coordination in the field; for example, agricultural machinery can communicate with each other to track which areas have been planted. The same is true for the application of fertilizer and pesticides, and for harvesting. Broadband access also allows the products of agriculture to be tracked in the supply chain. Inventories and shipments of produce and/or livestock can be tracked and coordinated, helping to avoid post-harvest loss and other inefficiencies.
Maximizing the use of broadband across these target industries in Coastal Region will expand economic opportunities, encourage innovation, and improve efficiency by allowing for optimal connectivity between all sectors of business and making the best use possible of the newest technology available.
Broadband Assets Wireline
For households and businesses, broadband connections via fiber, cable, and DSL are commercially available throughout much of the region. Measured by land area, approximately 8.6 percent of the region has cable broadband coverage, 39.4 percent has DSL available, and 25.6 percent has fiber coverage available. Measured by census block, an estimated 15,572 people in Coastal Region live outside areas covered by commercial wireline broadband service (fiber, cable, or DSL), comprising about 2.38 percent of the population. Approximately 79,000 people (12.1 percent of the population) live in areas where fiber broadband connections are commercially available. Approximately 115,000 people (17.6 percent of the population) live in areas where cable broadband is commercially available.
Figure 13 shows commercial wireline coverage by service type. Fiber, cable, and DSL coverage overlap in many areas. The map shows areas where service types overlap with the color of the fastest service type on top (i.e., fiber, followed by cable, then DSL). Figure 14 shows commercial wireline coverage by provider. It is important to note that many areas are covered by two or more broadband providers.

REGIONAL DIGITAL ECONOMY PLAN August 1, 2014
29 | P a g e
Figure 13. Commercial wireline broadband coverage by service type Data source: Coastal Regional Commission

REGIONAL DIGITAL ECONOMY PLAN August 1, 2014
30 | P a g e
Figure 14: Wireline broadband mapped by provider
Data source: CRC

REGIONAL DIGITAL ECONOMY PLAN August 1, 2014
31 | P a g e
Figure 15 shows the maximum advertised download speeds available from commercial wireline broadband providers. Table 6 lists the typical download speed ranges required for a variety of broadband applications.

REGIONAL DIGITAL ECONOMY PLAN August 1, 2014
32 | P a g e
Figure 15: Commercial Wireline Broadband: Maximum Advertised Download Speeds
Data source: CRC

REGIONAL DIGITAL ECONOMY PLAN August 1, 2014
33 | P a g e
Table 5: Broadband Applications with Typical Speed Ranges Required13 Range Application Range Application 500 kbps - 1 mbps Text Messaging (SMS) 5 mbps - 100
mbps Remote Education / Online Classes
500 kbps - 1.5 mbps
Audio Streaming Email (Basic)
Video (Low Definition/YouTube) Voice Over Internet Protocol (VOIP)
10 mbps - 100 mbps
Gaming (Complex) IPTV (High Definition)
Remote Surveillance (HD) Smart/Intelligent Building Control
Telecommuting (High Quality Video) Telemedicine (Basic)
Telepresence (High Quality) 500 kbps - 4 mbps Web Browsing (Basic) 25 mbps - 100
mbps Smart/Intelligent Building Control 500 kbps - 5 mbps Music streaming 50 mbps - 100
mbps Video Conferencing (Multiple Users)
1 mbps - 5 mbps
Email (Large Attachments) IPTV (Standard Definition, 1-3 Channels)
Remote Surveillance (Basic) Telecommuting (Basic)
Web Browsing (Complex Sites)
100 mbps - 1 gbps
Gaming (Immersion) IPTV (Full Channel Support) Multiple Educational Services
Real-Time Data Collection Remote Server Services for
Telecommuting Telemedicine (HD)
Video (High Definition) 1 mbps - 6 mbps File sharing (Small/Medium Files) 50 mbps - 10
gbps Remote Supercomputing
3 mbps - 6 mbps Video (Enhanced Definition) 100 mbps - 10 gbps Research Applications
5 mbps - 10 mbps
Building Control & Management File sharing (HD Videos) File sharing (Large Files)
IPTV (Standard Definition, 4+ Channels) Medical File Sharing (Basic) Remote Diagnosis (Basic)
Telecommuting (Converged Services) Telepresence (Low Quality)
1 gbps - 10 gbps
File sharing (Terabyte Datasets) Interactive Remote Visualization and
Virtual Reality Live Event Digital Cinema Streaming Remote Control of Scientific/Medical
Instruments Telepresence (Using Uncompressed HD
Video Streams)
5 mbps - 14 mbps Video (Standard Definition) Video Conferencing (Basic)
Gaming (Basic)
13 Sources: Brookings Institution. "An International Look at High-Speed Broadband" by Darrell M. West, Feb. 2010.
http://www.brookings.edu/reports/2010/0223_broadband_west.aspx Missouri Broadband Now. "Broadband Speeds." http://mobroadbandnow.com/broadband-101/broadband-speeds/ State of New Hampshire Broadband Action Plan, Appendix. http://www.nheconomy.com/uploads/Broadband-Action-Plan-
Appendices.pdf State of Washington Department of Information Services. "Creating Opportunities for Washington: A Report on Broadband in
Washington State." http://broadband.wa.gov/sites/default/files/docs/WashingtonStateBroadbandReport.pdf

REGIONAL DIGITAL ECONOMY PLAN August 1, 2014
34 | P a g e
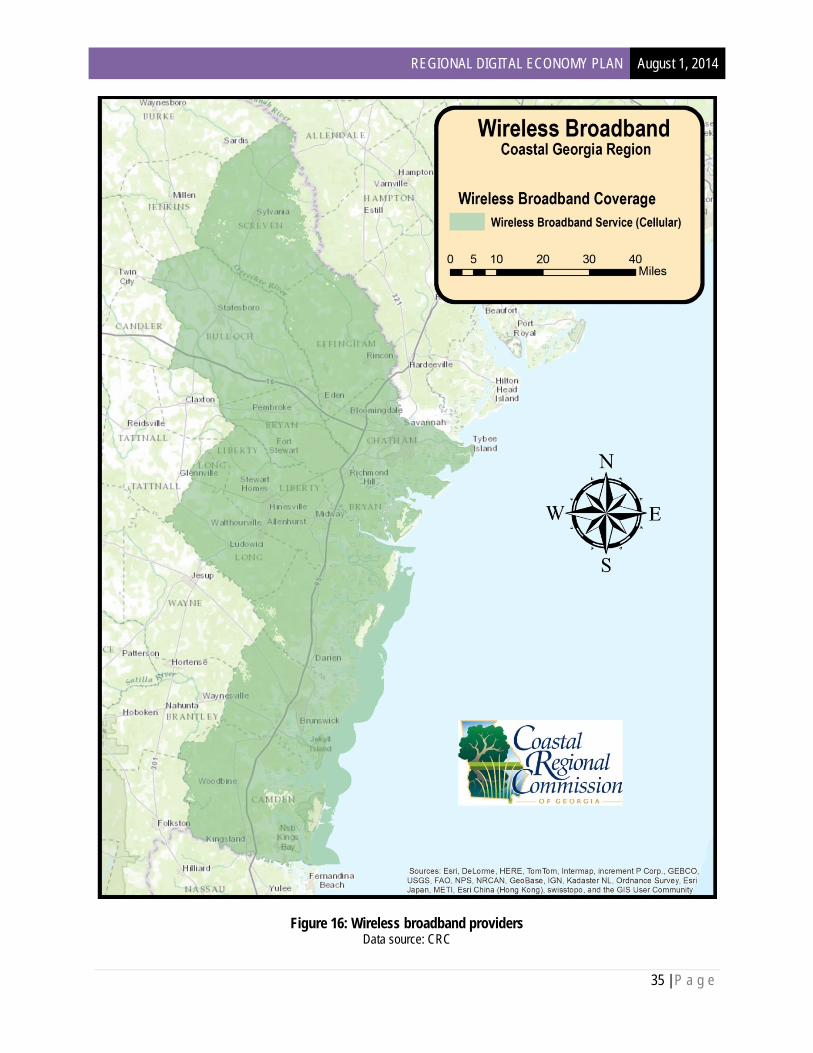
Wireless Broadband
The Coastal Region is largely covered sufficiently by wireless broadband service for mobile phones, tablets, and laptops. A few main carriers include Verizon Wireless, AT&T, Sprint, and T-Mobile, with Verizon’s covering the largest area, followed by AT&T, T-Mobile, and Sprint. With the exception of a few unpopulated barrier islands and several other swampy or very rural areas in the region, Verizon manages to cover virtually all areas in Coastal Region (usually with 4G LTE), with many other populated areas covered by 2 or more cellular carriers. Figure 16 maps the coverage of wireless cellular broadband in the Coastal Region.
REGIONAL DIGITAL ECONOMY PLAN August 1, 2014
35 | P a g e
Figure 16: Wireless broadband providers Data source: CRC

REGIONAL DIGITAL ECONOMY PLAN August 1, 2014
36 | P a g e
Spectrum Availability for Mobile Broadband
In the bands below 3.7 GHz, 547 megahertz is currently licensed as flexible use spectrum that can be used for mobile broadband.14 The 2010 National Broadband Plan calls for making an additional 500 megahertz available for broadband use by 2020, of which 300 megahertz between 225 MHz and 3.7 GHz should be made newly available for mobile use by 2015.15
Policies and Regulations
FCC Notice of Inquiry 11-51, released in April 2011, seeks to work with “stakeholders including state and local governments, other federal agencies, Tribal governments, consumer advocates, and the private sector to identify means of improving rights of way policies and wireless facilities siting requirements.”16 The notice is a response to a congressional directive requiring the FCC to work to remove barriers to broadband-related infrastructure investment.
Counties and municipalities may also have policies and regulations that affect the construction and/or operation of broadband infrastructure and broadband services. Such regulations may be present in zoning codes, in comprehensive plans, in land development codes, or in right of way policies.
Funding Opportunities
The E-Rate program is administered by the Schools and Libraries Division of the Universal Service Administrative Company, an independent nonprofit company that administers the FCC’s Universal Service Fund. E-Rate provides discounts (from 20% to 90%) on telecommunications services to libraries, public schools, and non-profit private schools.17
Community Anchor Institutions
Community anchor institutions are defined by the NTIA as “schools, libraries, medical and healthcare providers, public safety, community colleges and other institutions of higher education, and any other community support organizations and entities that facilitate greater use of broadband services.”18
A survey was sent out by the CRC to several community anchor institutions (CAI’s) in the Coastal Region. Sixteen of the CAI’s either partially or completely responded to the survey questions. Figure 17 shows the locations of the institutions represented by the survey connection type for each location. Of the sixteen responses, one CAI was an educational institution, four were public administration, eight were other services than public administration, one was in transportation and warehousing, one in health care and social assistance, and one in utilities. The connection types varied across the locations, between xDSL, Satellite, Cable Modem, and Fiber, as seen in Figure 17. The CAI’s were instructed to test and report their internet connection speed as well (See Figure 18). Furthermore, ten CAI’s reported having pubic WiFi while six reported that they did not have public WiFi. Finally, the institutions were asked
14 Federal Communications Commission. National Broadband Plan, p. 84. http://download.broadband.gov/plan/national-broadband-plan-chapter-5-spectrum.pdf 15 National Broadband Plan, p. 75. 16 FCC. “Notice of Inquiry.” http://hraunfoss.fcc.gov/edocs_public/attachmatch/FCC-11-51A1.pdf 17 U.S. Department of Education. “E-Rate Program.” http://www2.ed.gov/about/offices/list/oii/nonpublic/erate.html 18 Department of Management Services. “Grants Assistance for Community Anchor Institutions.” http://www.dms.myflorida.com/suncom/broadband_florida_initiative/broadband_grants_assistance_team

REGIONAL DIGITAL ECONOMY PLAN August 1, 2014
37 | P a g e
about their websites, and all sixteen respondents reported having a website for their location. Three reported having a website with static content only and the other thirteen had websites with regularly updated content.
Table 6: List of Survey Respondents and Locations Name of Community Anchor Institute Location Vista Outdoor Advertising Saint Marys, Camden County Register International, Inc. Richmond Hill, Bryan County Long County EMA/EMS Ludowici, Long County Glynn County Board of Education Brunswick, Glynn County Effingham County Sherriff's Office Springfield, Effingham County Liberty County Development Authority Hinesville, Liberty County Camden County Chamber of Commerce Saint Marys, Camden County Bryan County Emergency Services Richmond Hill, Bryan County Effingham County Planning & Zoning Springfield, Effingham County Liberty County Emergency Management Hinesville, Liberty County <unknown> Liberty County Richmond Hill/Bryan County Chamber of Commerce Richmond Hill, Bryan County Pooler Fire & Rescue Pooler, Chatham County Chatham County Planning Commission Savannah, Chatham County Chatham Emergency Management Agency Savannah, Chatham County Planters Telephone Cooperative Newington, Screven County

REGIONAL DIGITAL ECONOMY PLAN August 1, 2014
38 | P a g e
Figure 17: Locations of Reponses by CAI’s with Connection Type

REGIONAL DIGITAL ECONOMY PLAN August 1, 2014
39 | P a g e
Figure 18: Reported Download Speeds for Survey Response Locations

REGIONAL DIGITAL ECONOMY PLAN August 1, 2014
40 | P a g e
Two other important community anchor institution types for the public are public libraries and colleges. There are 33 public libraries in the region that provide public internet access. Internet access at libraries is an essential service for many residents of the county who have no internet access at home. Broadband is also important for the overall function of all modern library systems. Colleges and universities are critical locations for reliable broadband access for instructors, students, and other employees to perform research and other projects. There are fifteen colleges and universities in the Coastal Region (see Figure 19).

REGIONAL DIGITAL ECONOMY PLAN August 1, 2014
41 | P a g e
Figure 19. Colleges and Universities Data source: Georgia Coastal Regional Commission

REGIONAL DIGITAL ECONOMY PLAN August 1, 2014
42 | P a g e
Figure 20 shows the locations of hospitals, doctors’ offices, and state laboratories and clinics in the Coastal Region. Broadband is important in the healthcare industry for applications such as telemedicine, remote diagnosis, and transferring medical records (especially when records include detailed images, such as MRI scans).

REGIONAL DIGITAL ECONOMY PLAN August 1, 2014
43 | P a g e
Figure 20: Healthcare Facilities Data source: Georgia Coastal Regional Commission

REGIONAL DIGITAL ECONOMY PLAN August 1, 2014
44 | P a g e
Areas of Greatest Broadband Need (Current)
To identify underserved areas in which improved broadband access may have a particularly strong impact and may offer much-needed new opportunities to residents, a geographic model identifying areas of need was developed. This model identifies areas where lack of service, lack of broadband adoption by households, and low income combine to create a demand gap. The following were the specific factors used in the calculation:
Current lack of coverage (fiber, cable, and DSL; NTIA data)
Current low rates of broadband penetration (low estimated percentages of households that have broadband connections; FCC data)
Generalized existing land use (priority is given to agricultural and residential areas because these are where isolated, underserved populations are most likely to reside; Georgia Department of Revenue data)
Low income (Census data)
The need score (N) was calculated as:
N = P + U + I - L
Where L is a score based on lack of existing coverage; P is a score based on low rates of existing household broadband connections; U is a land use score that prioritizes agricultural and residential uses; and I is a score indicated low median household income. The final score N is a number between 1 and 6.5. The final map shows areas by percentile rank of their N score.
The following are the GIS procedures used to develop the geographic component of the need model:
1. Obtain broadband coverage data collected by the CRC and select by attribute using technology type to create a layer of DSL, a layer of Cable, and a layer of fiber coverage. Use remaining polygons to form a layer showing areas of no coverage. Add a field to each called “L” and assign all polygons having no coverage an L score of 1, those having DSL a score of 1, those having cable a score of 2, and those having fiber a score of 3. This effectively means a higher L score signifies a faster broadband technology.
2. Using FCC broadband penetration data,19 calculate a field containing the variable P, which depends inversely on what estimated percentage of households in each census tract have broadband connections (using the BTOP—Broadband Technology Opportunities Program—definition):20 (See Figure 22)
0-200 out of every 1,000 households: 1 point 201-400 out of every 1,000 households: 0.8 point 401-600 out of every 1,000 households: 0.6 point 601-800 out of every 1,000 households: 0.4 point 801-1,000 out of every 1,000 households: 0.2 point
3. Load census tract data showing median household income by census tract from the 2010 Census. For the variable I, 1 point is added for census tracts where the median income is below the regional median income
19 FCC. “Local Telephone Competition and Broadband Deployment.” http://transition.fcc.gov/wcb/iatd/comp.html 20 NTIA. “Broadband Technology Opportunities Program.” http://www2.ntia.doc.gov/

REGIONAL DIGITAL ECONOMY PLAN August 1, 2014
45 | P a g e
($46,945 per the 2010 Census estimate). 2 points are added for census tracts where the median income is below 50 percent of the countywide median income ($23,473).
4. Using Department of Revenue parcel use code data, create the variable U by adding 1 point for agricultural and residential existing land uses.
5. Use the Union function to combine the L, P, and I layers.
6. Use the Spatial Join function to join the result of the union onto the U (parcel) layer.
7. Calculate a new field with the final need score N = P + U + I - L.
The results of this model are shown in Figure 22. Population density is not part of this model; therefore some areas of very low population density are indicated as having a high level of need.

REGIONAL DIGITAL ECONOMY PLAN August 1, 2014
46 | P a g e
Figure 21: Estimated broadband connections per 1,000 households (C)
Source: Federal Communications Commission, Dec 2012

REGIONAL DIGITAL ECONOMY PLAN August 1, 2014
47 | P a g e
Figure 22: Areas of Greatest Broadband Need

REGIONAL DIGITAL ECONOMY PLAN August 1, 2014
48 | P a g e
GIS Analysis Procedure
The following geographic datasets were used:
• Coastal Region parcels • Coastal Region Generalized Future Land Use (collected by the Coastal Regional Commission) joined to the
Future Land Use score table above • Census tracts joined to FCC broadband coverage data
Future Land Use Patterns
Future Land Use patterns are also important to consider with future broadband planning. The Coastal Regional Commission collected future land use data from regional jurisdictions (See Figure 23). The land use types are explained in Table 7.

REGIONAL DIGITAL ECONOMY PLAN August 1, 2014
49 | P a g e
Figure 23: Future Land Use

REGIONAL DIGITAL ECONOMY PLAN August 1, 2014
50 | P a g e
Table 7: Generalized FLU Category Descriptions Generalized FLU
Category Description Residential Residential development of all densities. Agriculture & Forest
Land specifically designated as Agricultural in the comprehensive plan. May include silvicultural or ranching uses. Occasionally includes extremely low residential densities, in the range of 1DU/100 acres primarily, but occasionally as high as 1 DU/10 acres. This is often the default FLU for rural areas. Also includes many relatively undisturbed forest areas.
Conservation & Recreation
Areas known to require environmental protection from development, areas being preserved which contain wetlands and/or habitats which serve to protect valuable threatened species and natural resources{Private and public conservation lands, Wetlands categories, passive recreation, institutional/conservation, marsh, conservation open space, public resource, wetland conservation, natural resource, conservation/floodplains, resource management/recreation, resource protection, passive park/buffer area, potential environmentally significant, preserve, environmentally sensitive lands, environmental systems corridor, conservation/protected, conservation/restricted, } Areas known to require environmental protection from development, areas being preserved which contain wetlands and/or habitats which serve to protect valuable threatened species and natural resources{Private and public conservation lands, Wetlands categories, passive recreation, institutional/conservation, marsh, conservation open space, public resource, wetland conservation, natural resource, conservation/floodplains, resource management/recreation, resource protection, passive park/buffer area, potential environmentally significant, preserve, environmentally sensitive lands, environmental systems corridor, conservation/protected, conservation/restricted, }
Public Institutional Property designated as City, county, state, federal or other gov’t, private or institutional entities {Institutional, governmental, public/semi-public, public facilities, public land (except parks), Federal, Military, church use/religious, educational/schools, private well field, public grounds (except park), hospitals, utilities (treatment plants, water wells, quasi-public}
Industrial
Indoor manufacturing, assembling, fabricating, and warehouse activities conducted indoors, mini-storage {heavy, light and medium industrial, planned industrial, industrial, industrial park, planned industrial park, general industrial, industrial employment center, wholesale commercial, commercial/industrial, airport industrial}
Commercial Property designated as stores, offices or other establishments used to serve the needs of the public {General Commercial, Commercial, Neighborhood Commercial, commercial/manufacturing, low intensity commercial, general commercial development, limited commercial development, downtown business, marine commercial, high intensity commercial, commercial and services (including lodging), historical resources, marina, tourist commercial, local convenience center, mixed commercial industrial, central business district, office/commercial, office, wholesale, community commercial, highway

REGIONAL DIGITAL ECONOMY PLAN August 1, 2014
51 | P a g e
Generalized FLU Category Description
commercial, mixed use commercial, water oriented commercial, business, retail services, historic commercial, lakefront commercial, business district overlay, regional commercial, integrated office commercial, limited interchange, commercial village, Lodging, hotel/resort, RV Park, tourist accommodations.}
Transportation, Communication, & Utilities
Right of way, airports, transportation utilities, etc.
Undeveloped/Unused Includes open oceans and many rivers, creeks, and marshes, as well as forest areas that are highly undisturbed and unutilized.
Vision, Goals, Strategies, and Action Items The Vision, Goals, Strategies, and Action Items for the Coastal Region Broadband Plan were developed with input from the Broadband Coastal Region Advisory Committee, and the public. The Vision and Goals were refined during the course of two Advisory Committee meetings, with Committee members sending their suggestions to staff between meetings. Subsequently, strategies to address each goal were developed by the Committee in a working session. Further input from the Committee and from the general public was collected via a worksheet with the 6 working goals for the plan and space to submit draft strategies. Finally, action items were drafted and reviewed by the Committee. Vision Broadband Digital Economy's vision is to facilitate increased opportunity, innovation, and efficiency by ensuring that every individual, corporation, non-profit, visitor, government entity, and community partner in the Coastal Region has access to affordable high-speed internet service.
Table 8: Goals, Strategies, and Action Items Goals Strategies Action Items Anchor Institutions such as schools, hospitals, libraries, and government buildings will have affordable access to a minimum of 1 gigabit per second broadband services.
1, 2, 3 1, 2, 3, 4, 5, 6, 7, 10, 11, 15, 16, 18, 19, 20, 21, 22, 23, 24, 25
Every resident of Coastal Region will have access to affordable high-speed internet services and the skills to utilize it, if they choose.
4, 5, 6, 7 1, 4, 7, 8, 9, 17, 18, 19, 20, 21, 22, 23, 24, 25, 26, 27
Anchor Institutions (including energy providers) will maximize utilization of broadband services and technologies in order to increase efficiency, maximize resources, and provide the best services possible to the businesses and residents of Coastal Region.
8, 9 1, 2, 3, 4, 5, 6, 7, 10, 11, 12, 13, 15, 18, 19, 20, 21, 22, 23, 24, 25
Every business and non-profit in Coastal Region will have access to affordable high-speed internet services and the skills to utilize it, if they choose.
10, 11, 12, 13 1, 4, 10, 14, 15, 16, 17, 18, 19, 20, 21, 22, 23, 24, 25, 27
Coastal Region will have the fastest, most affordable, and most accessible mobile networks possible.
14, 15 1, 4, 10, 15, 16, 18, 19, 20, 21, 22, 23, 24, 27

REGIONAL DIGITAL ECONOMY PLAN August 1, 2014
52 | P a g e
205,000 households (79% of households) in Coastal Region will have affordable access to actual download speeds of at least 100 megabits per second and actual upload speeds of at least 50 megabits per second.
16, 17, 18, 19 1, 4, 18, 19, 20, 21, 22, 23, 24, 25, 26, 27
Strategies
1. Co-location: Advocate for communication, cooperation, and partnerships between utility providers, municipalities, transportation planning organizations and broadband providers; allowing resources, easements, rights-of-way and infrastructure to be shared when expanding or upgrading services to Anchor Institutions.
2. Competition: Increase affordability and improve services to Anchor Institutions by encouraging and advocating for robust broadband marketplace competition including Next Generation Networks and municipal fiber enterprises.
3. Funding Sources: Ensure that Anchor Institutions are aware of, and utilizing, all available funding sources including but not limited to e-rate programs, grants, tax incentives, and private financing.
4. Neighborhood Broadband Centers: Eliminate gaps in service, equity, and affordability by establishing broadband access points in community centers, churches, shopping centers, parks, schools, and other community based organizations. Provide public-access computers where possible and increase capacity where such facilities already exist, such as in libraries.
5. Wi-Fi Zones: Encourage local municipalities and counties to provide public Wi-Fi, especially in central business districts and dense neighborhoods.
6. Technical Literacy and Training: Encourage providers and industry experts to conduct a variety of workshops and training exercises ranging from basic computer skills to more advanced applications of broadband technology.
7. Pursue Funding: Encourage local governments and organizations such as CRAs and neighborhood groups to undertake projects that increase broadband availability, taking advantage of funding opportunities such as grants, tax incentives, and public-private partnerships.
8. Broadband Audits: Encourage annual evaluations of Anchor Institutions by broadband providers and/or industry experts to identify methods to increase efficiency and maximize resources.
9. Employee Suggestion Programs: Encourage Anchor Institutions to establish programs to reward employees who submit new ideas for utilizing broadband services efficiently, effectively, and for the benefit of Coastal Region businesses and residents.
10. Attract Broadband Intensive Industries: Partner with local municipalities, universities, and economic development agencies to attract high-tech industries including research and development facilities that require very high capacity broadband infrastructure.
11. Technical Literacy and Training: Encourage providers and industry experts to conduct a variety of workshops and training exercises ranging from basic computer skills to more advanced applications of broadband technology.
12. Public-Private Partnerships: Develop partnerships, programs, and incentives to provide broadband services to small cities and rural communities.
13. Pursue Funding: Encourage business associations, downtown redevelopment agencies, and other business-related organizations to undertake projects that increase broadband availability, taking advantage of funding opportunities such as grants, tax incentives, and public-private partnerships.
14. Increase Demand: Increase public awareness of mobile broadband technology and applications through Public Service Announcements, educational/training programs, technology fair/conferences, and fostering a cultural change to maximize mobile broadband services at the local level.
15. Decrease Obstacles: Revise local regulations to eliminate potentially unnecessary restrictions or obstacles to installing services and infrastructure. Advocate at the State and Federal level for favorable regulations for the development of mobile systems including the availability of spectrum.

REGIONAL DIGITAL ECONOMY PLAN August 1, 2014
53 | P a g e
16. Development Policy: Facilitate “fiber-to-the-home” infrastructure within new residential communities through the development and adoption of broadband infrastructure policies within the region and municipal comprehensive plans and/or land use and zoning codes.
17. Share and Communicate Ideas: Partner with broadband providers to share goals, assets, strategies and obstacles.
18. Local Government Broadband Enterprises: Encourage local municipalities and counties with fiber or other broadband infrastructure to enter the broadband marketplace.
19. Telecommuting/Work-At-Home Policies: Increase residential demand by encouraging employers to adopt strategies and policies allowing employees the opportunity to telecommute.
Action Items
1. Develop and maintain a Broadband Digital Economy website to serve as the central hub for information sharing, communication, cooperation and partnerships.
2. Identify all Anchor Institutions in the Coastal Region that do not have 1 Gigabit per second broadband services.
3. Meet with broadband providers to identify any obstacles to providing 1 Gigabit per second services to the identified Anchor Institutions.
4. Encourage municipalities and new commercial providers to enter the Coastal Region broadband market. 5. Utilize the Broadband Digital Economy webpage, social media, and email distribution lists to promote and
disseminate broadband infrastructure and program funding information to Anchor Institutions. 6. Review broadband use at every library in the Coastal Region to ensure that they are utilizing all available
broadband funding opportunities. 7. Identify gaps in broadband service and utilization, especially due to affordability or education, and seek to
establish Neighborhood Broadband Centers (see strategies) where none currently exist. 8. Research opportunities and establish funding sources for the development of Neighborhood Broadband
Centers. 9. Meet with broadband providers to discuss and develop a broadband audit program within Coastal Region. 10. Meet with Anchor Institutions to introduce the broadband audit program and encourage participation. 11. Meet with Anchor Institutions to encourage the development of meaningful employee suggestion programs,
specifically programs that encourage and/or incentivize employees to submit ideas that use broadband technology to increase efficiency and improve services.
12. Reward and/or recognize Anchor Institutions that implement policy or programs that utilize broadband technology to increase efficiency and improve services.
13. Meet with business owners and business associations to discuss broadband access, broadband training opportunities, and funding opportunities.
14. Work with Chambers of Commerce and local economic development organizations to identify broadband intensive industries to target.
15. Reward and/or recognize broadband providers that provide expanded access for businesses and business districts.
16. Provide incentives for broadband providers to offer workshops and training exercises. 17. Develop a series of Public Service Announcements designed to promote Coastal Region’s broadband
assets, including mobile broadband, and to brand Coastal Region as a technology and educational hub. 18. Establish partnerships with print, radio, television, and internet media outlets to promote the development,
and highlight the advantages, of the highest speed broadband technologies available, including mobile. 19. Promote technology fairs or conferences within Coastal Region that include the latest broadband and mobile
broadband technologies and applications. 20. Encourage Coastal Region and local municipalities to review and revise (if necessary) their Comprehensive
Plan policies, Land Development regulations, and Zoning codes to eliminate any unnecessary restrictions or burdens upon the installation of broadband infrastructure, including towers.

REGIONAL DIGITAL ECONOMY PLAN August 1, 2014
54 | P a g e
21. Establish a Coastal Region Broadband Advocacy Committee whose primary objective is to advocate for broadband development, education, and utilization at the local, State, and/or Federal level.
22. Encourage Coastal Region and all 35 local municipalities to develop and adopt broadband infrastructure policies within their comprehensive plans, establishing broadband as an essential infrastructure similar to roads, water, sewer or electricity.
23. Establish quarterly meetings with representatives from local broadband providers to communicate ideas and share information.
24. Meet with local municipalities and Coastal Region to discuss the advantages and disadvantages for establishing local government broadband enterprises and providing broadband services to local business and residents.
25. Meet with local broadband providers to discuss the current obstacles for providing 100/50 Mbps services to Coastal Region residents and explore solutions, including public/private partnerships.
26. Work with the local chambers of commerce to encourage and promote telecommuting for employees of Coastal Region businesses.

REGIONAL DIGITAL ECONOMY PLAN August 1, 2014
55 | P a g e
Glossary of Terms
• 3G – The third generation of mobile broadband technology, used by smart phones, tablets, and other mobile devices to access the web.
• 4G – The fourth generation of mobile broadband technology, offering faster access than 3G. • Anchor institution – Schools, libraries, medical and healthcare providers, public safety, community
colleges and other institutions of higher education, and any other community support organizations and entities that facilitate greater use of broadband services (NTIA definition).
• Bandwidth – The amount of data transmitted in a given amount of time; usually measured in megabits per second (Mbps).
• Bit – The basic unit of information in computing and telecommunications. A contraction of “binary digit.” • Broadband - High-speed Internet access that is always on and faster than dial-up access (National
Broadband Plan definition). • Byte – A unit of digital information in computing and telecommunications that most commonly consists of
eight bits. • Cable – A form of broadband Internet access that uses cable television infrastructure. • Dial-up - A technology that uses an existing telephone line to access the internet, using the same frequency
range as voice communication and therefore blocking telephone calls while connected. • Download – To receive data to a local system from a remote system. • DSL (Digital Subscriber Line) – a technology that uses an existing telephone line to access the internet,
using a higher frequency than voice communication and therefore allowing telephone calls to be made simultaneously with internet activity.
• Fiber (Optical Fiber) – A flexible, transparent fiber made of glass (silica) or plastic, slightly thicker than a human hair, which transfers data by means of light, allowing for transmission of data over longer distances and at higher bandwidths than other forms of communication.
• Gbps (Gigabits per second) – 1,000,000,000 bits per second. A measure of how fast data can be transmitted.
• Gigabyte – A unit of digital information equal to 1 billion bytes. • HD (High Definition) – Video of a higher resolution than is standard. • IPTV (Internet Protocol television) – A system through which television services are delivered using the
Internet, instead of being delivered through terrestrial, satellite signal, and cable television formats. • Kbps (Kilobits per second) – 1,000 bits per second. A measure of how fast data can be transmitted. • Kilobyte – A unit of digital information equal to 1,000 bytes. • LambdaRail – A high-speed national network infrastructure owned and operated by the U.S. research and
education community that runs over fiber-optic lines. • Mbps (Megabits per second) – 1,000,000 bits per second. A measure of how fast data can be transmitted. • Megabyte – A unit of digital information equal to 1 million bytes. • Remote Diagnosis – In medicine, the act of diagnosing a given symptom, issue, or problem from a
distance by means of an information exchange via a wire or wireless connection • Server – A physical computer dedicated to run one or more services to serve the needs of the users of
other computers on a network. • SMS (Short Message Service) – A text messaging service component of phone, web, or mobile
communication systems, using standardized communications protocols that allow the exchange of short text messages between fixed line or mobile phone devices.
• Spectrum – A range of radio-wave frequencies. • Streaming - A technology in which media (such as a video or music) is constantly received by and
presented to the end-user while being delivered by a provider. Allows media to be viewed or listened to

REGIONAL DIGITAL ECONOMY PLAN August 1, 2014
56 | P a g e
while it is being downloaded. Live streaming allows a live event (such as a lecture) to be viewed as it occurs.
• Supercomputer – A computer at the frontline of current processing capacity, particularly speed of calculation.
• Telecommuting – A work arrangement in which employees do not commute to a central place of work, but instead work at remote locations, such as their homes or public places.
• Telemedicine – The use of telecommunication and information technologies to provide clinical health care at a distance.
• Telepresence – A set of technologies that allow a person to feel as if they were present, to give the appearance of being present, or to have an effect, at a place other than their true location.
• Upload – To send data from a local system to a remote system. • VoIP (Voice Over Internet Protocol) – A technology that employs a data network (such as a broadband
connection) to transmit voice conversations in real time. • Wi-Fi – A technology that allows an electronic device to exchange data wirelessly (using radio waves) over
a local area computer network. • Wireless – Internet service transmitted via cellular towers, satellite, Wi-Fi, or other technologies that do not
require the use of land-based infrastructure lines. • Wireline – Internet service transmitted through infrastructure on, near, or under the ground, such as copper
telephone wires or coaxial cable.