regional air quality and challenges weeks_seminars pdf/region… · london smog 1952 source:...
TRANSCRIPT
Regional Air Quality and
Challenges
Prof. Tao Wang
Department of Civil and Environmental
Engineering
The Hong Kong Polytechnic University
2 May 2013
PolyU Campus Sustainability Weeks
Acknowledgements
• Dr. K.S. Lam at CEE for providing some slides
• The regional air-quality study team at PolyU
• Sponsors:
– Research Grants Council of Hong Kong
– Environment and Conservation Fund, Hong Kong
– Environmental Protection Department, HKSAR
Government
– The Hong Kong Polytechnic University
– Ministry of Science and Technology, China

OUTLINE
1
2
3
4
3
Air pollution control polices
Air pollution level in HK and the PRD
Air pollution basics
Challenge and Research
Air pollution essentials
• The atmosphere contains many gases
– N2, O2, Ar, CO2, water vapor
– 40 trace gases: ozone, helium, hydrogen, nitrogen
oxides
– Aerosols: microscopic liquid or solid particles (dust,
pollen, sea salts, etc.) from land and water
• The Industrial Revolution changed the mixture of
atmospheric gases and particles
• Air pollutants: substances in the atmosphere (gases and
aerosols) that have harmful effects
Three factors determine the
level of air pollution
The amount of pollutants entering the
air
The amount of space into which the
pollution is added
Mechanisms that remove pollutants
from the air
Need to consider emission, meteorology
and chemistry!
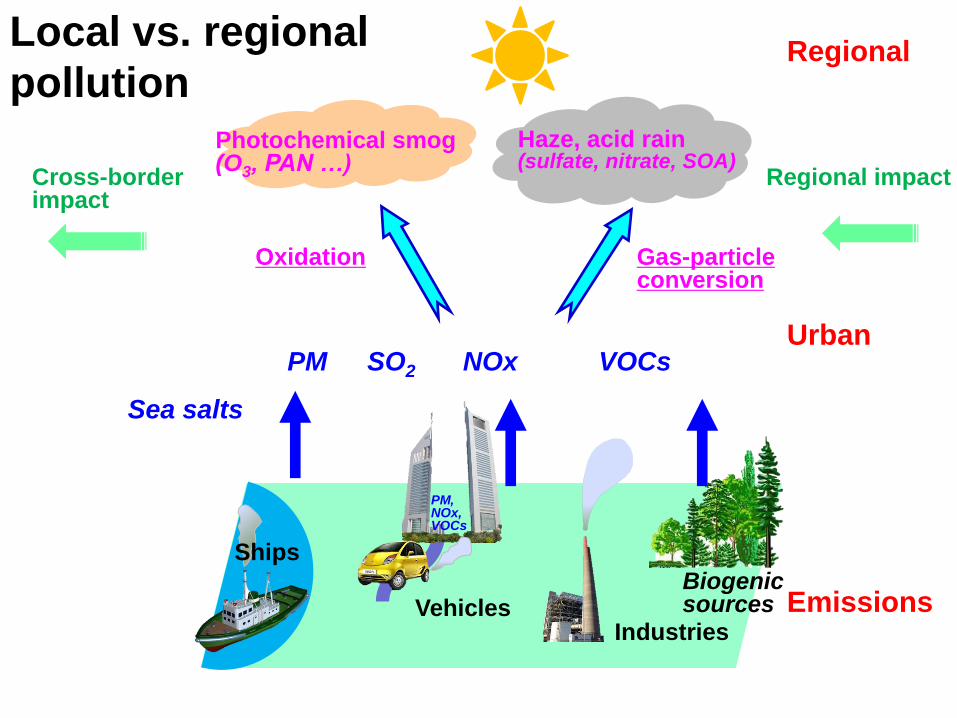
Ships
Vehicles Industries
Biogenic sources
NOx SO2 VOCs
Sea salts
Photochemical smog (O3, PAN …)
Haze, acid rain (sulfate, nitrate, SOA)
PM, NOx, VOCs
PM
Regional impact Cross-border impact
Regional
Oxidation Gas-particle conversion
Urban
Emissions
Local vs. regional
pollution
6
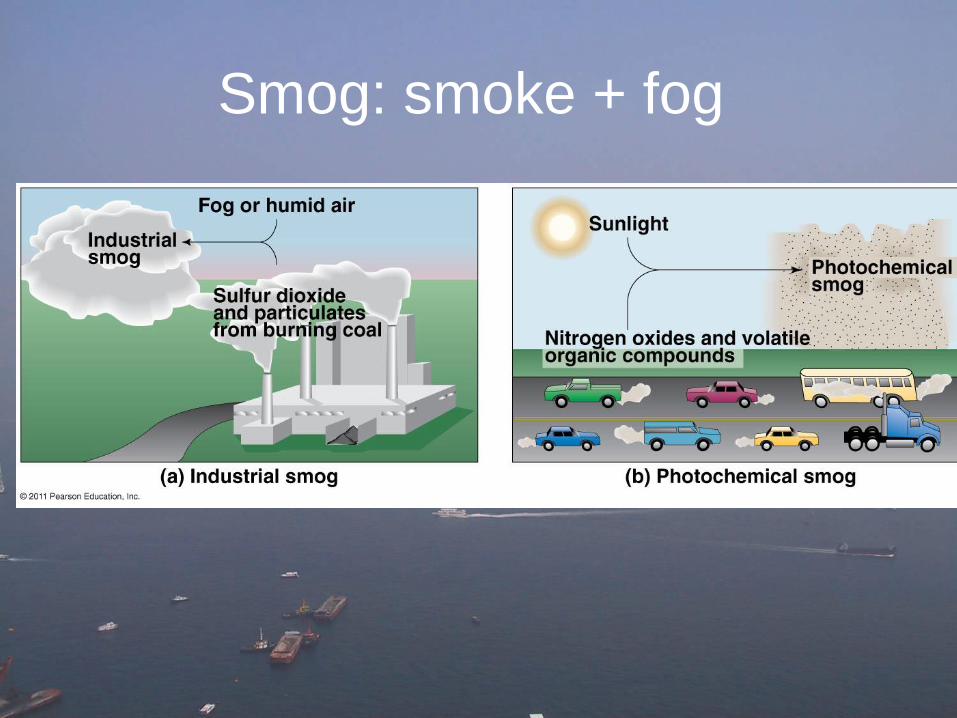
Smog: smoke + fog
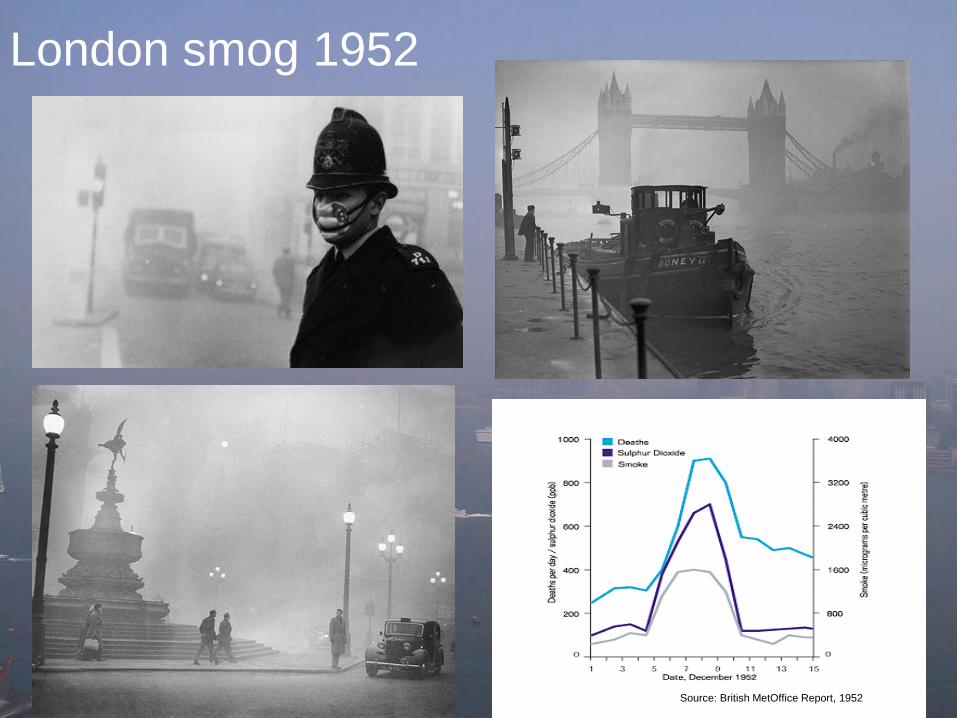
London smog 1952
Source: British MetOffice Report, 1952
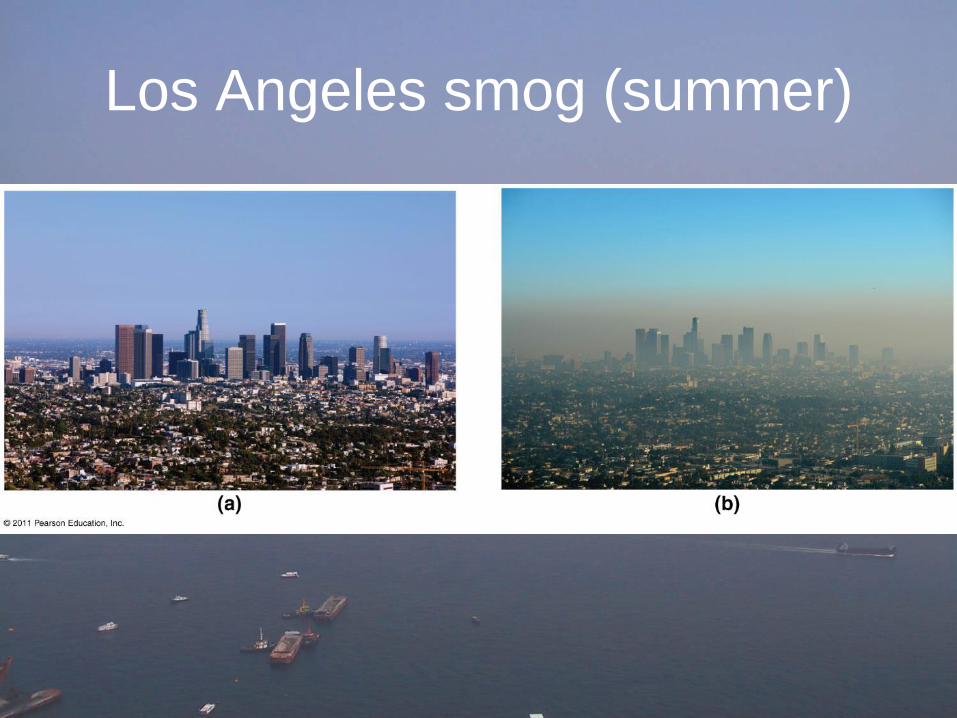
Los Angeles smog (summer)
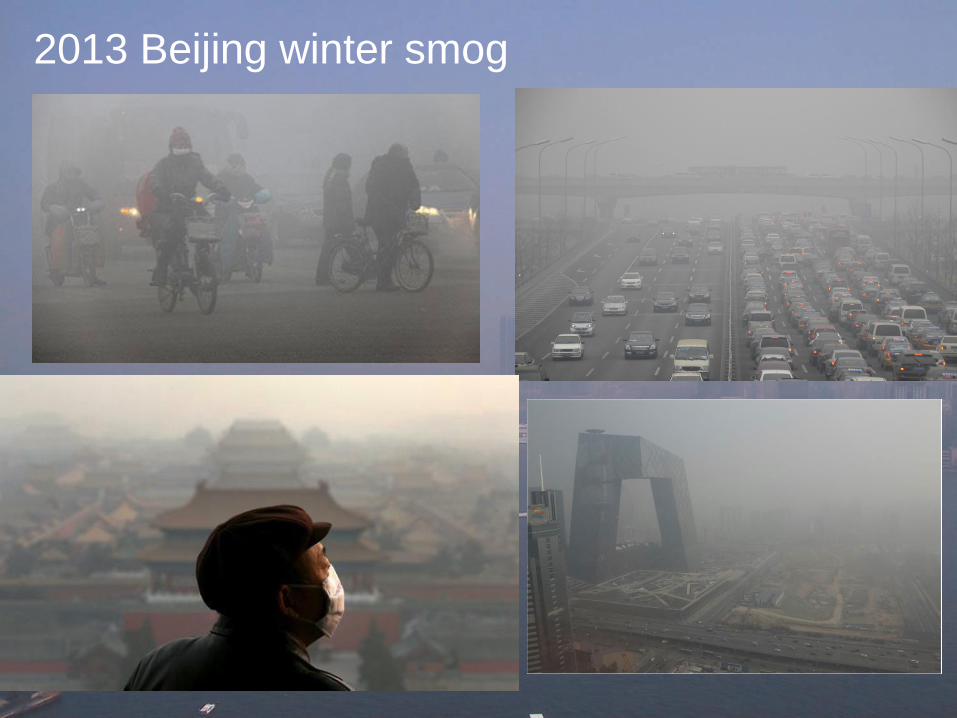
2013 Beijing winter smog
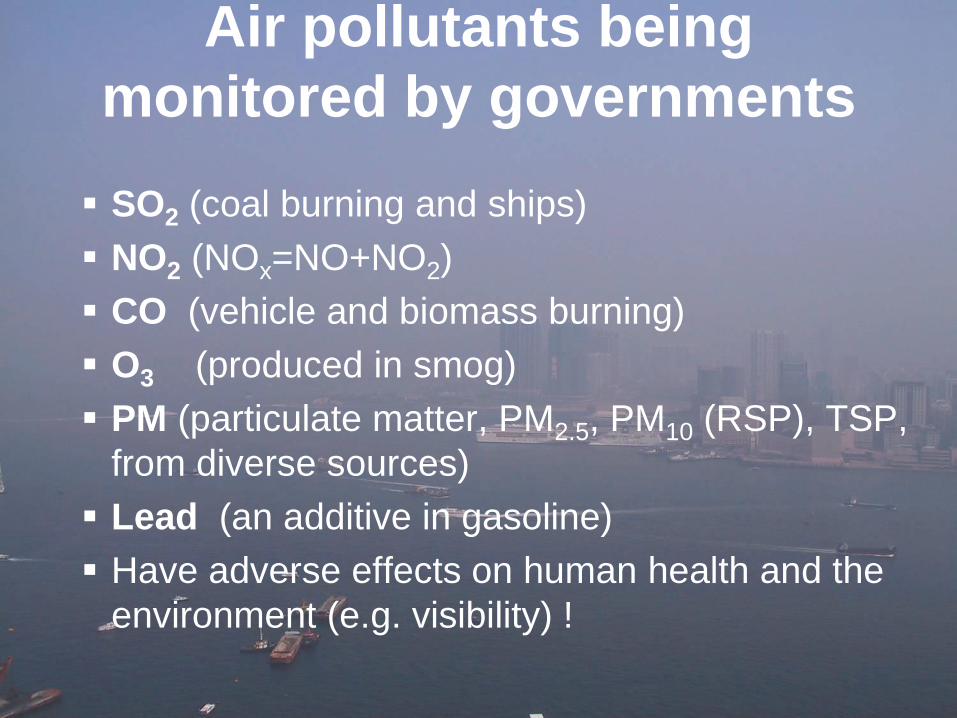
Air pollutants being
monitored by governments
SO2 (coal burning and ships)
NO2 (NOx=NO+NO2)
CO (vehicle and biomass burning)
O3 (produced in smog)
PM (particulate matter, PM2.5, PM10 (RSP), TSP,
from diverse sources)
Lead (an additive in gasoline)
Have adverse effects on human health and the
environment (e.g. visibility) !
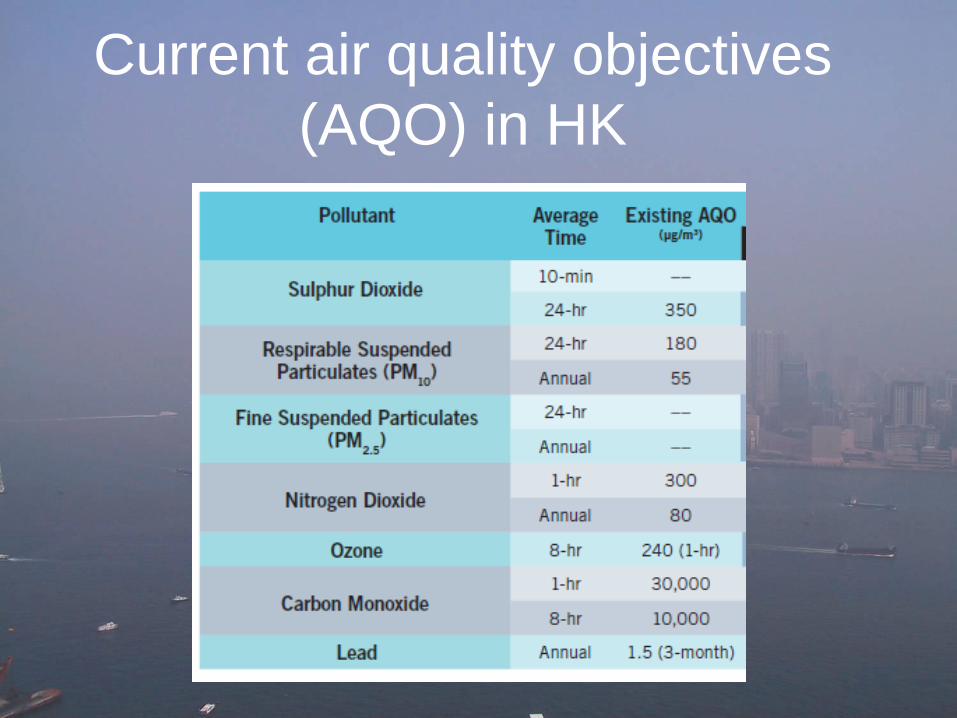
Current air quality objectives
(AQO) in HK
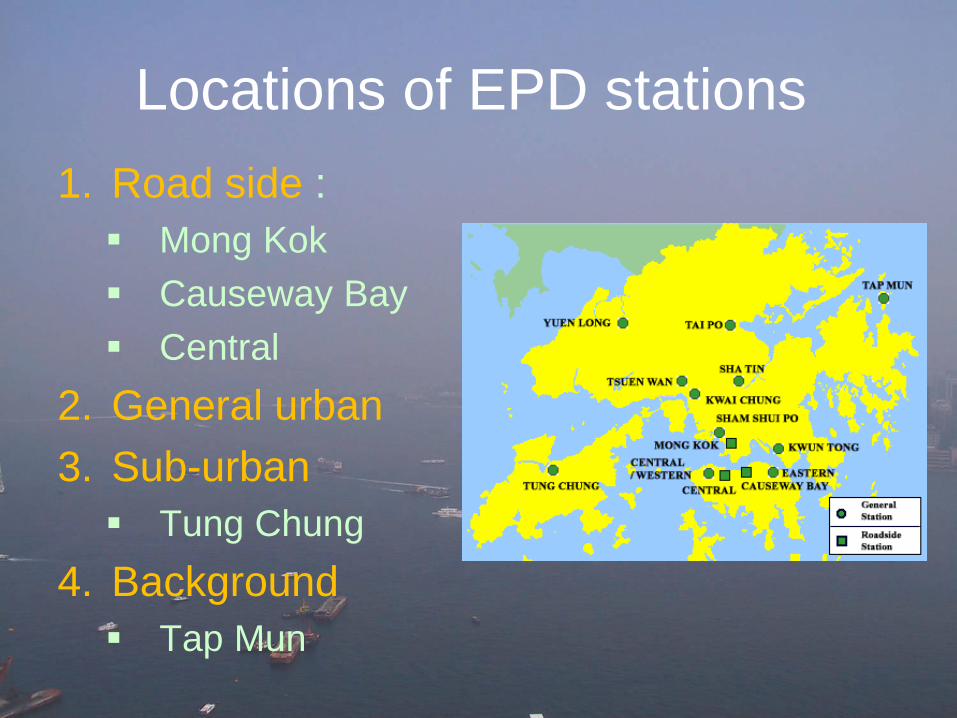
Locations of EPD stations
1. Road side :
Mong Kok
Causeway Bay
Central
2. General urban
3. Sub-urban
Tung Chung
4. Background
Tap Mun
Key air pollutants in Hong
Kong
NO2, RSP, O3
SO2, CO and Lead rarely exceeded the AQO
0
20
40
60
80
100
120
140
NO
2
g/m
3
Stations
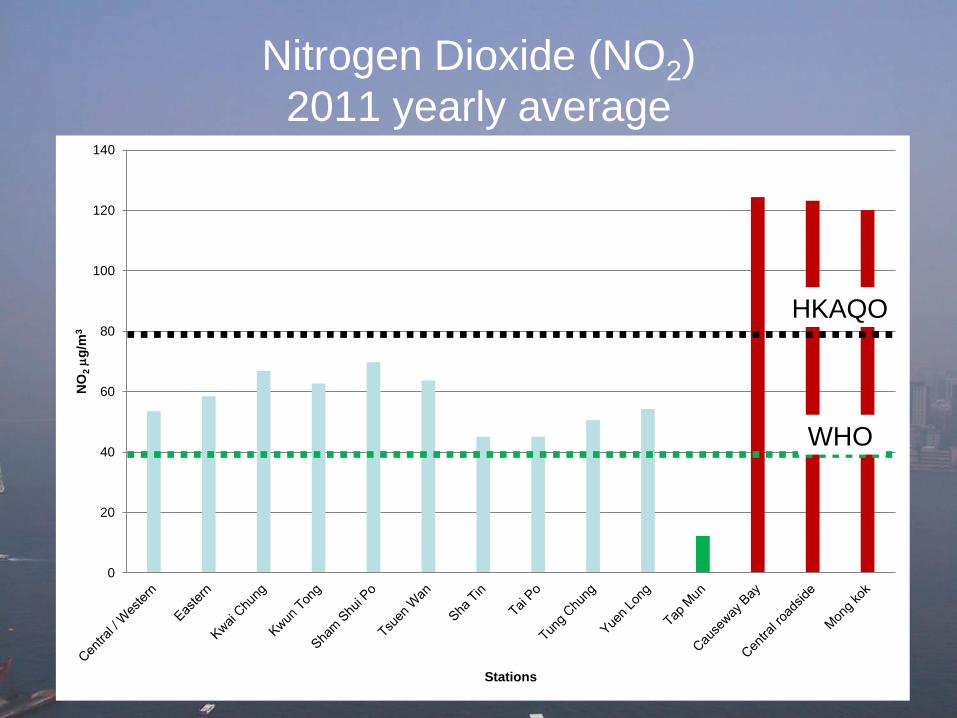
Nitrogen Dioxide (NO2)
2011 yearly average
HKAQO
WHO
15
0
10
20
30
40
50
60
70
RS
P (
g/m
3)
Stations
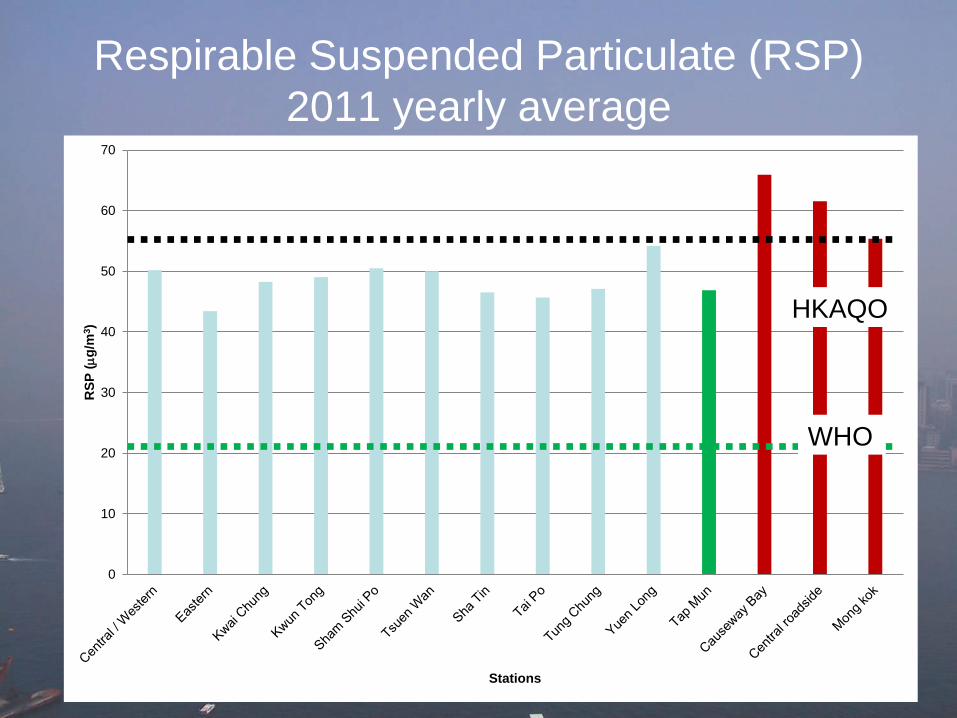
Respirable Suspended Particulate (RSP)
2011 yearly average
HKAQO
WHO
16
0
5
10
15
20
25
30
35
40
45
FS
P (
g/m
3)
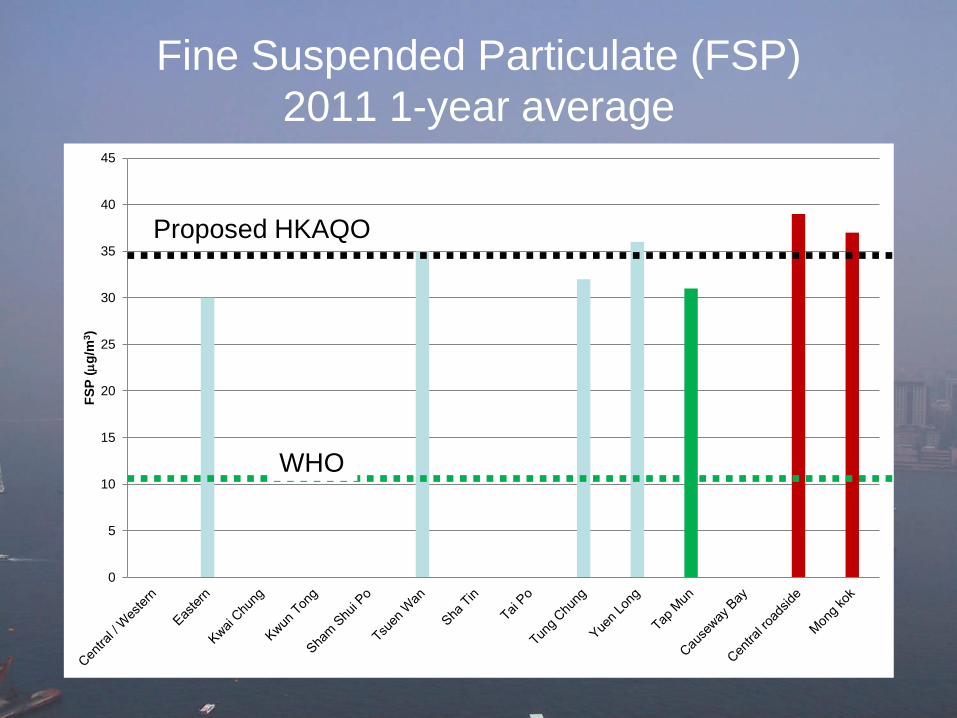
Fine Suspended Particulate (FSP)
2011 1-year average
Proposed HKAQO
WHO
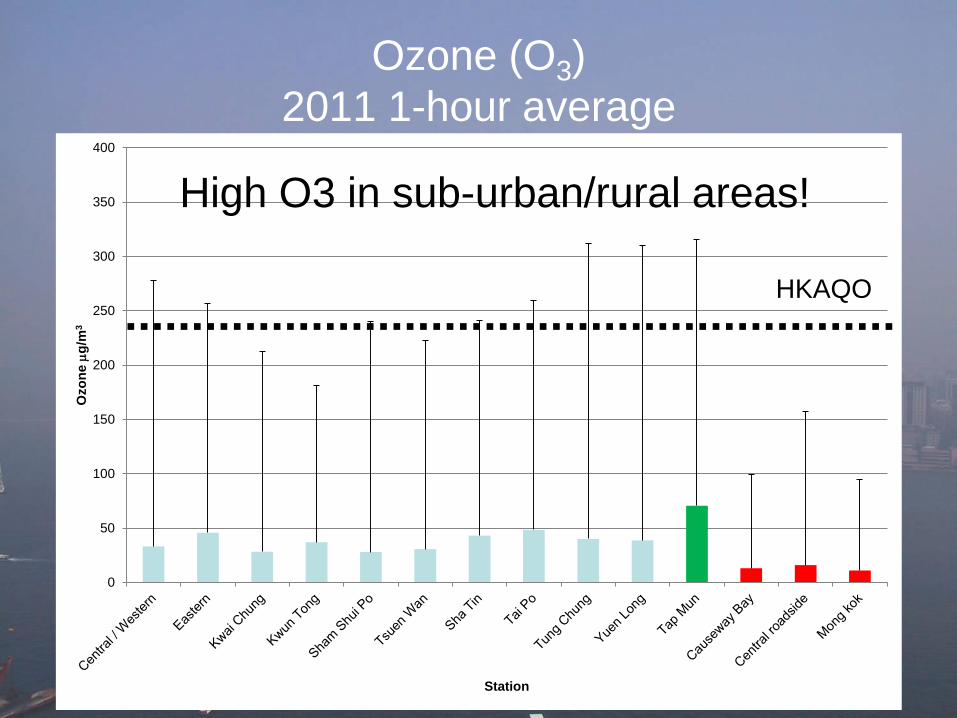
0
50
100
150
200
250
300
350
400
Ozo
ne
g/m
3
Station
Ozone (O3)
2011 1-hour average
HKAQO
18
High O3 in sub-urban/rural areas!
0
20
40
60
80
100
120
140
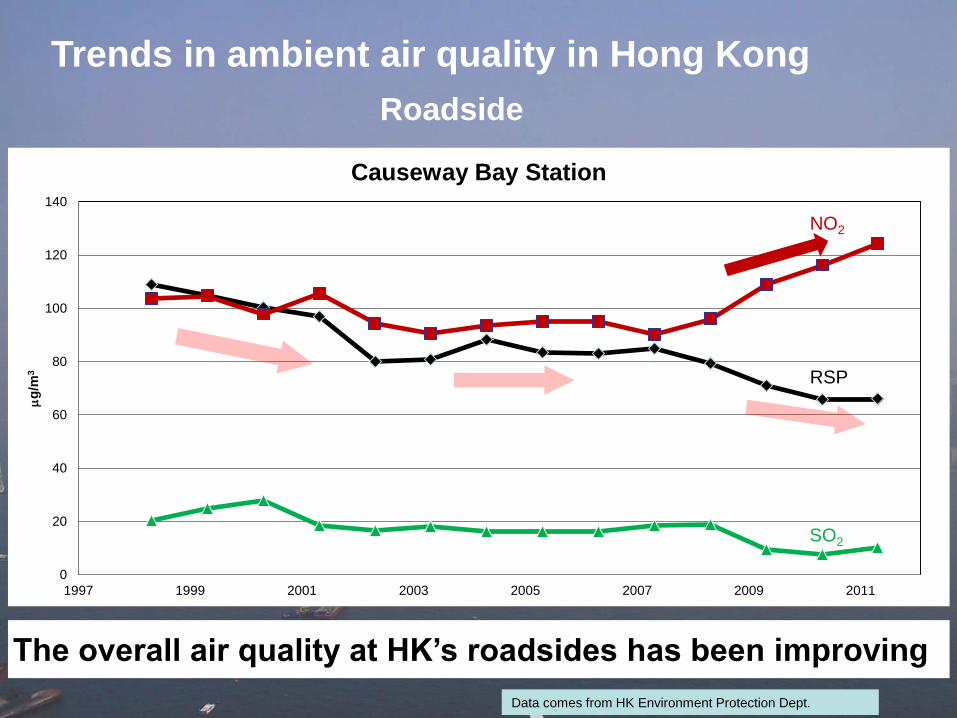
1997 1999 2001 2003 2005 2007 2009 2011
g
/m3
Causeway Bay Station
Trends in ambient air quality in Hong Kong
Roadside
Data comes from HK Environment Protection Dept.
The overall air quality at HK’s roadsides has been improving
NO2
SO2
RSP
19
0
20
40
60
80
100
120
140
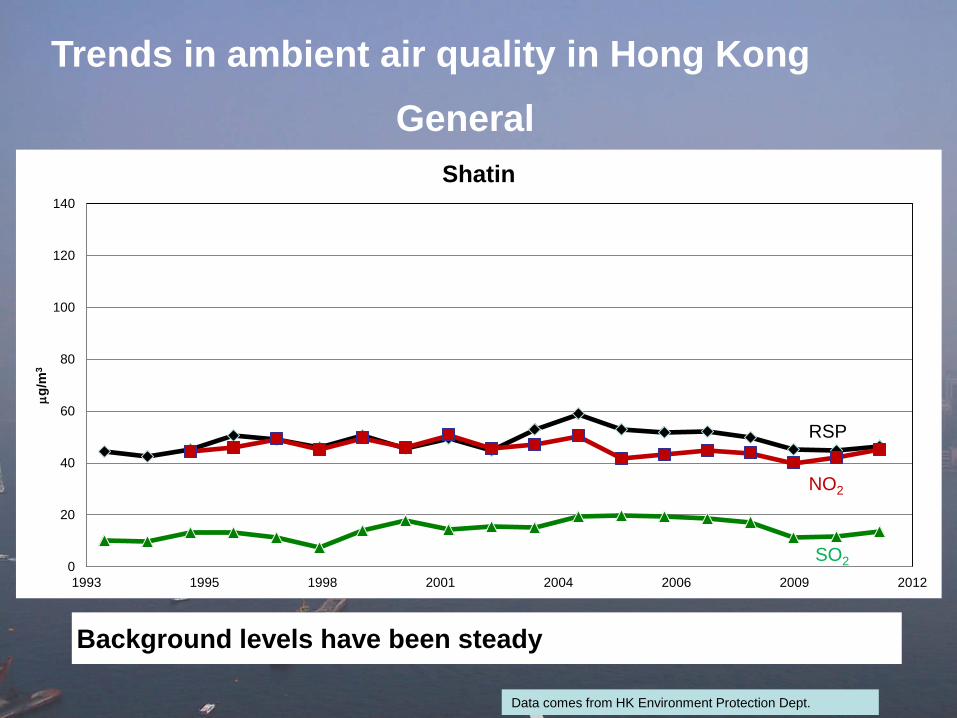
1993 1995 1998 2001 2004 2006 2009 2012
g
/m3
Shatin
General
Data comes from HK Environment Protection Dept.
Background levels have been steady
Trends in ambient air quality in Hong Kong
NO2
SO2
RSP
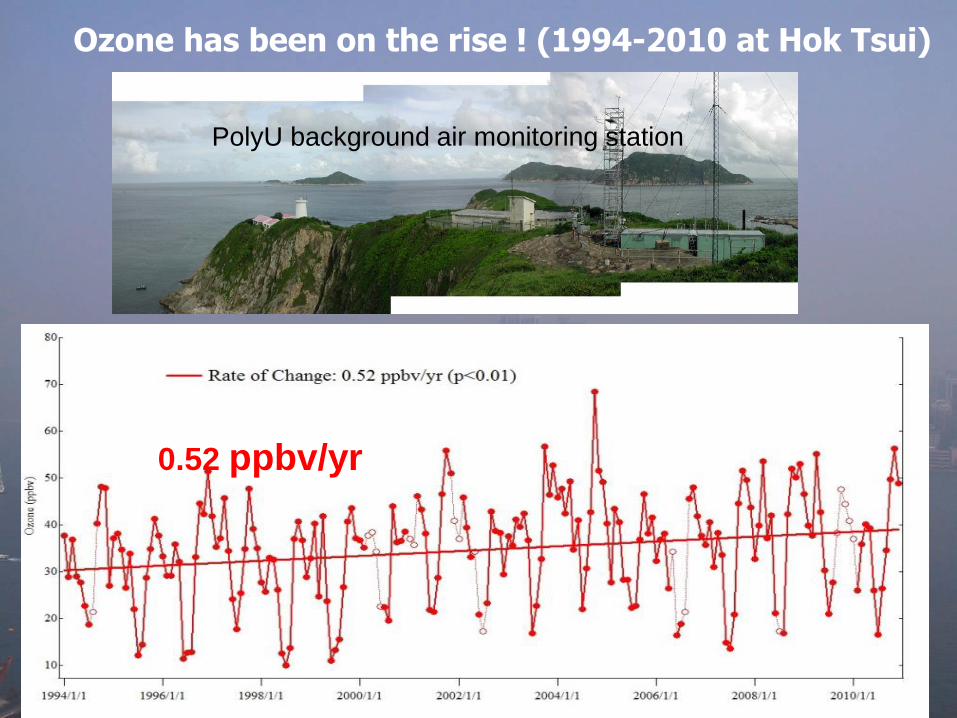
Ozone has been on the rise ! (1994-2010 at Hok Tsui)
Wang et at., ACP, 2009
PolyU background air monitoring station
21
0.52 ppbv/yr
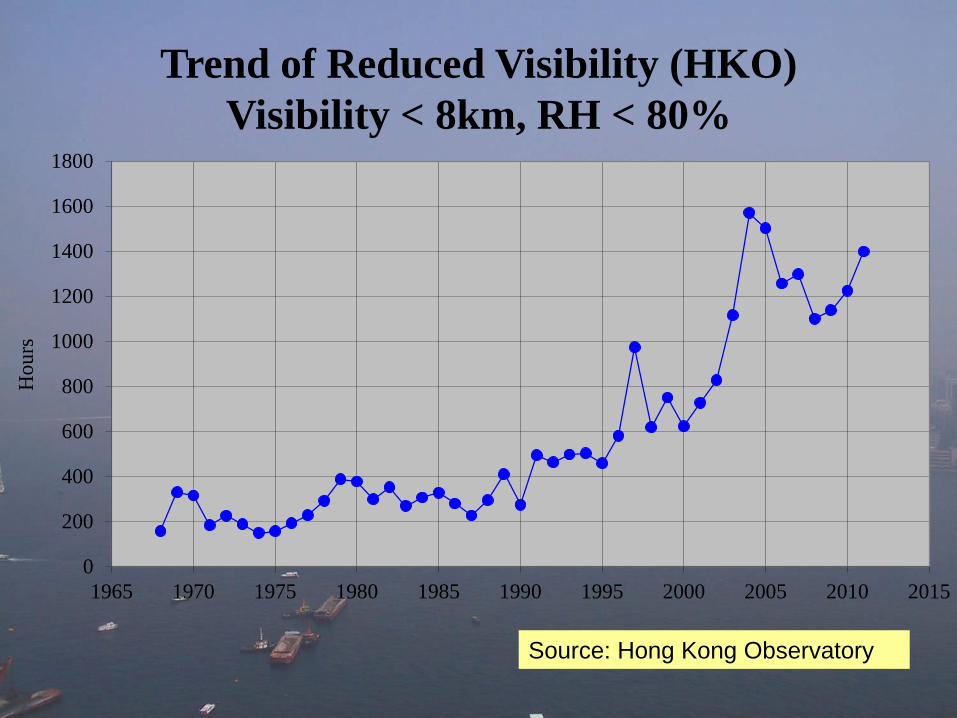
Trend of Reduced Visibility (HKO)
Visibility < 8km, RH < 80%
Source: Hong Kong Observatory
0
200
400
600
800
1000
1200
1400
1600
1800
1965 1970 1975 1980 1985 1990 1995 2000 2005 2010 2015
Ho
urs
Source: A Clean Air Plan, 2013, Hong Kong Government
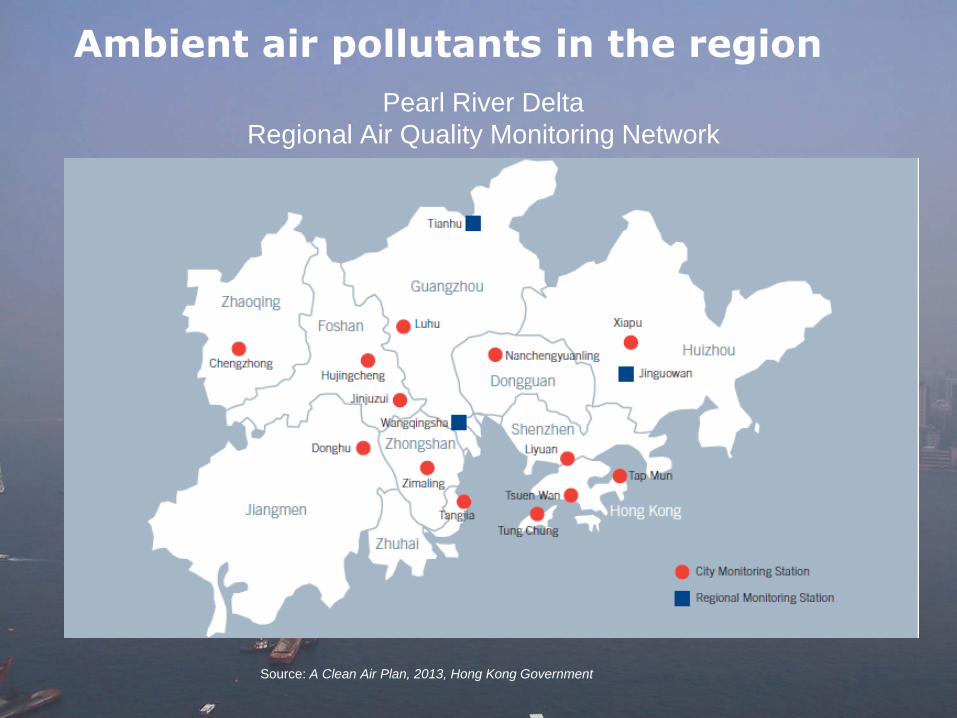
Pearl River Delta
Regional Air Quality Monitoring Network
Ambient air pollutants in the region
0
5
10
15
20
25
30
35
40
45
50
μg
/m
3 o
r d
ays
Monitoring Stations
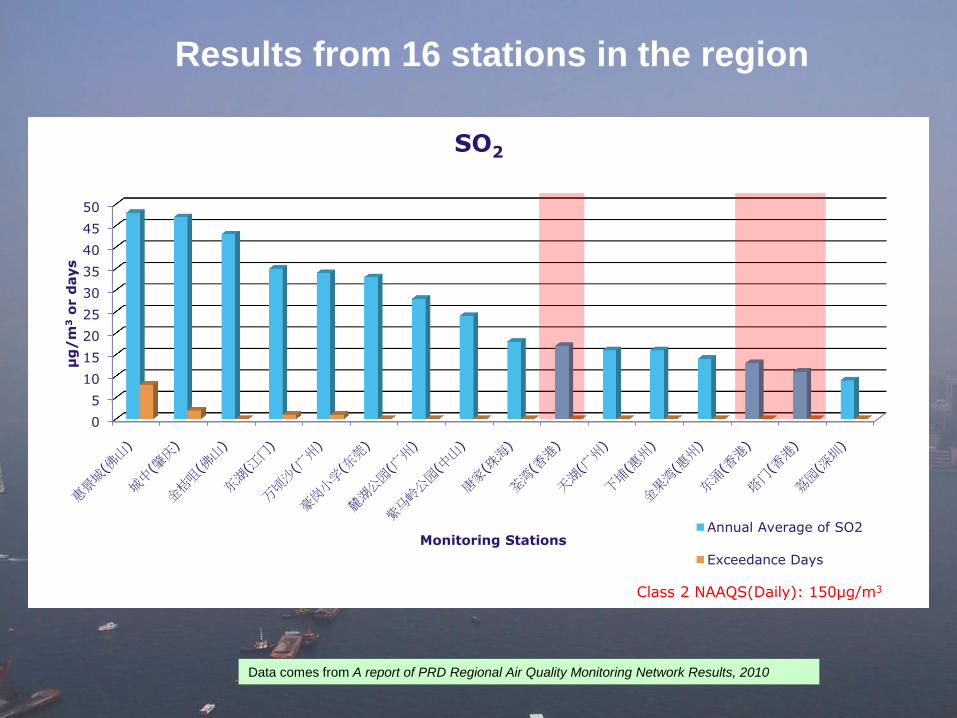
SO2
Annual Average of SO2
Exceedance Days
Class 2 NAAQS(Daily): 150μg/m3
Results from 16 stations in the region
Data comes from A report of PRD Regional Air Quality Monitoring Network Results, 2010
0
10
20
30
40
50
60
70
μg
/m
3 o
r d
ays
Monitoring Stations
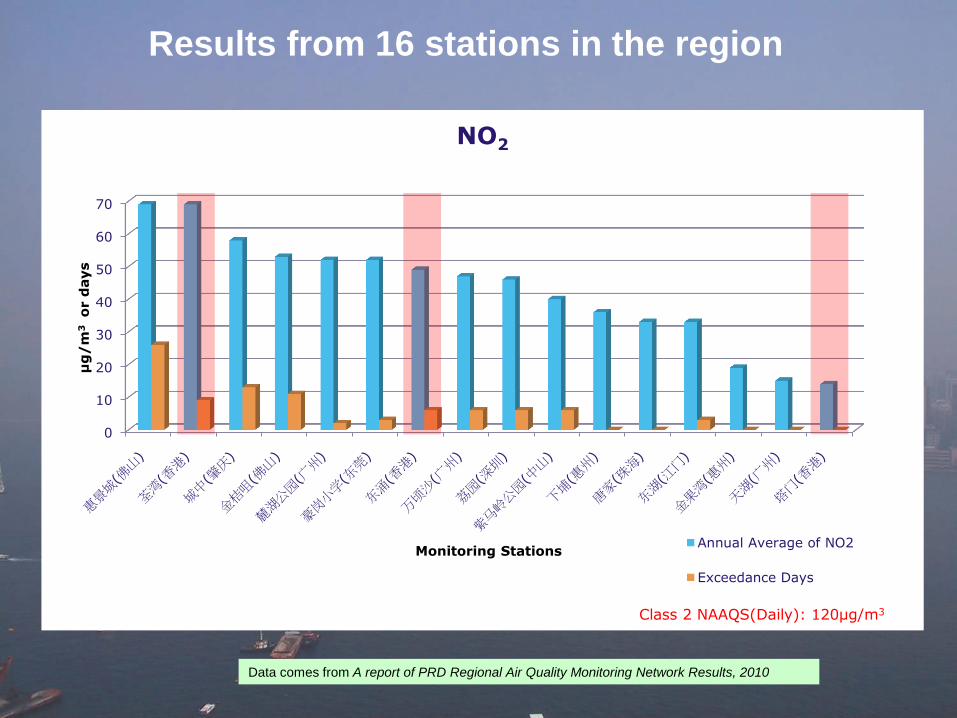
NO2
Annual Average of NO2
Exceedance Days
Class 2 NAAQS(Daily): 120μg/m3
Results from 16 stations in the region
Data comes from A report of PRD Regional Air Quality Monitoring Network Results, 2010
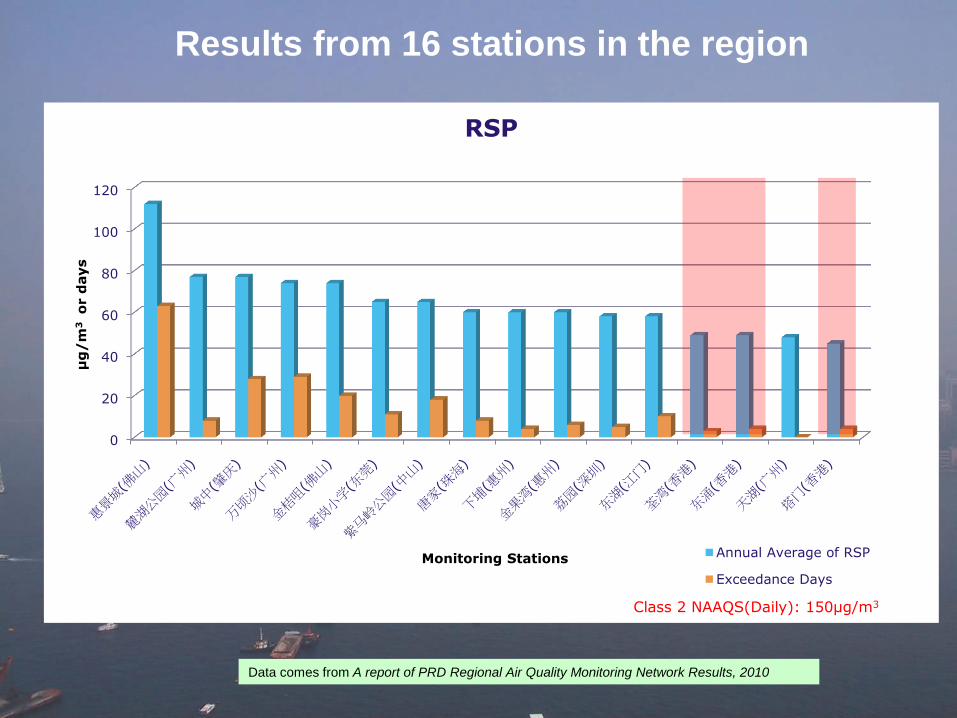
0
20
40
60
80
100
120
μg
/m
3 o
r d
ays
Monitoring Stations
RSP
Annual Average of RSP
Exceedance Days
Class 2 NAAQS(Daily): 150μg/m3
Results from 16 stations in the region
Data comes from A report of PRD Regional Air Quality Monitoring Network Results, 2010
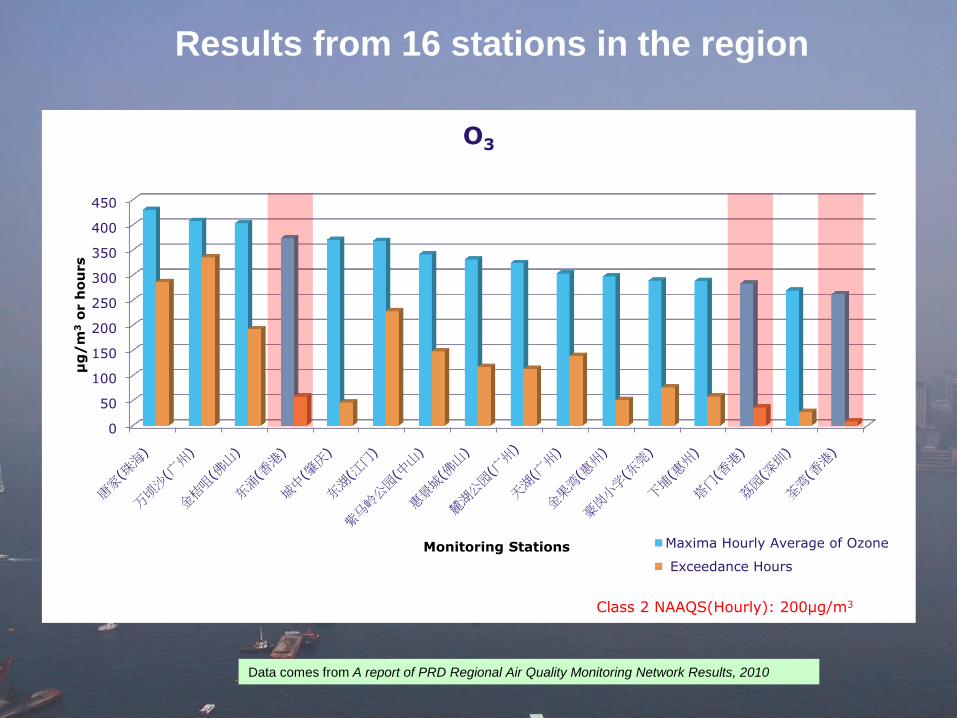
0
50
100
150
200
250
300
350
400
450
μg
/m
3 o
r h
ou
rs
Monitoring Stations
O3
Maxima Hourly Average of Ozone
Exceedance Hours
Class 2 NAAQS(Hourly): 200μg/m3
Results from 16 stations in the region
Data comes from A report of PRD Regional Air Quality Monitoring Network Results, 2010
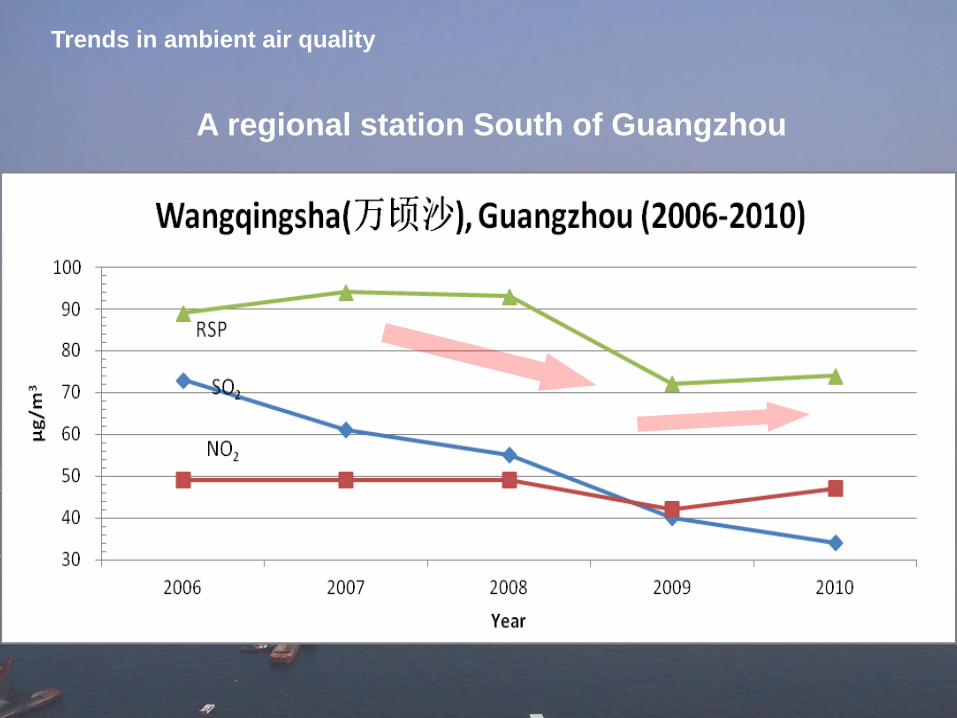
Trends in ambient air quality
A regional station South of Guangzhou
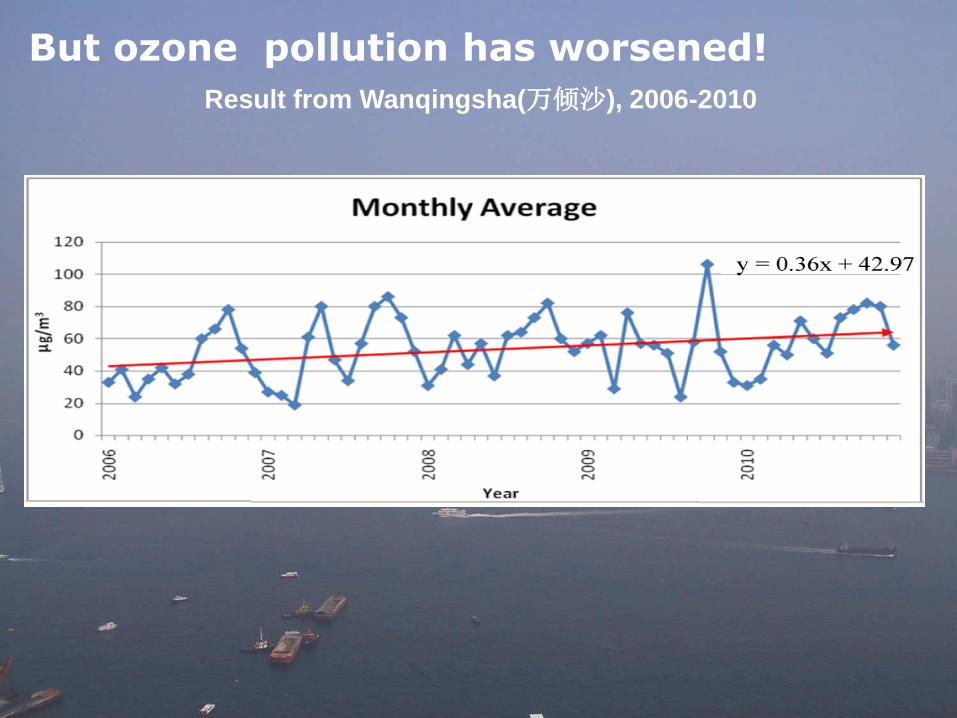
But ozone pollution has worsened!
Result from Wanqingsha(万倾沙), 2006-2010
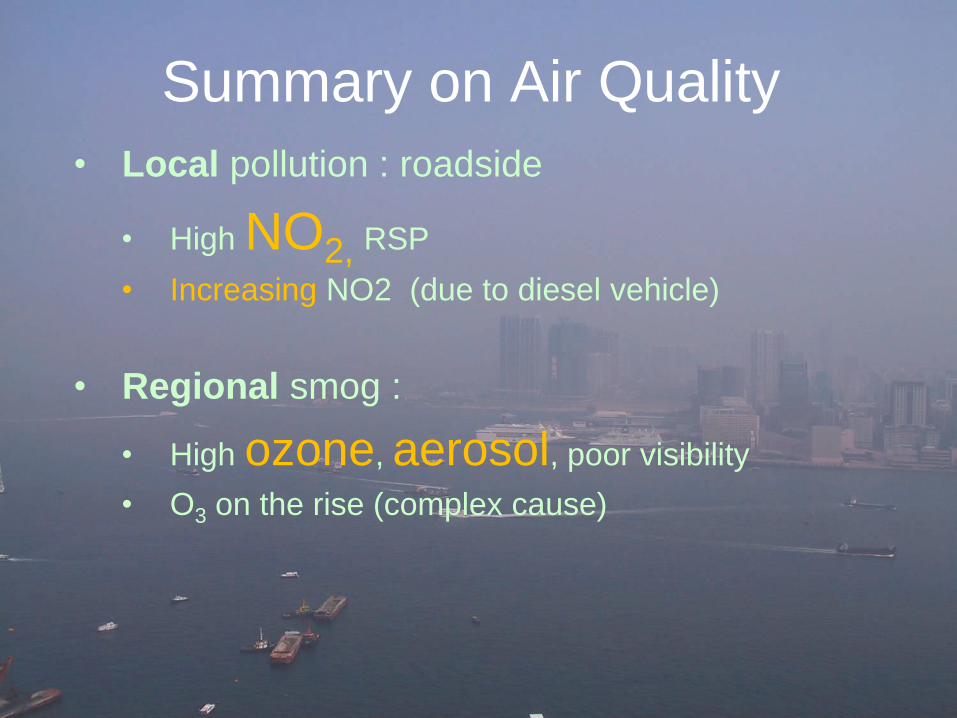
Summary on Air Quality
• Local pollution : roadside
• High NO2, RSP
• Increasing NO2 (due to diesel vehicle)
• Regional smog :
• High ozone, aerosol, poor visibility
• O3 on the rise (complex cause)
Control Policies
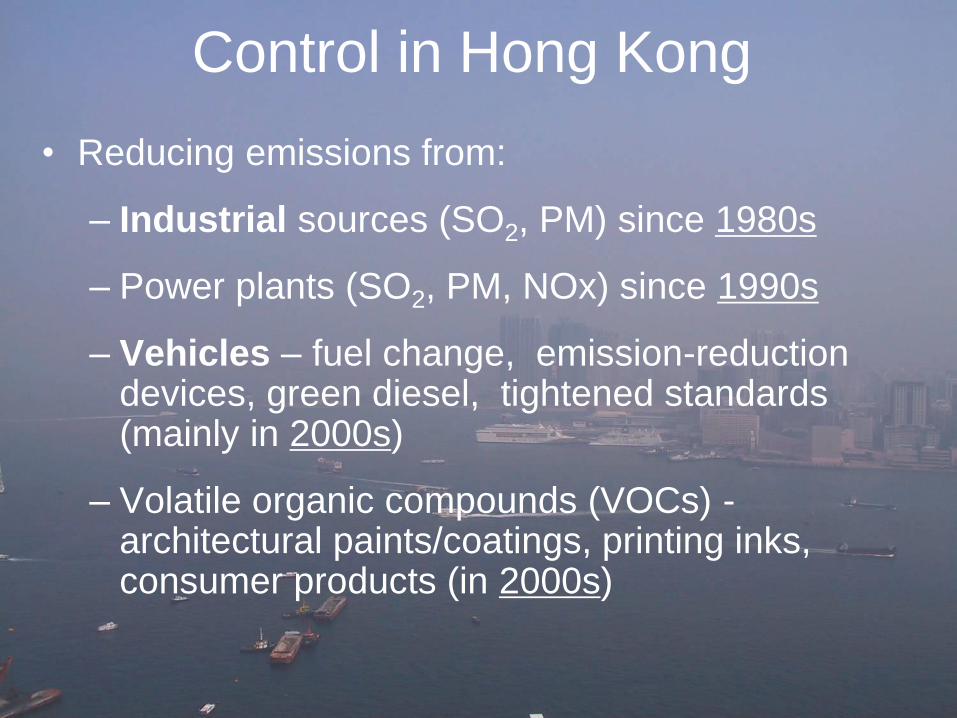
• Reducing emissions from:
– Industrial sources (SO2, PM) since 1980s
– Power plants (SO2, PM, NOx) since 1990s
– Vehicles – fuel change, emission-reduction devices, green diesel, tightened standards (mainly in 2000s)
– Volatile organic compounds (VOCs) - architectural paints/coatings, printing inks, consumer products (in 2000s)
Control in Hong Kong
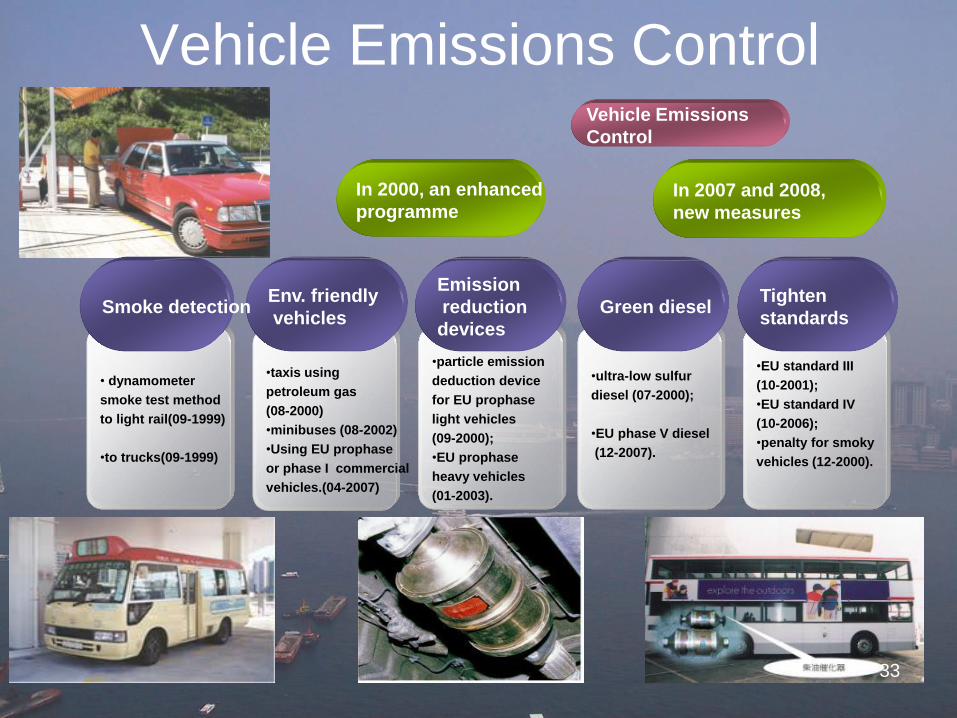
•taxis using
petroleum gas
(08-2000)
•minibuses (08-2002)
•Using EU prophase
or phase I commercial
vehicles.(04-2007)
Vehicle Emissions Control
In 2007 and 2008,
new measures
In 2000, an enhanced
programme
Vehicle Emissions
Control
• dynamometer
smoke test method
to light rail(09-1999)
•to trucks(09-1999)
•particle emission
deduction device
for EU prophase
light vehicles
(09-2000);
•EU prophase
heavy vehicles
(01-2003).
•ultra-low sulfur
diesel (07-2000);
•EU phase V diesel
(12-2007).
•EU standard III
(10-2001);
•EU standard IV
(10-2006);
•penalty for smoky
vehicles (12-2000).
Env. friendly
vehicles
Emission
reduction
devices
Green diesel Tighten
standards Smoke detection
33
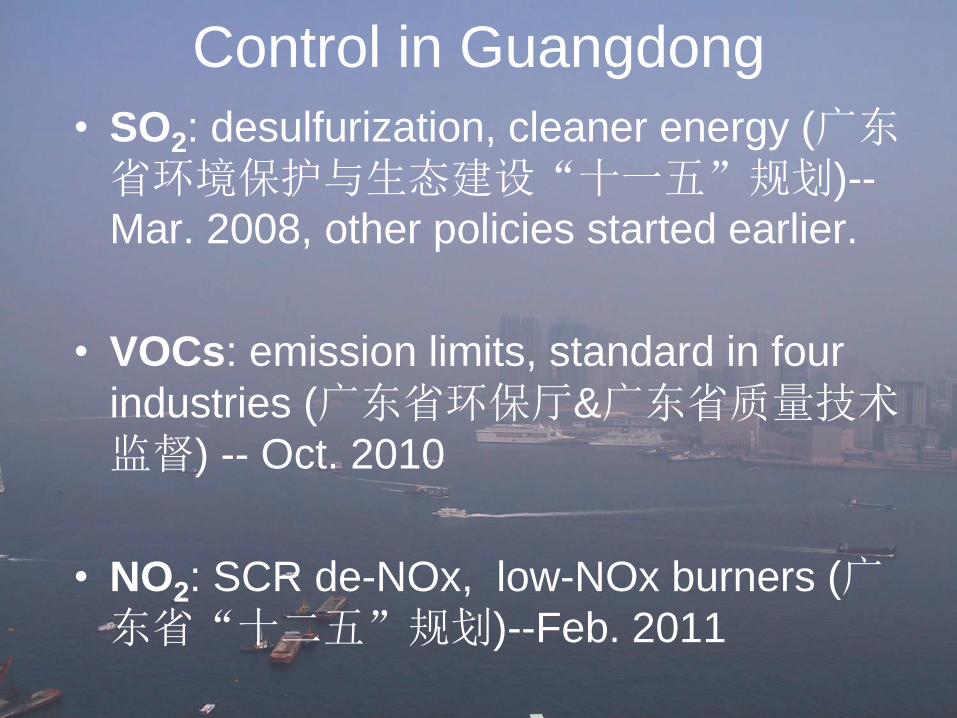
• SO2: desulfurization, cleaner energy (广东省环境保护与生态建设“十一五”规划)--
Mar. 2008, other policies started earlier.
• VOCs: emission limits, standard in four
industries (广东省环保厅&广东省质量技术监督) -- Oct. 2010
• NO2: SCR de-NOx, low-NOx burners (广东省“十二五”规划)--Feb. 2011
Control in Guangdong
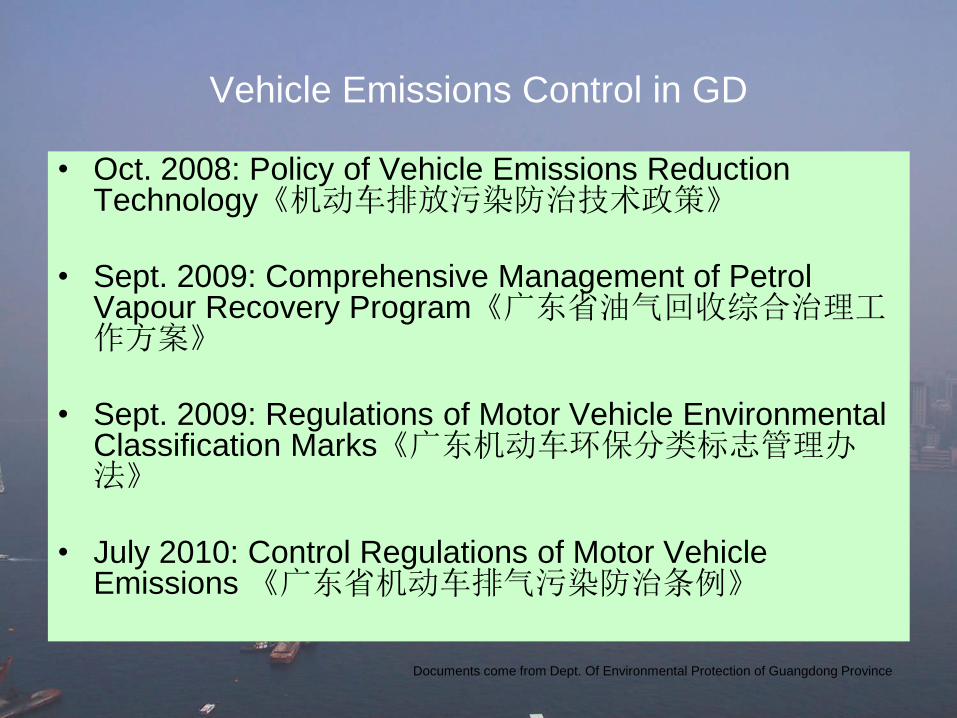
• Oct. 2008: Policy of Vehicle Emissions Reduction Technology《机动车排放污染防治技术政策》
• Sept. 2009: Comprehensive Management of Petrol Vapour Recovery Program《广东省油气回收综合治理工作方案》
• Sept. 2009: Regulations of Motor Vehicle Environmental Classification Marks《广东机动车环保分类标志管理办法》
• July 2010: Control Regulations of Motor Vehicle Emissions 《广东省机动车排气污染防治条例》
Vehicle Emissions Control in GD
Documents come from Dept. Of Environmental Protection of Guangdong Province
“Double-shifting”(双转移) Policy
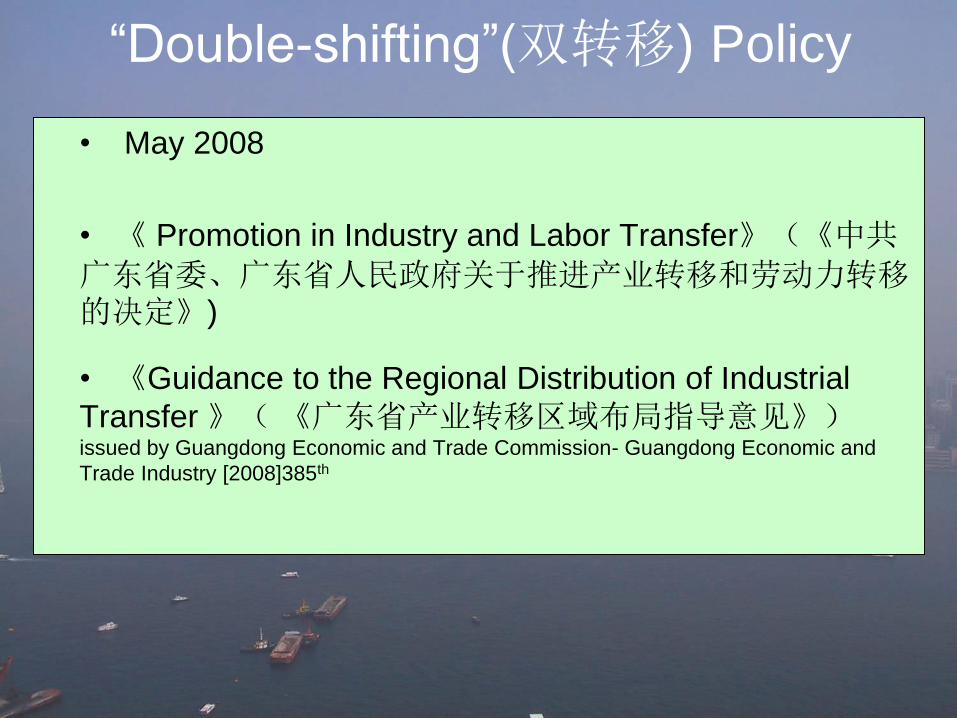
• May 2008
• 《 Promotion in Industry and Labor Transfer》(《中共广东省委、广东省人民政府关于推进产业转移和劳动力转移的决定》)
• 《Guidance to the Regional Distribution of Industrial
Transfer 》( 《广东省产业转移区域布局指导意见》)issued by Guangdong Economic and Trade Commission- Guangdong Economic and
Trade Industry [2008]385th
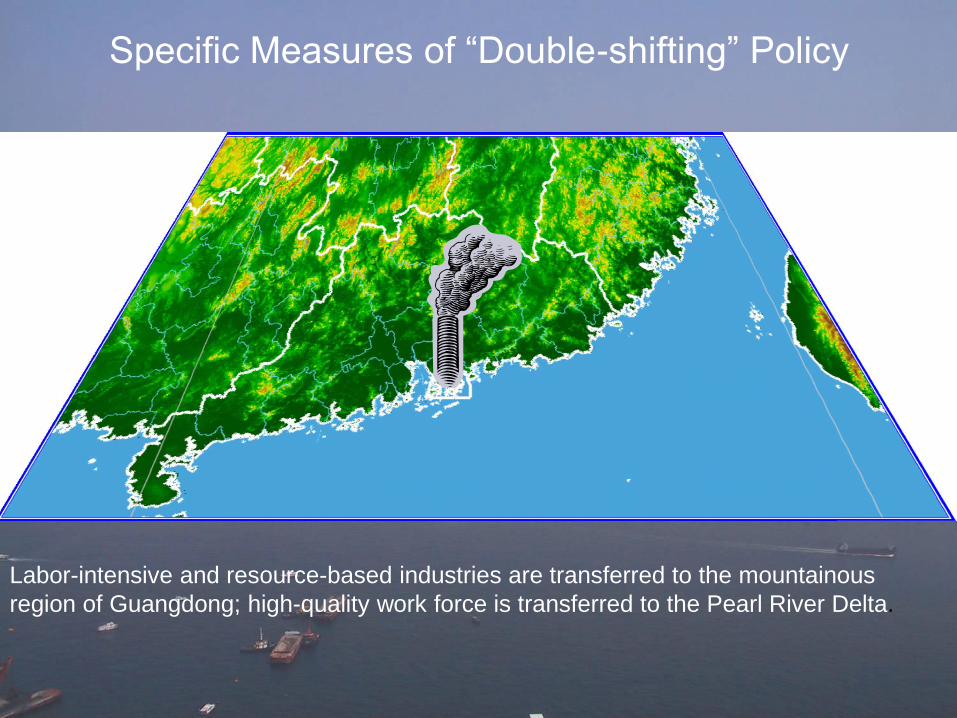
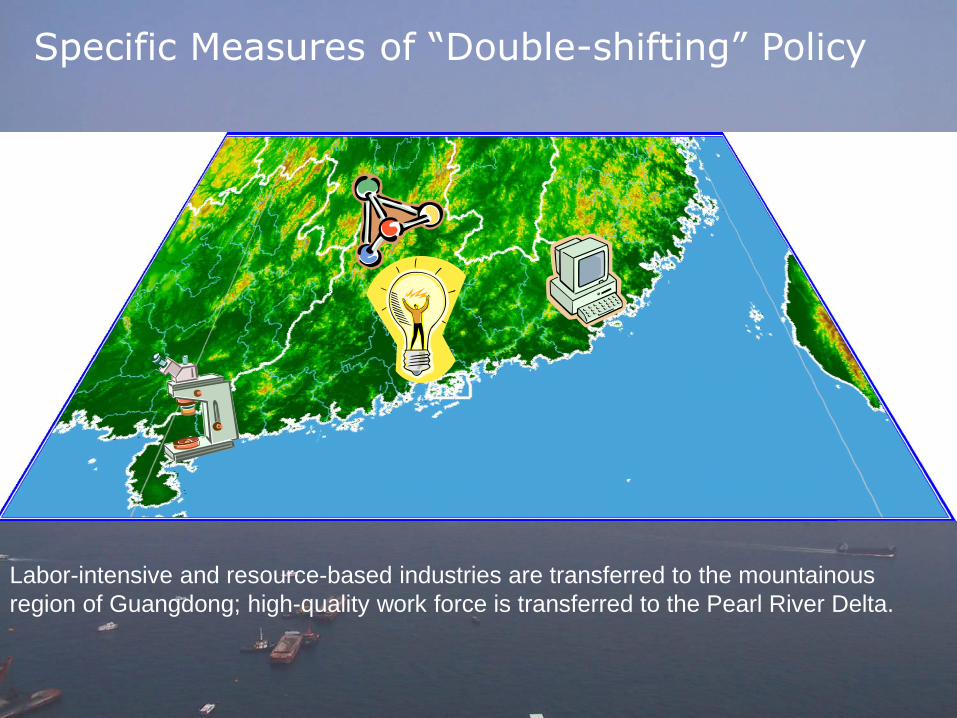
Specific Measures of “Double-shifting” Policy
Labor-intensive and resource-based industries are transferred to the mountainous
region of Guangdong; high-quality work force is transferred to the Pearl River Delta.
Labor-intensive and resource-based industries are transferred to the mountainous
region of Guangdong; high-quality work force is transferred to the Pearl River Delta.
Specific Measures of “Double-shifting” Policy
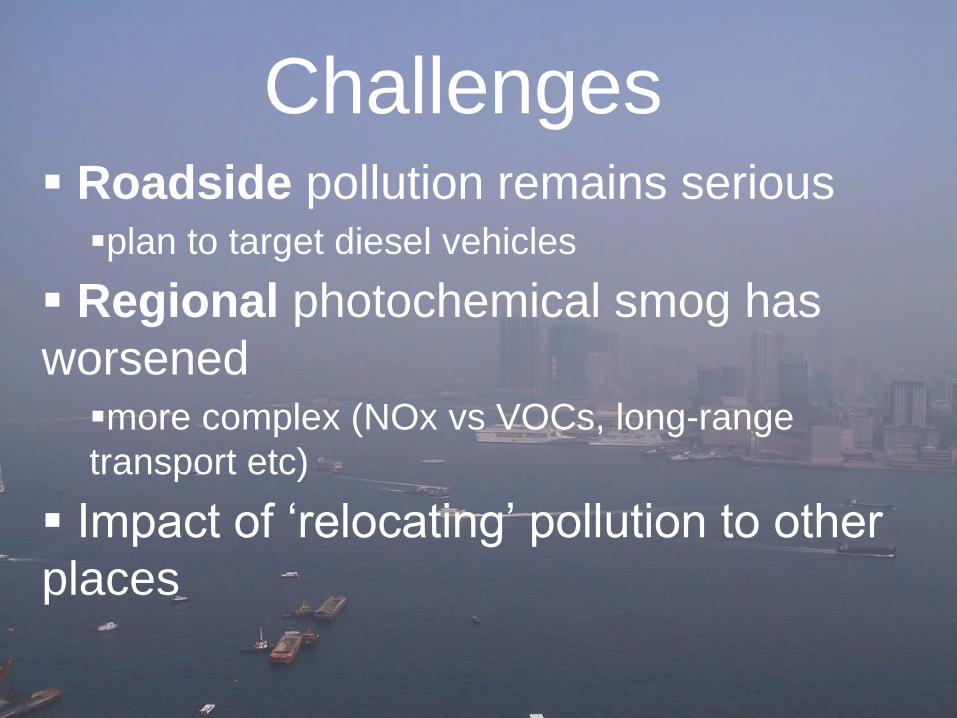
Challenges Roadside pollution remains serious plan to target diesel vehicles
Regional photochemical smog has
worsened more complex (NOx vs VOCs, long-range
transport etc)
Impact of ‘relocating’ pollution to other
places
Regional air quality research at PolyU
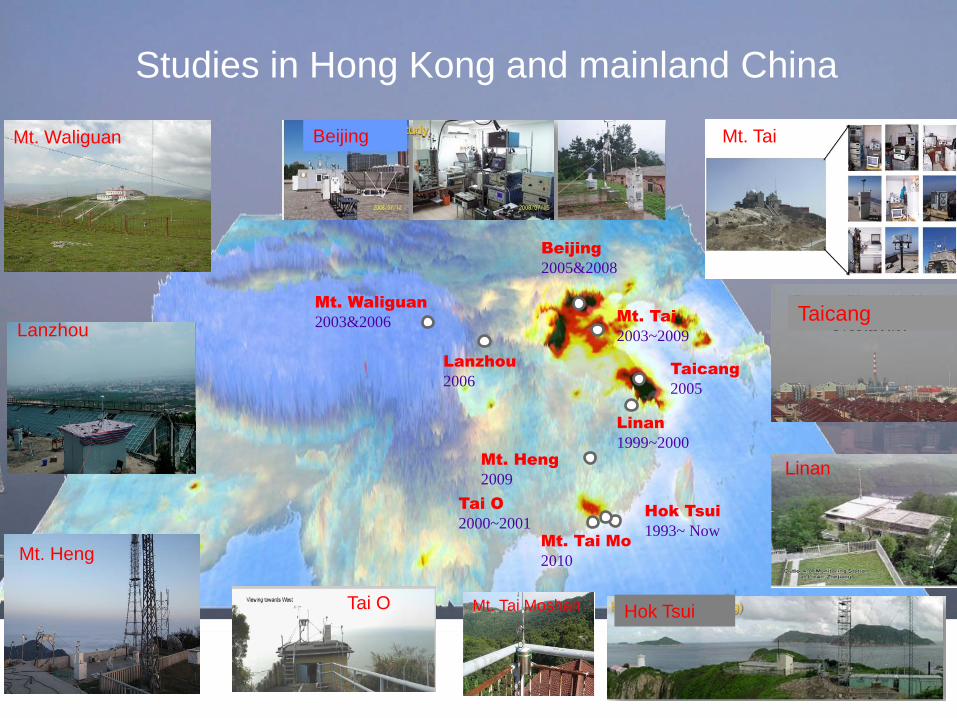
Tai O
2000~2001 Hok Tsui
1993~ Now
Mt. Heng
2009
Linan
1999~2000
Taicang
2005
Lanzhou
2006
Mt. Waliguan
2003&2006 Mt. Tai
2003~2009
Beijing
2005&2008
Linan
Taicang
Mt. Heng
Lanzhou
Tai O Hok Tsui
Mt. Waliguan Beijing Mt. Tai
Mt. Tai Moshan
Mt. Tai Mo
2010
Studies in Hong Kong and mainland China
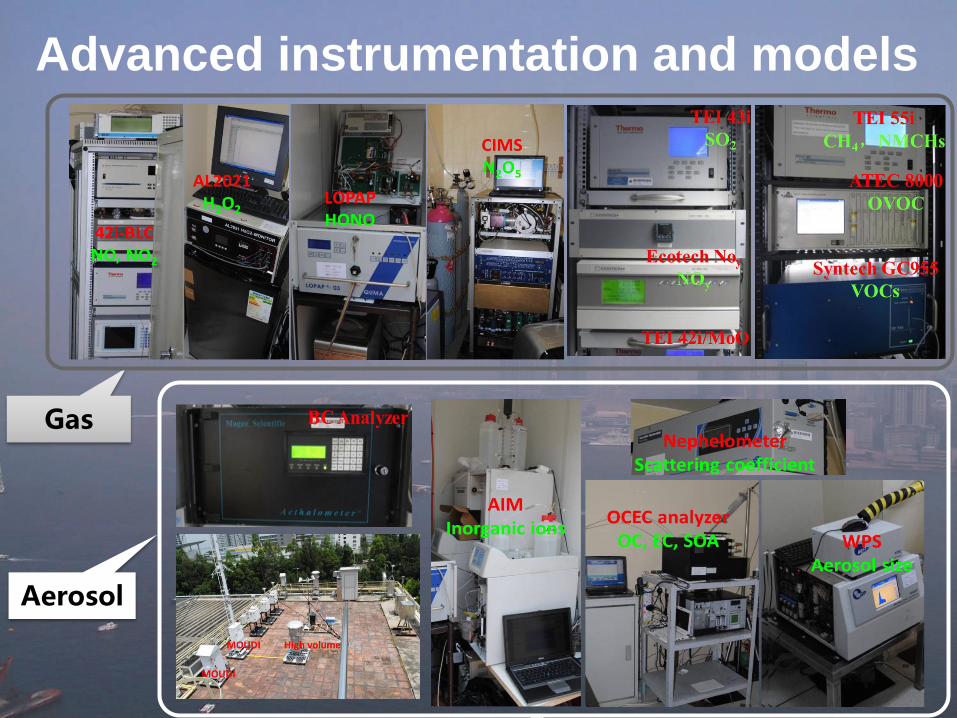
Advanced instrumentation and models
42
Gas
Aerosol
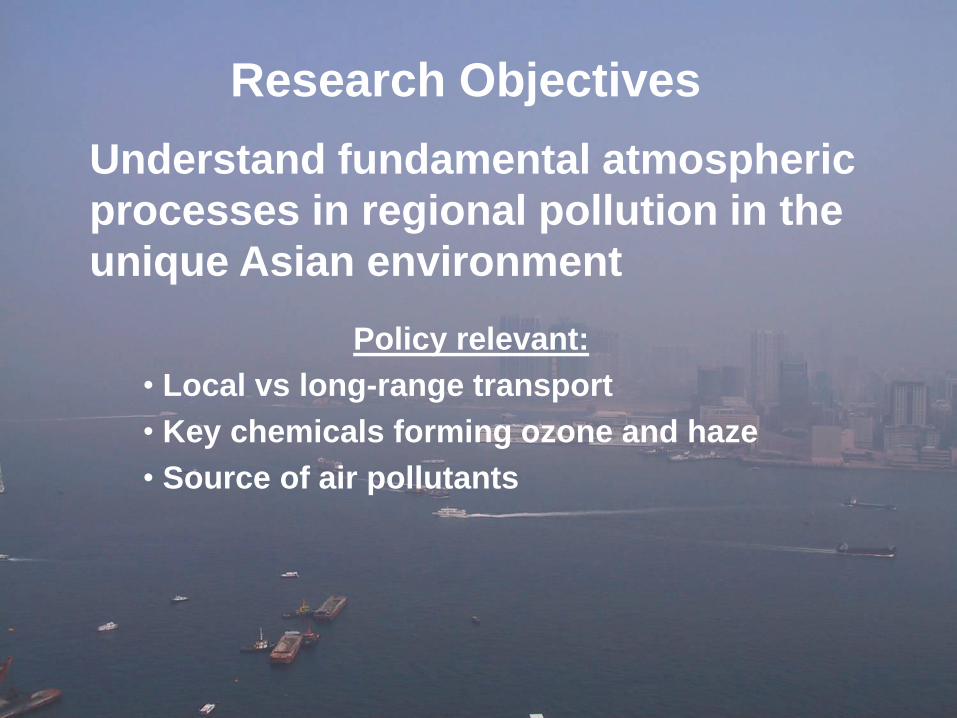
Research Objectives
Understand fundamental atmospheric
processes in regional pollution in the
unique Asian environment
Policy relevant:
• Local vs long-range transport
• Key chemicals forming ozone and haze
• Source of air pollutants
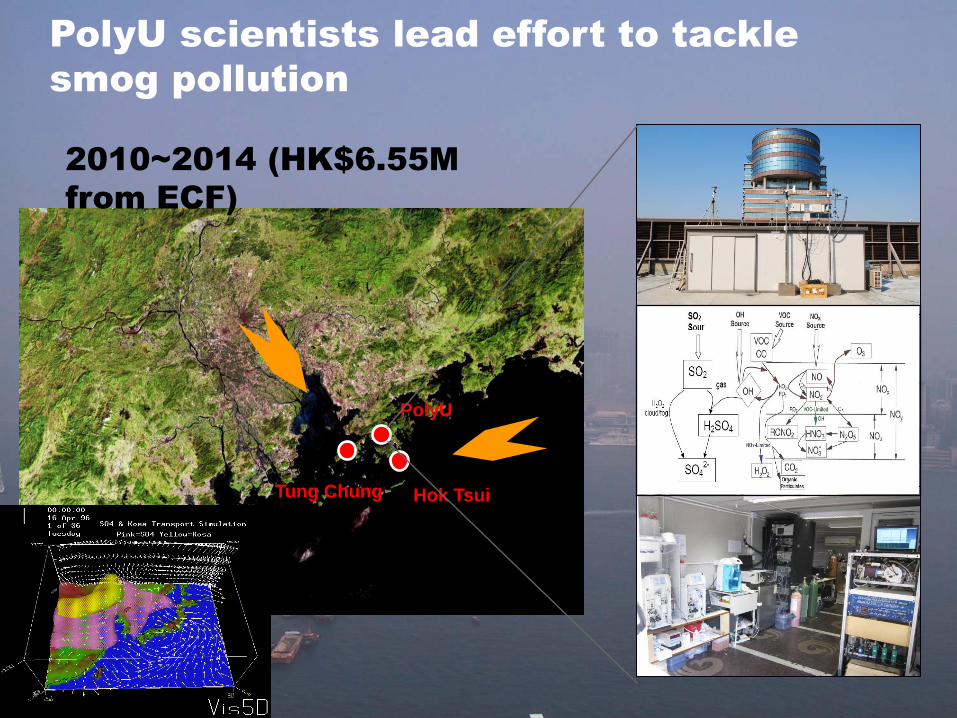
PolyU
Hok Tsui Tung Chung
PolyU scientists lead effort to tackle
smog pollution
2010~2014 (HK$6.55M
from ECF)

Thank You
This is the blue sky in summer
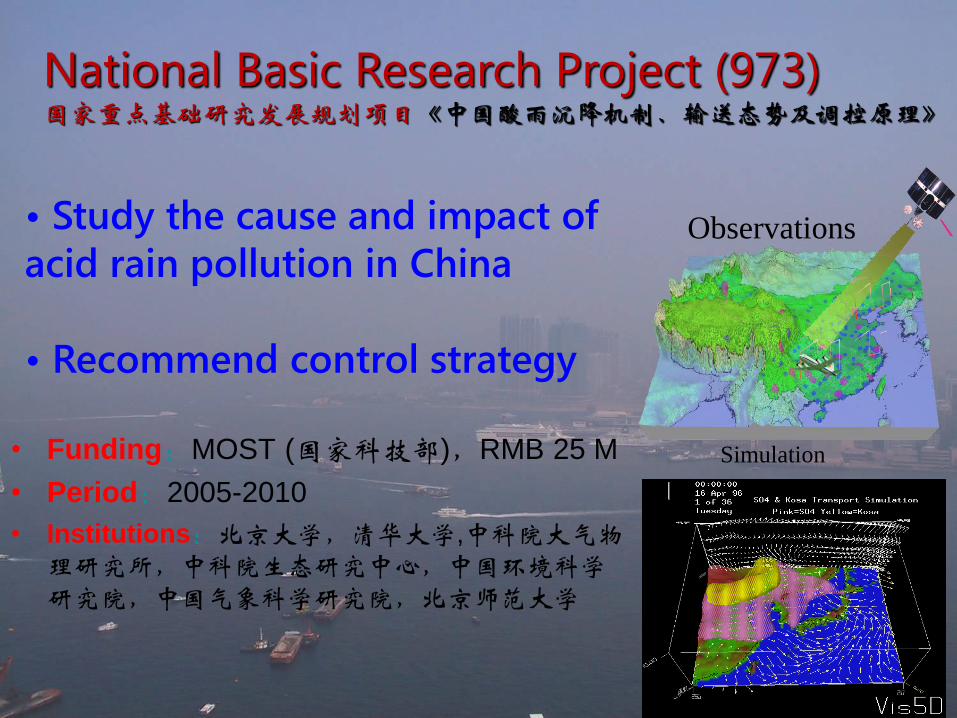
• Funding:MOST (国家科技部),RMB 25 M
• Period:2005-2010
• Institutions:北京大学,清华大学,中科院大气物理研究所,中科院生态研究中心,中国环境科学研究院,中国气象科学研究院,北京师范大学
National Basic Research Project (973) 国家重点基础研究发展规划项目《中国酸雨沉降机制、输送态势及调控原理》
• Study the cause and impact of
acid rain pollution in China
• Recommend control strategy
Observations
Simulation
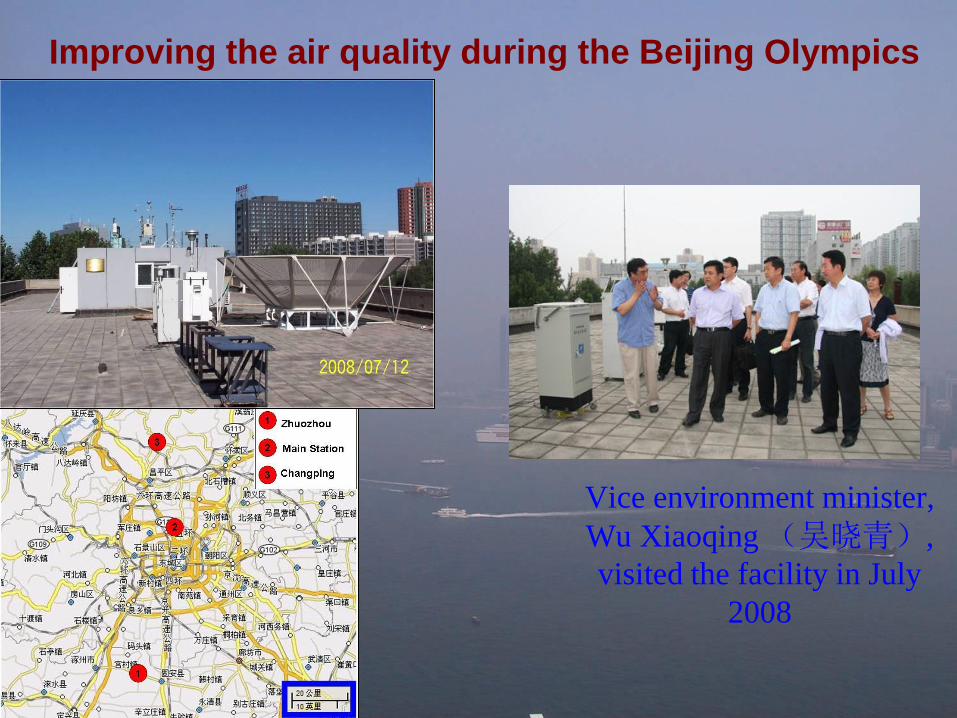
Vice environment minister,
Wu Xiaoqing (吴晓青),
visited the facility in July
2008
Improving the air quality during the Beijing Olympics
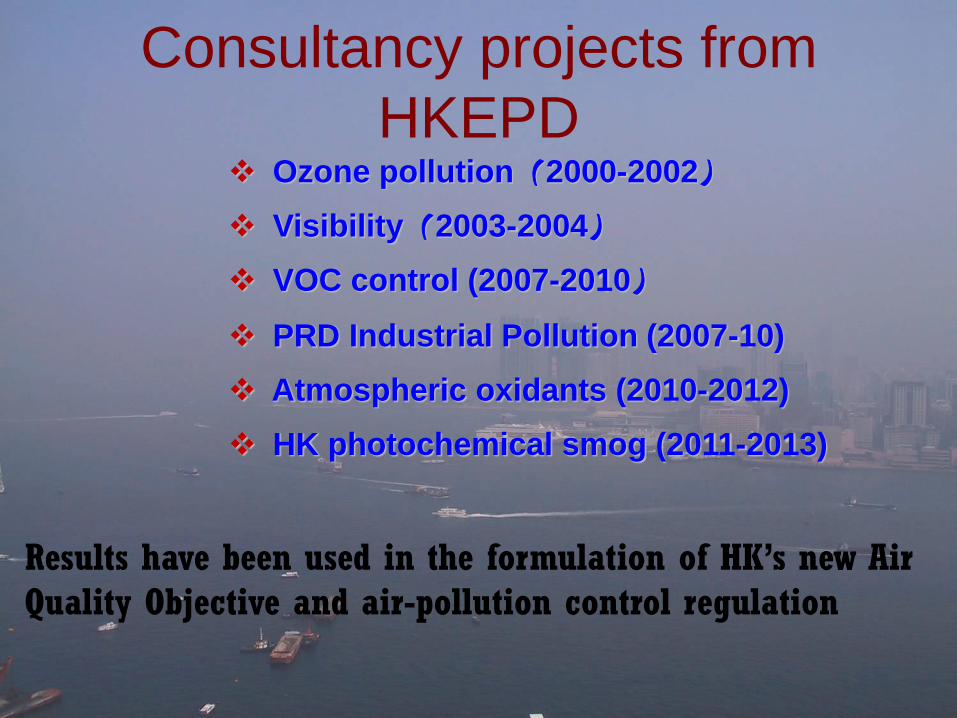
Consultancy projects from
HKEPD Ozone pollution(2000-2002)
Visibility(2003-2004)
VOC control (2007-2010)
PRD Industrial Pollution (2007-10)
Atmospheric oxidants (2010-2012)
HK photochemical smog (2011-2013)
Results have been used in the formulation of HK’s new Air Quality Objective and air-pollution control regulation
Energy consumption in Guangdong
En
erg
y c
on
su
mp
tio
n
(10
00
0 to
ns o
f S
CE
)
GDP in Guangdong
GD
P (
10
0M
RM
B)
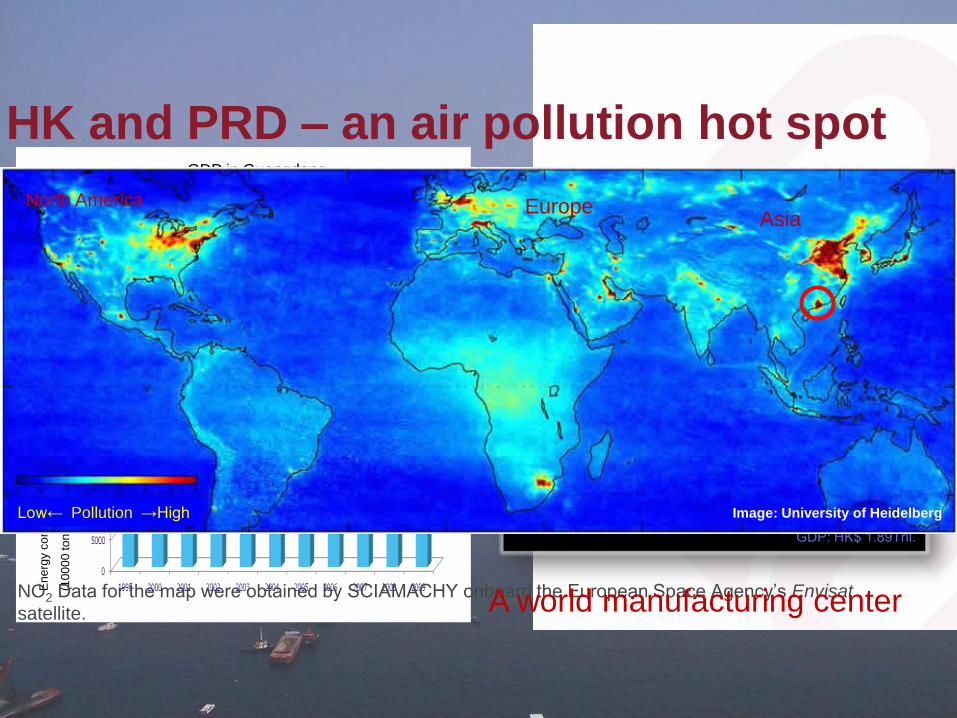
PRD Area: 41,698 km2
Pop.:47.8M (2009)
GDP: ¥3.21Tril
HK Area: 1,104 km2
Pop.: 7.10M (2011)
GDP: HK$ 1.89Tril.
NO2 Data for the map were obtained by SCIAMACHY onboard the European Space Agency’s Envisat
satellite.
HK and PRD – an air pollution hot spot
Asia Europe North America
Low← Pollution →High Image: University of Heidelberg
A world manufacturing center
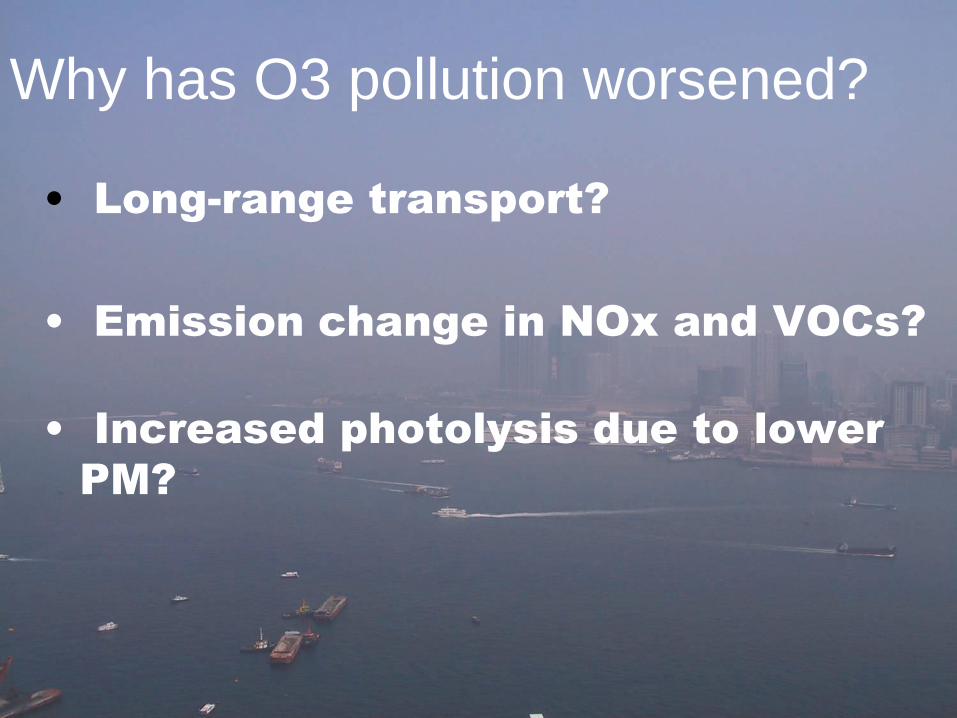
• Long-range transport?
• Emission change in NOx and VOCs?
• Increased photolysis due to lower
PM?
Why has O3 pollution worsened?
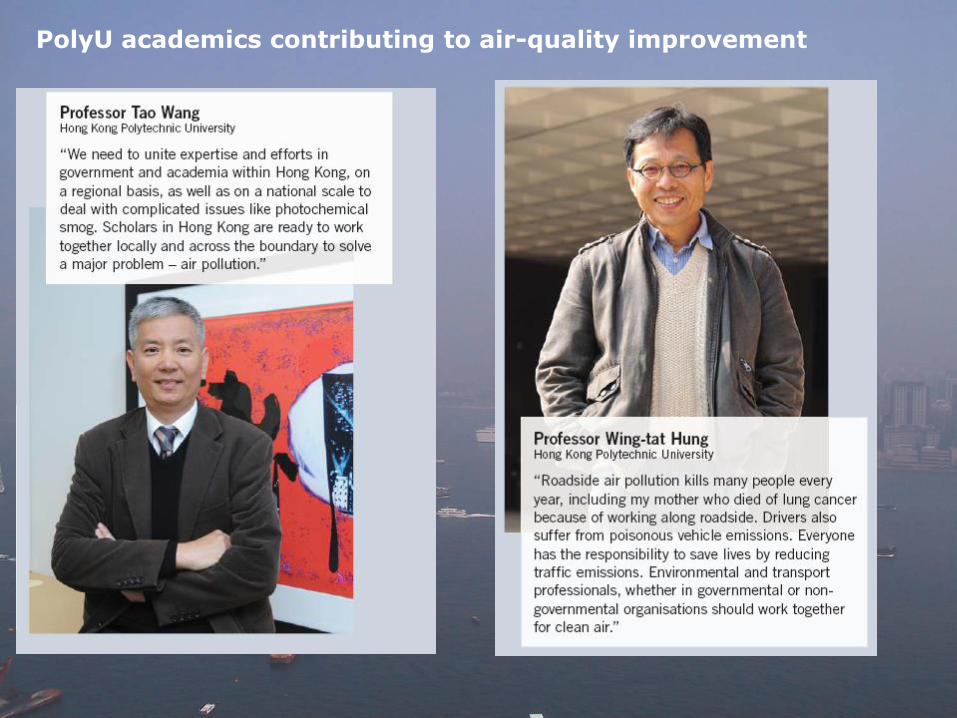
PolyU academics contributing to air-quality improvement
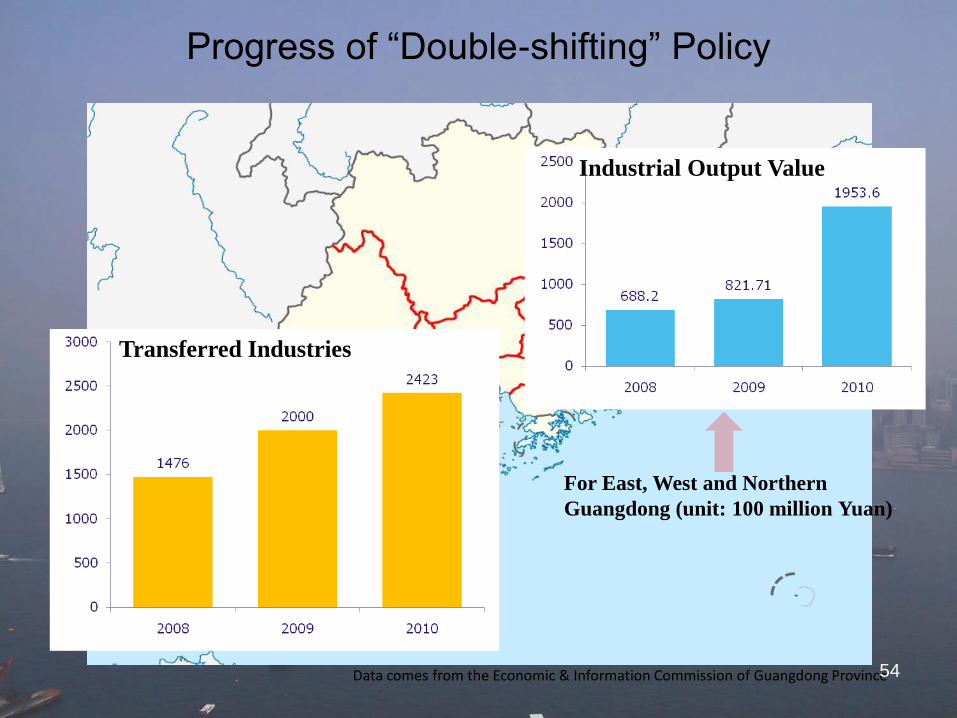
Progress of “Double-shifting” Policy
Data comes from the Economic & Information Commission of Guangdong Province
Transferred Industries
Industrial Output Value
For East, West and Northern
Guangdong (unit: 100 million Yuan)
54
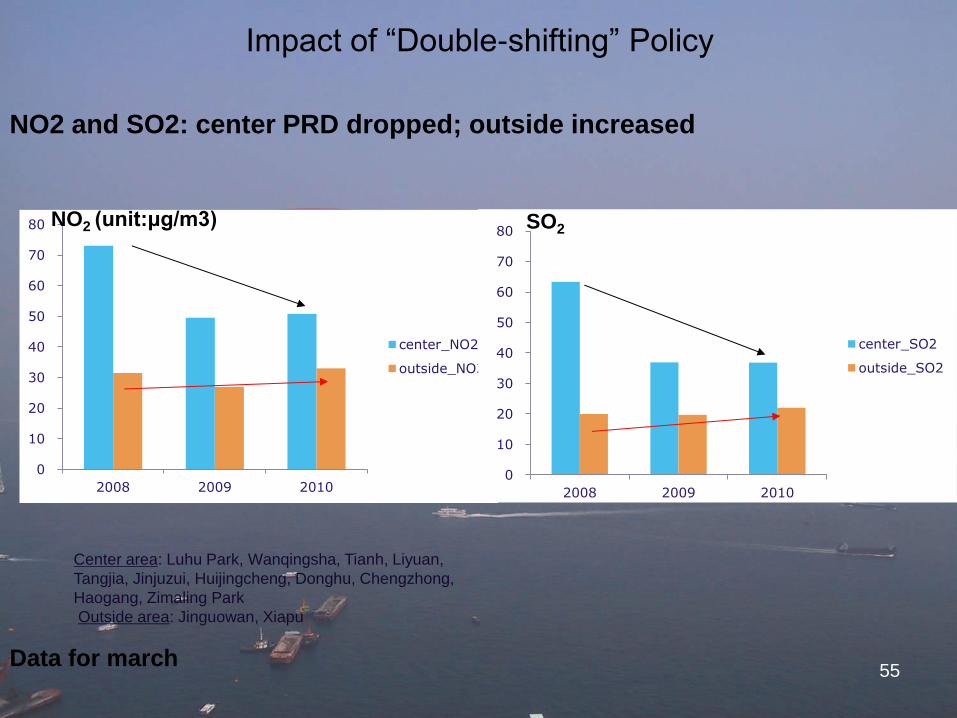
Impact of “Double-shifting” Policy
NO2 and SO2: center PRD dropped; outside increased
Data for march
Center area: Luhu Park, Wanqingsha, Tianh, Liyuan,
Tangjia, Jinjuzui, Huijingcheng, Donghu, Chengzhong,
Haogang, Zimaling Park
Outside area: Jinguowan, Xiapu
0
10
20
30
40
50
60
70
80
2008 2009 2010
center_NO2
outside_NO2
NO2 (unit:μg/m3)
0
10
20
30
40
50
60
70
80
2008 2009 2010
center_SO2
outside_SO2
SO2
55
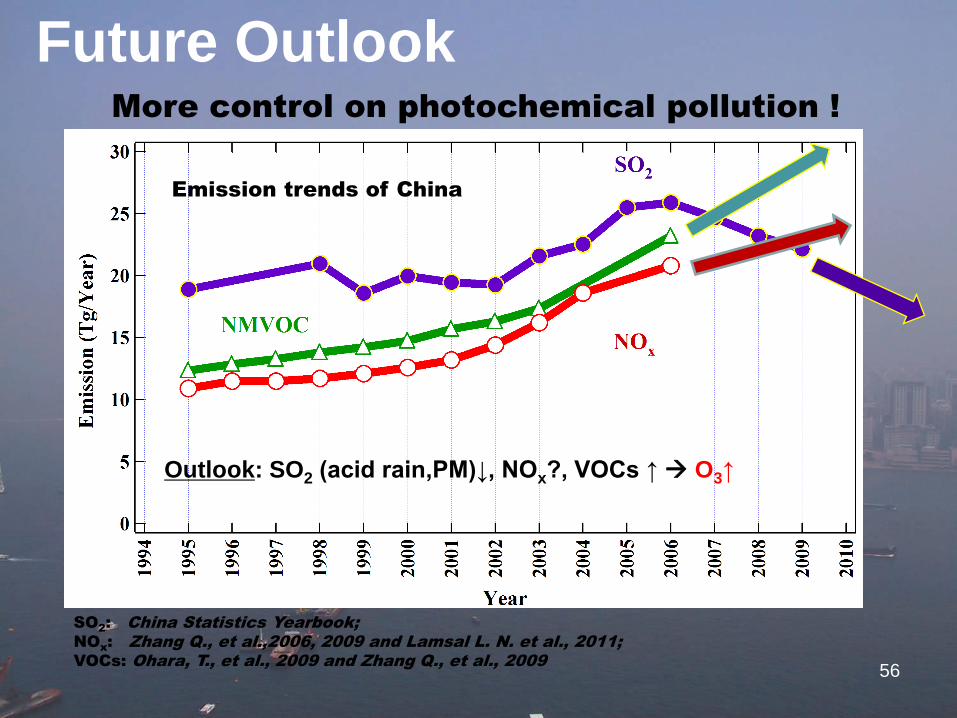
SO2: China Statistics Yearbook;
NOx: Zhang Q., et al.,2006, 2009 and Lamsal L. N. et al., 2011;
VOCs: Ohara, T., et al., 2009 and Zhang Q., et al., 2009
Emission trends of China
Outlook: SO2 (acid rain,PM)↓, NOx?, VOCs ↑ O3↑
Future Outlook More control on photochemical pollution !
56
0
20
40
60
80
100
120
140
Em
issio
n(1
00
00
to
nn
es)
Year
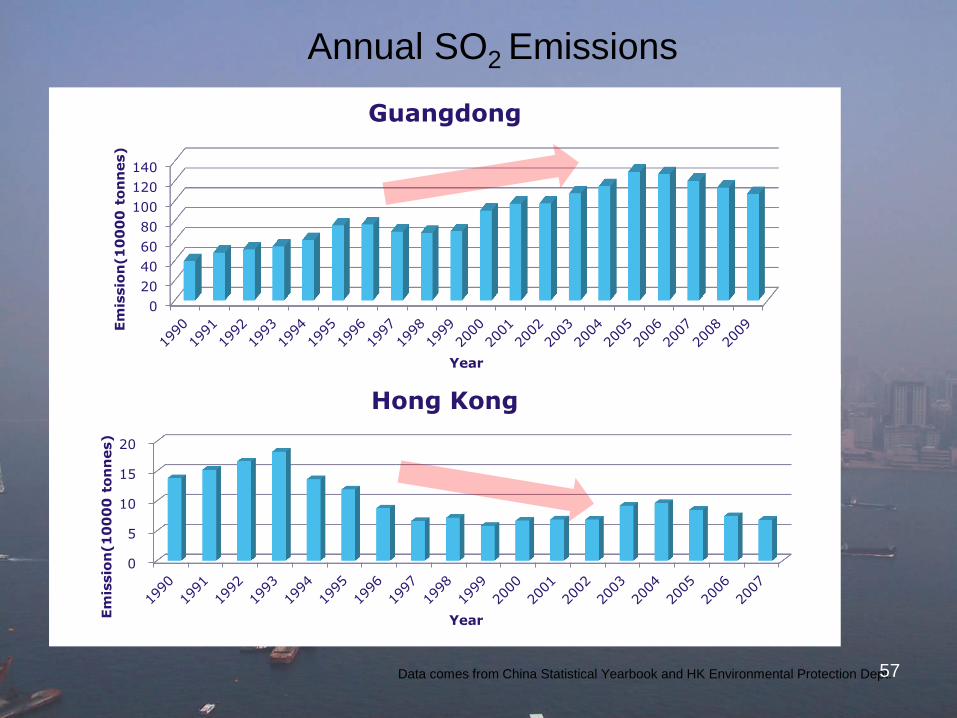
Guangdong
0
5
10
15
20
Em
issio
n(1
00
00
to
nn
es)
Year
Hong Kong
Annual SO2 Emissions
Data comes from China Statistical Yearbook and HK Environmental Protection Dept. 57
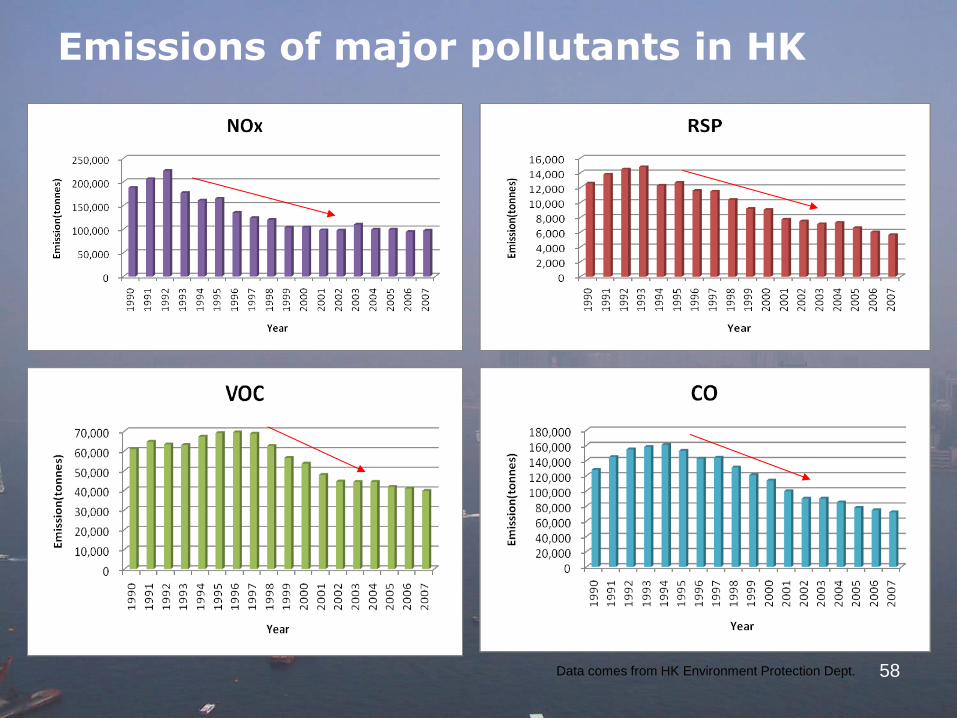
Emissions of major pollutants in HK
Data comes from HK Environment Protection Dept. 58
Research
59
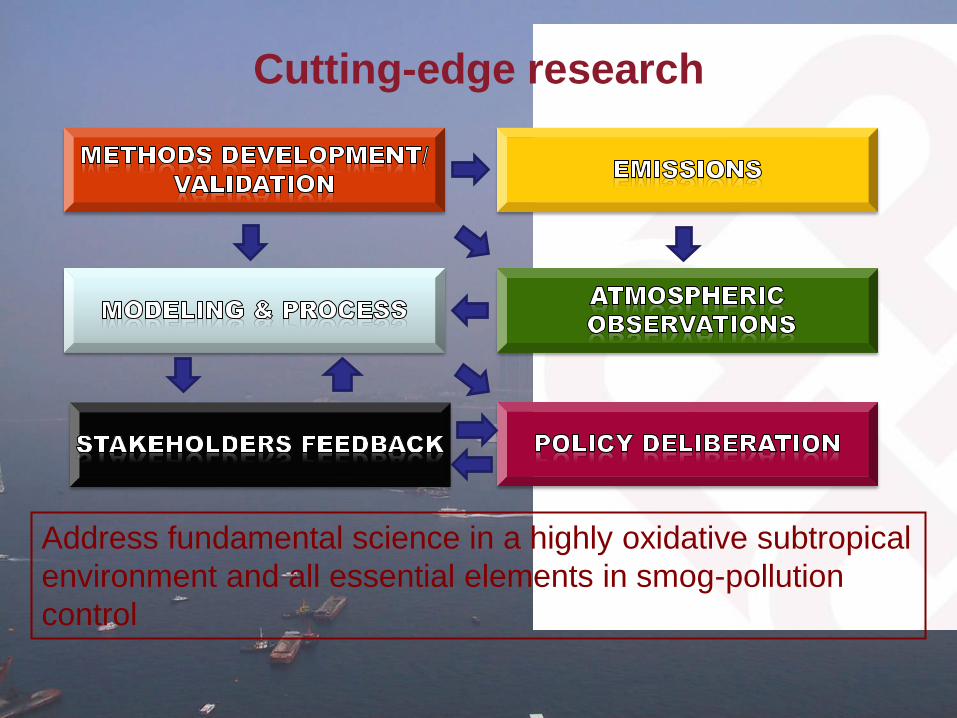
Cutting-edge research
Address fundamental science in a highly oxidative subtropical
environment and all essential elements in smog-pollution
control
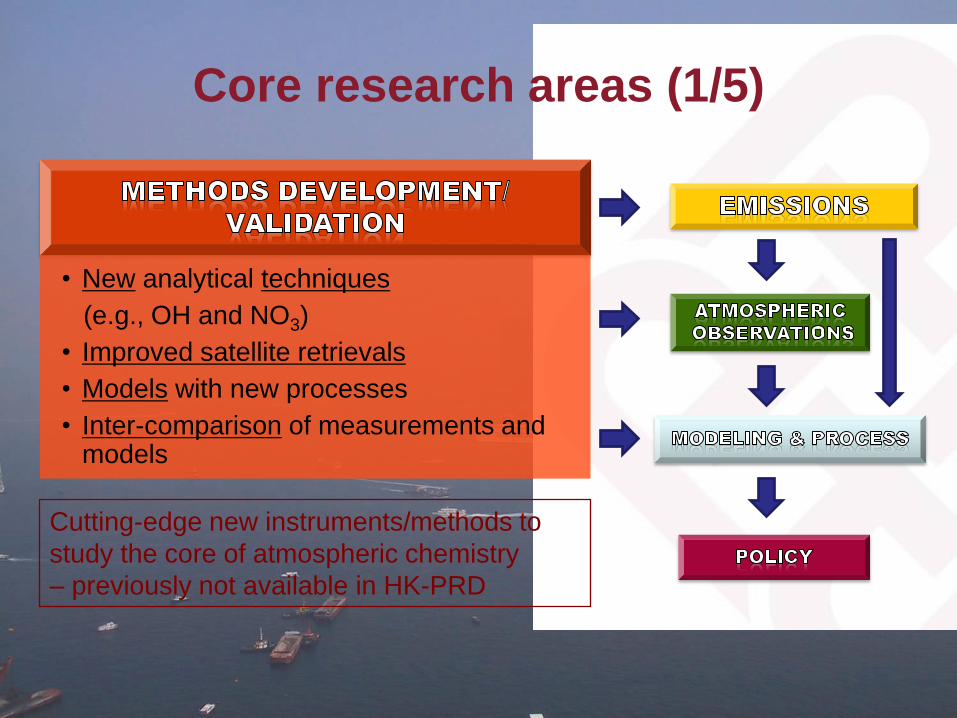
Core research areas (1/5)
• New analytical techniques
(e.g., OH and NO3)
• Improved satellite retrievals
• Models with new processes
• Inter-comparison of measurements and models
Cutting-edge new instruments/methods to
study the core of atmospheric chemistry
– previously not available in HK-PRD
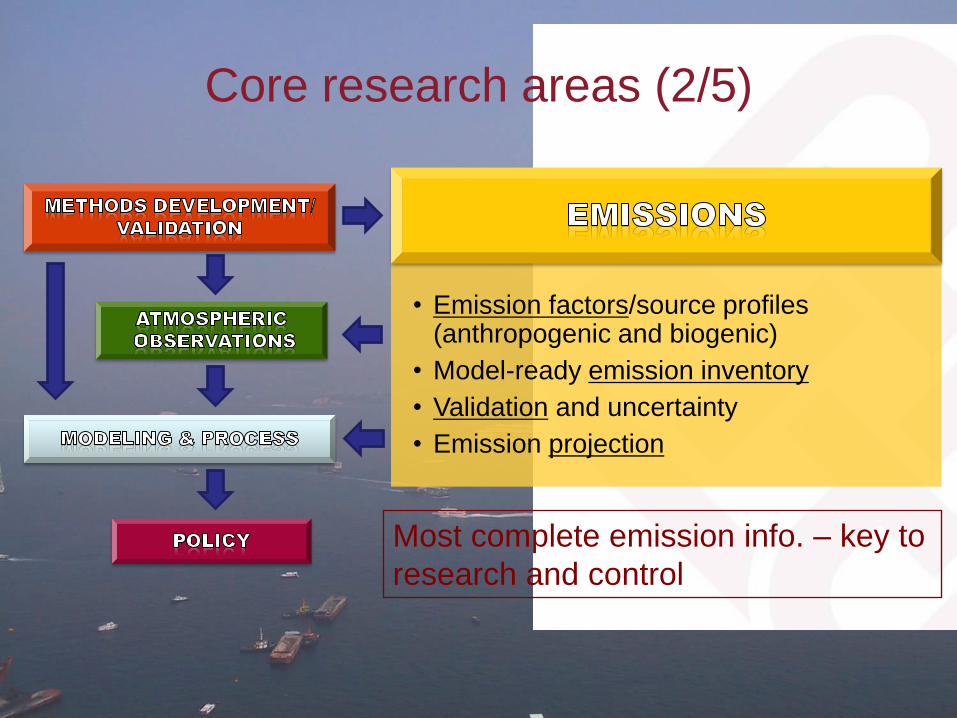
• Emission factors/source profiles (anthropogenic and biogenic)
• Model-ready emission inventory
• Validation and uncertainty
• Emission projection
Most complete emission info. – key to
research and control
Core research areas (2/5)
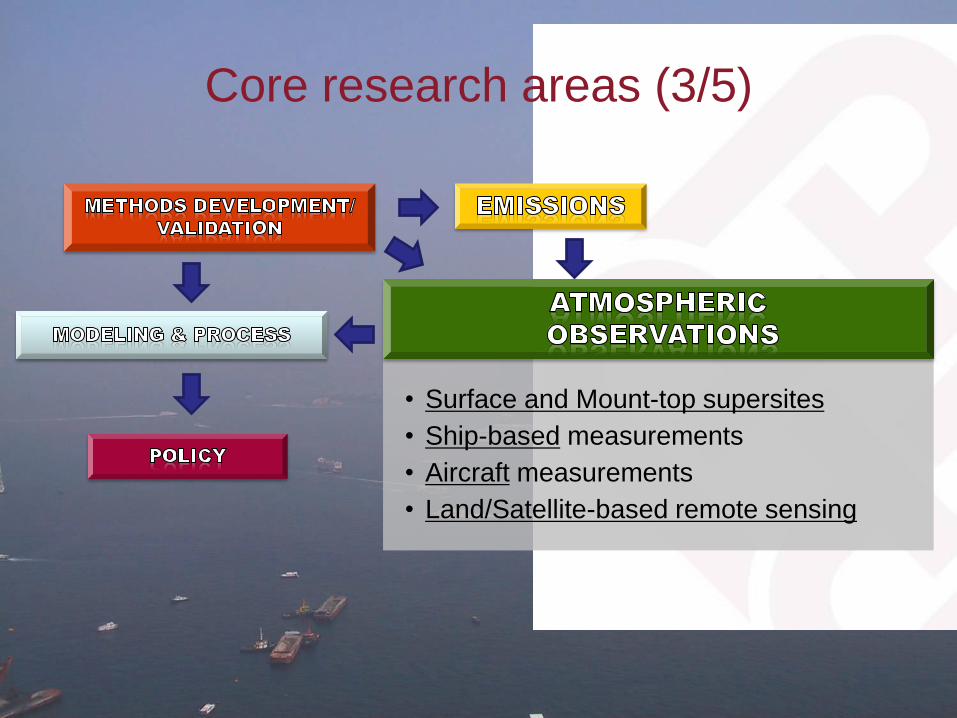
• Surface and Mount-top supersites
• Ship-based measurements
• Aircraft measurements
• Land/Satellite-based remote sensing
Core research areas (3/5)
Tung Chung
Mt. Tai Mo
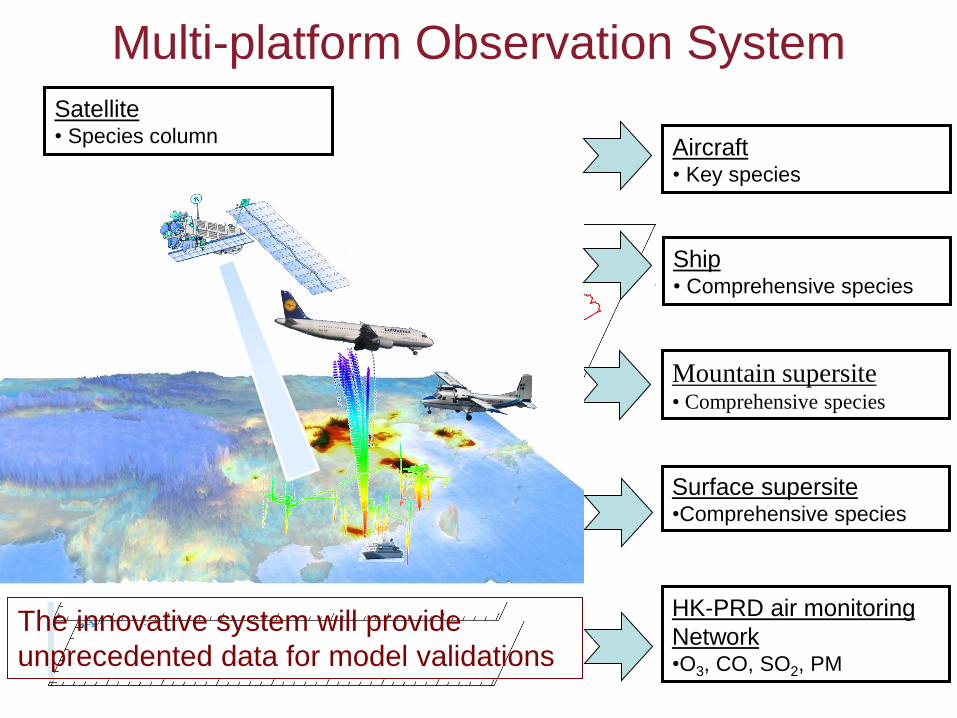
HK-PRD air monitoring
Network •O3, CO, SO2, PM
Surface supersite •Comprehensive species
Mountain supersite • Comprehensive species
Ship • Comprehensive species
Aircraft • Key species
Satellite • Species column
Multi-platform Observation System
The innovative system will provide
unprecedented data for model validations
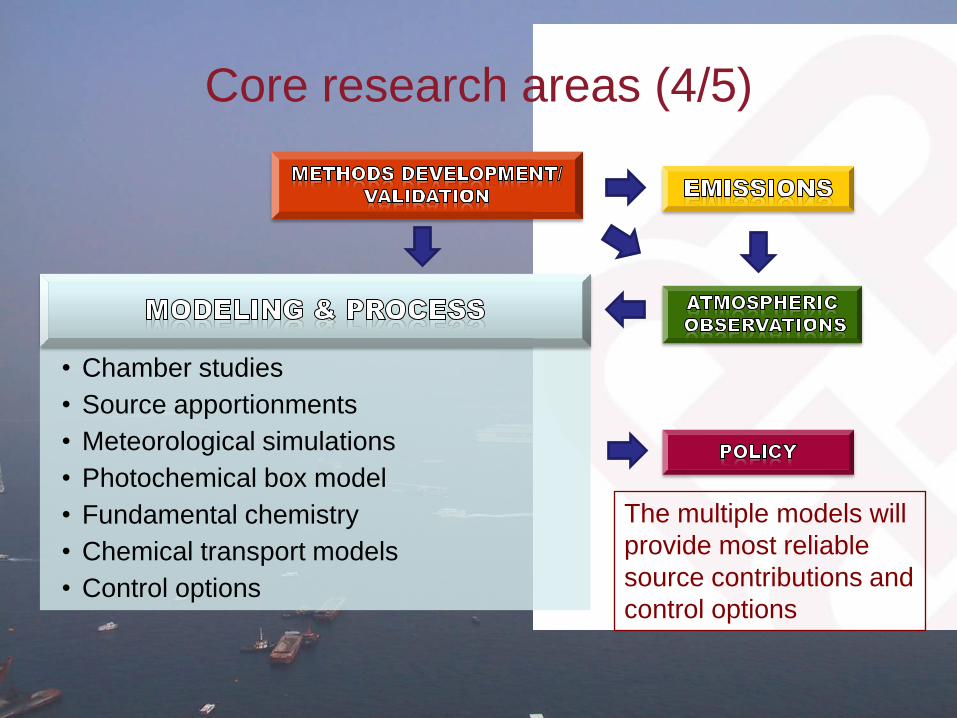
• Chamber studies
• Source apportionments
• Meteorological simulations
• Photochemical box model
• Fundamental chemistry
• Chemical transport models
• Control options
The multiple models will
provide most reliable
source contributions and
control options
Core research areas (4/5)
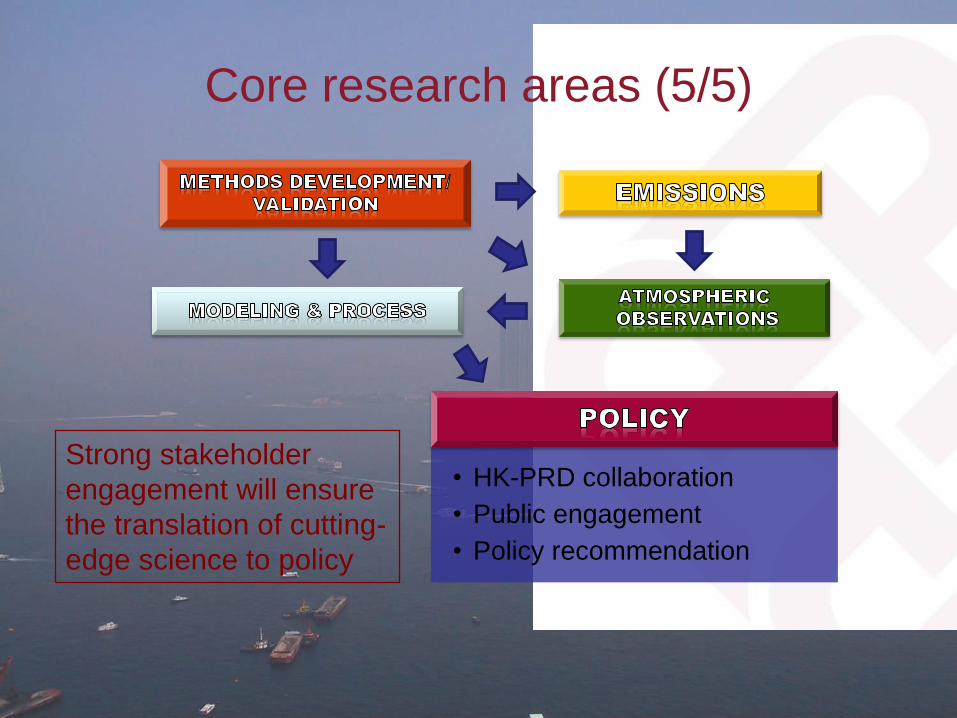
• HK-PRD collaboration
• Public engagement
• Policy recommendation
Strong stakeholder
engagement will ensure
the translation of cutting-
edge science to policy
Core research areas (5/5)
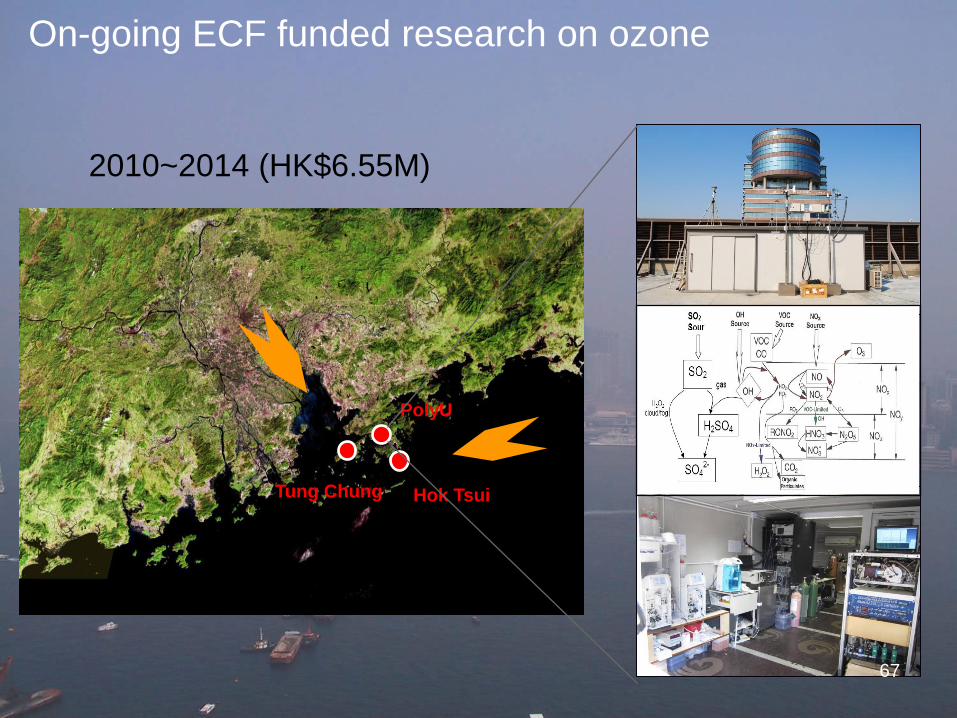
PolyU
Hok Tsui Tung Chung
On-going ECF funded research on ozone
2010~2014 (HK$6.55M)
67
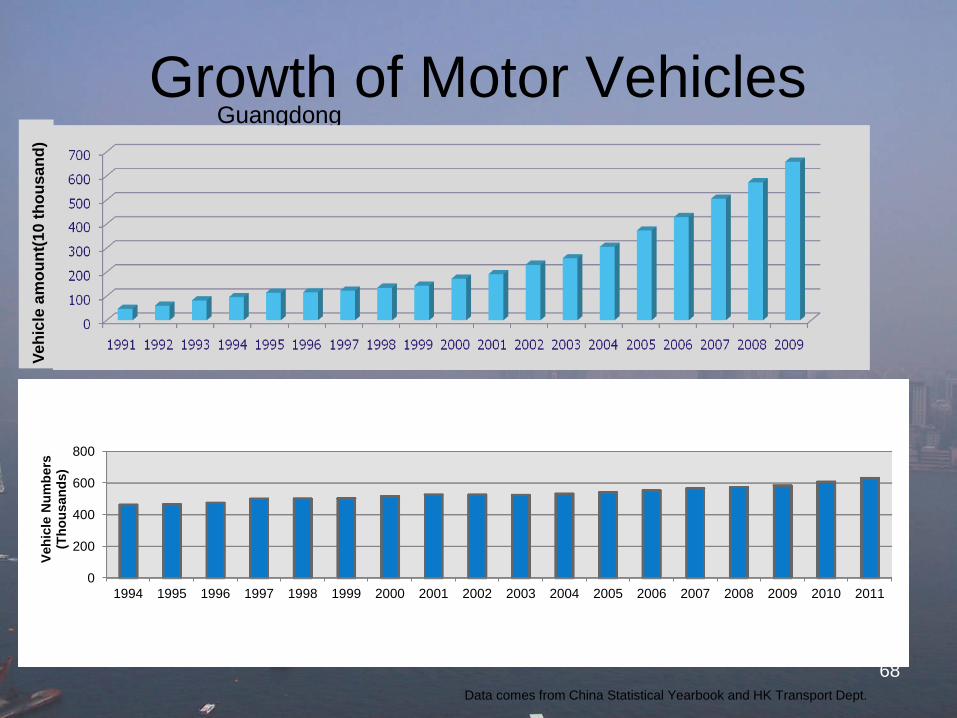
Growth of Motor Vehicles Guangdong
Ve
hic
le a
mo
un
t(10
th
ou
sa
nd
)
Hong Kong
Data comes from China Statistical Yearbook and HK Transport Dept.
68
0
200
400
600
800
1994 1995 1996 1997 1998 1999 2000 2001 2002 2003 2004 2005 2006 2007 2008 2009 2010 2011
Veh
icle
Nu
mb
ers
(T
ho
us
an
ds)

Nitrogen Dioxide (NO2)
2011 1-hour AQO Exceedance
Year CW Eastern
Kwai
Chung
Kwun
Tong
Sham
Shui Po
Tsuen
Wan Sha Tin Tai Po
Tung
Chung
Yuen
Long
Tap
Mun
Causew
ay Bay Central
Mong
Kok
1996 0 0 1 1 0 0 0
1997 0 2 0 0 0 0
1998 0 0 0 0 0 0 0 0 0
1999 0 0 3 1 0 5 0 0 4 2 0 7 3
2000 3 0 0 0 0 0 0 0 0 0 0 1 8
2001 0 0 1 0 0 0 0 0 0 0 0 1 7 0
2002 0 0 0 2 0 0 0 0 0 0 0 0 7 1
2003 4 0 7 3 4 0 0 0 0 0 4 9 5
2004 0 0 0 0 0 0 0 0 0 2 0 0 15 7
2005 2 0 0 0 0 0 0 0 0 0 0 5 10 1
2006 0 0 0 0 0 0 0 3 0 2 0 3 10 6
2007 0 0 0 2 0 0 0 0 0 0 0 6 9 8
2008 0 0 0 0 0 0 0 0 0 0 0 0 10 1
2009 0 0 0 0 0 0 0 0 0 0 0 14 31 12
2010 0 0 0 0 1 0 0 0 0 0 0 48 58 21
2011 0 0 0 0 0 0 0 0 0 0 0 77 57 34 69
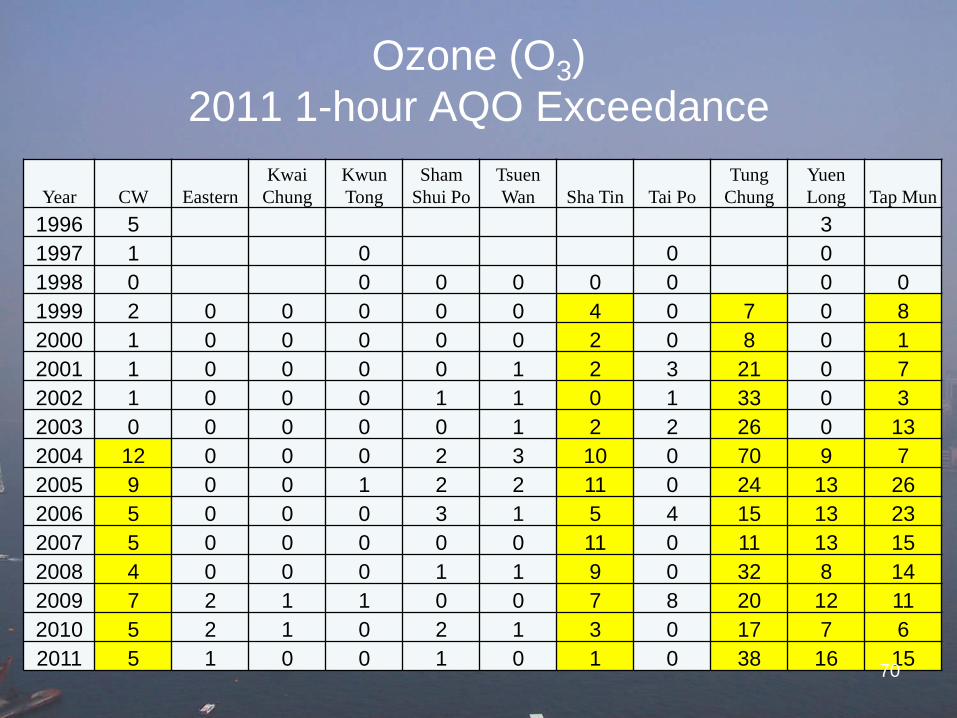
Ozone (O3)
2011 1-hour AQO Exceedance
Year CW Eastern
Kwai
Chung
Kwun
Tong
Sham
Shui Po
Tsuen
Wan Sha Tin Tai Po
Tung
Chung
Yuen
Long Tap Mun
1996 5 3
1997 1 0 0 0
1998 0 0 0 0 0 0 0 0
1999 2 0 0 0 0 0 4 0 7 0 8
2000 1 0 0 0 0 0 2 0 8 0 1
2001 1 0 0 0 0 1 2 3 21 0 7
2002 1 0 0 0 1 1 0 1 33 0 3
2003 0 0 0 0 0 1 2 2 26 0 13
2004 12 0 0 0 2 3 10 0 70 9 7
2005 9 0 0 1 2 2 11 0 24 13 26
2006 5 0 0 0 3 1 5 4 15 13 23
2007 5 0 0 0 0 0 11 0 11 13 15
2008 4 0 0 0 1 1 9 0 32 8 14
2009 7 2 1 1 0 0 7 8 20 12 11
2010 5 2 1 0 2 1 3 0 17 7 6
2011 5 1 0 0 1 0 1 0 38 16 15 70

SO2
1. AQO never exceeded in Hong Kong.
2. 1990 limiting S content of industrial fuel.
3. 1997 prohibit new coal-fire power generators.
4. 2008 mandatory ultra low S diesel.
5. 2011 Castle Peak Nox/SO2 scrubber.
6. Control of SO2 in HK is very successful.
71
0
5000
10000
15000
20000
25000
30000
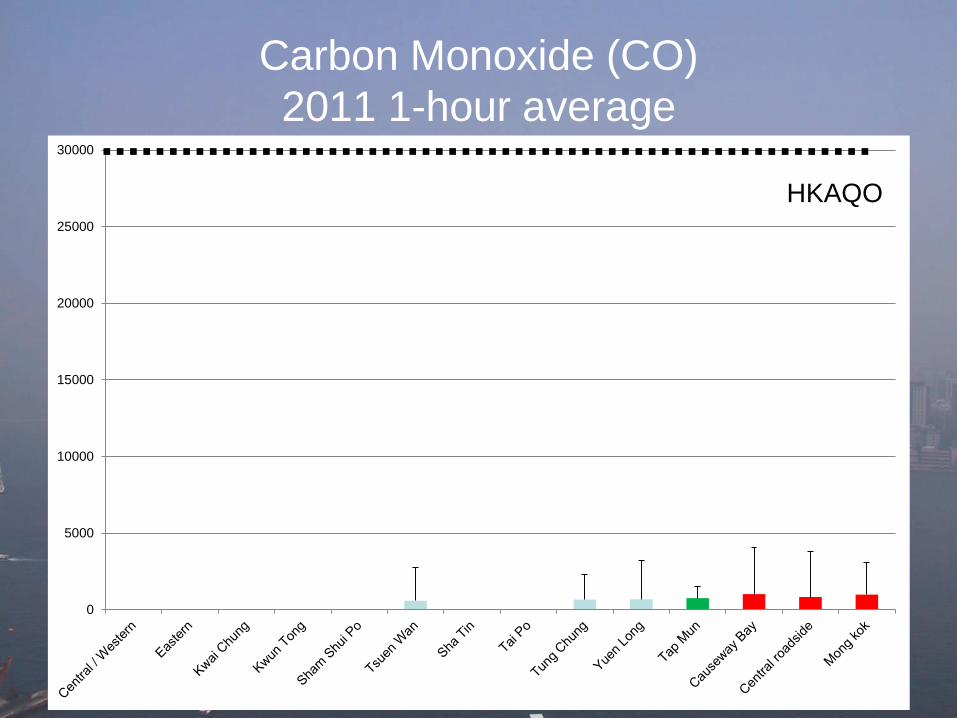
Carbon Monoxide (CO)
2011 1-hour average
HKAQO
72
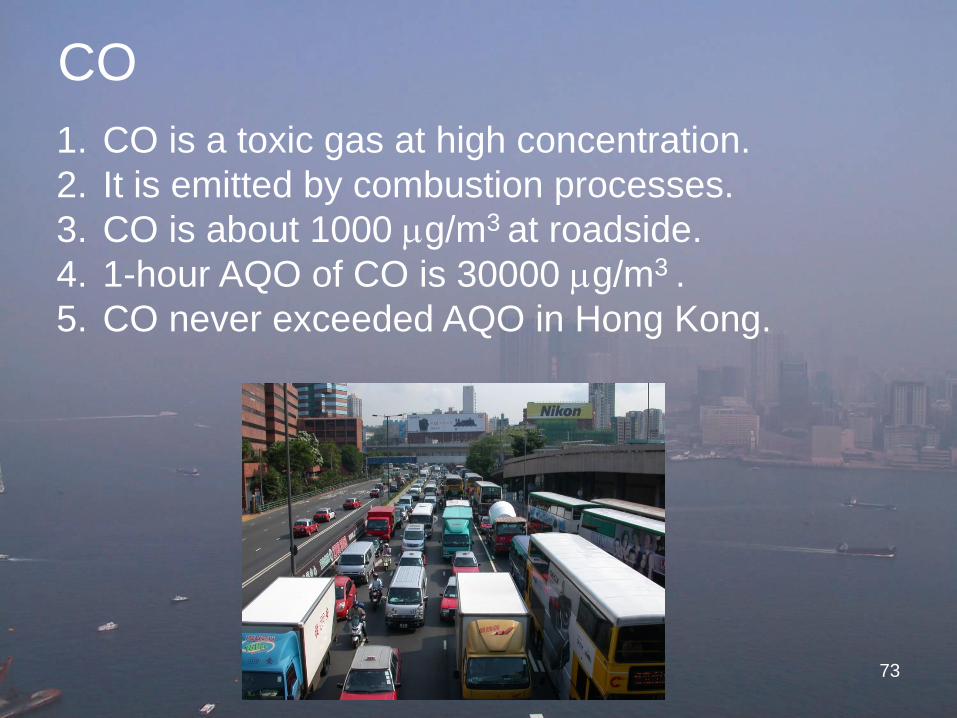
CO
1. CO is a toxic gas at high concentration.
2. It is emitted by combustion processes.
3. CO is about 1000 g/m3 at roadside.
4. 1-hour AQO of CO is 30000 g/m3 .
5. CO never exceeded AQO in Hong Kong.
73
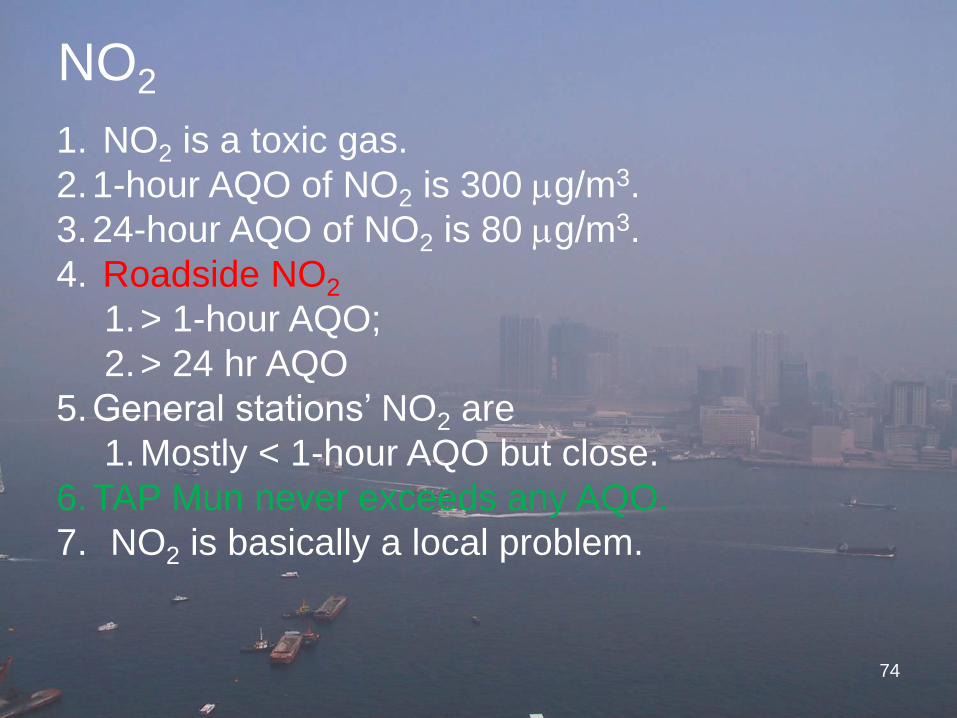
NO2
1. NO2 is a toxic gas.
2.1-hour AQO of NO2 is 300 g/m3.
3.24-hour AQO of NO2 is 80 g/m3.
4. Roadside NO2
1.> 1-hour AQO;
2.> 24 hr AQO
5.General stations’ NO2 are
1.Mostly < 1-hour AQO but close.
6.TAP Mun never exceeds any AQO.
7. NO2 is basically a local problem.
74
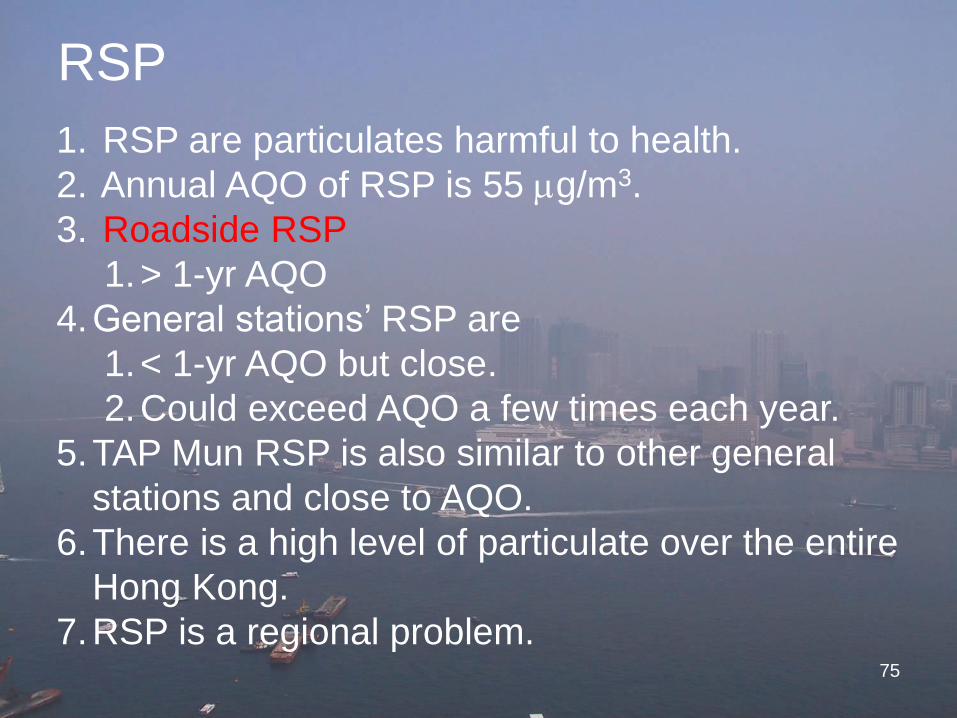
RSP
1. RSP are particulates harmful to health.
2. Annual AQO of RSP is 55 g/m3.
3. Roadside RSP
1.> 1-yr AQO
4.General stations’ RSP are
1.< 1-yr AQO but close.
2.Could exceed AQO a few times each year.
5.TAP Mun RSP is also similar to other general
stations and close to AQO.
6.There is a high level of particulate over the entire
Hong Kong.
7.RSP is a regional problem. 75
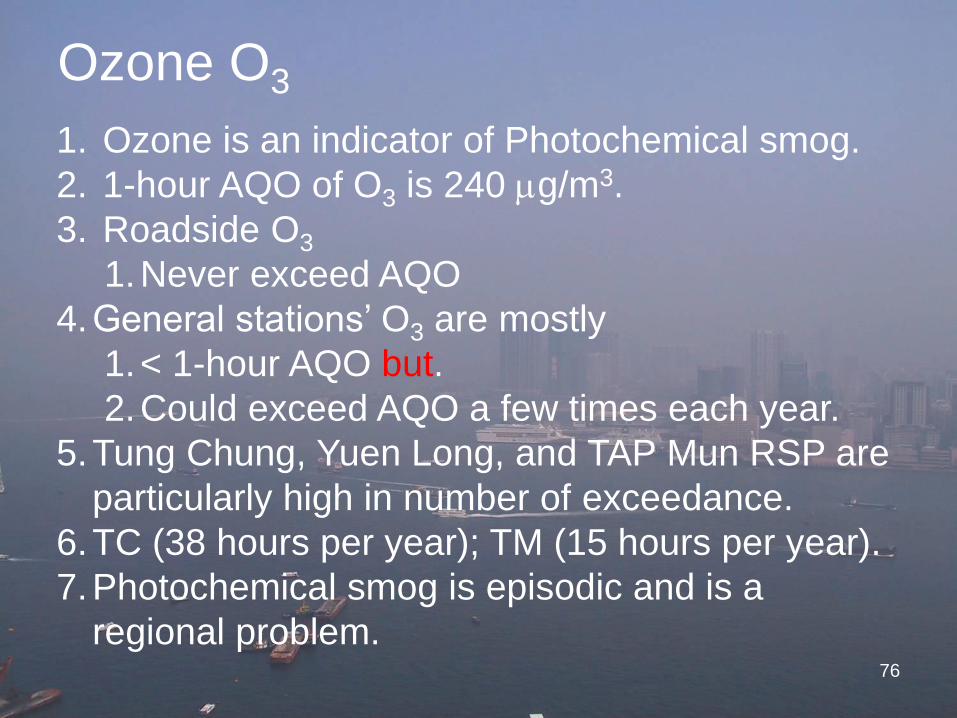
Ozone O3
1. Ozone is an indicator of Photochemical smog.
2. 1-hour AQO of O3 is 240 g/m3.
3. Roadside O3
1.Never exceed AQO
4.General stations’ O3 are mostly
1.< 1-hour AQO but.
2.Could exceed AQO a few times each year.
5.Tung Chung, Yuen Long, and TAP Mun RSP are
particularly high in number of exceedance.
6.TC (38 hours per year); TM (15 hours per year).
7.Photochemical smog is episodic and is a
regional problem. 76
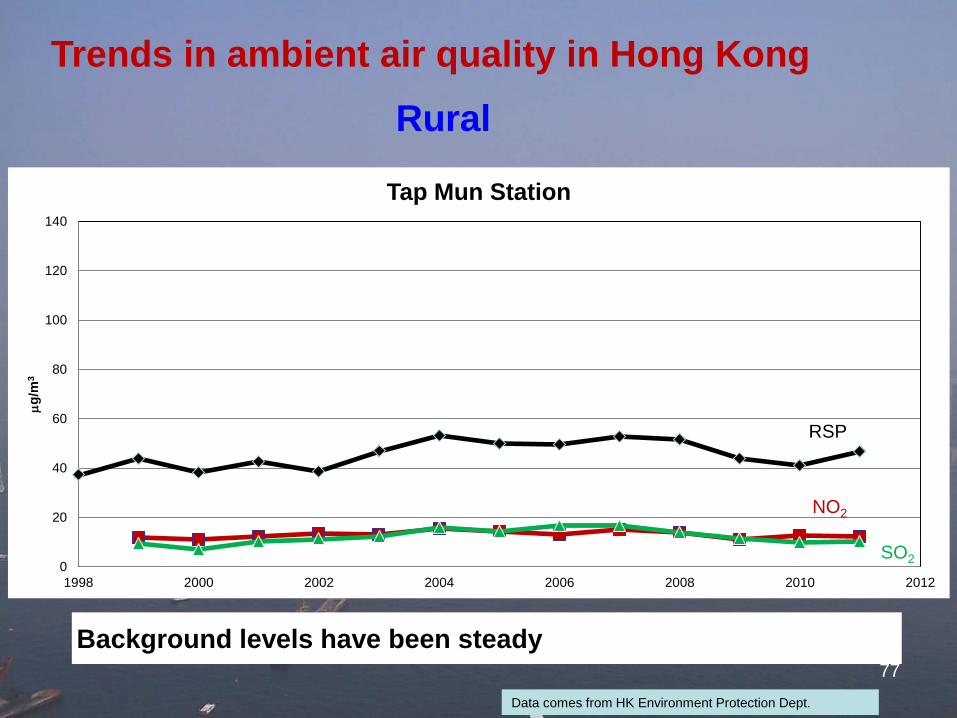
0
20
40
60
80
100
120
140
1998 2000 2002 2004 2006 2008 2010 2012
g
/m3
Tap Mun Station
Rural
Data comes from HK Environment Protection Dept.
Background levels have been steady
Trends in ambient air quality in Hong Kong
NO2
SO2
RSP
77
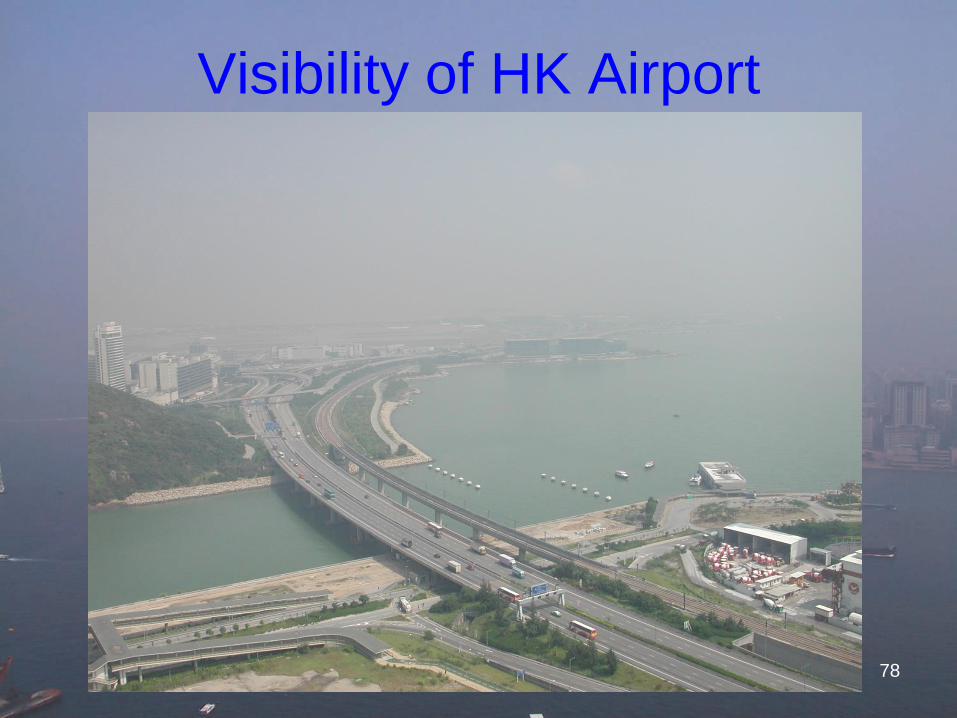
Visibility of HK Airport
78
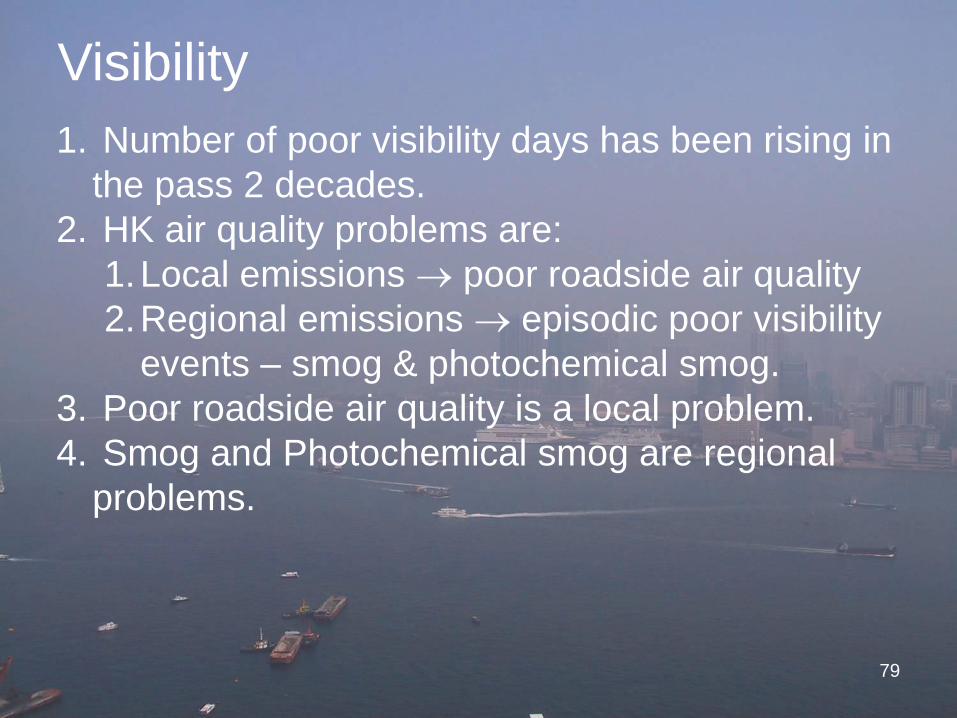
Visibility
1. Number of poor visibility days has been rising in
the pass 2 decades.
2. HK air quality problems are:
1.Local emissions poor roadside air quality
2.Regional emissions episodic poor visibility
events – smog & photochemical smog.
3. Poor roadside air quality is a local problem.
4. Smog and Photochemical smog are regional
problems.
79
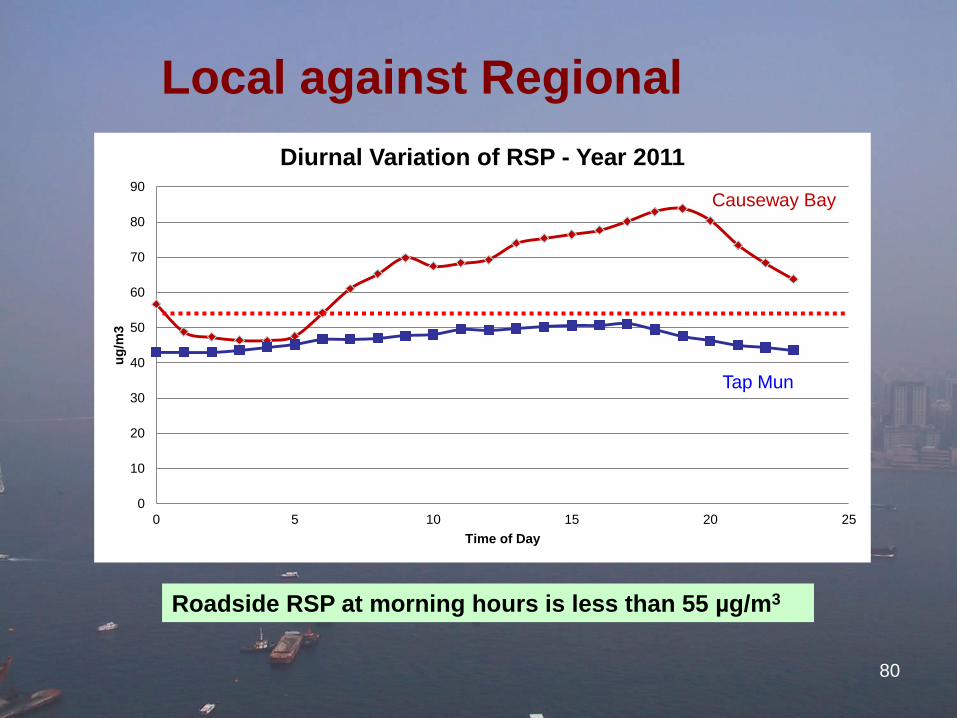
0
10
20
30
40
50
60
70
80
90
0 5 10 15 20 25
ug
/m3
Time of Day
Diurnal Variation of RSP - Year 2011
Roadside RSP at morning hours is less than 55 µg/m3
Local against Regional
80
Causeway Bay
Tap Mun
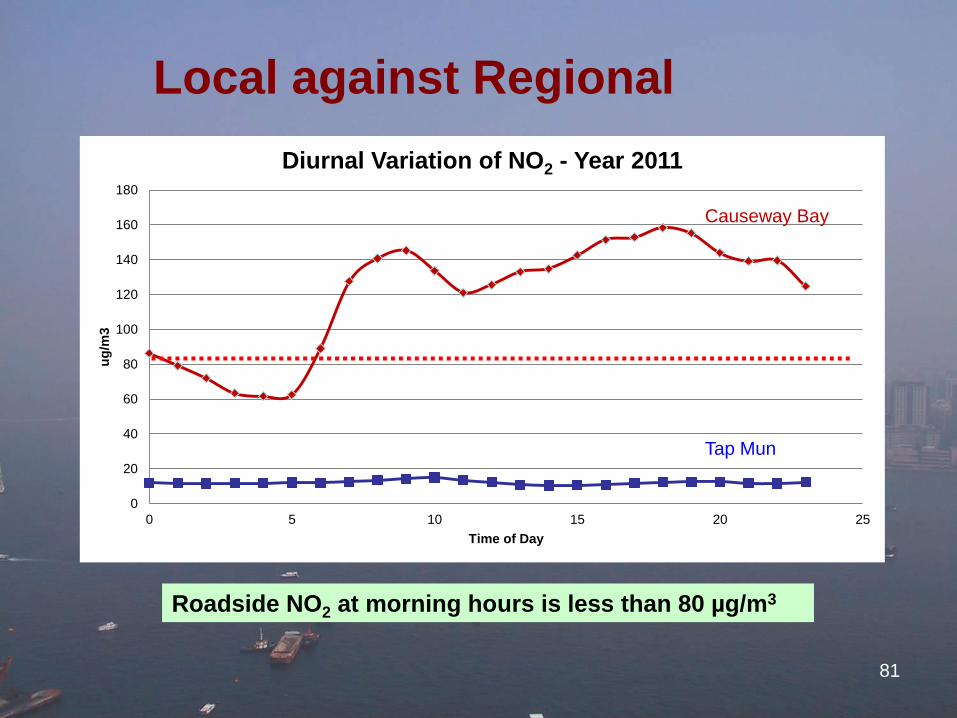
Local against Regional
0
20
40
60
80
100
120
140
160
180
0 5 10 15 20 25
ug
/m3
Time of Day
Diurnal Variation of NO2 - Year 2011
Causeway Bay
Tap Mun
Roadside NO2 at morning hours is less than 80 µg/m3
81