reducing community viral load to achieve hiv … community viral load to achieve hiv prevention...
TRANSCRIPT
Reducing Community Viral Load to Achieve HIV Prevention
Moupali Das, MD, MPH
Director of Implementation Science and Evaluation Research
San Francisco Dept. of Public Health
Douglas Bawden Photography
Outline
• Viral Load and Transmission
• A Pivotal Time
• San Francisco Comprehensive Public Health Approach – San Francisco Baseline Results
– IOM Recommendations for Evaluation
• The Way Forward: Transforming our Narrative
• Revolutionizing the Research Agenda: Asking the Right Questions at this Pivotal Time
VIRAL LOAD AND PREVENTION OF TRANSMISSION
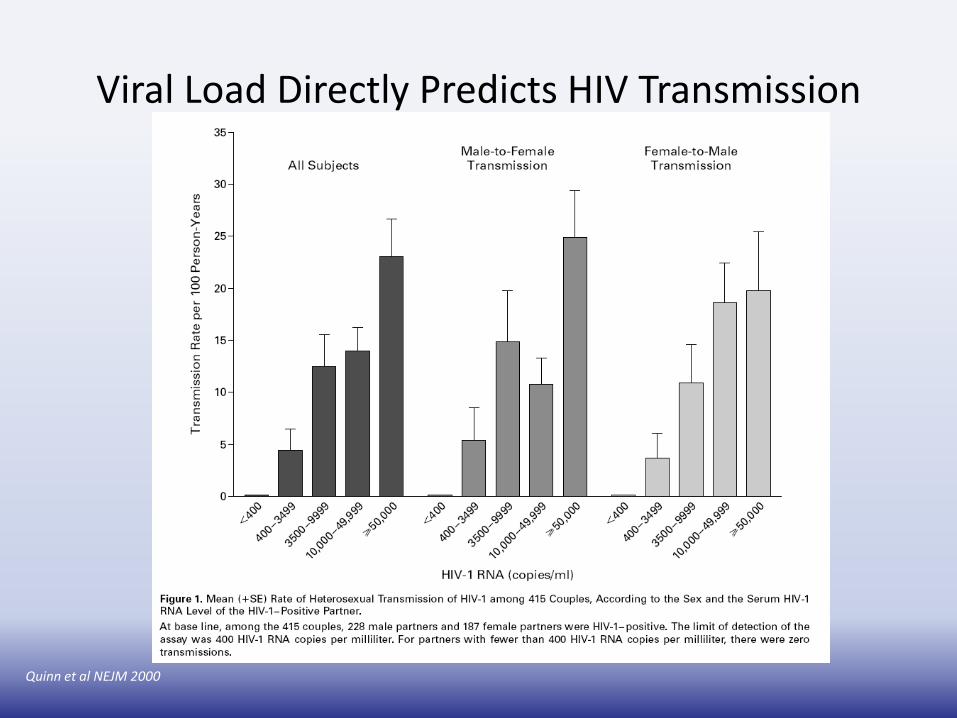
Viral Load Directly Predicts HIV Transmission
Quinn et al NEJM 2000
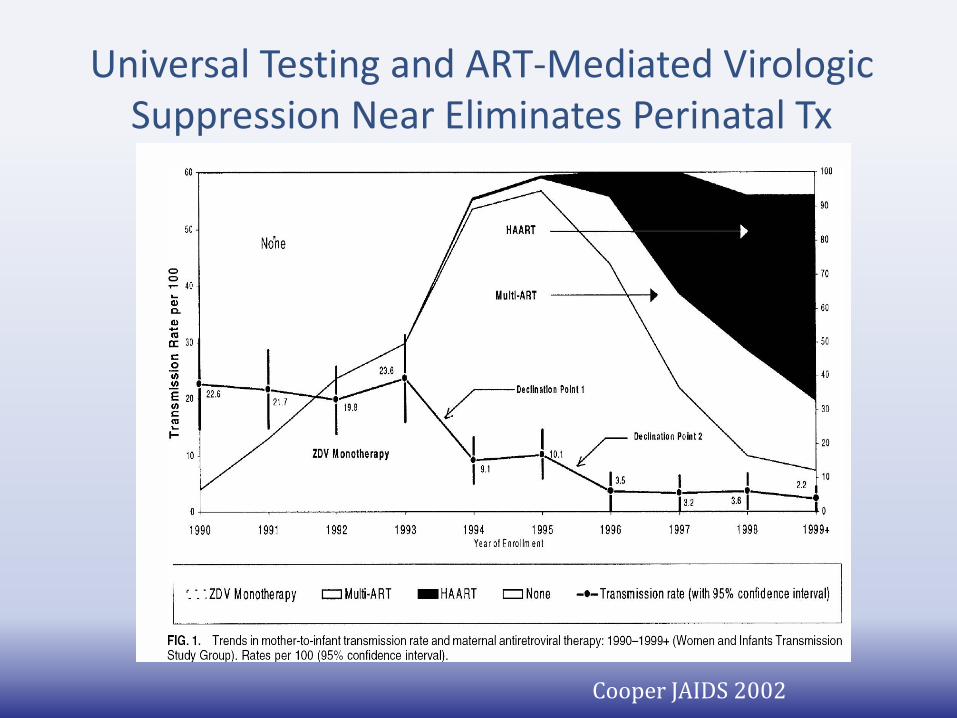
Universal Testing and ART-Mediated Virologic Suppression Near Eliminates Perinatal Tx
Cooper JAIDS 2002
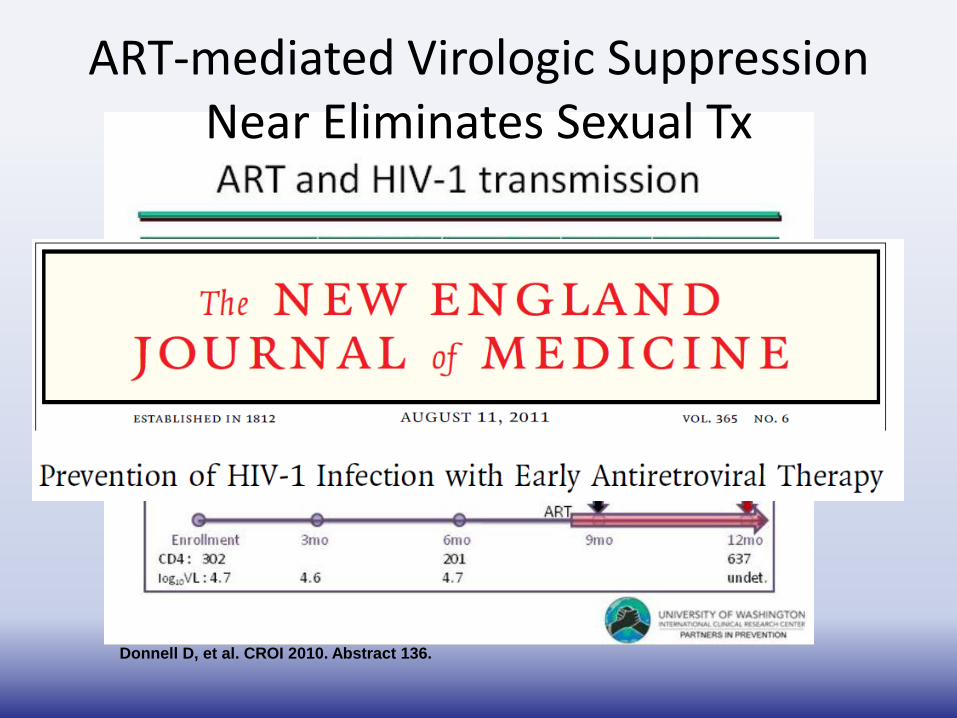
Donnell D, et al. CROI 2010. Abstract 136.
ART-mediated Virologic Suppression Near Eliminates Sexual Tx
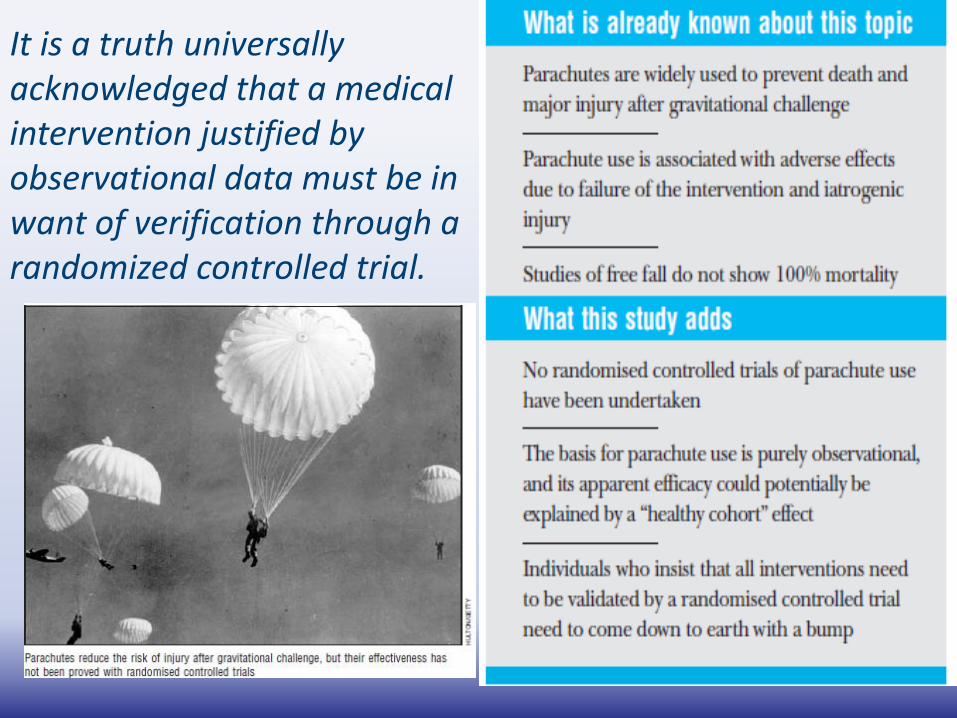
It is a truth universally acknowledged that a medical intervention justified by observational data must be in want of verification through a randomized controlled trial.
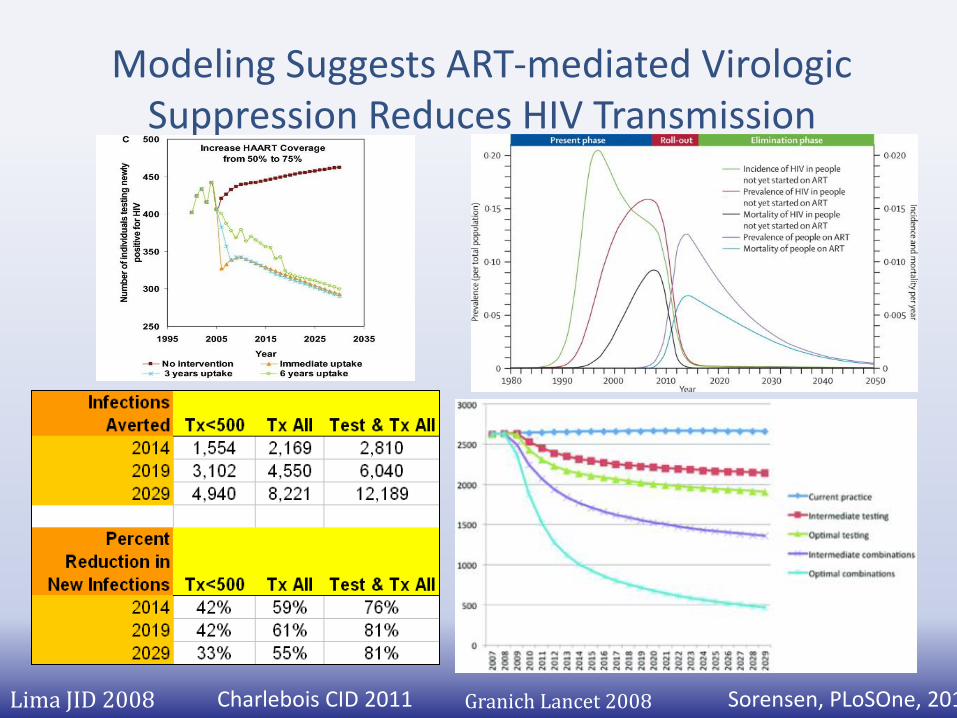
Modeling Suggests ART-mediated Virologic Suppression Reduces HIV Transmission
Lima JID 2008 Granich Lancet 2008 Sorensen, PLoSOne, 2012Charlebois CID 2011
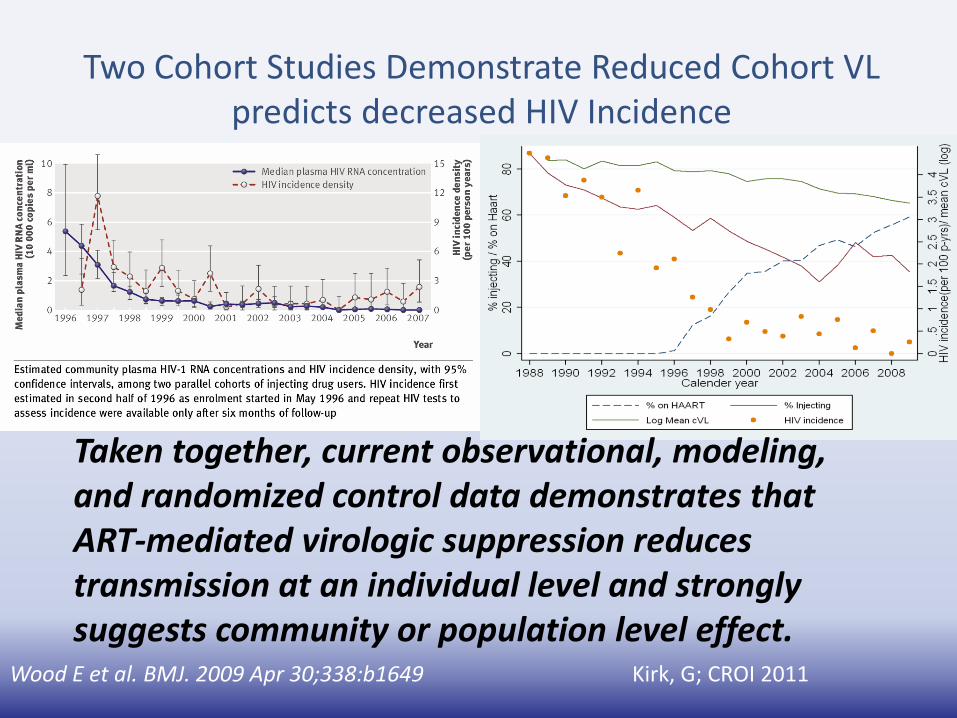
Two Cohort Studies Demonstrate Reduced Cohort VL predicts decreased HIV Incidence
Wood E et al. BMJ. 2009 Apr 30;338:b1649 Kirk, G; CROI 2011
Taken together, current observational, modeling, and randomized control data demonstrates that ART-mediated virologic suppression reduces transmission at an individual level and strongly suggests community or population level effect.
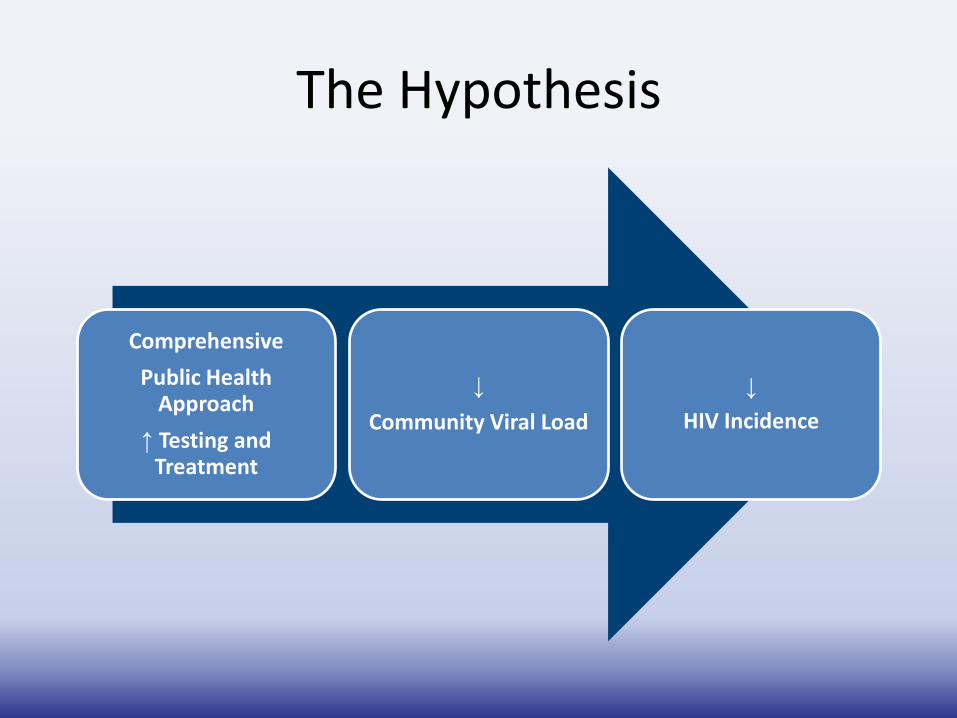
The Hypothesis
Comprehensive
Public Health Approach
↑ Testing and Treatment
↓
Community Viral Load
↓
HIV Incidence
A PIVOTAL TIME: ADVANCES IN HIV PREVENTION, TESTING & TREATMENT
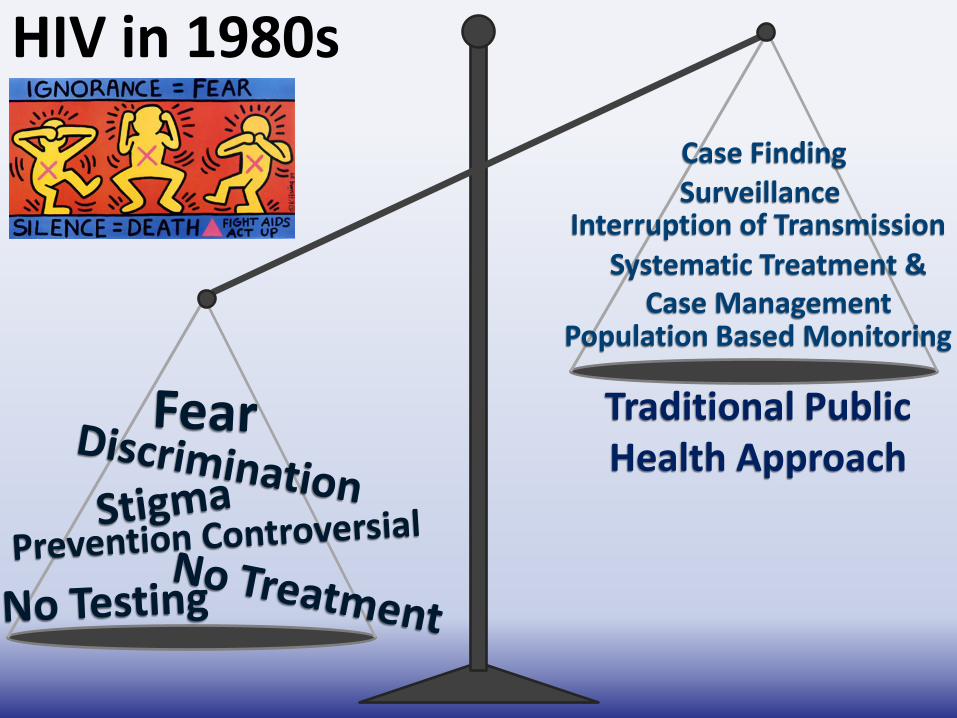
HIV in 1980s
Traditional Public Health Approach
Case Finding Surveillance
Interruption of Transmission Systematic Treatment &
Case Management Population Based Monitoring
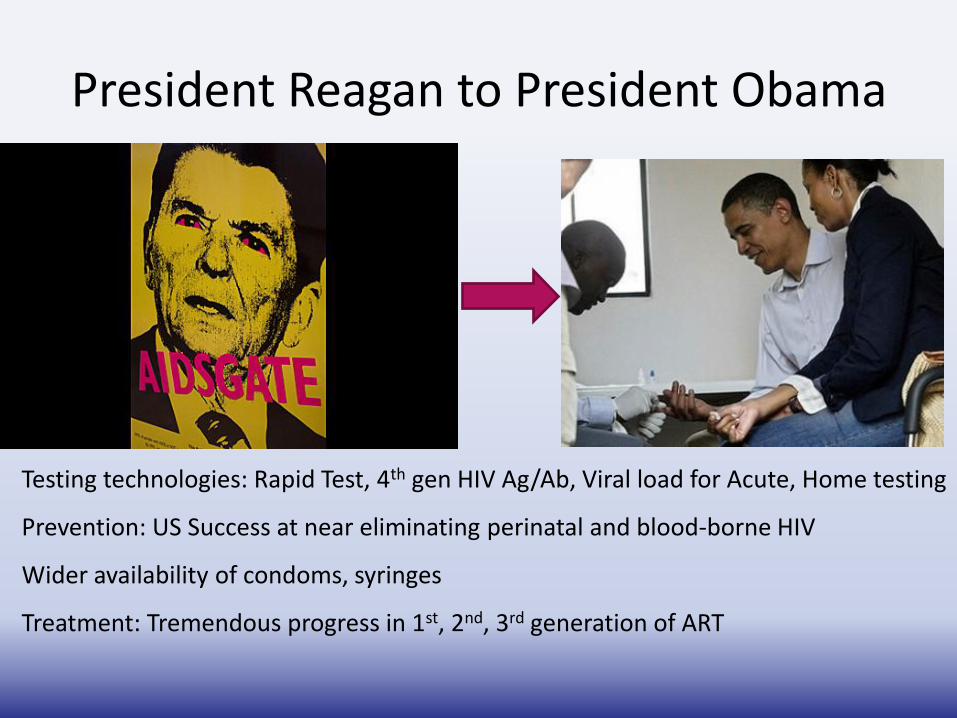
President Reagan to President Obama
Testing technologies: Rapid Test, 4th gen HIV Ag/Ab, Viral load for Acute, Home testing
Prevention: US Success at near eliminating perinatal and blood-borne HIV
Wider availability of condoms, syringes
Treatment: Tremendous progress in 1st, 2nd, 3rd generation of ART
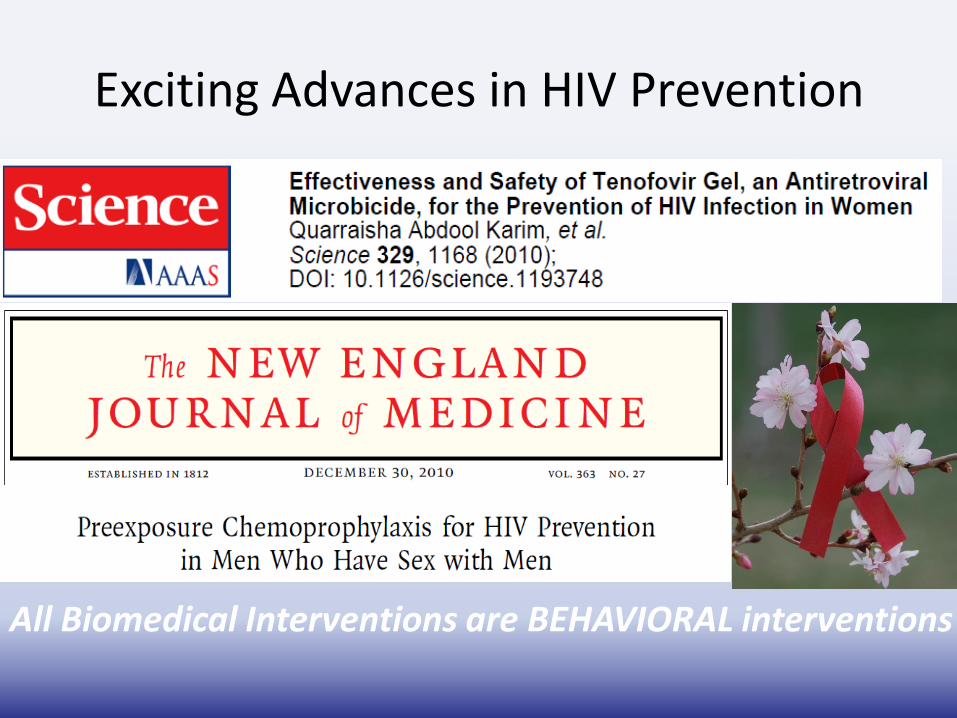
Exciting Advances in HIV Prevention
All Biomedical Interventions are BEHAVIORAL interventions

ART Brought People Back From the Brink
Jim Kim and Paul Farmer, NEJM, 2006
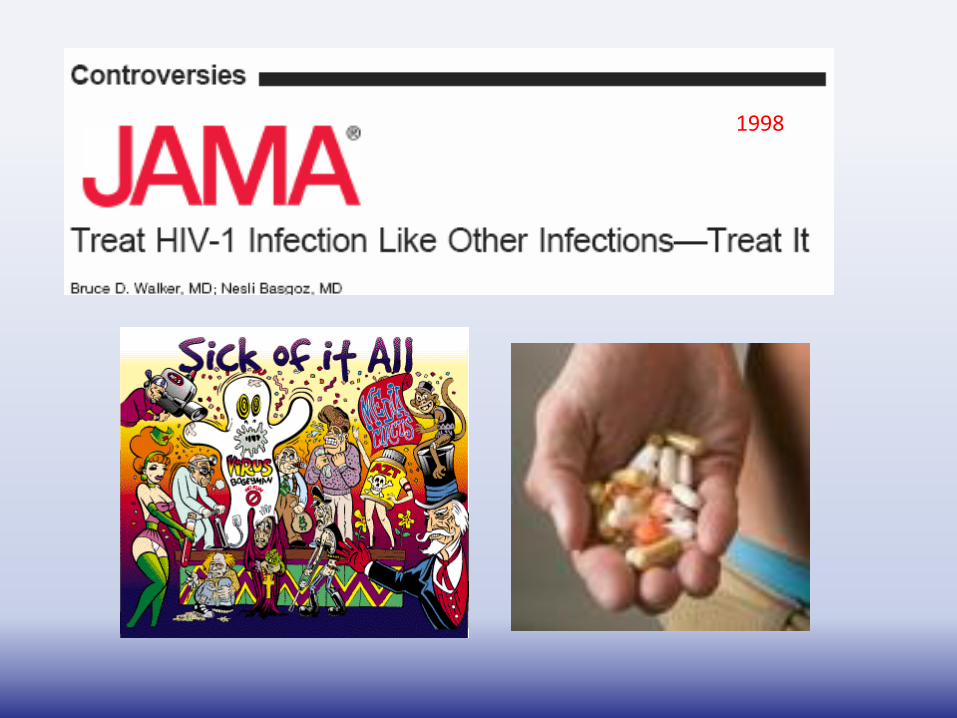
1998
17
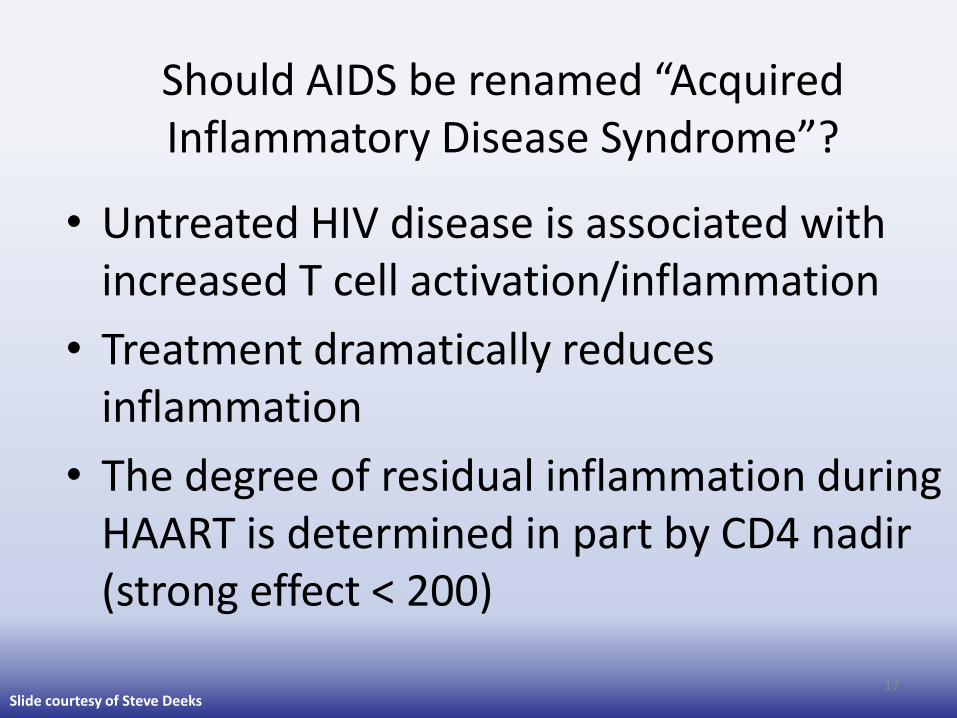
Should AIDS be renamed “Acquired Inflammatory Disease Syndrome”?
• Untreated HIV disease is associated with increased T cell activation/inflammation
• Treatment dramatically reduces inflammation
• The degree of residual inflammation during HAART is determined in part by CD4 nadir (strong effect < 200)
Slide courtesy of Steve Deeks
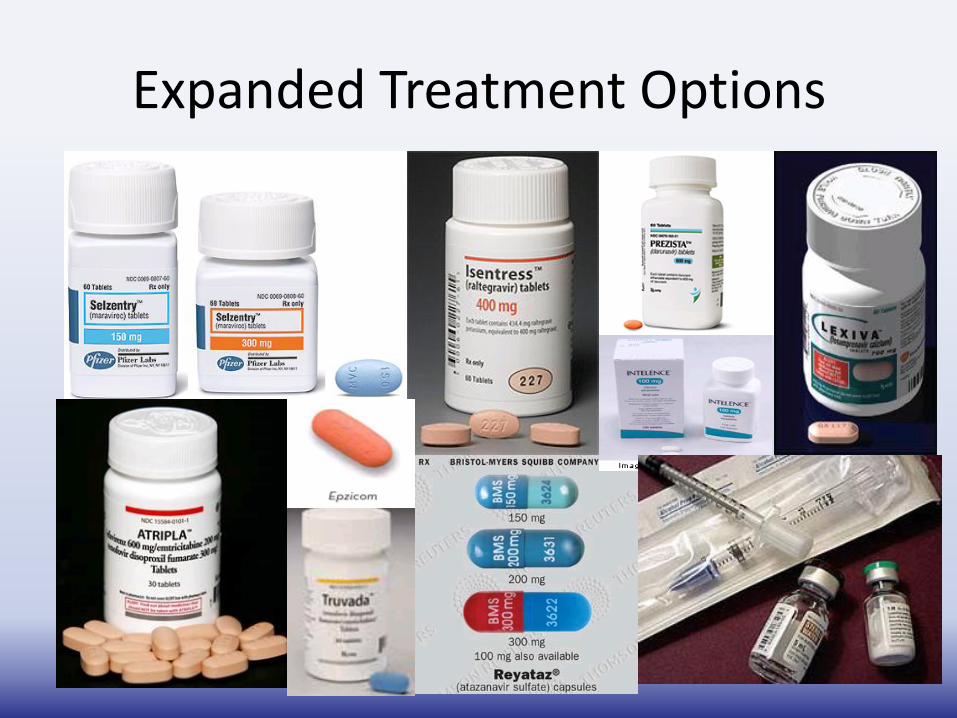
Expanded Treatment Options
19
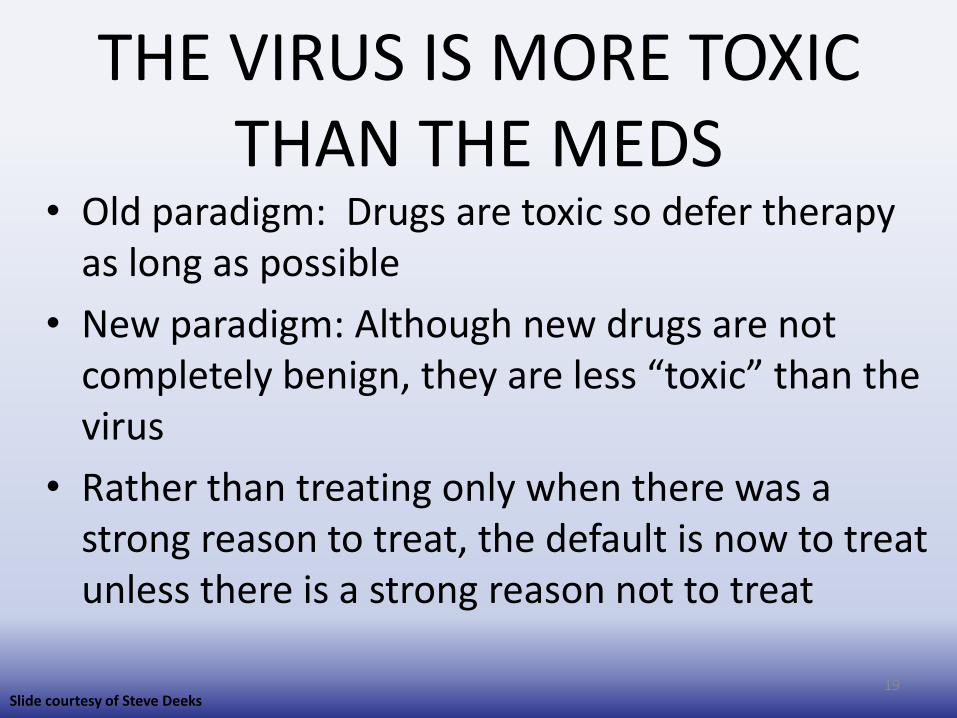
THE VIRUS IS MORE TOXIC THAN THE MEDS
• Old paradigm: Drugs are toxic so defer therapy as long as possible
• New paradigm: Although new drugs are not completely benign, they are less “toxic” than the virus
• Rather than treating only when there was a strong reason to treat, the default is now to treat unless there is a strong reason not to treat
Slide courtesy of Steve Deeks
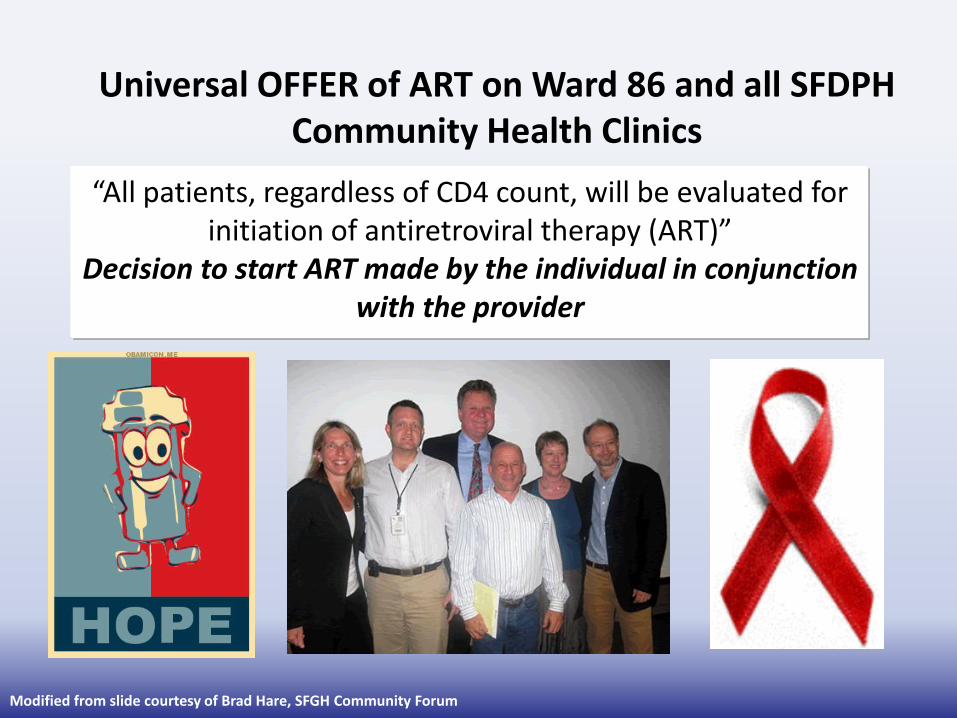
Universal OFFER of ART on Ward 86 and all SFDPH Community Health Clinics
“All patients, regardless of CD4 count, will be evaluated for initiation of antiretroviral therapy (ART)”
Decision to start ART made by the individual in conjunction with the provider
Modified from slide courtesy of Brad Hare, SFGH Community Forum
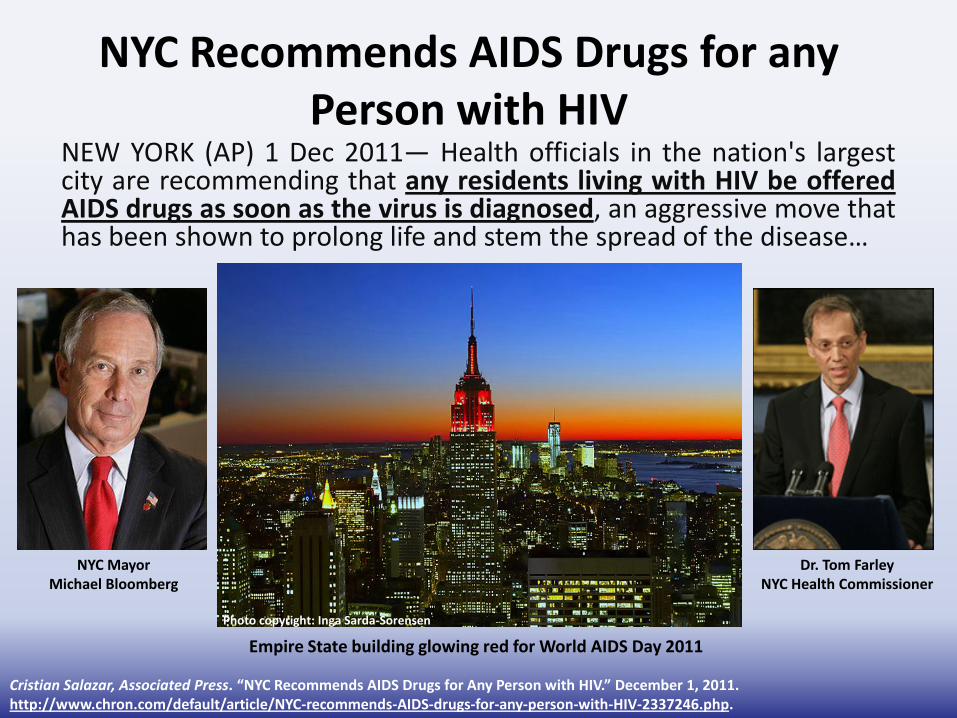
NYC Recommends AIDS Drugs for any Person with HIV
NEW YORK (AP) 1 Dec 2011— Health officials in the nation's largest city are recommending that any residents living with HIV be offered AIDS drugs as soon as the virus is diagnosed, an aggressive move that has been shown to prolong life and stem the spread of the disease…
NYC Mayor Michael Bloomberg
Dr. Tom Farley NYC Health Commissioner
Cristian Salazar, Associated Press. “NYC Recommends AIDS Drugs for Any Person with HIV.” December 1, 2011. http://www.chron.com/default/article/NYC-recommends-AIDS-drugs-for-any-person-with-HIV-2337246.php.
Photo copyright: Inga Sarda-Sorensen
Empire State building glowing red for World AIDS Day 2011
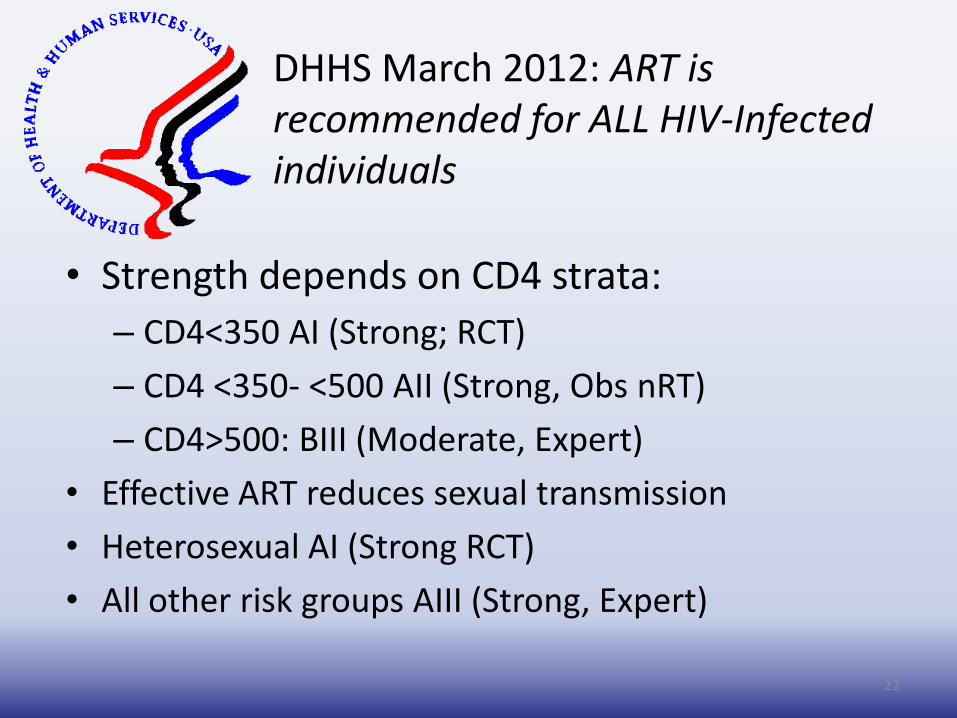
DHHS March 2012: ART is recommended for ALL HIV-Infected individuals
• Strength depends on CD4 strata:
– CD4<350 AI (Strong; RCT)
– CD4 <350- <500 AII (Strong, Obs nRT)
– CD4>500: BIII (Moderate, Expert)
• Effective ART reduces sexual transmission
• Heterosexual AI (Strong RCT)
• All other risk groups AIII (Strong, Expert)
22
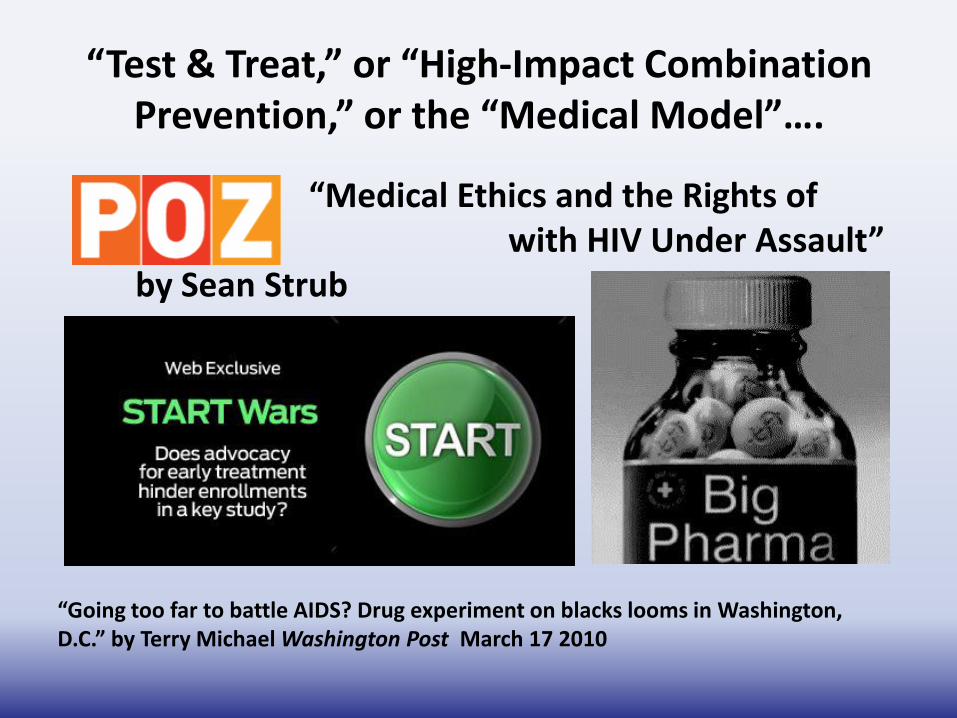
“Test & Treat,” or “High-Impact Combination Prevention,” or the “Medical Model”….
“Medical Ethics and the Rights of People with HIV Under Assault” by Sean Strub
“Going too far to battle AIDS? Drug experiment on blacks looms in Washington, D.C.” by Terry Michael Washington Post March 17 2010
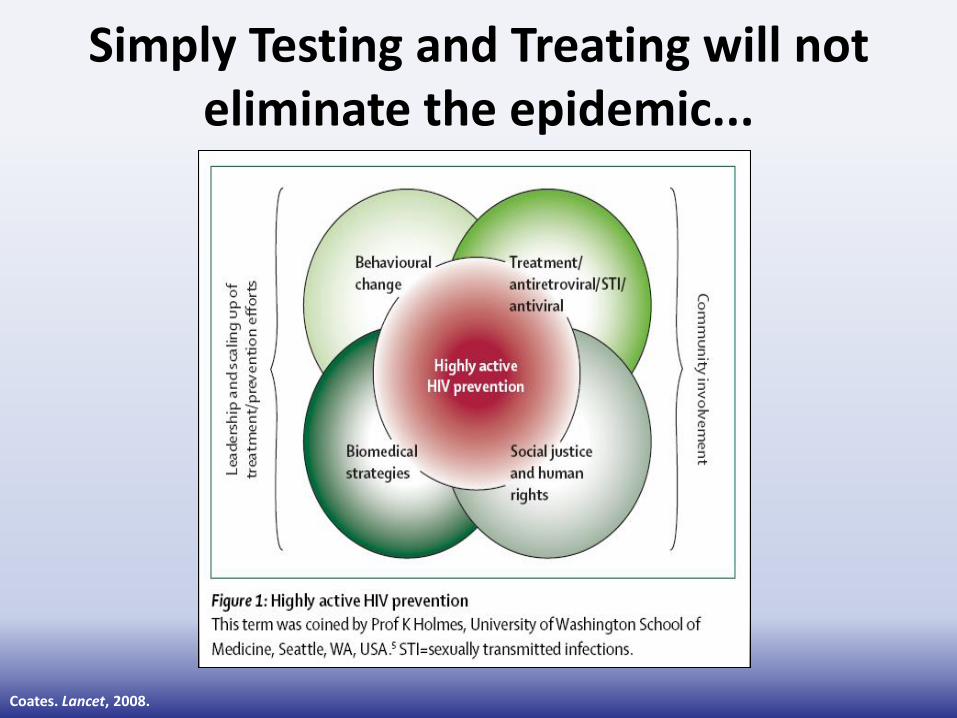
Simply Testing and Treating will not eliminate the epidemic...
Coates. Lancet, 2008.
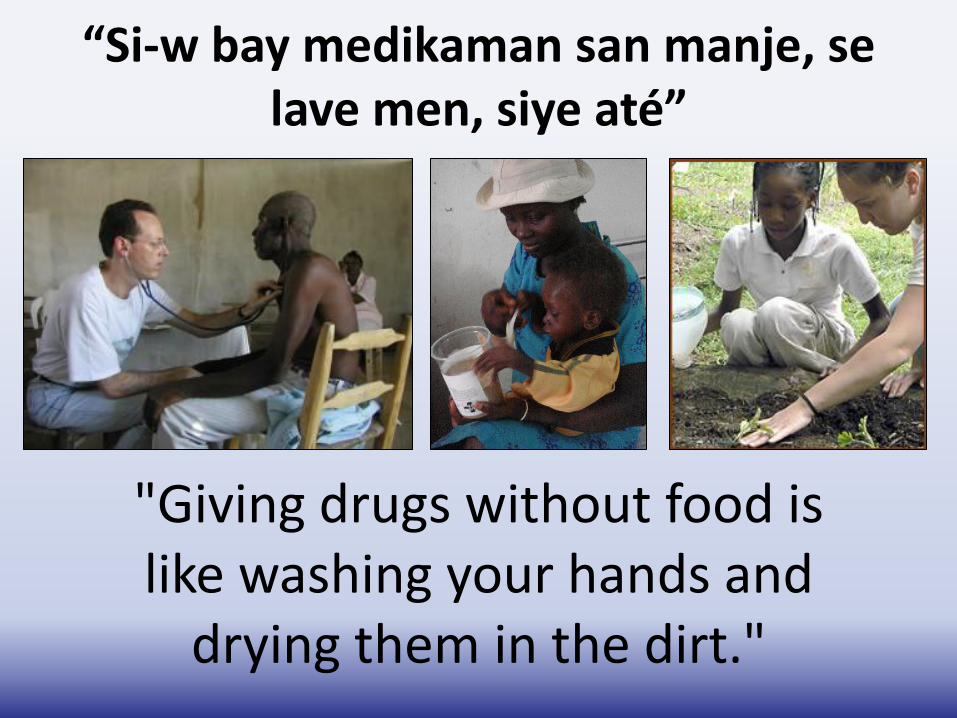
“Si-w bay medikaman san manje, se lave men, siye até”
"Giving drugs without food is like washing your hands and
drying them in the dirt."
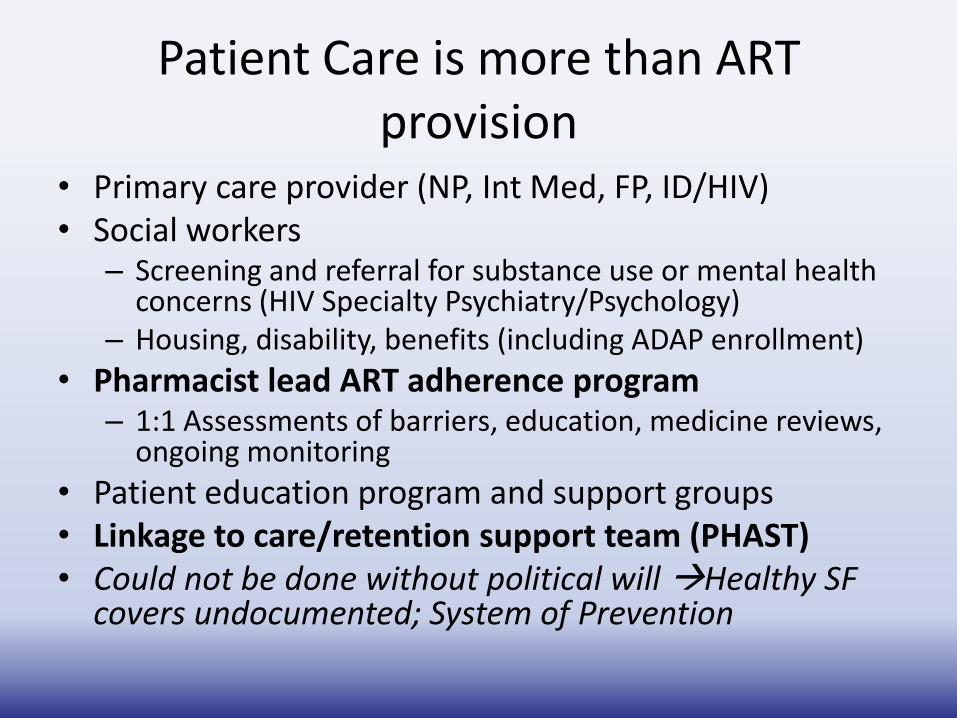
Patient Care is more than ART provision
• Primary care provider (NP, Int Med, FP, ID/HIV) • Social workers
– Screening and referral for substance use or mental health concerns (HIV Specialty Psychiatry/Psychology)
– Housing, disability, benefits (including ADAP enrollment)
• Pharmacist lead ART adherence program – 1:1 Assessments of barriers, education, medicine reviews,
ongoing monitoring
• Patient education program and support groups • Linkage to care/retention support team (PHAST) • Could not be done without political will Healthy SF
covers undocumented; System of Prevention

SAN FRANCISCO’S COMPREHENSIVE STRATEGY TO MAXIMIZE CASCADE OUTCOMES

The Hypothesis
Comprehensive
Public Health Approach
↑ Testing and Treatment
↓
Community Viral Load
↓
HIV Incidence

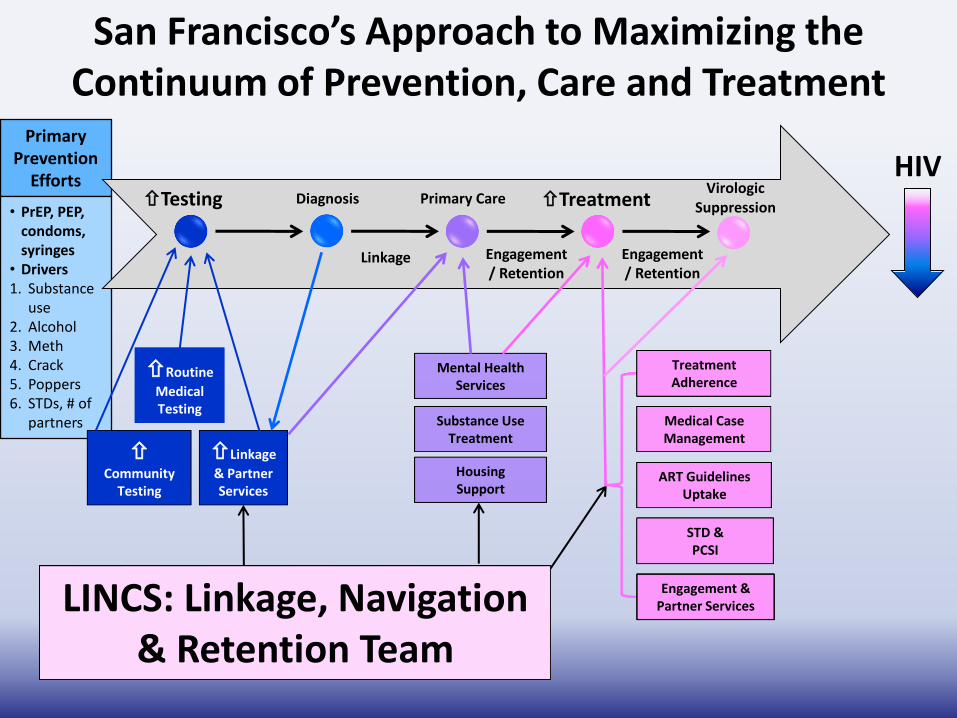
Primary Prevention
Efforts
• PrEP, PEP, condoms, syringes
• Drivers 1. Substance
use 2. Alcohol 3. Meth 4. Crack 5. Poppers 6. STDs, # of
partners
Testing Diagnosis Primary Care Treatment Virologic
Suppression
Linkage
HIV
Engagement / Retention
Engagement / Retention
San Francisco’s Approach to Maximizing the Continuum of Prevention, Care and Treatment
Community Testing
Linkage
& Partner Services
Mental Health Services
Substance Use Treatment
Housing Support
Treatment Adherence
Medical Case Management
Routine
Medical Testing
STD & PCSI
ART Guidelines Uptake
Engagement & Partner Services LINCS: Linkage, Navigation
& Retention Team
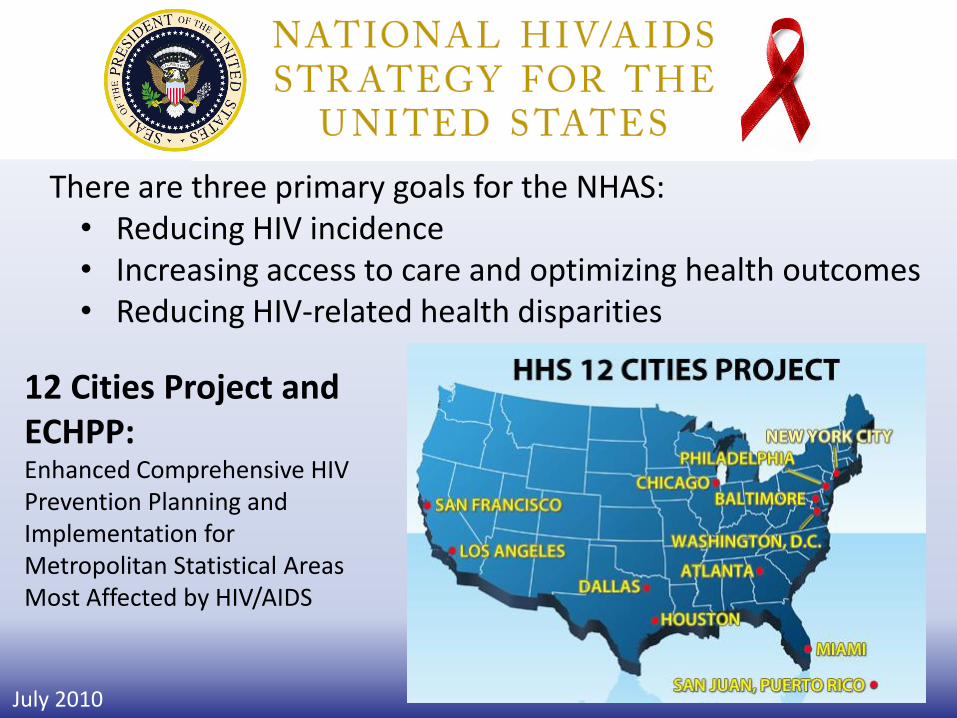
There are three primary goals for the NHAS: • Reducing HIV incidence • Increasing access to care and optimizing health outcomes • Reducing HIV-related health disparities
12 Cities Project and ECHPP: Enhanced Comprehensive HIV Prevention Planning and Implementation for Metropolitan Statistical Areas Most Affected by HIV/AIDS
July 2010
1,1
06
,40
0
87
4,0
56
65
5,5
42
43
7,0
28
34
9,6
22
26
2,2
17
20
9,7
73
1,1
78
,35
0
94
1,9
50
72
5,3
02
48
0,3
95
42
6,5
90
32
8,4
75
0
200,000
400,000
600,000
800,000
1,000,000
1,200,000
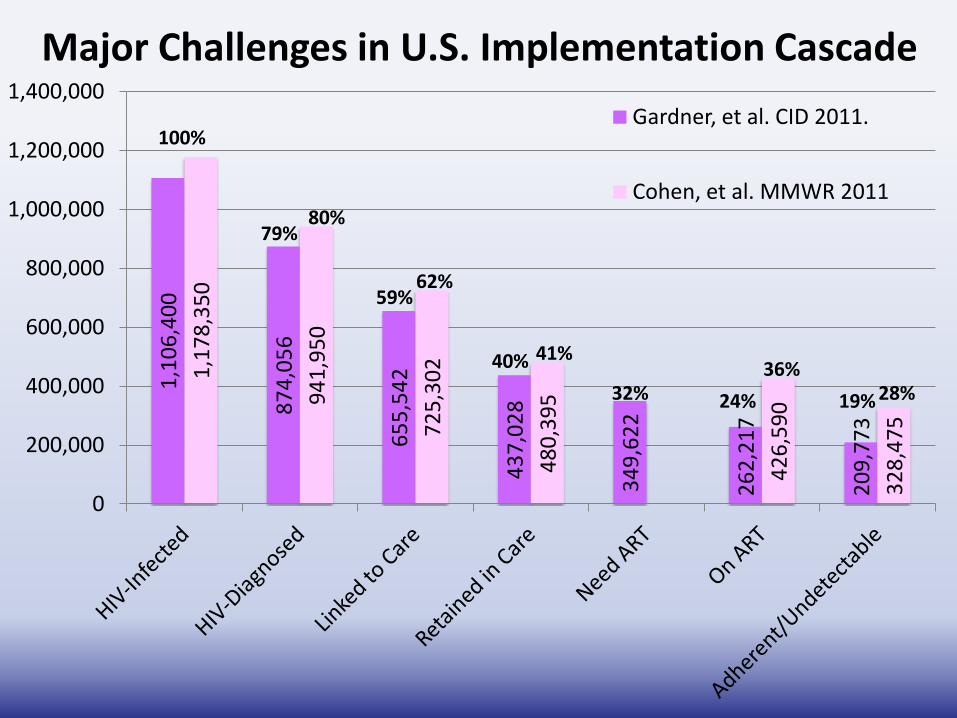
1,400,000 Gardner, et al. CID 2011.
Cohen, et al. MMWR 2011
100%
80%
62%
40%
32% 36%
28%
79%
59%
41%
24% 19%
Major Challenges in U.S. Implementation Cascade
Be Not Discouraged
• “Not everything that counts can be counted, and not everything that can be counted counts."
---Albert Einstein
When the data are in hand, we should use it!
“But once the data are in hand, it is the failure to use those data for public health purposes that must be justified.” (Fairchild, 2007)
• Surveillance data and other data could not only be used to monitor and evaluate, but for real-time quality improvement: Maximize Cascade – Prior Diagnosis
– Current and Past Location of care: Medical records
– Treatment history, co-infections, resistance
– For Linkage, Engagement, Retention & Re-Engagement
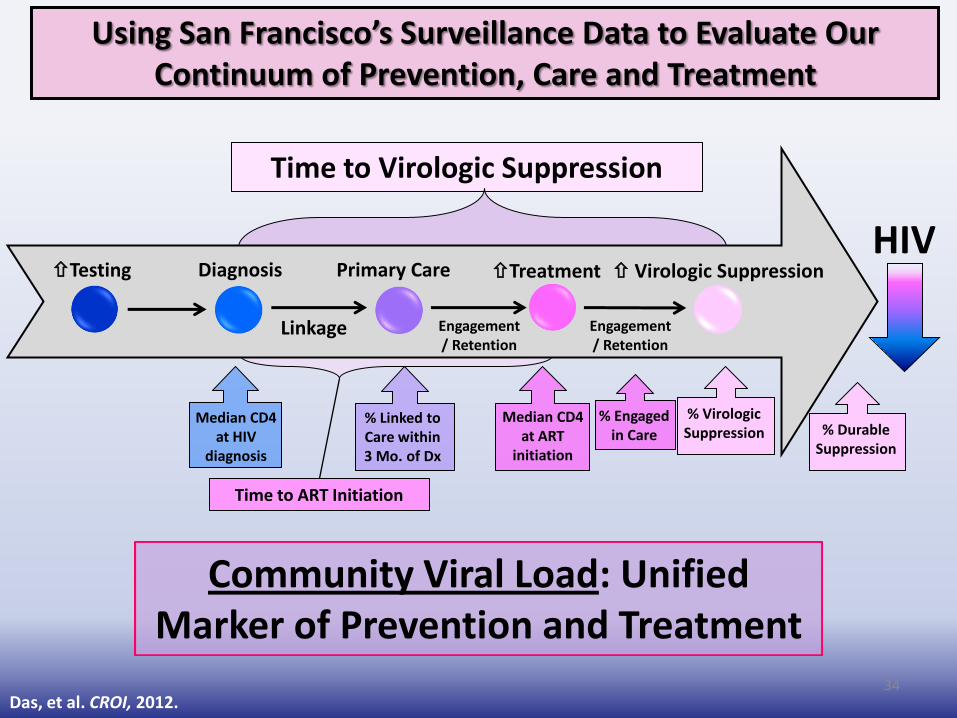
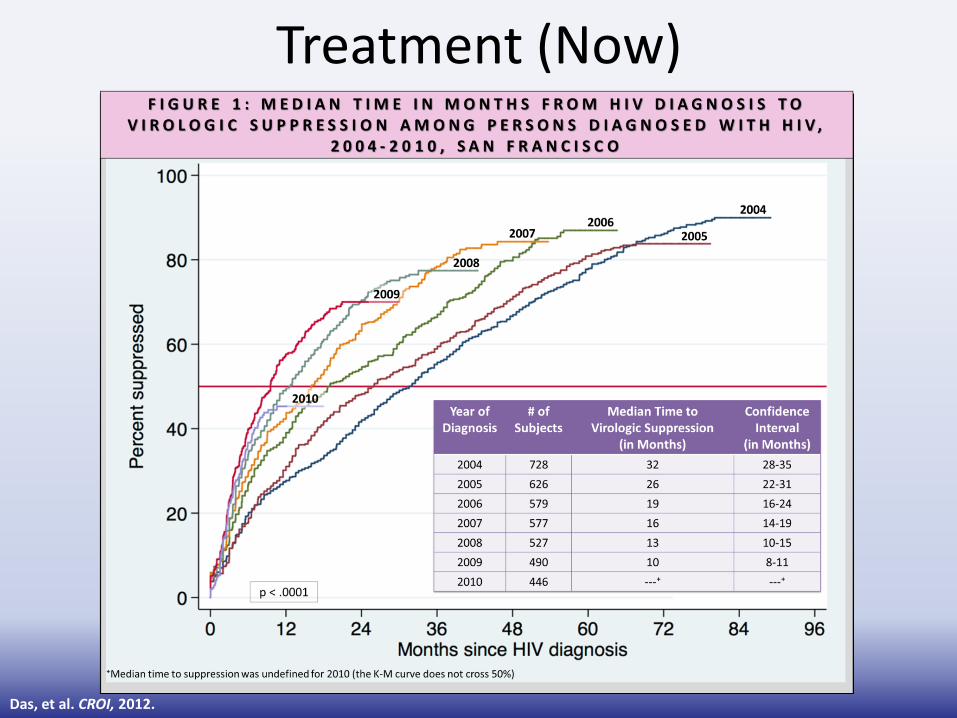
Time to Virologic Suppression
34
Using San Francisco’s Surveillance Data to Evaluate Our Continuum of Prevention, Care and Treatment
HIV Testing Diagnosis Primary Care Treatment Virologic Suppression
Linkage Engagement / Retention
Median CD4 at ART
initiation
% Engaged in Care
% Virologic Suppression
Median CD4 at HIV
diagnosis
% Linked to Care within 3 Mo. of Dx
Time to ART Initiation
Engagement / Retention
Das, et al. CROI, 2012.
Community Viral Load: Unified Marker of Prevention and Treatment
% Durable Suppression
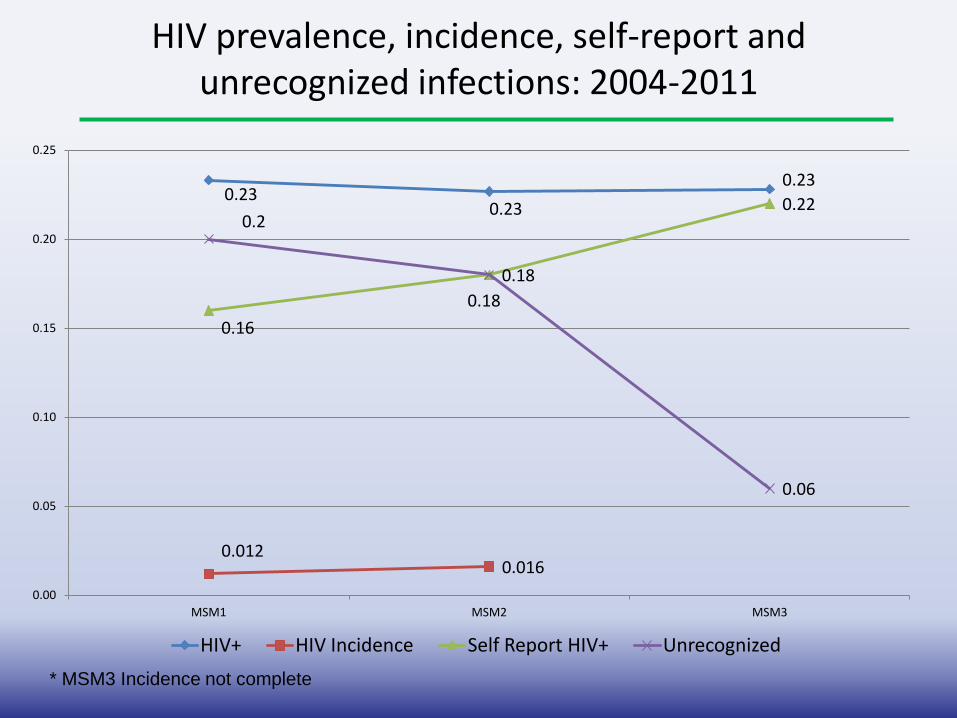
HIV prevalence, incidence, self-report and unrecognized infections: 2004-2011
0.23 0.23
0.23
0.012 0.016
0.16
0.18
0.22 0.2
0.18
0.06
0.00
0.05
0.10
0.15
0.20
0.25
MSM1 MSM2 MSM3
HIV+ HIV Incidence Self Report HIV+ Unrecognized
* MSM3 Incidence not complete
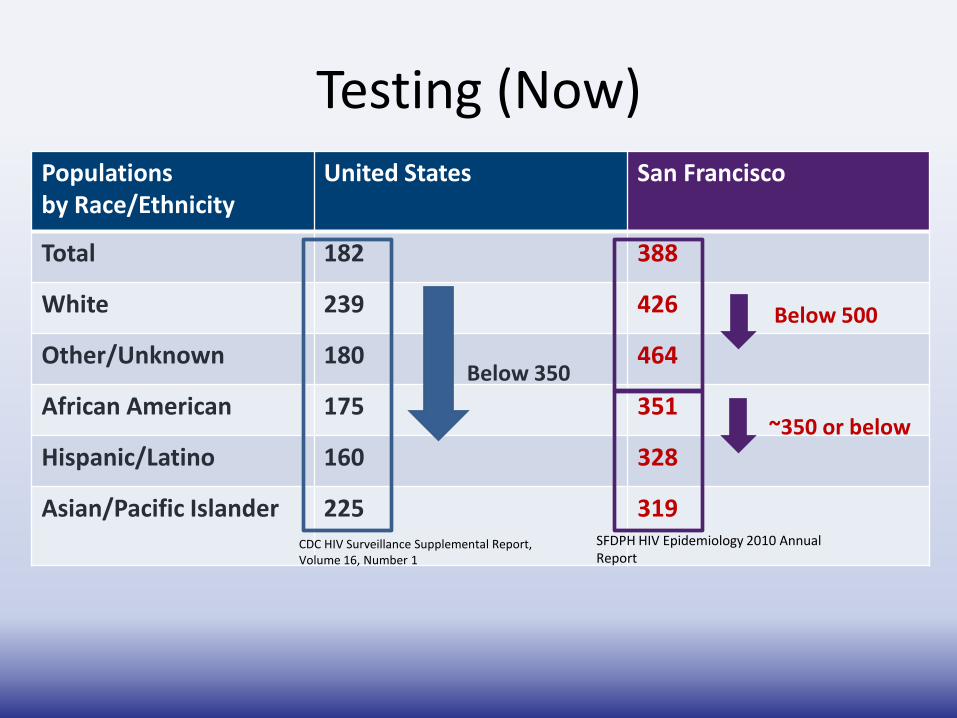
Testing (Now) Populations by Race/Ethnicity
United States San Francisco
Total 182 388
White 239 426
Other/Unknown 180 464
African American 175 351
Hispanic/Latino 160 328
Asian/Pacific Islander 225 319
Below 350
Below 500
~350 or below
CDC HIV Surveillance Supplemental Report, Volume 16, Number 1
SFDPH HIV Epidemiology 2010 Annual Report
Linkage (Now)
• % of PLWHA linked to medical care within 3 months after diagnosis – Surveillance: CD4, VL
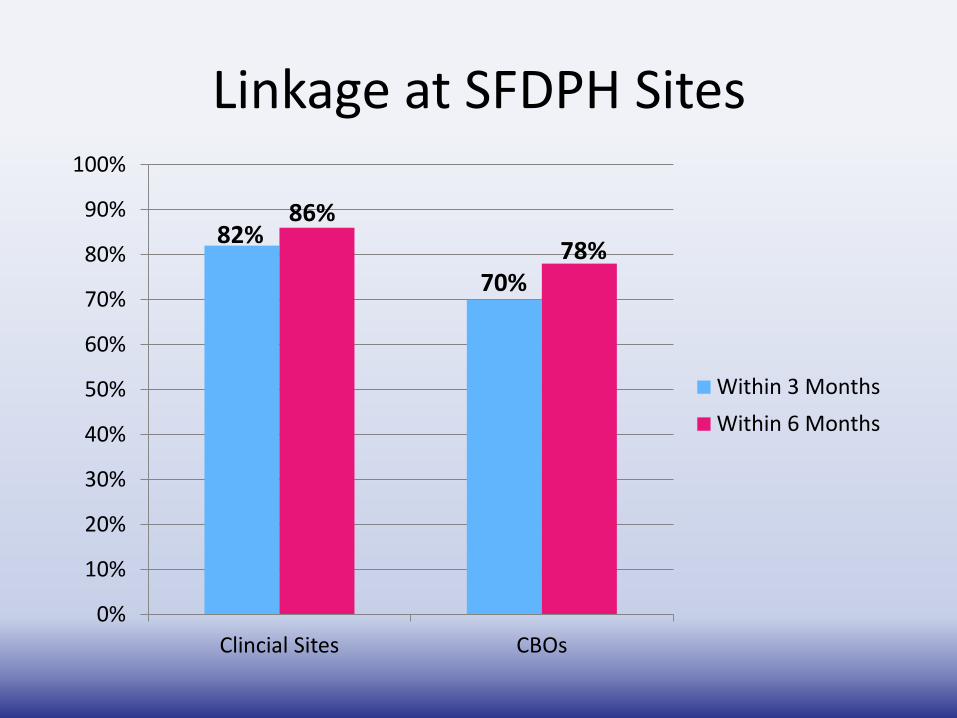
Linkage at SFDPH Sites
0%
10%
20%
30%
40%
50%
60%
70%
80%
90%
100%
Clincial Sites CBOs
Within 3 Months
Within 6 Months
82% 86%
70% 78%
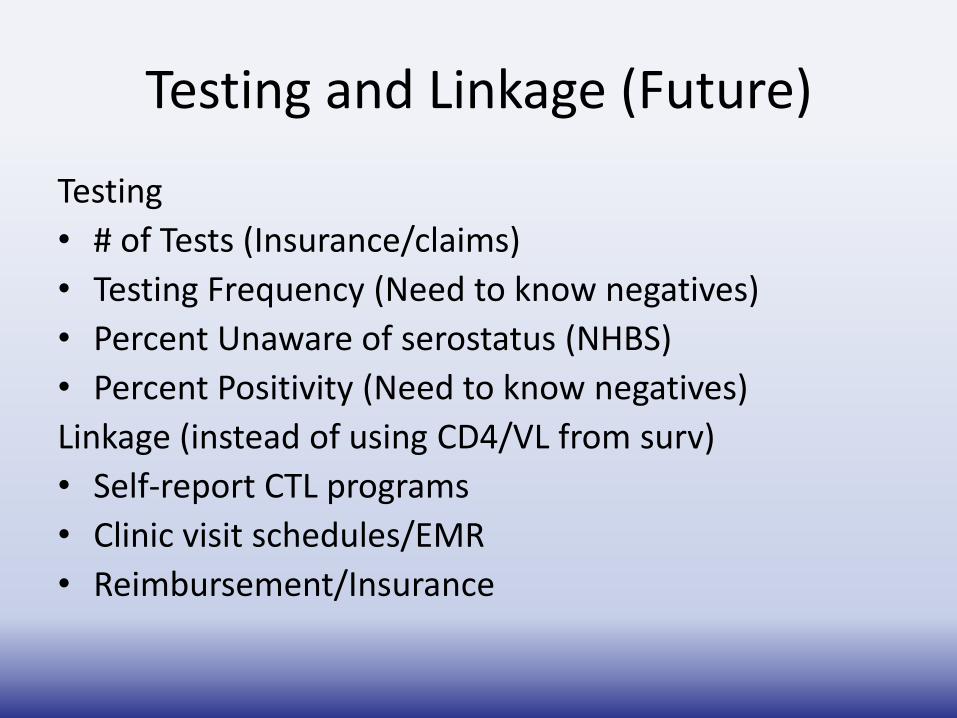
Testing and Linkage (Future)
Testing
• # of Tests (Insurance/claims)
• Testing Frequency (Need to know negatives)
• Percent Unaware of serostatus (NHBS)
• Percent Positivity (Need to know negatives)
Linkage (instead of using CD4/VL from surv)
• Self-report CTL programs
• Clinic visit schedules/EMR
• Reimbursement/Insurance
Engagement in Care (Future)
Engagement in Care
– Primary Care Visit Frequency in time period (Clinic EMR)
– Missed visits
– ER visits or hospitalizations
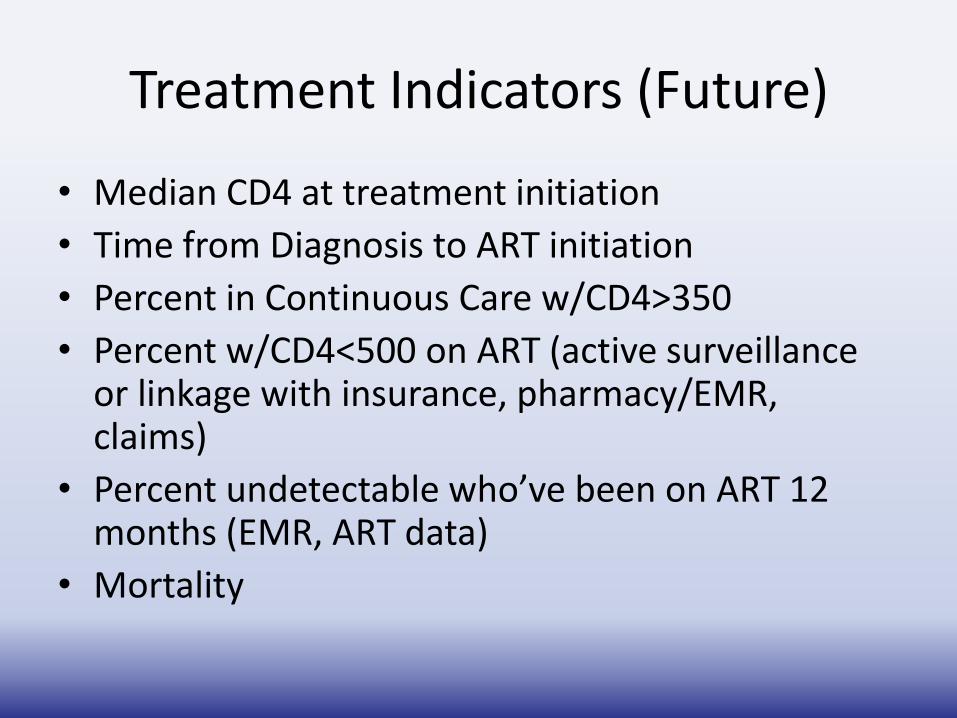
Treatment Indicators (Future)
• Median CD4 at treatment initiation
• Time from Diagnosis to ART initiation
• Percent in Continuous Care w/CD4>350
• Percent w/CD4<500 on ART (active surveillance or linkage with insurance, pharmacy/EMR, claims)
• Percent undetectable who’ve been on ART 12 months (EMR, ART data)
• Mortality
Das, et al. CROI, 2012.
Treatment (Now)
Engagement in care
• Surveillance of CD4/VL monitoring frequency
– Proportion in continuous care (2 or more visits in preceding 12 months at least 3 months apart)
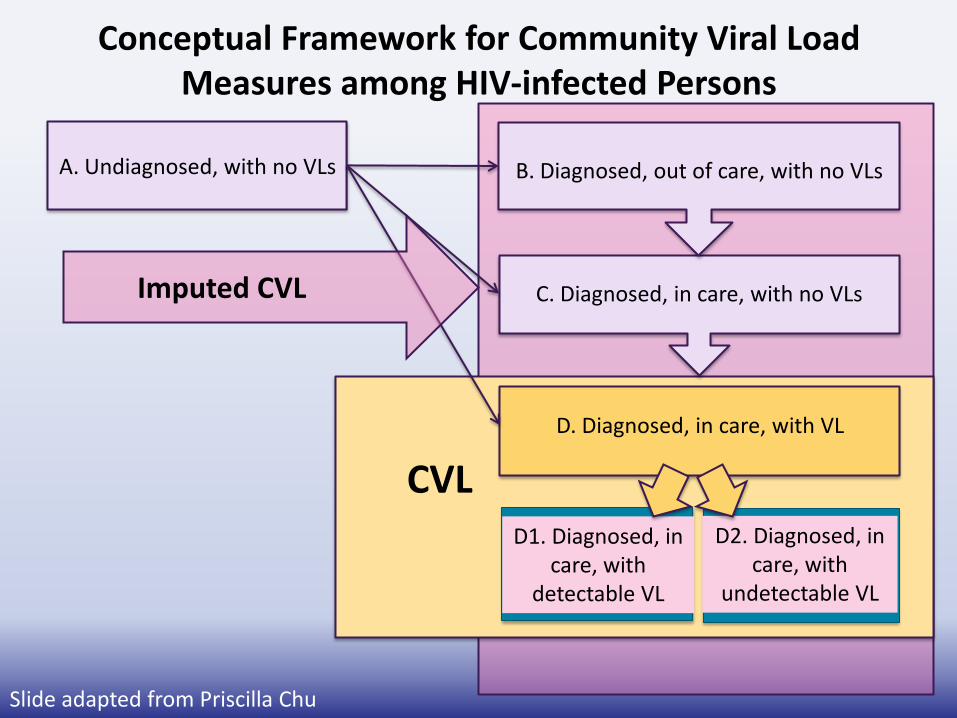
Conceptual Framework for Community Viral Load Measures among HIV-infected Persons
A. Undiagnosed, with no VLs
D2. Diagnosed, in care, with
undetectable VL
D. Diagnosed, in care, with VL
B. Diagnosed, out of care, with no VLs
C. Diagnosed, in care, with no VLs
CVL D1. Diagnosed, in
care, with detectable VL
Imputed CVL
Slide adapted from Priscilla Chu
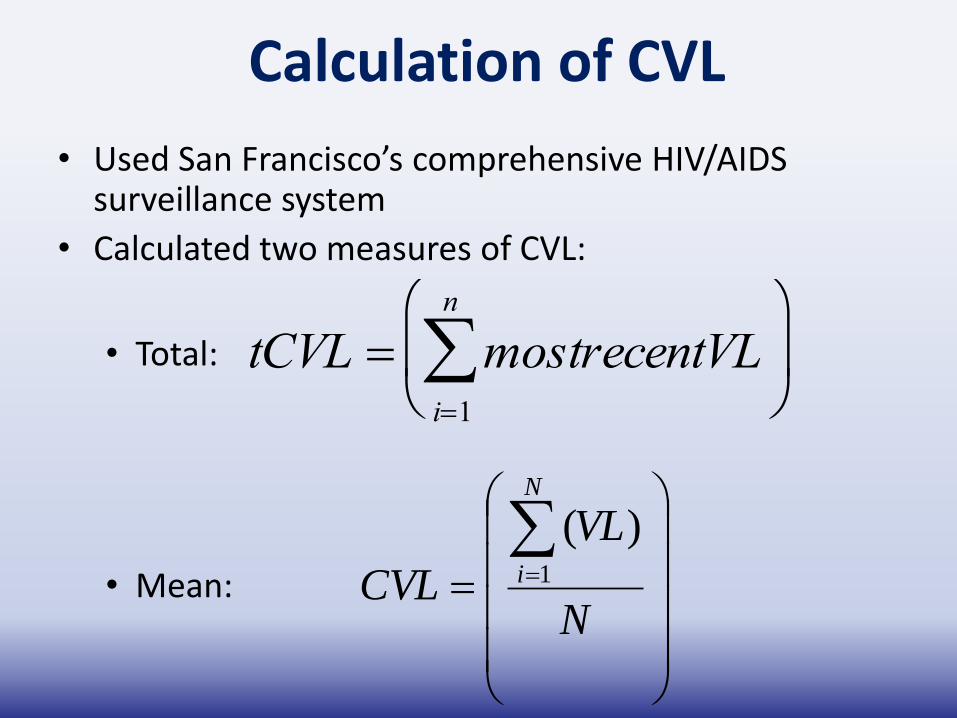
Calculation of CVL
• Used San Francisco’s comprehensive HIV/AIDS surveillance system
• Calculated two measures of CVL:
• Total:
• Mean:
N
VL
CVL
N
i 1
)(
tCVL mostrecentVLi1
n
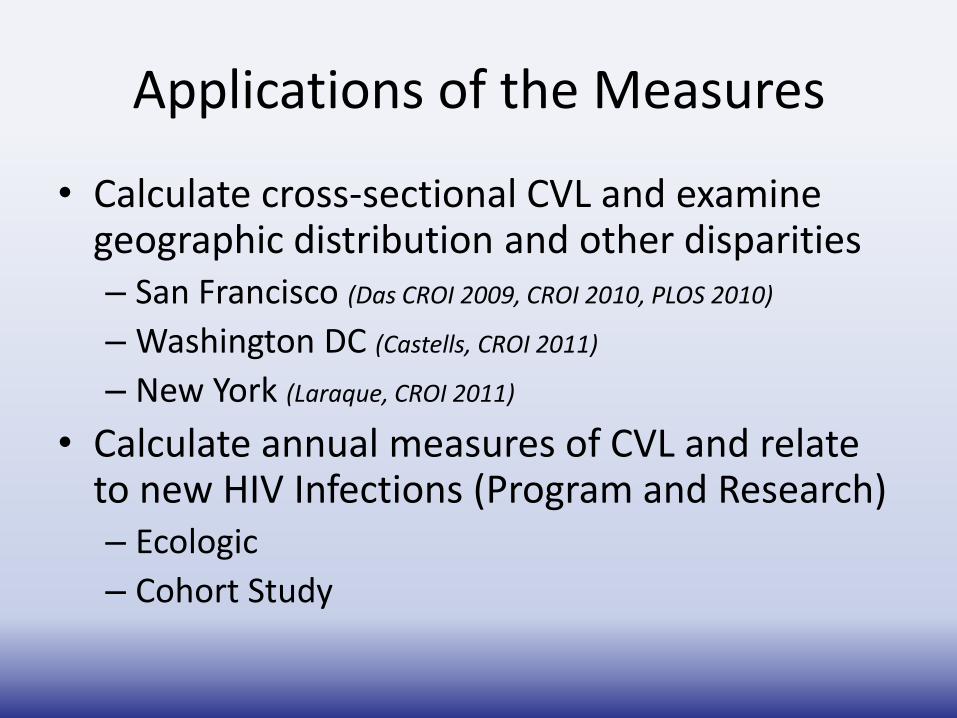
Applications of the Measures
• Calculate cross-sectional CVL and examine geographic distribution and other disparities – San Francisco (Das CROI 2009, CROI 2010, PLOS 2010)
– Washington DC (Castells, CROI 2011)
– New York (Laraque, CROI 2011)
• Calculate annual measures of CVL and relate to new HIV Infections (Program and Research) – Ecologic
– Cohort Study
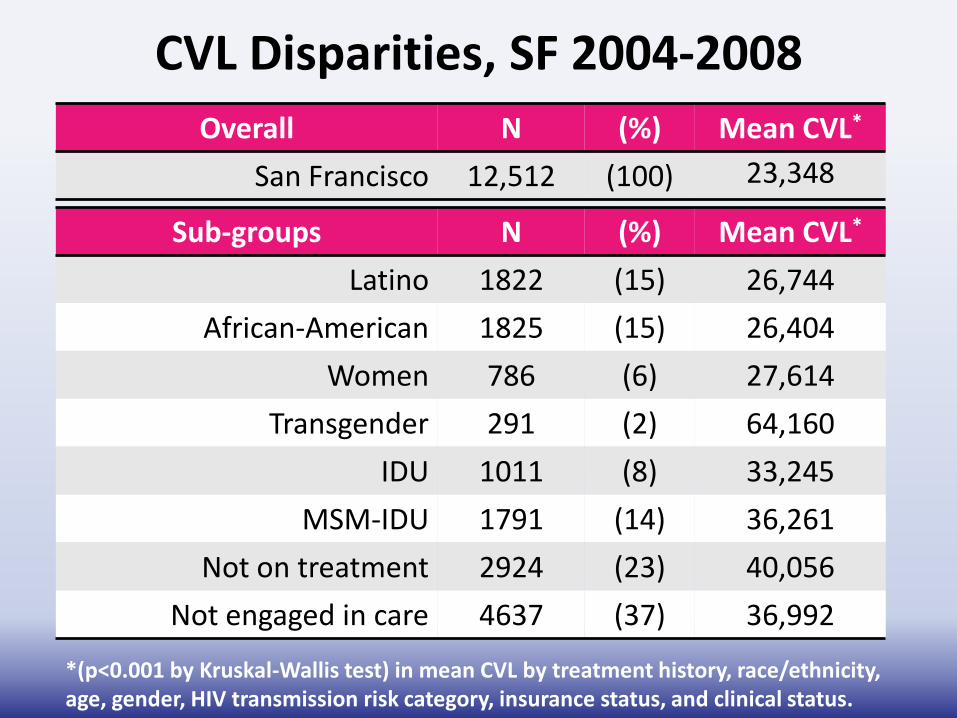
CVL Disparities, SF 2004-2008
Overall N (%) Mean CVL*
San Francisco 12,512 (100) 23,348
*(p<0.001 by Kruskal-Wallis test) in mean CVL by treatment history, race/ethnicity, age, gender, HIV transmission risk category, insurance status, and clinical status.
Sub-groups N (%) Mean CVL*
Latino 1822 (15) 26,744
African-American 1825 (15) 26,404
Women 786 (6) 27,614
Transgender 291 (2) 64,160
IDU 1011 (8) 33,245
MSM-IDU 1791 (14) 36,261
Not on treatment 2924 (23) 40,056
Not engaged in care 4637 (37) 36,992
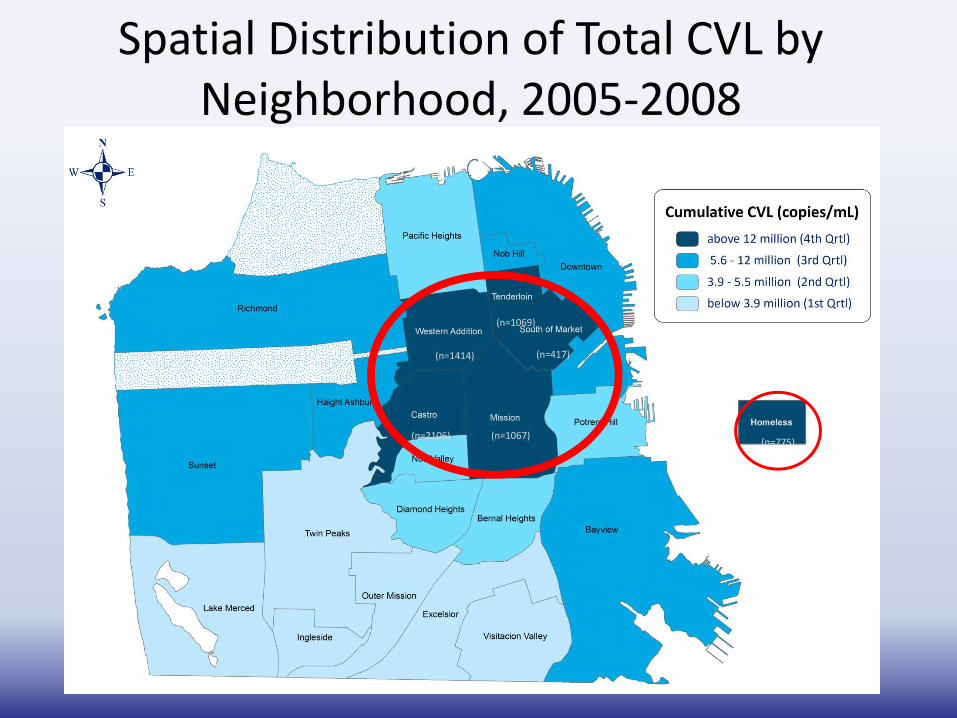
Spatial Distribution of Total CVL by Neighborhood, 2005-2008
(n=1414)
(n=1069)
(n=417)
(n=1067) (n=2106) (n=775)
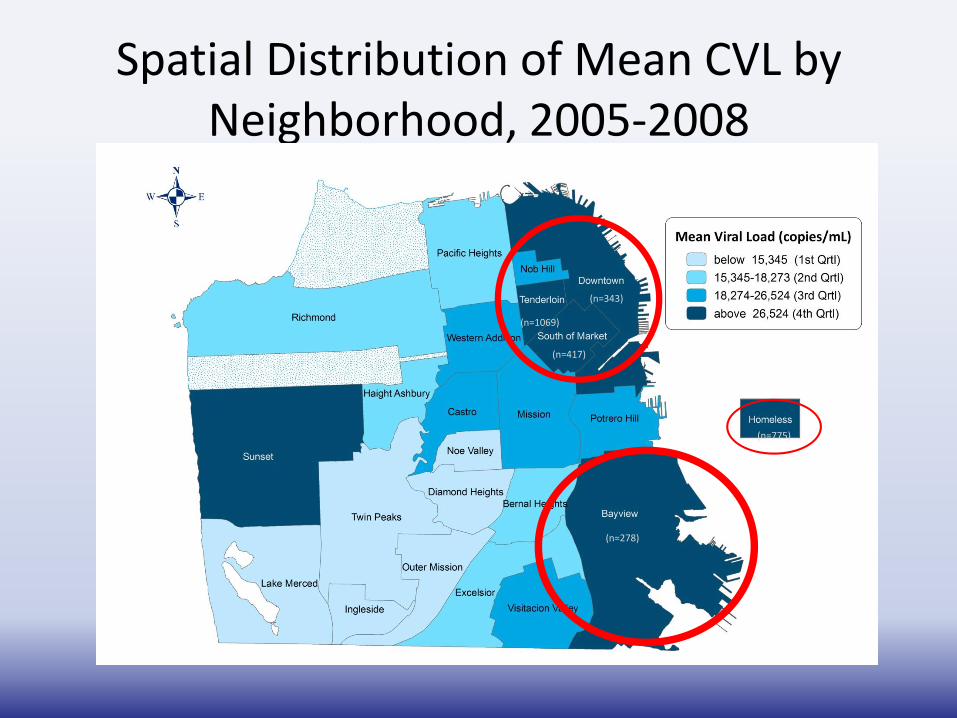
Spatial Distribution of Mean CVL by Neighborhood, 2005-2008
(n=775)
(n=417)
(n=1069)
(n=343)
(n=278)
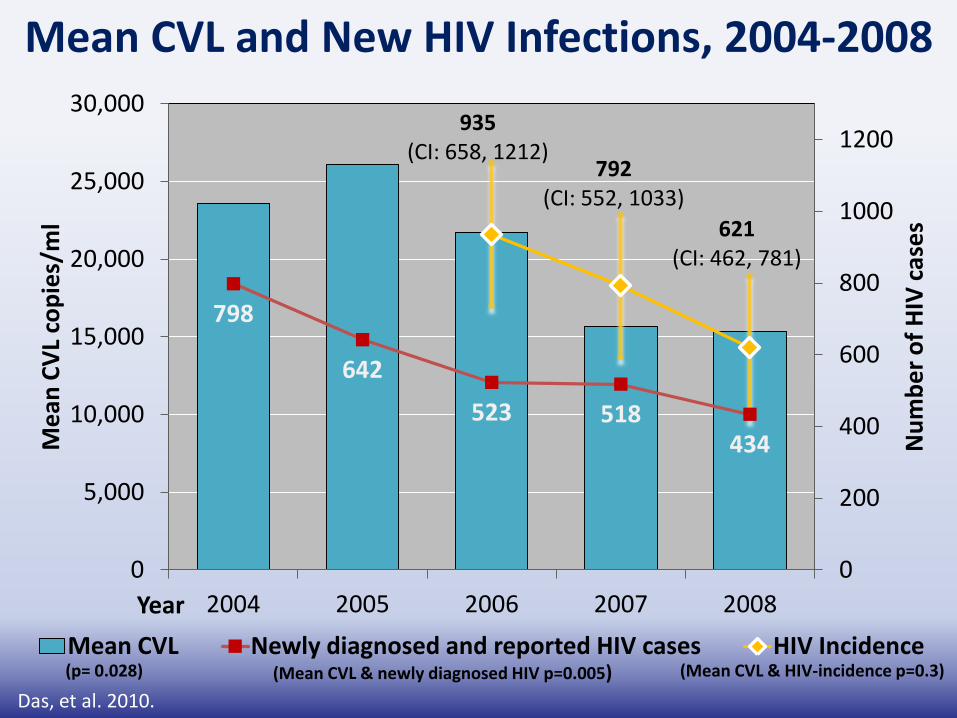
798
642
523 518 434
935 (CI: 658, 1212)
792 (CI: 552, 1033)
621 (CI: 462, 781)
0
200
400
600
800
1000
1200
0
5,000
10,000
15,000
20,000
25,000
30,000
2004 2005 2006 2007 2008
Nu
mb
er
of
HIV
cas
es
Me
an C
VL
cop
ies/
ml
Year
Mean CVL Newly diagnosed and reported HIV cases HIV Incidence (p= 0.028) (Mean CVL & HIV-incidence p=0.3) (Mean CVL & newly diagnosed HIV p=0.005)
Mean CVL and New HIV Infections, 2004-2008
Das, et al. 2010.

Minimum, Most Recent, Maximum CVL and Newly Diagnosed and Reported HIV cases
864
737
590 588 540506
0
200
400
600
800
1000
0
15,000
30,000
45,000
2004 2005 2006 2007 2008 2009
Minimum CVL(p=0.003)
Most recent CVL(p<0.001)
Maximum CVL(p=0.01)
Das, et al. CROI, 2011.
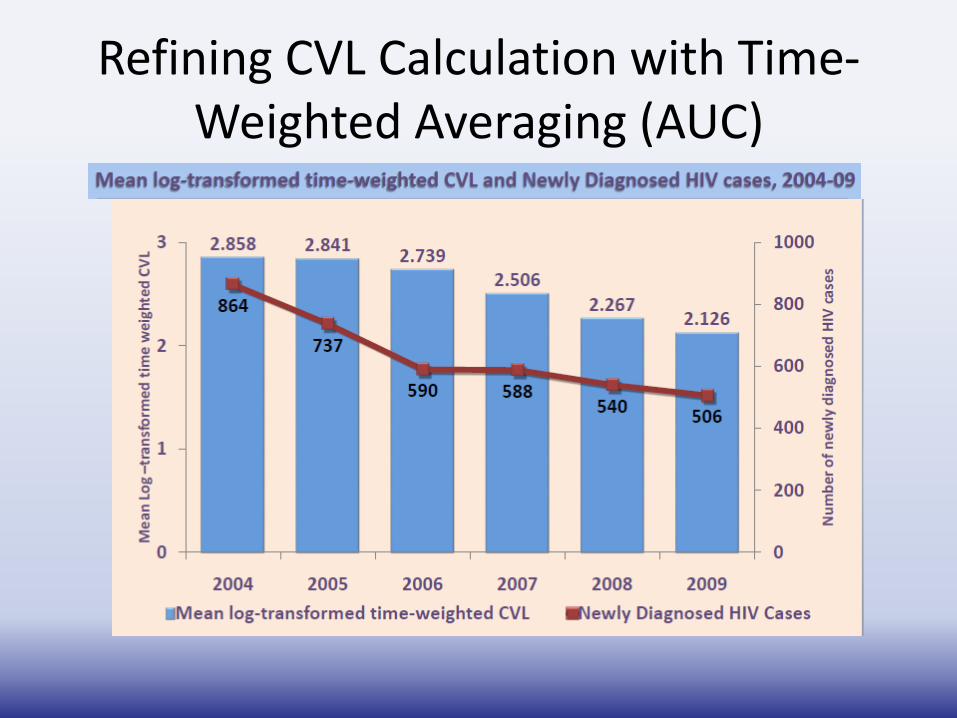
Refining CVL Calculation with Time-Weighted Averaging (AUC)
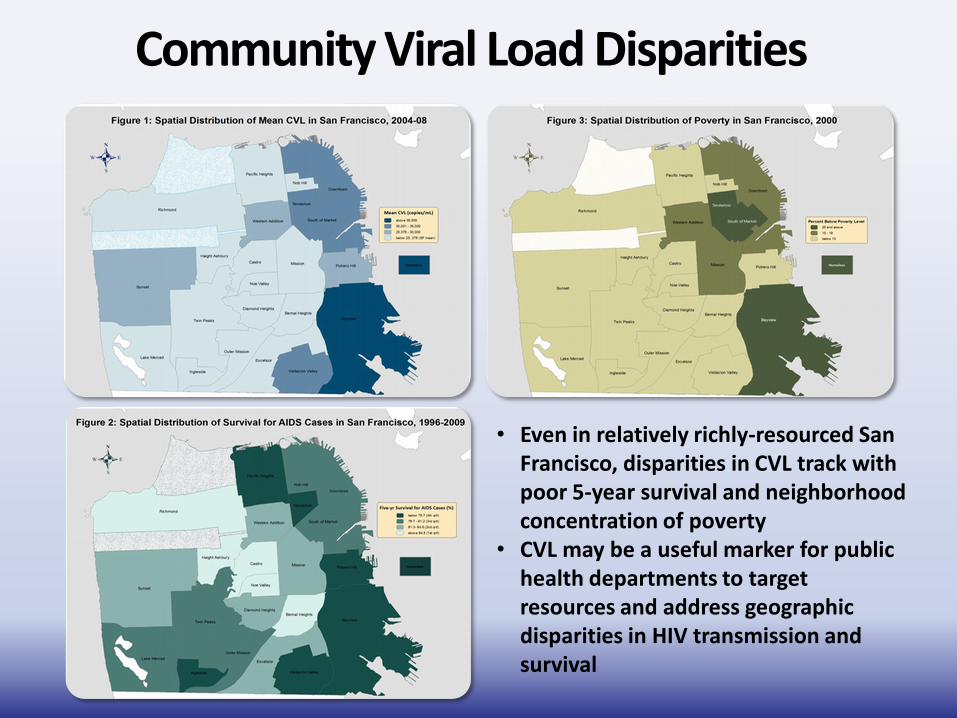
Community Viral Load Disparities
• Even in relatively richly-resourced San Francisco, disparities in CVL track with poor 5-year survival and neighborhood concentration of poverty
• CVL may be a useful marker for public health departments to target resources and address geographic disparities in HIV transmission and survival
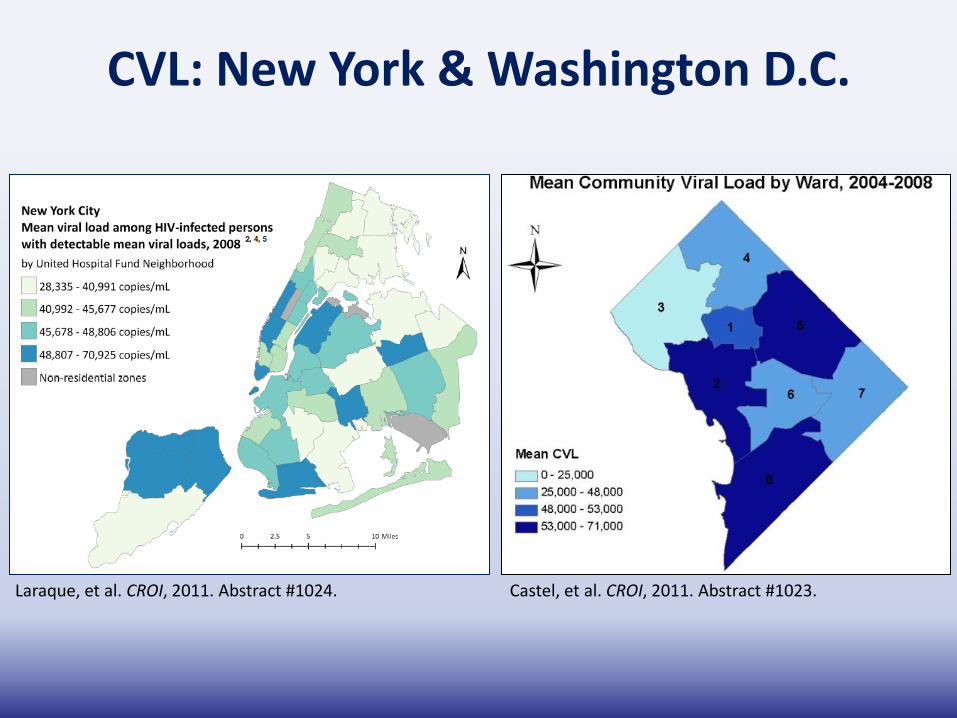
CVL: New York & Washington D.C.
Laraque, et al. CROI, 2011. Abstract #1024. Castel, et al. CROI, 2011. Abstract #1023.
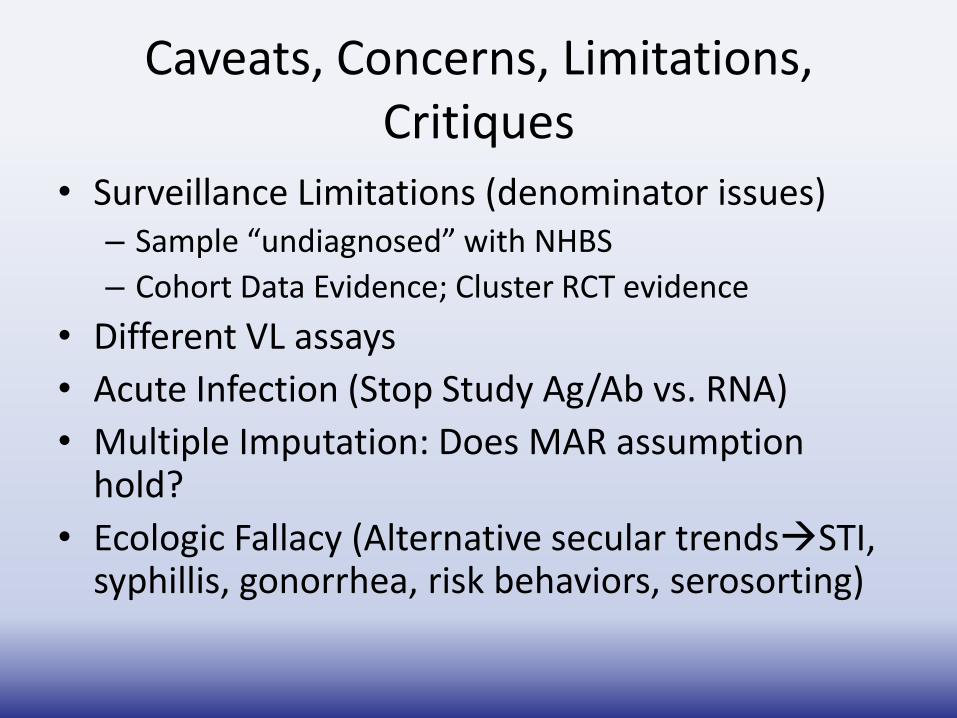
Caveats, Concerns, Limitations, Critiques
• Surveillance Limitations (denominator issues) – Sample “undiagnosed” with NHBS
– Cohort Data Evidence; Cluster RCT evidence
• Different VL assays
• Acute Infection (Stop Study Ag/Ab vs. RNA)
• Multiple Imputation: Does MAR assumption hold?
• Ecologic Fallacy (Alternative secular trendsSTI, syphillis, gonorrhea, risk behaviors, serosorting)

Let Not the Perfect Be the Enemy of the Good!
• “The perfect is the enemy of the good.”
Voltaire 1772
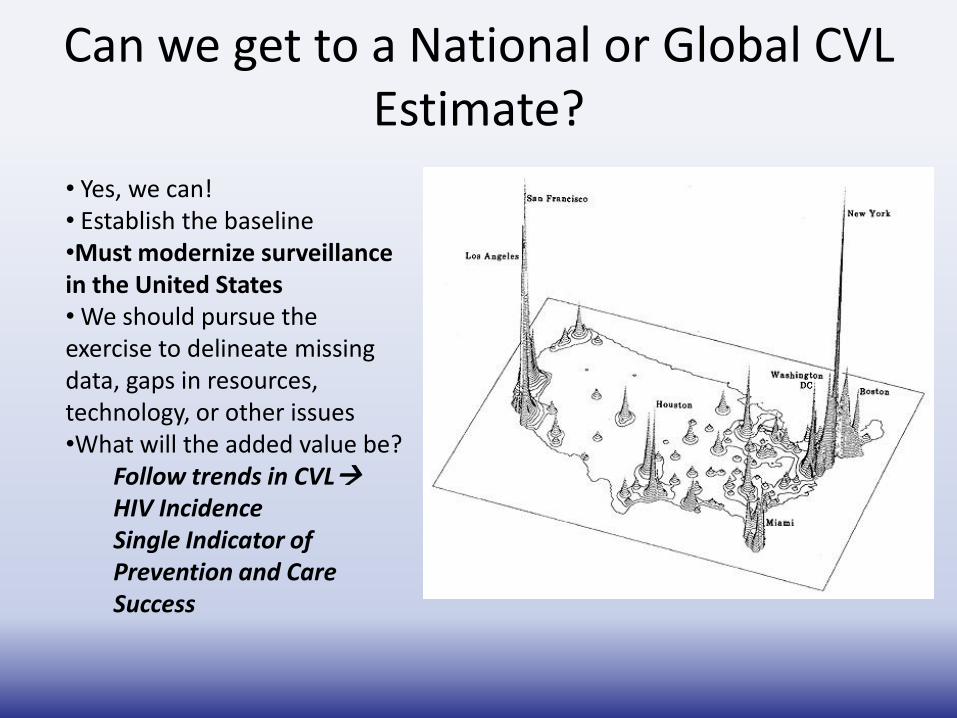
Can we get to a National or Global CVL Estimate?
• Yes, we can! • Establish the baseline •Must modernize surveillance in the United States • We should pursue the exercise to delineate missing data, gaps in resources, technology, or other issues •What will the added value be?
Follow trends in CVL HIV Incidence Single Indicator of Prevention and Care Success

THE WAY FORWARD: TRANSFORMING OUR NARRATIVE
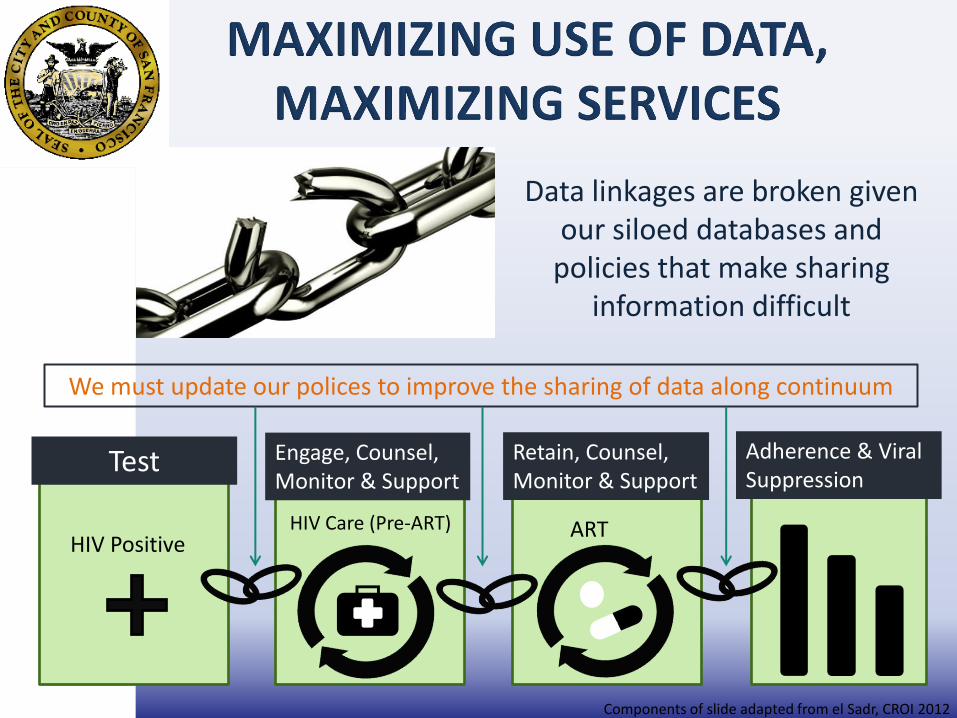
Data linkages are broken given our siloed databases and
policies that make sharing information difficult
Engage, Counsel, Monitor & Support
Retain, Counsel, Monitor & Support
Adherence & Viral Suppression
HIV Care (Pre-ART) ART
Test
HIV Positive
Components of slide adapted from el Sadr, CROI 2012
We must update our polices to improve the sharing of data along continuum
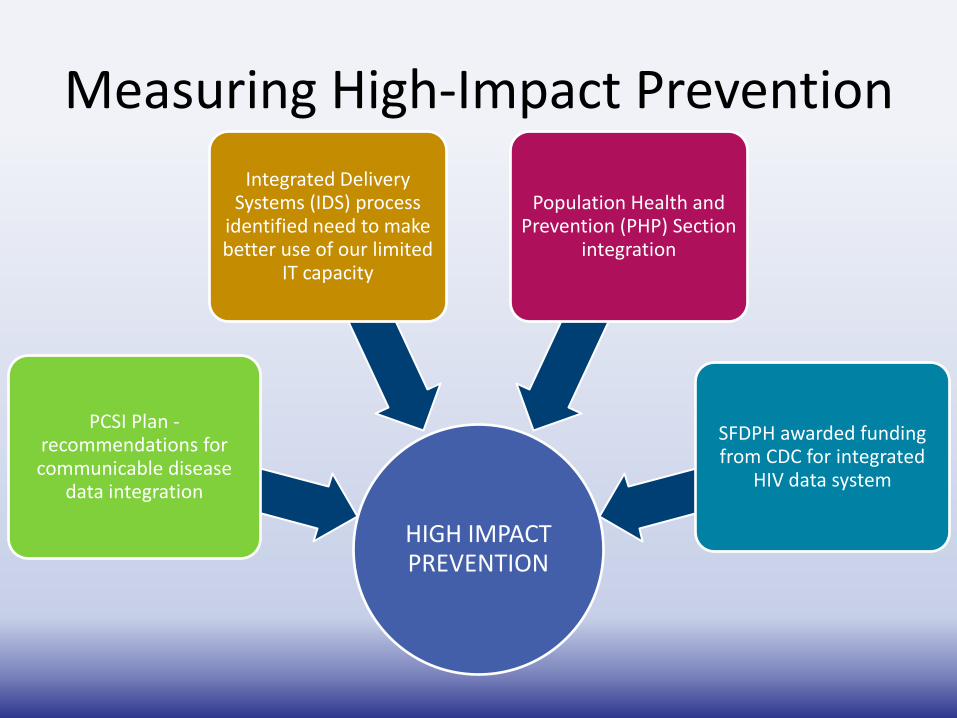
Measuring High-Impact Prevention
HIGH IMPACT PREVENTION
PCSI Plan - recommendations for communicable disease
data integration
Integrated Delivery Systems (IDS) process
identified need to make better use of our limited
IT capacity
Population Health and Prevention (PHP) Section
integration
SFDPH awarded funding from CDC for integrated
HIV data system
Institute of Medicine Report
Monitoring HIV Care in the
United States
Indicators and Data Systems
62
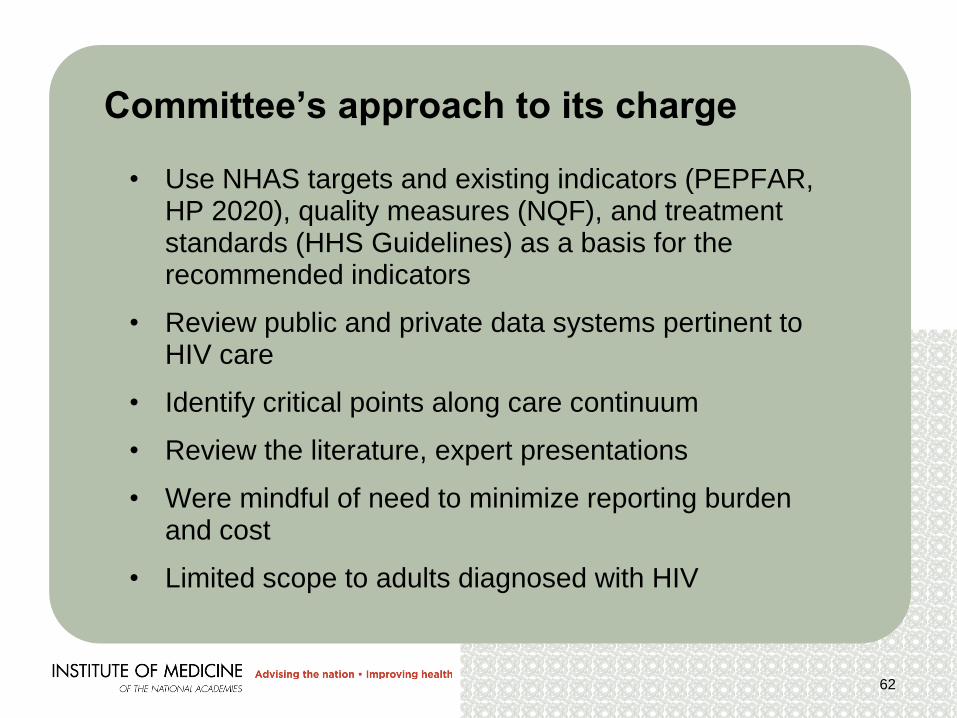
Committee’s approach to its charge
• Use NHAS targets and existing indicators (PEPFAR, HP 2020), quality measures (NQF), and treatment standards (HHS Guidelines) as a basis for the recommended indicators
• Review public and private data systems pertinent to HIV care
• Identify critical points along care continuum
• Review the literature, expert presentations
• Were mindful of need to minimize reporting burden and cost
• Limited scope to adults diagnosed with HIV
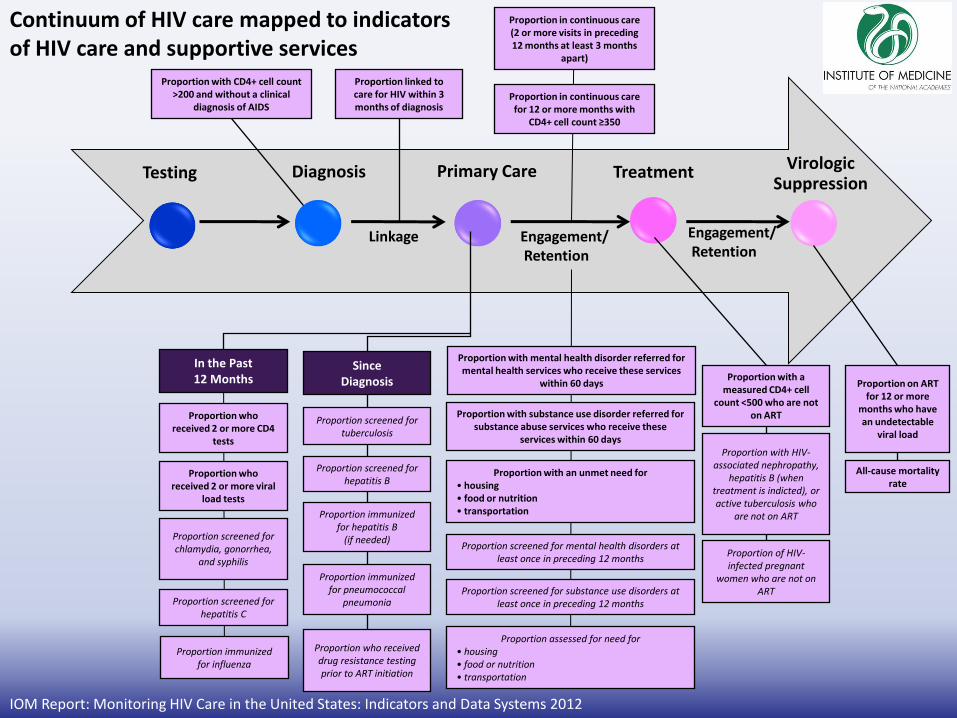
Testing Diagnosis Primary Care Treatment Virologic Suppression
Linkage Engagement/ Retention
Proportion with CD4+ cell count >200 and without a clinical
diagnosis of AIDS
In the Past 12 Months
Since Diagnosis
Proportion who received 2 or more CD4
tests
Proportion screened for hepatitis C
Proportion immunized for influenza
Proportion who received 2 or more viral
load tests
Proportion screened for chlamydia, gonorrhea,
and syphilis
Proportion screened for tuberculosis
Proportion screened for hepatitis B
Proportion immunized for hepatitis B
(if needed)
Proportion immunized for pneumococcal
pneumonia
Proportion who received drug resistance testing prior to ART initiation
Proportion with a measured CD4+ cell
count <500 who are not on ART
Proportion with HIV-associated nephropathy,
hepatitis B (when treatment is indicted), or active tuberculosis who
are not on ART
Proportion of HIV-infected pregnant
women who are not on ART
Proportion on ART for 12 or more
months who have an undetectable
viral load
All-cause mortality rate
Proportion linked to care for HIV within 3 months of diagnosis
Engagement/ Retention
Proportion with mental health disorder referred for mental health services who receive these services
within 60 days
Proportion with substance use disorder referred for substance abuse services who receive these
services within 60 days
Proportion with an unmet need for • housing • food or nutrition • transportation
Proportion screened for mental health disorders at least once in preceding 12 months
Proportion screened for substance use disorders at least once in preceding 12 months
Proportion assessed for need for • housing • food or nutrition • transportation
Proportion in continuous care for 12 or more months with
CD4+ cell count ≥350
Proportion in continuous care (2 or more visits in preceding 12 months at least 3 months
apart)
Continuum of HIV care mapped to indicators of HIV care and supportive services
IOM Report: Monitoring HIV Care in the United States: Indicators and Data Systems 2012
64
BARRIERS TO DATA
COLLECTION
65
66
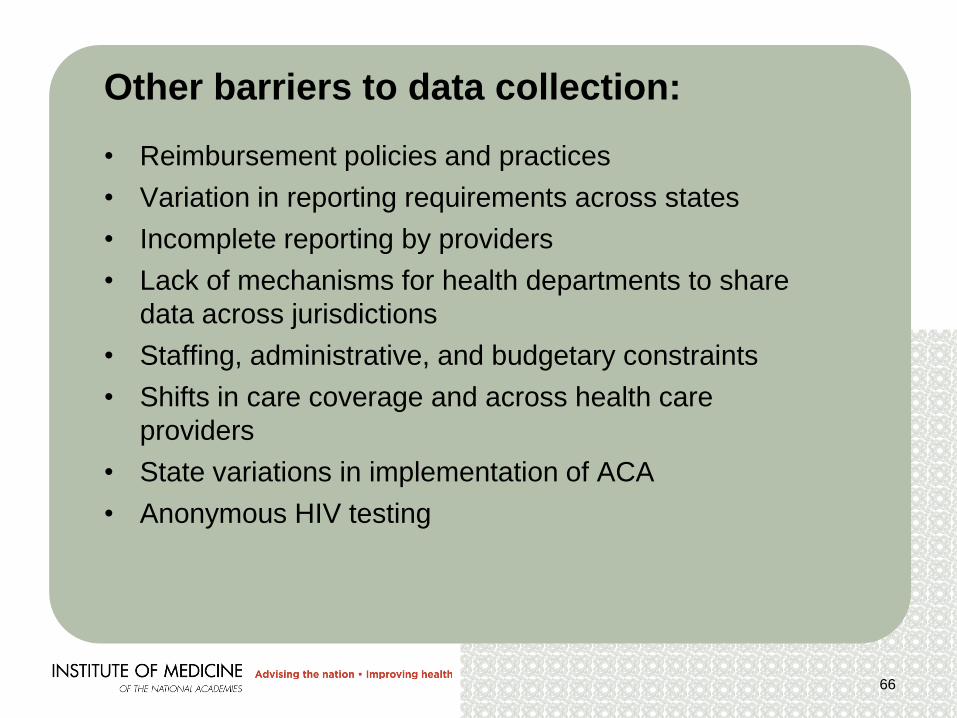
• Reimbursement policies and practices
• Variation in reporting requirements across states
• Incomplete reporting by providers
• Lack of mechanisms for health departments to share
data across jurisdictions
• Staffing, administrative, and budgetary constraints
• Shifts in care coverage and across health care
providers
• State variations in implementation of ACA
• Anonymous HIV testing
Other barriers to data collection:
67
• HHS should maintain and institutionalize the existing effort to streamline data collection and reduce reporting requirements for grantees of federally funded HIV/AIDS programs.
• HHS should issue guidance to the HIV care community to clarify what patient information is permissible to share given federal and state privacy laws.
Recommendations

REVOLUTIONIZING THE RESEARCH AGENDA
Primary Prevention
Efforts
• PrEP, PEP, condoms, syringes
• Drivers 1. Substance
use 2. Alcohol 3. Meth 4. Crack 5. Poppers 6. STDs, # of
partners
Testing Diagnosis Primary Care Treatment Virologic
Suppression
Linkage
HIV
Engagement / Retention
Engagement / Retention
San Francisco’s Approach to Maximizing the Continuum of Prevention, Care and Treatment
Community Testing
Linkage
& Partner Services
Mental Health Services
Substance Use Treatment
Housing Support
Treatment Adherence
Medical Case Management
Routine
Medical Testing
STD & PCSI
ART Guidelines Uptake
Engagement & Partner Services LINCS: Linkage, Navigation
& Retention Team
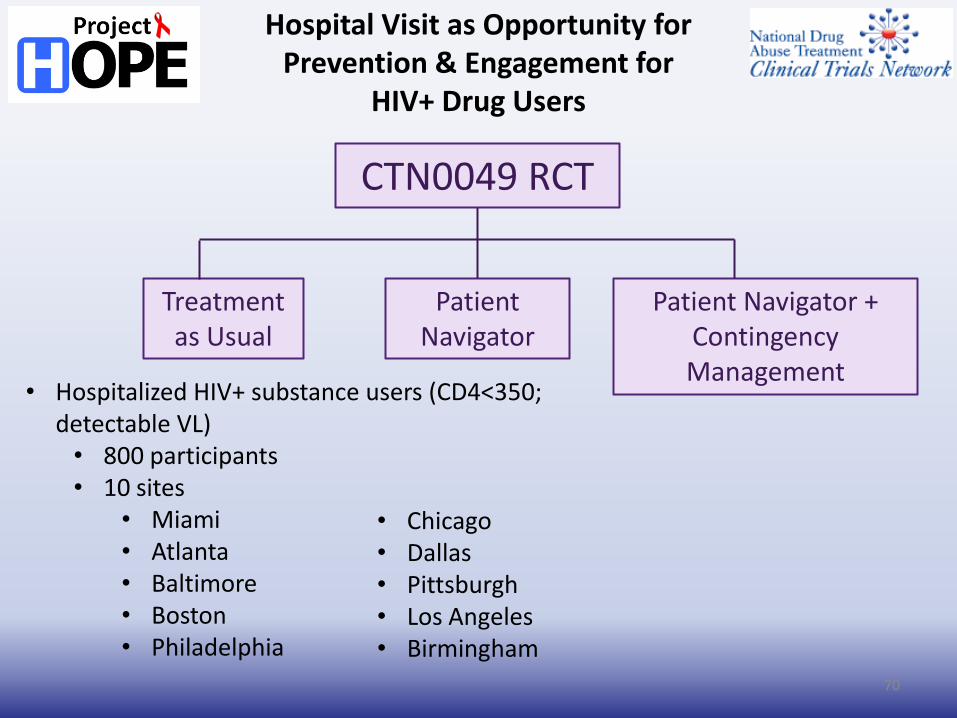
CTN0049 RCT
70
Patient Navigator
Treatment as Usual
Patient Navigator + Contingency Management
• Hospitalized HIV+ substance users (CD4<350; detectable VL) • 800 participants • 10 sites
• Miami • Atlanta • Baltimore • Boston • Philadelphia
• Chicago • Dallas • Pittsburgh • Los Angeles • Birmingham
Hospital Visit as Opportunity for Prevention & Engagement for
HIV+ Drug Users
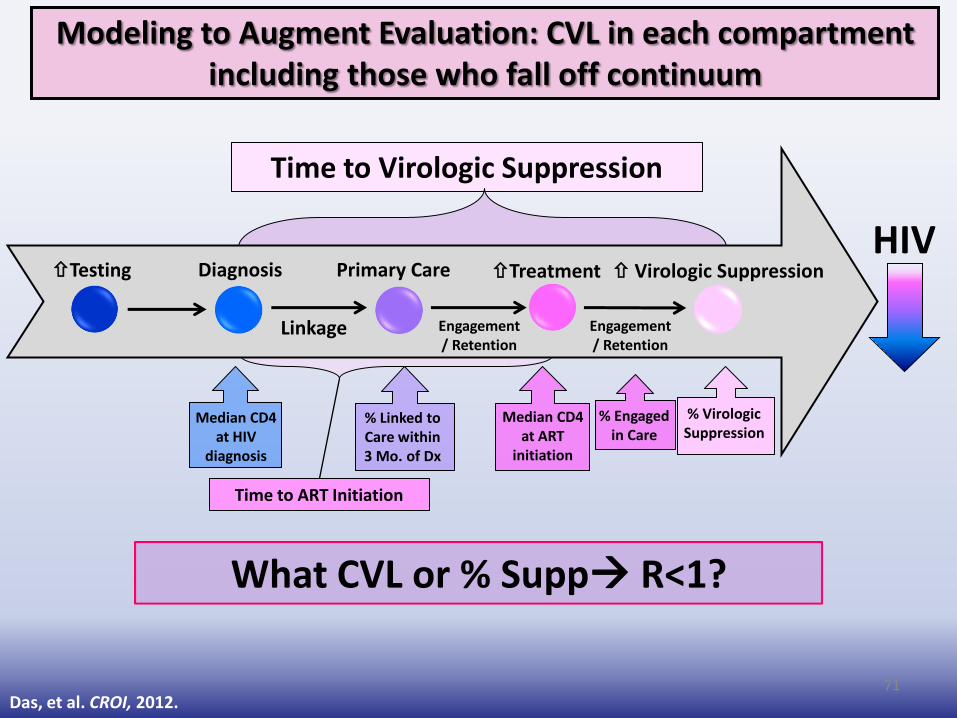
Time to Virologic Suppression
71
Modeling to Augment Evaluation: CVL in each compartment including those who fall off continuum
HIV Testing Diagnosis Primary Care Treatment Virologic Suppression
Linkage Engagement / Retention
Median CD4 at ART
initiation
% Engaged in Care
% Virologic Suppression
Median CD4 at HIV
diagnosis
% Linked to Care within 3 Mo. of Dx
Time to ART Initiation
Engagement / Retention
Das, et al. CROI, 2012.
What CVL or % Supp R<1?
Acknowledgments
SFDPH
Priscilla Chu, Glenn-Milo Santos, Susan
Scheer, Willi McFarland, Taylor Maturo, H.
Fisher Raymond, Israel Nieves-Rivera, Isela
Gonzalez, Tracey Packer, Dara Geckeler, Bill
Blum, Susan Philip, Stephanie Cohen,
Nicholas Moss, Noah Carraher, Erin
Antunez, Tomas Aragon, Barbara Garcia
UCSF Diane Havlir, Elvin Geng, Edwin Charlebois, Steve Morin, Eric Vittinghoff, Steve Deeks, Brad Hare CDC Candice Kwan, Thomas Frieden, Kate Buchacz Univ of Miami Lisa Metsch, Dan Feaster, Lauren Gooden White House Office of National AIDS Policy Greg Millet, Jeff Crowley, and Grant Colfax
People living with HIV/AIDS in San Francisco
Chairs: Moupali Das, Peter McLloyd, and Blayne Cutler
Academic, government and community public health leaders will strategize regarding best practices in scaling up ART for both individual and public health benefit within their home communities.
-- Overview of Jurisdictions offering Universal Treatment
--Moving from the Emergency to Sustainable Response
--Finding New Partners and Forging New Relationships with the old to Finance Universal Treatment
--Harmonization of Data Systems and Innovative Uses of Technology to Improve Treatment Outcomes
--Politics, Policies, Protocols, and Philosophies
SAVE THE DATE!
Renaissance Ballroom, 830-5pm