recycling and waste management - … · california’s recycling and solid waste infrastructure...
TRANSCRIPT

Recycling and Waste Management Sector Summary for Public Distribution
Recycling and Waste Management SECTOR BACKGROUND California’s recycling and solid waste infrastructure manages over 92 million tons of waste per year. The recycling infrastructure diverts over 54 percent (as of 2007) of the total waste generated from landfills each year. The majority of man-made methane emissions, a potent greenhouse gas (GHG), comes from California landfills, but instead of being landfilled waste can be used as a resource to produce renewable energy and recycle materials into beneficial products, thereby reducing energy consumption in the re-manufacturing process. Accordingly, the Recycling and Waste Management Sector plays an important role in GHG emission reductions. Measures in this sector would affect Municipal Solid Waste (MSW) generation and disposal throughout the State and could increase alternative energy production in California. Sector measures will affect landfills, composting operations, recycling, some product manufacturing, alternative energy production, agricultural operations, and municipal governments. Sector Description Greenhouse Gas Emissions Inventory The most significant source of GHG emissions in this sector is from the State’s 372 active and closed MSW landfills. The strategies in this sector are primarily directed at reducing carbon flow to landfills and reducing carbon emissions from landfills, and taking advantage of other indirect emissions reductions. Methane is a potent GHG with warming potential 21 times higher than carbon dioxide (CO2) and is generated from the anaerobic decomposition of organic waste in landfills. Non-methane organic compounds (NMOCs), also emitted from landfills, are precursors to ozone formation, can be toxic, and are odorous. In 1990, the GHG emissions from existing landfills were estimated to be 6.26 million metric tons of carbon dioxide equivalent (MMTCO2E). In 2006, the emissions estimate dropped to 5.80 MMTCO2E most likely due to the installation of control systems attributed to promulgation of federal New Source Performance Standards/Emissions Guidelines Rule and associated state and local district implementation. These emissions are forecasted to increase to approximately 7.64 MMTCO2E in 2020 due to increased waste from population growth. Approximately 94% of the waste-in-place in California is under the influence of a control system; however, estimates of landfill GHG emissions are not well-understood at this time. Currently underway, the California Energy Commission (CEC) has awarded a contract, with technical assistance from the CIWMB, to develop improved models for determining landfill methane emissions to help with this effort. However, at this time the California Air Resources Board (ARB) estimates that GHG emissions from landfills represent one to two percent of the overall statewide GHG inventory. In addition to methane from landfills, anthropogenic GHG emissions occur from fossil-fuel use in transporting and processing solid waste; in 2004 0.243 MMTCO2E was emitted from commercial MSW fuel combustion. GHG emissions also occur through combustion of fuels or flaring from landfill gas capture; however, it is not yet possible to determine estimated emissions from this source as mentioned above.
Page 1 of 16 August 25, 2008
Recycling and Waste Management Sector Summary for Public Distribution
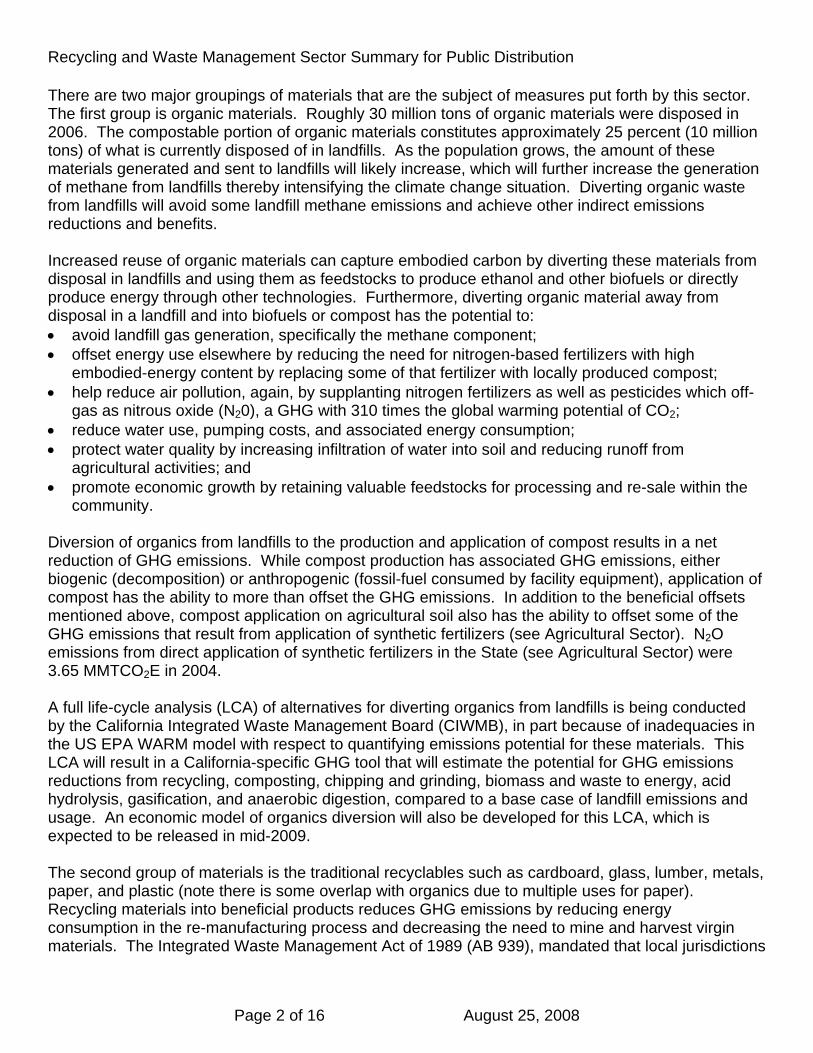
There are two major groupings of materials that are the subject of measures put forth by this sector. The first group is organic materials. Roughly 30 million tons of organic materials were disposed in 2006. The compostable portion of organic materials constitutes approximately 25 percent (10 million tons) of what is currently disposed of in landfills. As the population grows, the amount of these materials generated and sent to landfills will likely increase, which will further increase the generation of methane from landfills thereby intensifying the climate change situation. Diverting organic waste from landfills will avoid some landfill methane emissions and achieve other indirect emissions reductions and benefits. Increased reuse of organic materials can capture embodied carbon by diverting these materials from disposal in landfills and using them as feedstocks to produce ethanol and other biofuels or directly produce energy through other technologies. Furthermore, diverting organic material away from disposal in a landfill and into biofuels or compost has the potential to: • avoid landfill gas generation, specifically the methane component; • offset energy use elsewhere by reducing the need for nitrogen-based fertilizers with high
embodied-energy content by replacing some of that fertilizer with locally produced compost; • help reduce air pollution, again, by supplanting nitrogen fertilizers as well as pesticides which off-
gas as nitrous oxide (N20), a GHG with 310 times the global warming potential of CO2; • reduce water use, pumping costs, and associated energy consumption; • protect water quality by increasing infiltration of water into soil and reducing runoff from
agricultural activities; and • promote economic growth by retaining valuable feedstocks for processing and re-sale within the
community. Diversion of organics from landfills to the production and application of compost results in a net reduction of GHG emissions. While compost production has associated GHG emissions, either biogenic (decomposition) or anthropogenic (fossil-fuel consumed by facility equipment), application of compost has the ability to more than offset the GHG emissions. In addition to the beneficial offsets mentioned above, compost application on agricultural soil also has the ability to offset some of the GHG emissions that result from application of synthetic fertilizers (see Agricultural Sector). N2O emissions from direct application of synthetic fertilizers in the State (see Agricultural Sector) were 3.65 MMTCO2E in 2004. A full life-cycle analysis (LCA) of alternatives for diverting organics from landfills is being conducted by the California Integrated Waste Management Board (CIWMB), in part because of inadequacies in the US EPA WARM model with respect to quantifying emissions potential for these materials. This LCA will result in a California-specific GHG tool that will estimate the potential for GHG emissions reductions from recycling, composting, chipping and grinding, biomass and waste to energy, acid hydrolysis, gasification, and anaerobic digestion, compared to a base case of landfill emissions and usage. An economic model of organics diversion will also be developed for this LCA, which is expected to be released in mid-2009. The second group of materials is the traditional recyclables such as cardboard, glass, lumber, metals, paper, and plastic (note there is some overlap with organics due to multiple uses for paper). Recycling materials into beneficial products reduces GHG emissions by reducing energy consumption in the re-manufacturing process and decreasing the need to mine and harvest virgin materials. The Integrated Waste Management Act of 1989 (AB 939), mandated that local jurisdictions
Page 2 of 16 August 25, 2008
Recycling and Waste Management Sector Summary for Public Distribution
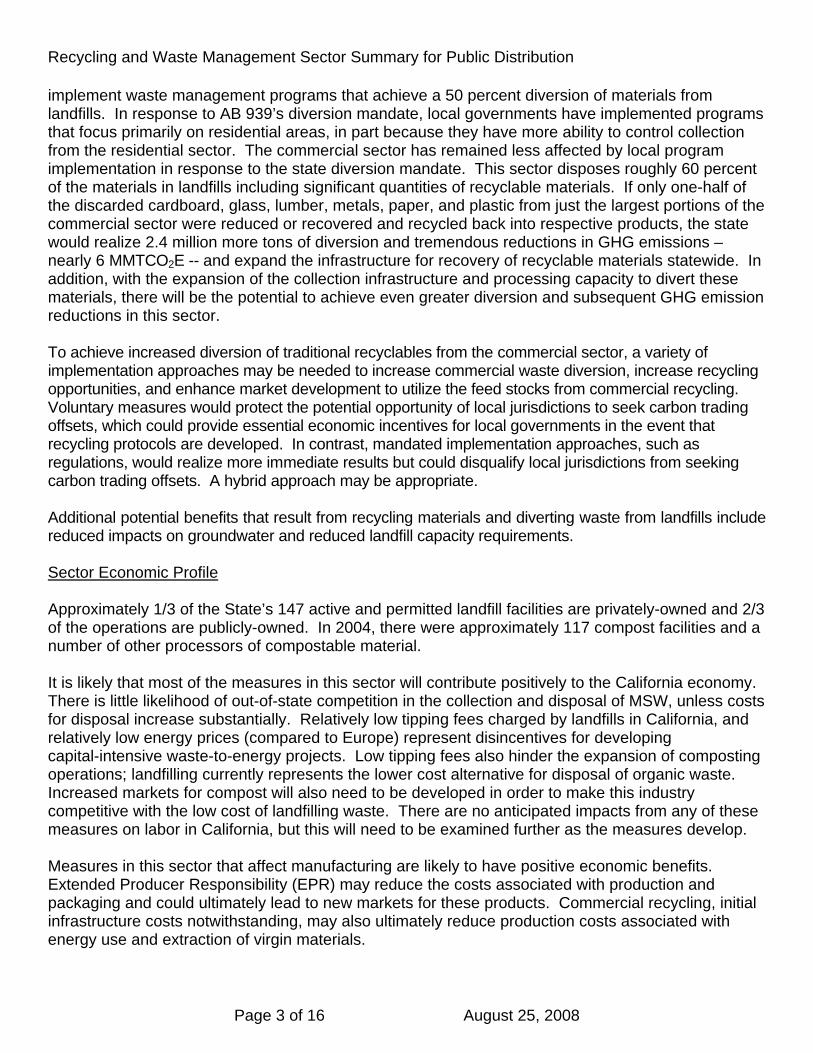
implement waste management programs that achieve a 50 percent diversion of materials from landfills. In response to AB 939’s diversion mandate, local governments have implemented programs that focus primarily on residential areas, in part because they have more ability to control collection from the residential sector. The commercial sector has remained less affected by local program implementation in response to the state diversion mandate. This sector disposes roughly 60 percent of the materials in landfills including significant quantities of recyclable materials. If only one-half of the discarded cardboard, glass, lumber, metals, paper, and plastic from just the largest portions of the commercial sector were reduced or recovered and recycled back into respective products, the state would realize 2.4 million more tons of diversion and tremendous reductions in GHG emissions – nearly 6 MMTCO2E -- and expand the infrastructure for recovery of recyclable materials statewide. In addition, with the expansion of the collection infrastructure and processing capacity to divert these materials, there will be the potential to achieve even greater diversion and subsequent GHG emission reductions in this sector. To achieve increased diversion of traditional recyclables from the commercial sector, a variety of implementation approaches may be needed to increase commercial waste diversion, increase recycling opportunities, and enhance market development to utilize the feed stocks from commercial recycling. Voluntary measures would protect the potential opportunity of local jurisdictions to seek carbon trading offsets, which could provide essential economic incentives for local governments in the event that recycling protocols are developed. In contrast, mandated implementation approaches, such as regulations, would realize more immediate results but could disqualify local jurisdictions from seeking carbon trading offsets. A hybrid approach may be appropriate. Additional potential benefits that result from recycling materials and diverting waste from landfills include reduced impacts on groundwater and reduced landfill capacity requirements. Sector Economic Profile Approximately 1/3 of the State’s 147 active and permitted landfill facilities are privately-owned and 2/3 of the operations are publicly-owned. In 2004, there were approximately 117 compost facilities and a number of other processors of compostable material. It is likely that most of the measures in this sector will contribute positively to the California economy. There is little likelihood of out-of-state competition in the collection and disposal of MSW, unless costs for disposal increase substantially. Relatively low tipping fees charged by landfills in California, and relatively low energy prices (compared to Europe) represent disincentives for developing capital-intensive waste-to-energy projects. Low tipping fees also hinder the expansion of composting operations; landfilling currently represents the lower cost alternative for disposal of organic waste. Increased markets for compost will also need to be developed in order to make this industry competitive with the low cost of landfilling waste. There are no anticipated impacts from any of these measures on labor in California, but this will need to be examined further as the measures develop. Measures in this sector that affect manufacturing are likely to have positive economic benefits. Extended Producer Responsibility (EPR) may reduce the costs associated with production and packaging and could ultimately lead to new markets for these products. Commercial recycling, initial infrastructure costs notwithstanding, may also ultimately reduce production costs associated with energy use and extraction of virgin materials.
Page 3 of 16 August 25, 2008
Recycling and Waste Management Sector Summary for Public Distribution
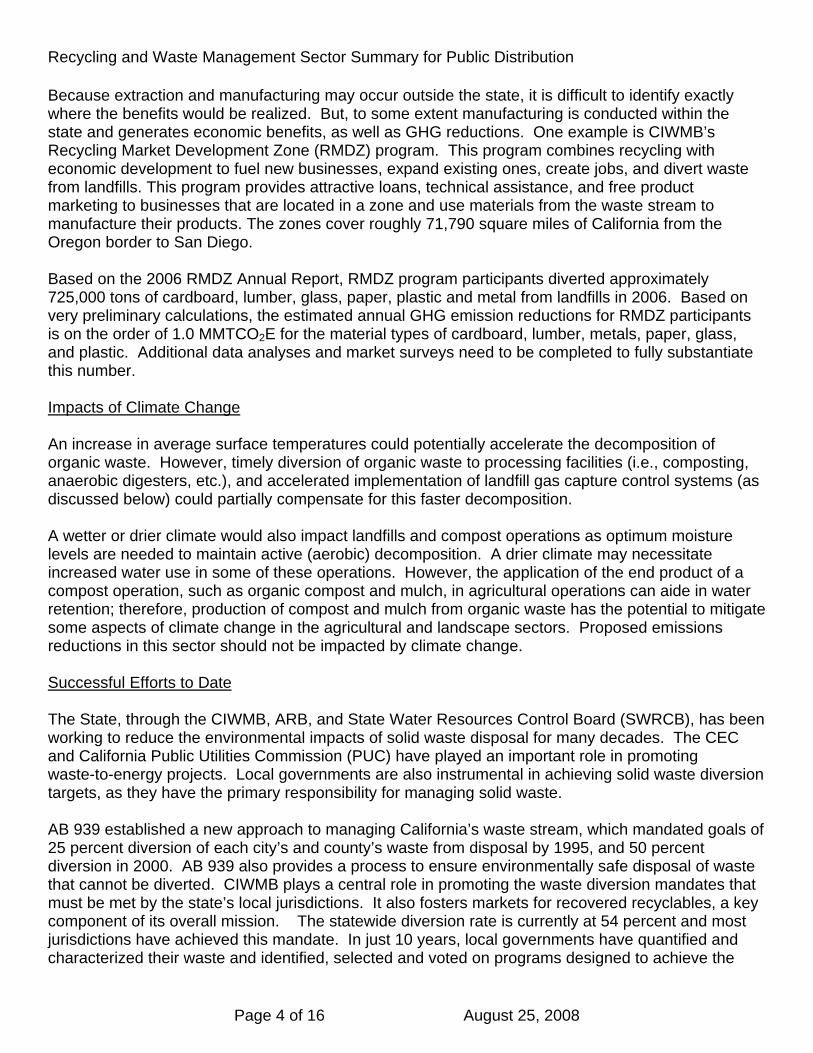
Because extraction and manufacturing may occur outside the state, it is difficult to identify exactly where the benefits would be realized. But, to some extent manufacturing is conducted within the state and generates economic benefits, as well as GHG reductions. One example is CIWMB’s Recycling Market Development Zone (RMDZ) program. This program combines recycling with economic development to fuel new businesses, expand existing ones, create jobs, and divert waste from landfills. This program provides attractive loans, technical assistance, and free product marketing to businesses that are located in a zone and use materials from the waste stream to manufacture their products. The zones cover roughly 71,790 square miles of California from the Oregon border to San Diego. Based on the 2006 RMDZ Annual Report, RMDZ program participants diverted approximately 725,000 tons of cardboard, lumber, glass, paper, plastic and metal from landfills in 2006. Based on very preliminary calculations, the estimated annual GHG emission reductions for RMDZ participants is on the order of 1.0 MMTCO2E for the material types of cardboard, lumber, metals, paper, glass, and plastic. Additional data analyses and market surveys need to be completed to fully substantiate this number. Impacts of Climate Change An increase in average surface temperatures could potentially accelerate the decomposition of organic waste. However, timely diversion of organic waste to processing facilities (i.e., composting, anaerobic digesters, etc.), and accelerated implementation of landfill gas capture control systems (as discussed below) could partially compensate for this faster decomposition. A wetter or drier climate would also impact landfills and compost operations as optimum moisture levels are needed to maintain active (aerobic) decomposition. A drier climate may necessitate increased water use in some of these operations. However, the application of the end product of a compost operation, such as organic compost and mulch, in agricultural operations can aide in water retention; therefore, production of compost and mulch from organic waste has the potential to mitigate some aspects of climate change in the agricultural and landscape sectors. Proposed emissions reductions in this sector should not be impacted by climate change. Successful Efforts to Date The State, through the CIWMB, ARB, and State Water Resources Control Board (SWRCB), has been working to reduce the environmental impacts of solid waste disposal for many decades. The CEC and California Public Utilities Commission (PUC) have played an important role in promoting waste-to-energy projects. Local governments are also instrumental in achieving solid waste diversion targets, as they have the primary responsibility for managing solid waste. AB 939 established a new approach to managing California’s waste stream, which mandated goals of 25 percent diversion of each city’s and county’s waste from disposal by 1995, and 50 percent diversion in 2000. AB 939 also provides a process to ensure environmentally safe disposal of waste that cannot be diverted. CIWMB plays a central role in promoting the waste diversion mandates that must be met by the state’s local jurisdictions. It also fosters markets for recovered recyclables, a key component of its overall mission. The statewide diversion rate is currently at 54 percent and most jurisdictions have achieved this mandate. In just 10 years, local governments have quantified and characterized their waste and identified, selected and voted on programs designed to achieve the
Page 4 of 16 August 25, 2008

Recycling and Waste Management Sector Summary for Public Distribution
mandates. Today, California has a broad-based and expanding infrastructure that diverts over half of the state’s entire waste stream. AB 939, along with Title 14 and Chapter 15 of California’s environmental regulations, put the state on course to comply with federal standards for managing solid waste, including the design, construction and operation of landfills. In 1993, California became one of the first states to receive federal approval to assume authority over its solid waste activities, having exceeded the federal standards through the adoption of more stringent State regulations. Since then, the environmental performance of waste handling facilities in California has steadily improved. The vast majority of waste (94 percent) is contained in landfills with approved gas landfill collection and control technologies that combust (destroy) methane. California, under the authority of the PUC and in coordination with the CEC has a Renewable Portfolio Standard (RPS) with the mandate for California to obtain 20 percent of its energy from renewable energy sources. The state is also considering a further goal of 33% by 2020. Based on RPS compliance filings made on August 1, 2007, California's three large investor owned utilities (IOUs) collectively served about 13 percent of their 2006 retail electricity sales with renewable power. The alternative energy sources such as landfill gas to liquefied natural gas (LNG) and other emerging energy technologies under investigation in this Sector may contribute to the State’s RPS. Role of Small Business Landfill owners and operators are both private and public entities with the breakdown for active facilities of 2/3 public and 1/3 private entities. All landfill owners and operators do not qualify as a small business; therefore, this section does not apply to landfill operations. Compost operations are generally small with approximately twelve percent having a daily capacity over 500 tons per day. As of 2004, there were approximately 117 compost facilities and 85 other facilities (processors) with a total throughput of close to 10 million tons per year producing 3 million cubic yards per year of compost. The Recycling Market Development Zone program, managed by CIWMB, provides attractive loans, technical assistance, and free product marketing to businesses that use materials from the waste stream to manufacture their products and are located in California. Many of these are considered to be small businesses, and with an increase of feedstock availability, new small businesses may be created. Small businesses are also likely to develop from increased waste-to-energy production in this Sector. Businesses included in the Commercial Recycling measure are those with 100 or more employees, and are not considered small businesses; however, multi-family complexes may be owned by small business interests. There are approximately 24,000 businesses in the State with more than 100 employees (1.4 percent of all businesses). There are slightly more than 3 million multi-family complexes in the State with five or more units, and there are nearly 600,000 mobile home parks. Although all landfill owners and operators do not qualify as a small business, some Material Recovery Facilities (MRFs) may be considered small businesses.
Page 5 of 16 August 25, 2008
Recycling and Waste Management Sector Summary for Public Distribution
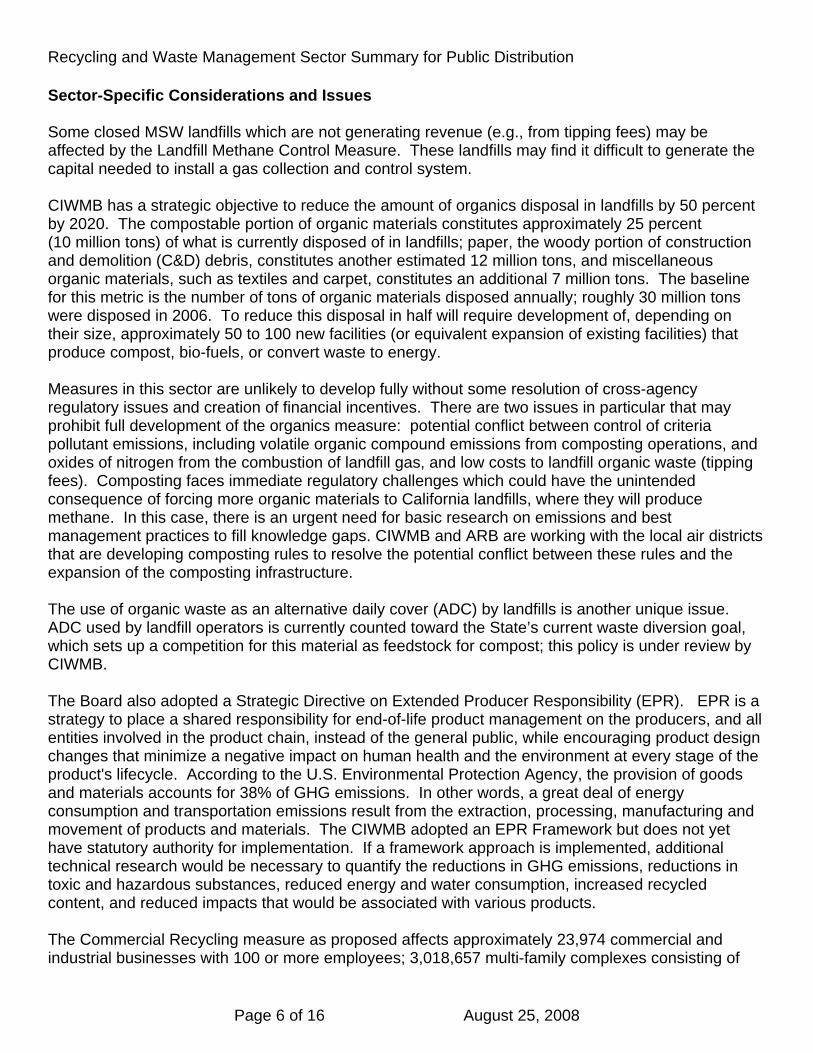
Sector-Specific Considerations and Issues Some closed MSW landfills which are not generating revenue (e.g., from tipping fees) may be affected by the Landfill Methane Control Measure. These landfills may find it difficult to generate the capital needed to install a gas collection and control system. CIWMB has a strategic objective to reduce the amount of organics disposal in landfills by 50 percent by 2020. The compostable portion of organic materials constitutes approximately 25 percent (10 million tons) of what is currently disposed of in landfills; paper, the woody portion of construction and demolition (C&D) debris, constitutes another estimated 12 million tons, and miscellaneous organic materials, such as textiles and carpet, constitutes an additional 7 million tons. The baseline for this metric is the number of tons of organic materials disposed annually; roughly 30 million tons were disposed in 2006. To reduce this disposal in half will require development of, depending on their size, approximately 50 to 100 new facilities (or equivalent expansion of existing facilities) that produce compost, bio-fuels, or convert waste to energy. Measures in this sector are unlikely to develop fully without some resolution of cross-agency regulatory issues and creation of financial incentives. There are two issues in particular that may prohibit full development of the organics measure: potential conflict between control of criteria pollutant emissions, including volatile organic compound emissions from composting operations, and oxides of nitrogen from the combustion of landfill gas, and low costs to landfill organic waste (tipping fees). Composting faces immediate regulatory challenges which could have the unintended consequence of forcing more organic materials to California landfills, where they will produce methane. In this case, there is an urgent need for basic research on emissions and best management practices to fill knowledge gaps. CIWMB and ARB are working with the local air districts that are developing composting rules to resolve the potential conflict between these rules and the expansion of the composting infrastructure. The use of organic waste as an alternative daily cover (ADC) by landfills is another unique issue. ADC used by landfill operators is currently counted toward the State’s current waste diversion goal, which sets up a competition for this material as feedstock for compost; this policy is under review by CIWMB. The Board also adopted a Strategic Directive on Extended Producer Responsibility (EPR). EPR is a strategy to place a shared responsibility for end-of-life product management on the producers, and all entities involved in the product chain, instead of the general public, while encouraging product design changes that minimize a negative impact on human health and the environment at every stage of the product's lifecycle. According to the U.S. Environmental Protection Agency, the provision of goods and materials accounts for 38% of GHG emissions. In other words, a great deal of energy consumption and transportation emissions result from the extraction, processing, manufacturing and movement of products and materials. The CIWMB adopted an EPR Framework but does not yet have statutory authority for implementation. If a framework approach is implemented, additional technical research would be necessary to quantify the reductions in GHG emissions, reductions in toxic and hazardous substances, reduced energy and water consumption, increased recycled content, and reduced impacts that would be associated with various products. The Commercial Recycling measure as proposed affects approximately 23,974 commercial and industrial businesses with 100 or more employees; 3,018,657 multi-family complexes consisting of
Page 6 of 16 August 25, 2008
Recycling and Waste Management Sector Summary for Public Distribution
more than five units; and 586,988 mobile home parks. The measure considers only those properties receiving collection service (no self-haul). Approximately 150 Material Recovery Facilities (MRF); customers who source separate recyclables and/or drop off recyclables; haulers or customers who deliver waste streams to MRFs for processing/recycling; and over 400 local jurisdictions responsible for implementing waste management programs throughout California local governments will also be affected. The Commercial Recycling measure is initially proposed with voluntary implementation approaches, and additional evaluations such as cost and cost savings studies need to be completed and model commercial recycling programs need to be developed for the business sector and local governments in order to fully implement the strategy and realize the GHG emission reductions. Another unique issue is the high cost of land in California and the availability of land for landfill operations, bio-energy, or composting. Citing these facilities is difficult and costly. SECTOR OVERVIEW Proposed Emissions Reduction Pathway GHG reductions will come from the following overarching strategies: minimize methane emissions from landfills; encourage source reduction and recycling; develop viable, sustainable markets to divert materials from landfills; and encourage innovations and technologies that provide for the most efficient and effective management and reuse of materials. Several measures are aimed at capturing fugitive emissions efficiently and, in some cases, converting the gases to alternative energy. These measures are: • Landfill Methane Control Measure (discrete early action); • Landfill Methane Capture Guidance Document; • Liquified Natural Gas from Landfill Gas; and • Waste Technology Demonstration, Assessment, and Development These measures have the potential to avoid the use of fossil-fuels in the production of electricity. They also may have the potential to reduce energy used in the manufacturing process. All of these measures, with the exception of the Landfill Methane Control Measure, involve voluntary emissions reductions that could result in potential tradable emissions credits. Incentives in this sector may result from the generation of the emissions credits, or they may be imposed through financial disincentives for landfilling material (e.g., increased tipping fees.) Other measures in this sector have the potential to reduce GHG emissions due to the avoidance of landfilling potentially reusable (fossil-carbon based materials) or compostable (organic) solid waste, these measures are: • Anaerobic Digestion; • Commercial Recycling; • Extended Producer Responsibility; • Expand Awareness of AB 1969; and • Increasing Production and Markets for Compost
Page 7 of 16 August 25, 2008

Recycling and Waste Management Sector Summary for Public Distribution
Anaerobic digestion may displace some existing energy sources with higher GHG emissions potential; commercial recycling can directly reduce GHG emissions by re-introducing recyclables with intrinsic energy value back into the manufacturing process, and indirectly by reducing the need for virgin materials extraction; Extended Producer Responsibility will shift the responsibility for the end-of-life management of discarded products and materials from local government to the manufacturers. Increasing the production and markets for compost will provide numerous positive benefits including methane avoidance at landfills and reduced water and chemical fertilizer inputs, both of which have significant GHG emission reduction potentials. In addition, processing organics/biomass materials into marketable products will also reduce the amount of material going to landfills, and therefore provide additional GHG emissions reductions in the form of methane avoidance at landfills. Potential for Leakage There is some potential for leakage if costs for disposal of MSW increase due to any of these measures. Some MSW is currently transported out of state and this could increase, thereby decreasing emissions reductions and potentially increasing GHG emissions from transportation of the MSW. The strategies in this sector could be designed to reduce this leakage by creating financial incentives for the preferred alternatives. Role of Local, State, and Federal Government ARB has authority to implement early action measures for AB 32 and is currently developing the Landfill Methane Control Measure with CIWMB assistance. With the exception of that control measure, all other measures rely initially on incentives or voluntary compliance. Landfills in the State are currently subject to numerous regulations including those adopted by U.S. EPA, ARB, local air districts, CIWMB, and regional water boards. Some local air districts have regulations affecting landfill operations that apply to fugitive dust, testing, monitoring, reporting, and emission control requirements. Compost operations are under the permitting authority of CIWMB and must also comply with local air district regulations and regional water board regulations. Composting operations have also recently been included in air district regulations to limit the precursors of ozone. South Coast Air Quality Management District Rule 1133.2 limits volatile organic compound emissions from co-composting facilities; Rule 1133.1 regulates chipping and grinding activities. San Joaquin Valley Unified Air Pollution Control District (APCD) is in the process of developing a rule to limit volatile organic compound emissions from all composting operations, including green waste, food waste, and chipping and grinding activities (Rule 4566). CIWMB also regulates the use of alternative daily cover for landfills. Overall gate fees for landfill disposal are determined by the landfill operator, but the State imposes an additional tipping fee of $1.40 per ton to support state programs and local operations. Any increase in the State’s tipping fee would require legislative action. Waste-to-energy processes are also subject to local air district regulations that would permit any significant new source of emissions. Because it is local jurisdictions that are required to meet the mandates of AB939, measures in this sector are likely to have an impact on the state’s local jurisdictions. It is unknown how these measures may impact individual local jurisdictions. It is not anticipated that any local or federal regulatory or legislative changes will be required for any of these measures.
Page 8 of 16 August 25, 2008
Recycling and Waste Management Sector Summary for Public Distribution
Summary of 2007/08 Legislation
Active Bills AB 2058 (Levine) would require large groceries and pharmacies that distribute free plastic bags to meet phased plastic bag diversion and reduction benchmarks. AB 822 (Levine) would increase residential recycling in 2.5 million multi-family dwelling units. AB 2640 (Huffman) would promote the highest and best use of organic materials in California. AB 2866 (DeLeon) would provide funds for grants and loans for organics management projects that will help divert 50% of compostable organics from land disposal by 2020. SB 1020 (Padilla) would require CIWMB to adopt policies, programs, and incentives to increase statewide waste diversion to 60 percent by December 21, 2012 and 75 percent by 2020. SB 1625 (Corbett) would expand California's Bottle and Can Recycling Law to include all plastic bottles. Chaptered SB 1021 (Padilla) was signed into law last year. The bill will use unclaimed bottle bill deposits to help fund multifamily recycling programs. This legislation extends multifamily recycling grants to 2008 and increases funding from $5 million to $15 million.
Public-Private Interface About 2/3 of the landfills affected by these measures are owned/operated by public entities. Municipal governments would be impacted by these measures as they have primary responsibility for disposal of MSW and also operate MRFs. Interaction with Other Sectors This sector overlaps with the Agricultural Sector and Land-Use Sector as it pertains to anaerobic digestion of animal waste. In addition, some of the beneficial offsets of these measures could be accrued by the agricultural sector with greater application of compost to reduce synthetic pesticides and fertilizers, and reduce water use. Other areas that would be affected are local governments, green building, and transportation sectors. Integration with Regional, National, or Global Programs Some of the measures in this sector seek to increase the production of alternative energy. These projects could participate in carbon emissions trading. Extended Producer Responsibility and increase recycling would impacts on regional, national, and international levels.
Page 9 of 16 August 25, 2008

Recycling and Waste Management Sector Summary for Public Distribution
Consideration of the Longer-Term Goal For 2050 All of these measures have the potential to reduce emissions further to help meet the 2050 target. EMISSIONS REDUCTION STRATEGY Emission Reduction Approach
1. Landfill Methane Control Measure (Discrete Early Action) On June 21, 2007, ARB adopted the Landfill Methane Capture Strategy as a discrete early action measure. This board action requires ARB to have an enforceable control measure in place by January 1, 2010. ARB staff is working in collaboration with CIWMB staff on the development of this measure. The landfill methane control measure will provide enhanced control of methane emissions from municipal solid waste landfills. The landfill methane control measure will require owners and operators to install gas collection and control systems at smaller and other uncontrolled landfills that are currently not required to install emission controls and to increase landfill methane capture efficiencies at existing landfills. The measure also establishes statewide standards for the gas collection and control system, including methane destruction efficiency requirements, and a more stringent landfill methane surface emission performance standard. Landfills installing a gas collection and control system would be required to submit a design plan that includes strategies to minimize methane emissions and maximize methane collection efficiencies. ARB estimates that fugitive emissions of methane from landfills represent about one to two percent of the statewide GHG inventory. In 1990, GHG emissions from municipal solid waste landfills were estimated to be about 6.26 MMTCO2E; in 2006 the GHG emission level dropped to 5.80. These emissions are forecasted to increase to approximately 7.64 MMTCO2E in 2020. ARB staff estimates that there are currently 53 landfills having 450,000 tons of waste-in-place or more that may generate sufficient gas to support the installation of gas collection and control systems, but this number is projected to increase to 60 such landfills by 2020. Based on the latest ARB 2020 forecast of landfill emissions, the overall estimated emission reductions for the control measure are approximately 1.0 MMTCO2E. Preliminary costs estimates to implement controls at an active landfill are estimated to be about $70 per ton of CO2 reduced; costs for a closed landfill are estimated to be about $52 per ton. Note: Emission and cost estimates are subject to change as the data is further refined.
2. Landfill Methane Capture Guidance Document A Landfill Methane Capture Guidance Document will be developed for use by MSW landfill owners and operators to maximize GHG emissions reductions; it is intended to complement the Landfill Methane Control Measure. Landfill design, construction, operation, and closure/post-closure practices may positively affect the ability and efficiency of reducing landfill GHG emissions. This measure is not regulatory but will be a technical resource for
Page 10 of 16 August 25, 2008
Recycling and Waste Management Sector Summary for Public Distribution
rulemaking. The final report on this measure was presented at the CIWMB’s April 2008 public hearing. 3. Liquefied Natural Gas (LNG) from Landfill Gas This measure implements grant-funded projects at two landfills to demonstrate commercial-scale technologies for converting landfill gas to LNG vehicle fuel. Recovery of landfill methane that is combusted through flaring can be captured as a biomass renewable energy source. Executive Order S-06-06 directs State agencies participating in the Bio-energy Interagency Working Group to enhance the sustainable management and development of biomass resources for electricity generation and production of alternative fuels (bio-fuels). CIWMB and the Biomass Collaborative estimate potential for in-state production of bio-fuels such as LNG from landfill gas; however, substantial financial and technical barriers exist. CIWMB and ARB approved matching grant funds for two commercial scale demonstration projects in 2007: The Gas Technology Institute (GTI) project at the Altamont Landfill and Resource Recovery Facility in Alameda County, and the Prometheus Energy Company (PEC) demonstration project at the F.R. Bowerman Landfill in Orange County. The GTI project will provide 13,000 gallons per day of LNG fuel for their facility refuse collection fleet and the PEC project would provide 18,600 gallons per day of LNG fuel to the local municipal bus fleet. The total 11.5 million gallons per year of LNG from these projects are expected to reduce GHG emission by 0.08 MMTCO2E per year through displaced diesel fuel combustion. The technology transfer from these projects, which are expected to conclude in June 2009, could reasonably lead to the offset of up to 90 million gallons of diesel fuel per year in California, resulting in a reduction of approximately 1.0 MMTCO2E annually.
4. Waste Technology Demonstration, Assessment, and Development This measure would provide funding for the development of commercial-scale waste-to-energy projects that have the potential to reduce GHG emissions. Funding would be provided by CIWMB, CEC, ARB, and PUC. A current program at PUC would provide San Diego Gas & Electric and Pacific Gas and Electric with $45 million over two years to demonstrate commercialization of promising emerging renewable technologies or renewable-enabling technologies. 5. Expanded Awareness of Assembly Bill 1969 This is an outreach measure by PUC and CIWMB to expand awareness of the inclusion of other renewable energy projects in addition to water-to-energy and wastewater-to-energy projects in the State’s Renewable Portfolio Standard (RPS). Through a CPUC decision implementing AB 1969, electrical corporations are required to purchase, at a CPUC approved price, renewable energy output from public water and wastewater facility projects with an effective capacity of not more than 1.5 megawatts (MW), up to a total program capacity of 250 MW. In that decision, the CPUC expanded the scope of AB 1969 to include an additional 230 MW from all other Renewable Portfolio Standard (RPS) eligible resources for projects up to 1 MW of effective capacity. Outreach will be conducted by mail and Internet and to the marketing offices of affected utilities. These sources will replace non-renewable energy sources.
Page 11 of 16 August 25, 2008

Recycling and Waste Management Sector Summary for Public Distribution
6. Anaerobic Digestion
Anaerobic digestion (AD) is a biological process typically employed in waste water treatment facilities for sludge degradation and stabilization but it is also the principal process of decomposition occurring in landfills. This measure seeks to increase the alternative fuel generation through the process of anaerobic digestion. Ten AD facilities have been built at California dairies since 2001 as part of the CEC’s Dairy Power Production Program, and an additional nine were funded in 2006. AD is currently defined in CIWMB regulations, the technology is widely recognized and accepted, and data on emissions, energy, and costs are readily available. Annual CO2 emissions reductions are estimated to be 0.21 MMTCO2E in 2010; increasing to 2.2 MMTCO2E by 2020. 7. Commercial Recycling Traditional recyclable materials have significant intrinsic energy value that could displace fossil fuel energy requirements when introduced back into the manufacturing cycle. The commercial sector generates over half of the solid waste in California but is not subject to AB 939 diversion requirements. The commercial recycling measure focuses initially on voluntary compliance and incentives to increase commercial waste diversion, increase recycling opportunities, and enhance market development to utilize the feed stocks from commercial recycling. Initial voluntary measures would protect the potential opportunity of local jurisdictions to seek carbon trading offsets in the event that recycling protocols are developed. Carbon trading offsets would provide essential economic incentives for local government, whereas mandated implementation approaches, such as regulations, would disqualify local jurisdictions from seeking carbon trading offsets. Primary recyclable materials available from business with 100 or more employees, combined with recyclable waste from medium to large multi-family housing complexes and mobile home parks, totaled over 5.5 million tons in 2006. If the State were to divert half of the waste in just this portion of the commercial sector each year, it would realize significant GHG reductions, estimated at 5.5 MMTCO2E for the year 2020. 8. Extended Producer Responsibility Extended producer responsibility (EPR) is a strategy to place a shared responsibility for end-of-life product management on the manufacturers and all entities involved in the product chain, rather than the general public. EPR will encourage product design which results in source reduction, and increased feasibility of reuse and recycling in an economical manner. This strategy would allow the costs of treatment and disposal to be incorporated into the total cost of a product. A related strategy – Environmentally Preferable Purchasing (EPP) – would advance the purchase of environmentally preferable products that would help increase the demand for products that have reduced GHG emissions, along with other beneficial environmental attributes such as reduced energy and water consumption, reduced toxicity, and increased recycled content and durability.
Page 12 of 16 August 25, 2008
Recycling and Waste Management Sector Summary for Public Distribution
A broad range of GHG emissions reductions could result with widespread adoption of these policies. Estimation of these reductions is not possible at this time, but would likely come from saving fossil-fuel in extraction of virgin materials, manufacturing, and transportation. Additional reductions could be realized through reductions in fuel use during MSW operations and landfill methane avoidance after disposal. 9. Increased Production and Markets for Compost Approximately 30 million tons per year of organic materials are disposed in California landfills, with compostable organic materials comprising approximately 10 million tons. CIWMB Strategic Directive 6.1 calls for a reduction in the amount of organics in the waste stream by 50 percent in 2020. Diversion of this material from landfills can provide a significant reduction of GHG emissions through landfill methane avoidance and other beneficial offsets. The amount of methane that may be avoided when food waste, green waste, and branches are diverted from a landfill is still under evaluation by ARB’s Planning and Technical Support Division; however, with a reduction of 50% in the amount of organics disposed by 2020, preliminary estimates of GHG reductions are approximately 3.1 MMTCO2E based on US EPA’s Waste Reduction Model (WARM) calculations. In addition, compost use has the potential to sequester carbon, reduce reliance on synthetic fertilizers, and reduce water use, all of which could be considered potential offset credits. These estimates do not account for any carbon sequestration that could occur in a landfill.
Ensuring Real, Permanent, Quantifiable, Verifiable, and Enforceable Reductions
In order to fully realize the reductions possible from these measures, and any potential permanent, quantifiable, and verifiable emissions GHG emissions, additional research must be conducted to complete the emissions inventories. Additional research will need to be conducted to understand the market forces that affect these operations and the resulting economic conditions. Development of BMPs for landfill gas capture and composting will help to define the potential reductions and provide a basis for verification and/or enforcement.
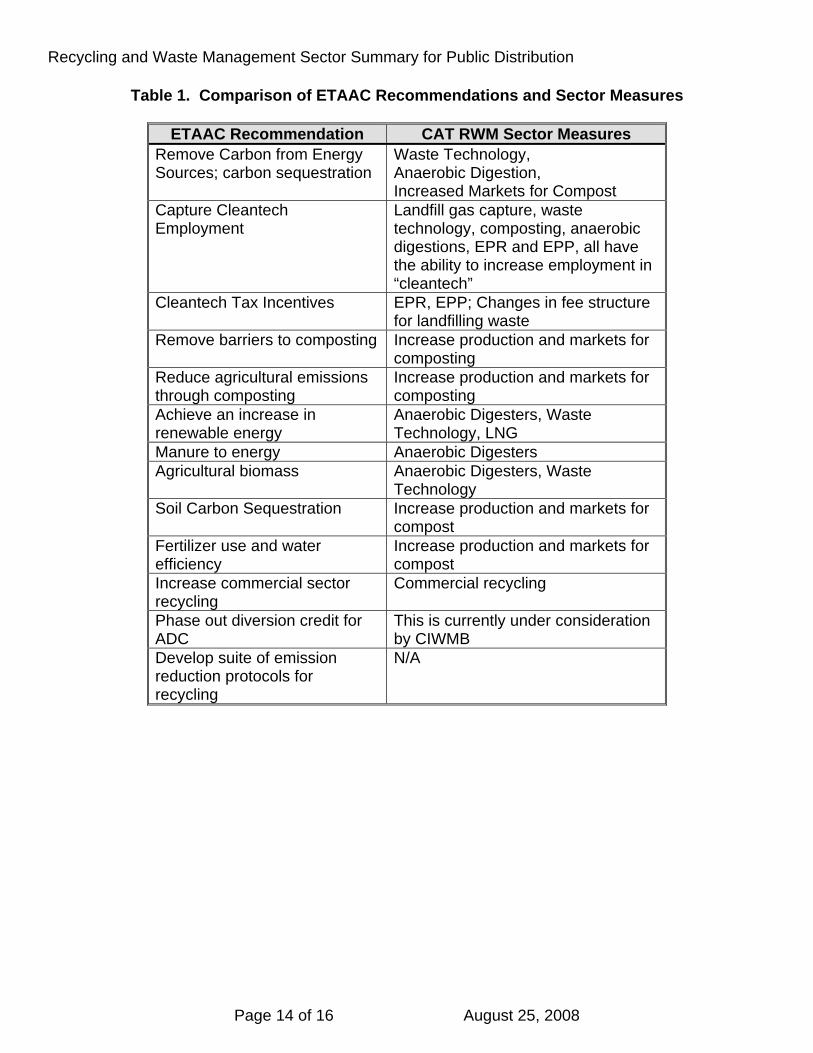
Public Solicitation Measures The AB 32 Environmental Justice Advisory Committee submitted an early action measure that would require enclosure of compost facilities (similar to the South Coast rule on co-composting operations); however, this was not considered a feasible GHG reduction measure. The Economic and Technology Advisory Committee (ETAAC) Final Report identifies many of the same recommendations included in this sector. Table 1 links the recommendations in the ETAAC report with the measures described in this sector.
Page 13 of 16 August 25, 2008
Recycling and Waste Management Sector Summary for Public Distribution
Table 1. Comparison of ETAAC Recommendations and Sector Measures
ETAAC Recommendation CAT RWM Sector Measures Remove Carbon from Energy Sources; carbon sequestration
Waste Technology, Anaerobic Digestion, Increased Markets for Compost
Capture Cleantech Employment
Landfill gas capture, waste technology, composting, anaerobic digestions, EPR and EPP, all have the ability to increase employment in “cleantech”
Cleantech Tax Incentives EPR, EPP; Changes in fee structure for landfilling waste
Remove barriers to composting Increase production and markets for composting
Reduce agricultural emissions through composting
Increase production and markets for composting
Achieve an increase in renewable energy
Anaerobic Digesters, Waste Technology, LNG
Manure to energy Anaerobic Digesters Agricultural biomass Anaerobic Digesters, Waste
Technology Soil Carbon Sequestration Increase production and markets for
compost Fertilizer use and water efficiency
Increase production and markets for compost
Increase commercial sector recycling
Commercial recycling
Phase out diversion credit for ADC
This is currently under consideration by CIWMB
Develop suite of emission reduction protocols for recycling
N/A
Page 14 of 16 August 25, 2008

Recycling and Waste Management Sector Summary for Public Distribution
Estimated Reductions from the Overall Sector Approach
Table 2. Summary of Estimated Reductions1
Estimate of Annual
Reductions with Full
Implementation (MMTCO2E)
Feasible Reductions for
2020 (MMTCO2E)
Anaerobic Digestion 0.21 2.2 Commercial recycling -- 5.5 EPR and EPP -- -- Compost Markets 1.4 3.1 BMPs for Landfill Gas Collection -- --
Landfill Methane Control Measure -- 1.0
LNG from LFG 0.08 1.0 Waste Technology -- -- Expanded Awareness of AB 1969 -- --
TOTAL 2.7 12.8 1. Some data not currently available.
Effects on Air Quality As previously discussed, there is a potential conflict between the goals of AB 32 and the need to control criteria air pollutants. Volatile organic compounds are precursors to ozone generation and are emitted during the aerobic decomposition of organic wastes (composting operations). South Coast AQMD has implemented rules for co-composting to limit these emissions and the San Joaquin Valley Unified APCD (SJVUAPCD) is considering a rule that would encompass all organic composting for the purpose of reducing these emissions. The new rules being considered by SJVUAPCD are considered by some stakeholders and CIWMB to be cost-prohibitive given the current economic climate for composters (low compost prices and competition with landfilling). SJVUAPCD is pursuing rules in order to address emission concerns within the district and meet their commitments under the State Implementation Plan (SIP). SJVUAPCD believes composting operations are a significant source of these emissions. Other air districts are considering similar rules. If this supposition holds, some compost operations may limit their production, cease operating, or fail to initiate operations, thereby infringing on the 50 percent waste diversion goal by 2020. This may impact the State’s ability to reduce methane emissions from landfills. In addition, the Class II mitigation measures proposed by SJVUAPCD could result in higher GHG emissions due to increased use of fossil fuel use in turning the compost or otherwise processing during production, or, measures such as aerated static pile, may increase overall energy use.
Page 15 of 16 August 25, 2008
Recycling and Waste Management Sector Summary for Public Distribution
Page 16 of 16 August 25, 2008
Increased flaring, or other combustion of landfill methane may also increase the emissions of NOx, which also contributes to ozone formation. Several local air districts are in non-attainment or severe non-attainment status for exceeding federal ozone air quality standards and have established NOx limits which have impeded the expansion of landfill gas-to-energy projects in California. Environmental Justice The landfill methane control measure is not expected to have environmental justice impacts because these facilities are often located in remote rural areas; increasing waste-to-energy production at these facilities will also not likely result in environmental justice impacts. LNG processes at landfills would also not likely impact environmental justice communities. Anaerobic digestion is typically done in enclosed vessel systems that, when operated properly, should limit emissions and foul odors endemic in this process; however, the collection and consolidation of these wastes could impact communities through traditional fossil fuel emissions or odors not controlled during collection and consolidation. Similarly, compost operations have the potential for some environmental justice impact. If these operations are conducted at landfill sites these could be mitigated. If the increased diversion rate results in a demand for new facilities, siting of these facilities may be difficult for reasons similar to anaerobic digestion, especially if dust and odor issues are not well-managed. CIWMB is currently conducting a composting operations and BMP survey to be completed later this year. Commercial recycling operations would expand under the measure described here. Most of the facilities expansions that would result from the measures described here would require a California Environmental Quality Act (CEQA) analysis where extensive public input is possible. SUMMARY AND CONCLUSIONS The measures included in this sector have great potential to reduce GHG emissions in the State. There are considerable barriers to implementation of some of the measures and more analysis is needed to fully understand their potential impact in reducing emissions. Currently, only the landfill methane control measure is a direct regulation strategy. A variety of implementation approaches may be needed to achieve the other measures. While some measures, such as the commercial recycling measure, may be achieved initially through a voluntary implementation approach, it may require mandatory recycling if voluntary measures prove ineffective or if a higher level of GHG emission reductions are desired. Voluntary measures would protect the potential opportunity to seek carbon trading offsets in the event that protocols are developed. Carbon trading offsets would provide essential economic incentives, whereas mandated implementation approaches, such as regulations, would realize more immediate results but disqualify projects from seeking carbon trading offsets. A hybrid or phased-in approach might also be effective with mandates needed to achieve GHG emission reductions up to a certain target, then followed by voluntary implementation above the target which would allow for carbon trading offsets to provide economic incentives. Additional analysis may be needed to understand the market forces needed to drive some of these new technologies or to promote markets (e.g., recyclables and compost). All of the voluntary measures in this sector have the potential to be developed as quantifiable, verifiable, and reliable emissions offsets.

DRAFT July 16, 2008 DRAFT
Climate Action Team Sector Sub Group
Scoping Plan Measure Development and Cost Analysis The purpose of this document is to provide the public with information about options considered and analyzed by the Climate Action Team (CAT) Sector Sub Groups for Air Board’s consideration and potential inclusion in the Scoping Plan. This information should be drawn from the Measure Analyses previously developed by each Sub Group. Information should only be updated to reflect significant changes in technology, staff assignments, and understanding of the issues.
Outline 1. Measure: Anaerobic Digestion .......................................................................................... 1 2. Agency: California Integrated Waste Management Board ; Contact: Ronald Lew ........... 1 3. Measure Description ......................................................................................................... 1
Related Objectives ......................................................................................................... 4 4. Technology: ....................................................................................................................... 6 5. Statutory Status ................................................................................................................. 7 6. Implementation Steps and Timeline .................................................................................. 7 7. Greenhouse Gas Emission Reductions ............................................................................ 7 8. Costs and Cost Savings ....................................................................................................... 8 9. Other Benefits ....................................................................................................................... 9 10. References .......................................................................................................................... 9

DRAFT July 16, 2008 DRAFT
[Page intentionally blank]

Measure Analysis for Public Distribution July 16, 2008 DRAFT Version 2.1
Air Resources Board Scoping Plan Measure Development and Cost Analysis
Template The purpose of this document is to provide the public with information about options considered and analyzed by the Climate Action Team (CAT) Sector Sub Groups for Air Board’s consideration and potential inclusion in the Scoping Plan. This information should be drawn from the Measure Analyses previously developed by each Sub Group. Information should only be updated to reflect significant changes in technology, staff assignments, and understanding of the issues.
1. Measure: Anaerobic Digestion
2. Agency: California Integrated Waste Management Board
3. Measure Description California disposes an estimated 42 million tons of waste in landfills each year. This waste stream consists of approximately 30 percent compostable organic materials, 22 percent construction and demolition debris, and 21 percent paper. Approximately 73 percent of California’s waste stream thus consists of carbon-based organics that could be diverted from the landfill to help achieve the greenhouse gas (GHG) reduction goals established by the Global Warming Solutions Act of 2006, AB 32 (Nunez). The largest anthropogenic source of methane emissions is from landfills which accounted for 5.62 MMTCO2E in 2004 as estimated in the California Air Resources Board 2007 GHG Inventory. Landfills generate gas by anaerobic decomposition of organic waste with typical methane content between 40-55%. Although 90% of the waste disposed of in California goes to landfills with landfill gas control technologies, diverting organic waste from landfills to beneficial use can provide significant reduction of climate change emissions through landfill methane avoidance and beneficial offsets such as alternative energy production. Organic materials from the waste stream can be a resource utilized as feedstock for conversion technologies (CT) to displace fuel or energy derived from fossil fuels in a sustainable manner. CT technologies are well-known and exist in numerous locations outside California. There are a few research or pilot CT projects in California including several projects funded by the CIWMB that use anaerobic digestion technology. CIWMB is currently exploring funding a thermochemical gasification project that is being overseen by UC Davis and includes UC San Diego, UC Berkeley and West Biofuels LLC as project partners to create energy and alcohol fuels from recycling residuals that would otherwise be destined for the landfill. CT technologies include thermal and biochemical processes ranging from pyrolysis, gasification, hydrolysis, anaerobic digestion and others. Each type of CT technology has its own advantages and disadvantages and preferred type of organic feedstock. CT technologies have yet to be broadly commercialized in California and the cross media issues need to be evaluated, especially with respect to air, water, and land emissions. Environmental justice issues may also need to be addressed when locating and permitting new facilities. For this template all projected CT facilities will be anaerobic digestion facilities. Currently, anaerobic digestion is already defined in the CIWMB regulations, there are some small-scale
1
Measure Analysis for Public Distribution July 16, 2008 DRAFT Version 2.1
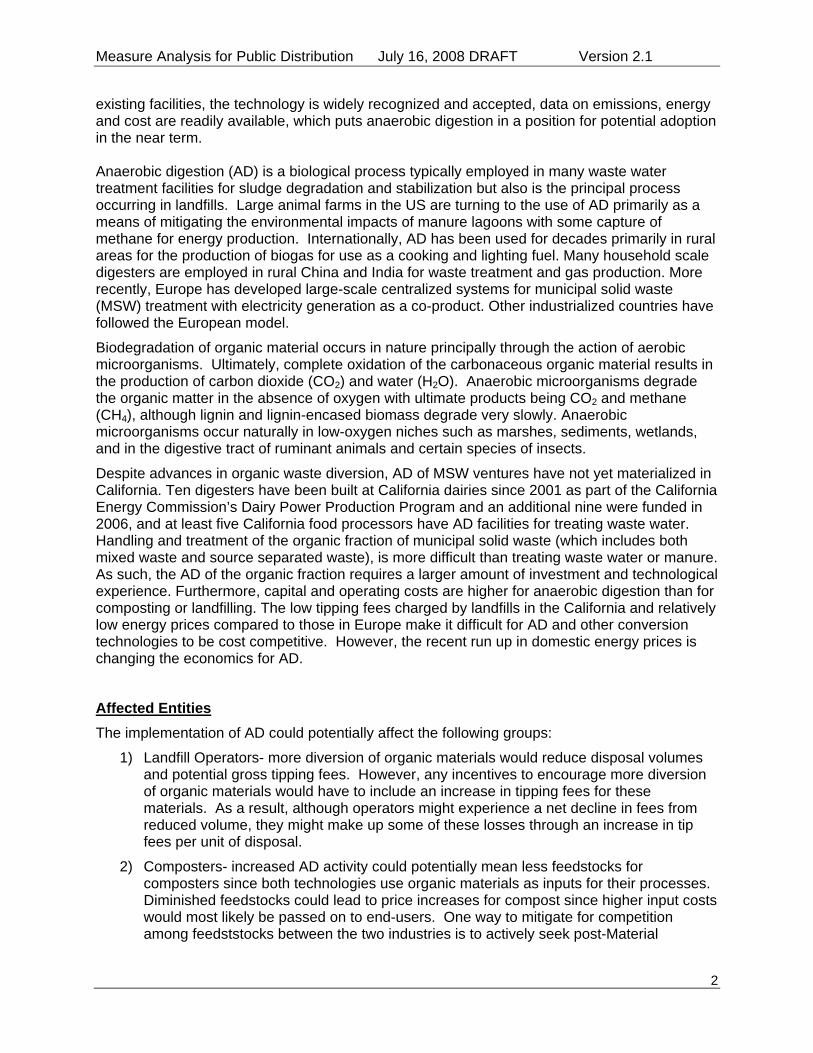
existing facilities, the technology is widely recognized and accepted, data on emissions, energy and cost are readily available, which puts anaerobic digestion in a position for potential adoption in the near term. Anaerobic digestion (AD) is a biological process typically employed in many waste water treatment facilities for sludge degradation and stabilization but also is the principal process occurring in landfills. Large animal farms in the US are turning to the use of AD primarily as a means of mitigating the environmental impacts of manure lagoons with some capture of methane for energy production. Internationally, AD has been used for decades primarily in rural areas for the production of biogas for use as a cooking and lighting fuel. Many household scale digesters are employed in rural China and India for waste treatment and gas production. More recently, Europe has developed large-scale centralized systems for municipal solid waste (MSW) treatment with electricity generation as a co-product. Other industrialized countries have followed the European model.
Biodegradation of organic material occurs in nature principally through the action of aerobic microorganisms. Ultimately, complete oxidation of the carbonaceous organic material results in the production of carbon dioxide (CO2) and water (H2O). Anaerobic microorganisms degrade the organic matter in the absence of oxygen with ultimate products being CO2 and methane (CH4), although lignin and lignin-encased biomass degrade very slowly. Anaerobic microorganisms occur naturally in low-oxygen niches such as marshes, sediments, wetlands, and in the digestive tract of ruminant animals and certain species of insects.
Despite advances in organic waste diversion, AD of MSW ventures have not yet materialized in California. Ten digesters have been built at California dairies since 2001 as part of the California Energy Commission’s Dairy Power Production Program and an additional nine were funded in 2006, and at least five California food processors have AD facilities for treating waste water. Handling and treatment of the organic fraction of municipal solid waste (which includes both mixed waste and source separated waste), is more difficult than treating waste water or manure. As such, the AD of the organic fraction requires a larger amount of investment and technological experience. Furthermore, capital and operating costs are higher for anaerobic digestion than for composting or landfilling. The low tipping fees charged by landfills in the California and relatively low energy prices compared to those in Europe make it difficult for AD and other conversion technologies to be cost competitive. However, the recent run up in domestic energy prices is changing the economics for AD.
Affected Entities The implementation of AD could potentially affect the following groups:
1) Landfill Operators- more diversion of organic materials would reduce disposal volumes and potential gross tipping fees. However, any incentives to encourage more diversion of organic materials would have to include an increase in tipping fees for these materials. As a result, although operators might experience a net decline in fees from reduced volume, they might make up some of these losses through an increase in tip fees per unit of disposal.
2) Composters- increased AD activity could potentially mean less feedstocks for composters since both technologies use organic materials as inputs for their processes. Diminished feedstocks could lead to price increases for compost since higher input costs would most likely be passed on to end-users. One way to mitigate for competition among feedststocks between the two industries is to actively seek post-Material
2
Measure Analysis for Public Distribution July 16, 2008 DRAFT Version 2.1
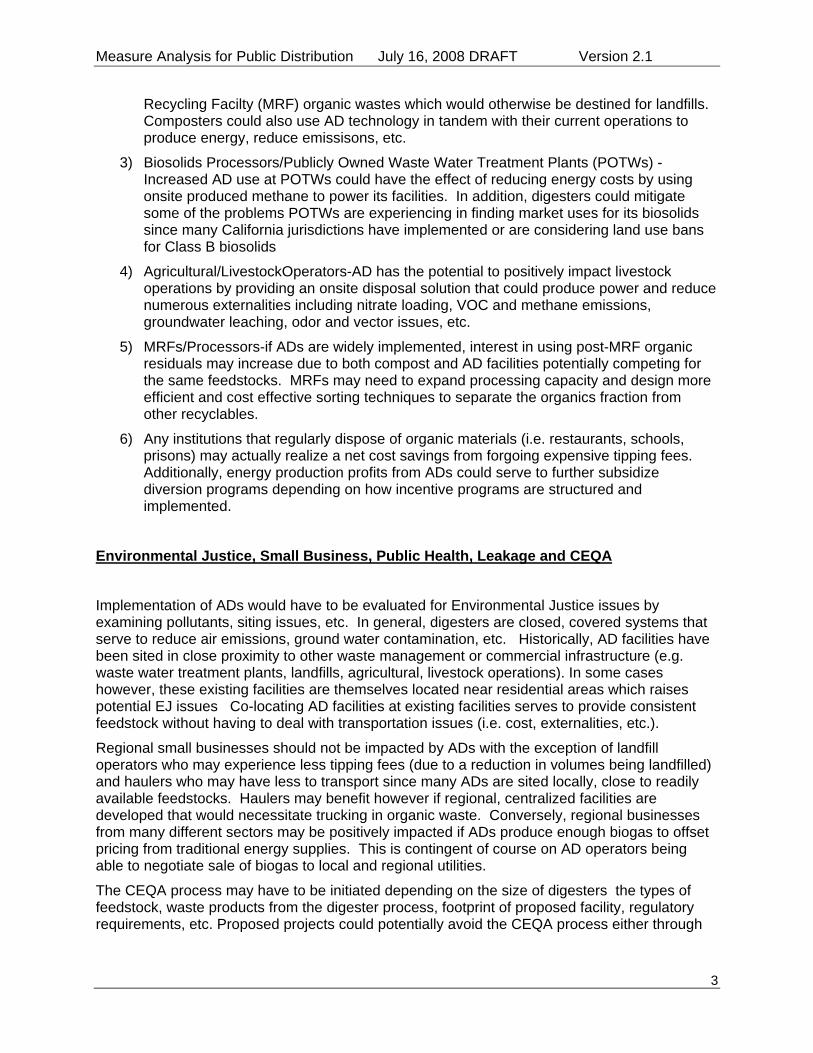
Recycling Facilty (MRF) organic wastes which would otherwise be destined for landfills. Composters could also use AD technology in tandem with their current operations to produce energy, reduce emissisons, etc.
3) Biosolids Processors/Publicly Owned Waste Water Treatment Plants (POTWs) -Increased AD use at POTWs could have the effect of reducing energy costs by using onsite produced methane to power its facilities. In addition, digesters could mitigate some of the problems POTWs are experiencing in finding market uses for its biosolids since many California jurisdictions have implemented or are considering land use bans for Class B biosolids
4) Agricultural/LivestockOperators-AD has the potential to positively impact livestock operations by providing an onsite disposal solution that could produce power and reduce numerous externalities including nitrate loading, VOC and methane emissions, groundwater leaching, odor and vector issues, etc.
5) MRFs/Processors-if ADs are widely implemented, interest in using post-MRF organic residuals may increase due to both compost and AD facilities potentially competing for the same feedstocks. MRFs may need to expand processing capacity and design more efficient and cost effective sorting techniques to separate the organics fraction from other recyclables.
6) Any institutions that regularly dispose of organic materials (i.e. restaurants, schools, prisons) may actually realize a net cost savings from forgoing expensive tipping fees. Additionally, energy production profits from ADs could serve to further subsidize diversion programs depending on how incentive programs are structured and implemented.
Environmental Justice, Small Business, Public Health, Leakage and CEQA Implementation of ADs would have to be evaluated for Environmental Justice issues by examining pollutants, siting issues, etc. In general, digesters are closed, covered systems that serve to reduce air emissions, ground water contamination, etc. Historically, AD facilities have been sited in close proximity to other waste management or commercial infrastructure (e.g. waste water treatment plants, landfills, agricultural, livestock operations). In some cases however, these existing facilities are themselves located near residential areas which raises potential EJ issues Co-locating AD facilities at existing facilities serves to provide consistent feedstock without having to deal with transportation issues (i.e. cost, externalities, etc.).
Regional small businesses should not be impacted by ADs with the exception of landfill operators who may experience less tipping fees (due to a reduction in volumes being landfilled) and haulers who may have less to transport since many ADs are sited locally, close to readily available feedstocks. Haulers may benefit however if regional, centralized facilities are developed that would necessitate trucking in organic waste. Conversely, regional businesses from many different sectors may be positively impacted if ADs produce enough biogas to offset pricing from traditional energy supplies. This is contingent of course on AD operators being able to negotiate sale of biogas to local and regional utilities.
The CEQA process may have to be initiated depending on the size of digesters the types of feedstock, waste products from the digester process, footprint of proposed facility, regulatory requirements, etc. Proposed projects could potentially avoid the CEQA process either through
3

Measure Analysis for Public Distribution July 16, 2008 DRAFT Version 2.1
an initial study and a finding of Negative Declaration or if the environmental impacts have been considered through either a facility permit or local zoning processes.
Related Objectives
Anaerobic Digestion by definition involves using an enclosed, covered system for accelerating decomposition of organic materials for the dual purposes of biogas production and waste volume reduction. Because the system is closed and emissions are captured to create various energy products, the use of AD technology by default creates a net decrease in GHG emissions by reducing the amount of methane produced and released in conventional landfills. In addition, most closed systems also obviate other potential environmental problems including leaching, groundwater contamination, nutrient loading and runoff, vector and odor problems, etc. Additionally, a byproduct from the digester process, digestate, can be used as a feedstock for composting.
Measure Metrics The CIWMB is conducting a Life Cycle Assessment (LCA) of organics diversion alternatives, including AD, in support of AB 32. The objectives of this project are to quantify GHG emission reductions from implementation of organic diversion alternatives and to perform an economic analysis to determine the associated costs and cost savings of the selected organic diversion alternatives on a regional and statewide basis. When completed in Spring of 2009 this LCA will result in a California-specific, peer-reviewed, GHG tool which could be used to prioritize organic diversion alternatives for maximum GHG reductions in a cost-effective manner on a regional and statewide basis. Pending completion of the LCA, CIWMB has based it’s GHG emissions reductions on the NERC and WARM calculators.
A number of additional metrics could be used to gauge the progress of AD implementation throughout the state including:
• The change the number of AD facilities from year to year and the corresponding capacity volume of those facilities.
• Tracking the industries that are using ADs and whether those facilities are localized or centralized.
• Tracking the volume of organic feedstock throughput through the digesters and comparing it to disposal and diversion OFMSW numbers from landfills.
• Tracking energy production from ADs and assigning market value to those products based on spot energy prices for a given year. Track how that energy is being used and whether it is being sold and used in traditional energy markets or is being used on site to power existing operations.
• Estimate GHG reductions using GHG Tool when completed in spring of 2009.
4
Measure Analysis for Public Distribution July 16, 2008 DRAFT Version 2.1
Measure Goals and Potential Implementation Approaches Regulatory:
To facilitate AD becoming a viable waste treatment option in California, regulatory agencies could establish a streamlined permitting process specific to AD. As a process that combines solid and liquid waste treatment with energy production, AD could require different permits in different situations or even multiple permits. The additional time and cost of figuring out which permits are required and acquiring multiple permits could prohibit the launch of AD of MSW. One way to resolve this issue is to designate an AD permit specific to MSW digestion similar to permit streamlining effort underway by Cal EPA for Dairy Digesters.
Energy Market penetration:
The largest MSW digesters produce several MW of electricity, which is typically much more than the AD facility needs. In order to be financially viable, digester operators need access to electricity markets and reasonable prices. California has had difficulty encouraging grid operators to upgrade the grid to allow renewable energy producers to connect, and in many cases the prices offered are too low to make the project financially feasible. Furthermore, federal tax credits for renewable electricity are being phased out. Providing financial incentives is probably the most effective method of encouraging the development of AD.
Tipping fees:
AD of the organic fraction of MSW should be supported through price structures to make AD cost competitive. Tipping fees in California are currently much lower than in other countries. As landfill space diminishes, tipping fees will naturally increase, but in the meantime price supports in the form of tipping or gate fees increases may be required to establish AD as an economically viable alternative to landfilling.
Carbon credits:
Digesters also reduce global warming by reducing release of methane from landfills and substituting clean energy for fossil derived electricity. Access to global carbon markets is currently available, but domestic carbon credits or green energy credits would be seen as more secure than the current global markets. A mature market for Carbon could result in carbon credits for AD systems making AD more cost competitive with disposal of organic waste materials in landfills.
Waste Management Programs:
State programs, such as the California Energy Commission’s Dairy Power Production Program (DPPP) have been very successful at promoting AD in the agricultural sector in California. Similar technical and price support programs could be used to help establish AD of MSW as a viable alternative to current organic waste disposal methods. These programs would provide local plant builders and operators with valuable resources that would help foster the AD industry in the US.
5

Measure Analysis for Public Distribution July 16, 2008 DRAFT Version 2.1
4. Technology:
Complex organic matter(carbohydrates, proteins, fats)
Soluble organic molecules(sugars, amino acids, fatty acids)
Acetic acid CO2, H2
CH4 , CO2
Volatile fatty acids
Hydrolysis
Acidogenesis (fermentation)
Acetogenesis
Methanogenesis (acetotrophic)
Methanogenesis (hydrogenotrophic)
The anaerobic digestion of organic material is accomplished by a consortium of microorganisms working synergistically. Digestion occurs in a four-step process: hydrolysis, acidogenesis, acetogenesis, and methanogenesis (see figure above). Large protein macromolecules, fats and carbohydrate polymers (such as cellulose and starch) are broken down through hydrolysis to amino acids, long-chain fatty acids, and sugars. These products are then fermented during acidogenesis to form three, four, and five-carbon volatile fatty acids, such as lactic, butyric, propionic, and valeric acid. In acetogenesis, bacteria consume these fermentation products and generate acetic acid, carbon dioxide, and hydrogen. Finally, methanogenic organisms consume the acetate, hydrogen, and some of the carbon dioxide to produce methane.
Anaerobic conditions (absence of oxygen) are required for digestion to occur. Thus, for AD to work successfully, reactors that are used must be well sealed, which helps eliminate gaseous emissions. In addition to methane and carbon dioxide, hydrogen sulfide and ammonia are produced albeit in much smaller amounts (<1% by volume). The production of these trace gases in the biogas depends on the sulfur and nitrogen contents of the feedstock. However, these elements are also nutrients required by the bacteria, so they cannot be eliminated completely. In fact, anaerobic digestion requires attention to the nutritional needs of the bacteria degrading the waste substrates. The most important nutrients for bacteria are carbon and nitrogen, but these two elements must be provided in the proper ratio otherwise ammonia can build up to levels that can inhibit the microorganisms. The appropriate carbon/nitrogen (C/N) ratio depends on the digestibility of the carbon and nitrogen sources; therefore the appropriate C/N ratio for organic MSW may be different from that for other feedstocks such as manure or wastewater sludge.
In general, the optimal conditions for anaerobic digestion of organic matter are near-neutral pH, constant temperature (thermophilic or mesophilic), and relatively consistent feeding rate. Imbalances among the different microorganisms can develop if conditions are not maintained near optimum. The most common result of imbalance is the buildup of organic acids which
6

Measure Analysis for Public Distribution July 16, 2008 DRAFT Version 2.1
suppresses the methanogenic organisms adding to further buildup of acidity. Acid buildup is usually controlled naturally by inherent chemical buffers and by the methanogens themselves as they consume acids to produce methane. These natural controls can breakdown if too much feed is added and organic acids are produced faster than they are consumed, if inhibitory compounds accumulate, or if the feed stream lacks pH buffers.
5. Statutory Status Several statutory changes that are needed to make AD feasible and widely implemented in California include:
1) Statutory changes may be required to require grid operators to upgrade the grid to allow renewable energy producers to connect.
2) Providing financial incentives is probably the most effective method of encouraging the development of AD. For example, state and federal tax credits for renewable electricity are being phased out and could be renewed or reintroduced.
3) The waste diversion benefit of AD of MSW could be realized through price supports in the form of tipping or gate fee increases. Such price supports could require statutory changes.
4) Access to global carbon markets is currently available, but domestic carbon credits or green energy credits would be seen as more secure than the current global markets. Such markets could also allow AD systems to be credited for local pollution reductions. Development of protocols to account for GHG reductions from AD projects and subsequent availability of carbon credits in a market system would benefit AD technology.
6. Implementation Steps and Timeline • Develop regulations package for AD of MSW.
• Establish policy on AD, regulatory authority, cross media issues, and environmental justice.
• Define “best practice” based on studies of diversion options, and markets.
• Promote “best practice” to communities.
• Provide financial incentive funded through gate fee on landfilling of AD feedstock.
7. Greenhouse Gas Emission Reductions There are several ways that greenhouse gas emissions reductions will be realized by the implementation of the diversion measures for AD.
• Avoided methane emissions at landfills (minus any greenhouse gas credits due to loss of carbon sequestration in the landfill and loss of energy savings from landfill gas recovery)
• Net energy produced (MMBtu) by AD technology (fossil fuel replacement)
7

Measure Analysis for Public Distribution July 16, 2008 DRAFT Version 2.1
Most of these forms of greenhouse gas emissions reductions are estimated using the environmental calculators such as the WARM model by USEPA and the NERC calculator by the Northeast Recycling Coalition. However, such models only provide rough estimates for the organic fraction of solid waste when it is recovered from landfills and processed in CT facilities. These models do not take into consideration the full life cycle assessment of beneficial offsets such as chemical fertilizer reductions, water savings, energy savings, and fossil fuel replacement. Additional more refined calculations will be available when the CIWMB completes the planned project to conduct a life cycle assessment study for organics.
For the CT measure, the tonnage and types of organics that are assumed to be recovered from the landfill are based on CT proposals currently being considered by the City of Los Angeles and the County of Los Angeles. The City of Los Angeles is considering CT options and has solicited input for projected tonnages, types, numbers, and sizes of CT facilities through the year 2025. For the purposes of this analysis, the tonnages, numbers, and sizes of CT facilities are assumed through 2020 based on the City of Los Angeles’ solicitation. There is significant uncertainty in this assumption because none of these facilities are currently slated to be built. In order to determine types of organic feedstocks and to calculate greenhouse gas emissions reductions, further assumptions were made that included assuming that all of the projected CT facilities would be anaerobic digesters. This assumption was made on the basis that anaerobic digestion is already defined in the CIWMB regulations, there are some small-scale existing facilities, the technology is widely recognized and accepted, data on emissions, energy and cost are readily available, which puts anaerobic digestion in a position for adoption in the near term. Greenhouse gas emissions reductions were estimated using the NERC calculator to determine avoided landfill emissions. Greenhouse gas emission reductions were cross-checked using data from the City of Los Angeles and County of Los Angeles reports. These reports indicated significantly higher emissions savings but the feedstocks used for these predictions were based on MSW that contains a substantial GHG benefit due to the recoverable portion of recyclables. Therefore, this analysis uses the lower NERC outputs that are estimated for the organic feedstock (does not include recyclables). The potential 2020 greenhouse gas reductions are estimated to be 2.2 MTCO2E.
8. Costs and Cost Savings
The economics are based on capital and O&M costs identified in a report prepared for the City of Los Angeles that includes information on the costs and cost savings for anaerobic digestion facilities (“Evaluation of Alternative Solid Waste Processing Technologies”). A linear relationship based on tonnage throughput was assumed to calculate the capital costs and O&M costs for the tonnage assumed in the AD measure. Note that these costs are likely upper bound estimates because the economics in the City of Los Angeles report are specific for smaller sized facilities that handle black bin waste or municipal solid waste. These types of feedstock would require additional front-end processing equipment to remove recyclables before sending the remaining organic wastes to the anaerobic digester. Therefore, the capital and O&M costs identified by the reports would likewise include additional expenses. However, the feedstock assumed for the AD measure is based on already separated organic materials that do not require the additional front-end equipment and processing. In addition, the linear relationship used to scale up facility throughput from the Los Angeles reports to the AD diversion measure would not consider economies of scale. Revenue from sale of recyclables is
8
Measure Analysis for Public Distribution July 16, 2008 DRAFT Version 2.1
not transferable between the two examples and is therefore not claimed in the cost savings for the AD measure.
The measure receives additional benefits from the production of electricity from the anaerobic digesters. The energy production is reported as kWh and is based on information from the City of Los Angeles report and is confirmed by data from the UC Davis Anaerobic Digestion Plant, a pilot scale facility that is currently operating in Davis, California. No assumptions were made for the lifetime of the capital investment.
The costs and cost savings for the measure are projected in a step-change function based on a projected construction and expansion schedule of six total anaerobic digesters. The assumptions of the construction and expansion schedule are included in the attached spreadsheet.
9. Other Benefits For this strategy, greenhouse gas emissions reductions are achieved by avoided methane emissions at landfills, replacement of fossil fuels with renewable biofuels, energy savings, and other beneficial offsets such as reduced water consumption and fertilizer and pesticide use that translate into greenhouse gas emissions reductions in a life cycle assessment. There are additional benefits that result from diverting waste from landfills, especially the organic portion of the waste stream, such as reduced leachate production at landfills, reduced potential impacts on groundwater, and reduced need for increased landfill capacity in California.
10. References “Current Technologies Used for the Anaerobic Digestion of Municipal Solid Waste”, 2007, UC Davis. “Use of U.S. Croplands for Biofuels Increases Greenhouse Gases Through Emissions from Land Use Change”, T.Searchinger, February 7, 2008, Science, “Economic and Technology Advancement Advisory Committee (EETAC) Final Report: Technologies and Policies to Consider for Reducing Greenhouse Gas Emissions in California”, February 11, 2008 “Second Assessment of California’s Compost- and Mulch-Producing Infrastructure”, May 2004, Integrated Waste Management Consulting. “Statewide Waste Characterization Study”, December 2004, Cascadia Consulting Group, Inc.
WARM Model: http://yosemite.epa.gov/oar/globalwarming.nsf/content/ActionsWasteWARMUsersGuide.html.
NERC Model: http://www.nerc.org/documents/aboutcalc.html.
9
Measure Analysis for Public Distribution July 16, 2008 DRAFT Version 2.1
10
“Life Cycle and Market Impact Assessment of Noncombustion and Waste Conversion Technologies”, December 2005, RTI International.
“Recovering Energy, Natural Resources, and Economic Benefit from Waste for LA, A Resource Management Blueprint for the City of Los Angeles, 2005 – 2025”, Los Angeles Councilman Greig Smith, June 2005.
“Conversion Technology Evaluation Report”, URS, August 18, 2005, Prepared for the County of Los Angeles Department of Public Works and the Los Angeles County Solid Waste Management Committee/Integrated Waste Management Task Force’s Alternative Technology Advisory Subcommittee.
“The Economic Impact of Waste Disposal and Diversion in California”, George Goldman and Aya Ogishi, University of California, Berkeley, April 4, 2001.
“California Recycling Economic Information Study”, prepared by the National Recycling Coalition for the USEPA in association with R.W. Beck, Inc., July 2001.
Landfill Tipping Fee Surveys: http://www.ciwmb.ca.gov/landfills/tipfees/TFSums.htm
“Evaluation of Alternative Solid Waste Processing Technologies”, URS Corporation, September 2005, Prepared for the City of Los Angeles Department of Public Works Bureau of Sanitation.
DRAFT July 16, 2008 DRAFT
Climate Action Team Sector Sub Group
Scoping Plan Measure Development and Cost Analysis The purpose of this document is to provide the public with information about options considered and analyzed by the Climate Action Team (CAT) Sector Sub Groups for Air Board’s consideration and potential inclusion in the Scoping Plan. This information should be drawn from the Measure Analyses previously developed by each Sub Group. Information should only be updated to reflect significant changes in technology, staff assignments, and understanding of the issues.
Outline 1. Measure: Commercial Recycling ..................................................................................... 1 2. Agency: California Integrated Waste Management Board (CIWMB) ............................... 1 3. Measure Description ......................................................................................................... 1
Overview ........................................................................................................................ 1 Affected Entities ............................................................................................................. 3 Related Objectives ......................................................................................................... 4 Measure Metrics ............................................................................................................. 4 Measure Goals and Implementation Approaches .......................................................... 4
Recycling and Solid Waste Management concepts with Institute for Local Government’s California Climate Action Network ............................................................................................ 5 4. Technology ........................................................................................................................ 6 5. Statutory Status ................................................................................................................. 6 6. Implementation Steps and Timeline .................................................................................. 7 7. Greenhouse Gas Emission Reductions ............................................................................ 7 8. Costs and Cost Savings .................................................................................................... 8 9. Other Benefits ................................................................................................................... 9 10. References ........................................................................................................................ 9
[Author] [Date] Page i
DRAFT July 16, 2008 DRAFT
[Author] [Date] Page ii
[Page intentionally blank]

Measure Analysis for Public Distribution July 16, 2008 DRAFT Version 2.1
Climate Action Team Sector Sub Group
Scoping Plan Measure Development and Cost Analysis The purpose of this document is to provide the public with information about options considered and analyzed by the Climate Action Team (CAT) Sector Sub Groups for Air Resources Board’s consideration and potential inclusion in the Scoping Plan. This information should be drawn from the Measure Analyses previously developed by each Sub Group and submitted to the California Air Resources Board.
1. Measure: Commercial Recycling
2. Agency: California Integrated Waste Management Board (CIWMB)
3. Measure Description Overview Reductions in greenhouse gas (GHG) emissions from solid waste management can be realized by recovering traditional recyclable materials from the waste stream to use in the manufacturing of products from these materials. Traditional recyclable materials have significant intrinsic energy value that displaces fossil fuel energy requirements when introduced back into the manufacturing cycle. In 2006, the amount of recyclable materials available from those businesses with 100 or more employees combined with multi-family complexes consisting of more than five units and mobile home parks (CS100>) totaled over 10 million tons. If the State of California targeted this group of businesses and multi-family complexes with a focus on cardboard, lumber, glass, plastic, paper and metals, estimated to be approximately 5.5 million tons per year and was able to divert half of these waste types (2.7 million tons), it would realize significant GHG emissions reductions, estimated herein to total over 5.5 million metric tons of carbon dioxide equivalents (MMTCO2e) in the year 2020. If the entire 5.5 million tons per year of cardboard, lumber, glass, plastic, paper, and metals for the selected portion of this sector were diverted, then roughly 11 MMTCO2e reductions would be realized. (Note: Depending on the scope of the Commercial Recycling measure, how widely it is implemented, and how many types of waste commodities are recycled, the magnitude of GHG emissions reductions could be even greater by even two to three times.) This measure initially focuses on using a voluntary implementation approach to increase commercial waste diversion. The entire commercial sector generates over half of the solid waste in California, but it is not subject to AB939 diversion requirements. This measure evaluates only the CS100> portion of the commercial sector. This limited portion of the commercial sector comprises nearly 30% of California’s total waste stream. This measure is focused on targeting the largest generators in the commercial sector because it is assumed that businesses and multifamily units of this size have the greatest opportunity to divert materials as they wouldn’t face the same space, cost, and staffing constraints that smaller businesses might face. Additionally, multi-family complexes with less than five units are typically included in residential recycling programs.
Commercial Recycling [July 16, 2008] Page 1

Measure Analysis for Public Distribution July 16, 2008 DRAFT Version 2.1
To achieve increased diversion of traditional recyclables from the commercial sector, a variety of implementation approaches may be needed. While commercial recycling may be achieved initially through a voluntary implementation approach, it may require mandatory recycling if voluntary measures prove ineffective or if a higher diversion percentage is desired. Voluntary measures would protect the potential opportunity of local jurisdictions to seek carbon trading offsets in the event that recycling protocols are developed. Carbon trading offsets would provide essential economic incentives for local government, whereas mandated implementation approaches, such as regulations, would realize more immediate results but disqualify local jurisdictions from seeking carbon trading offsets. A hybrid or phased-in approach might also be effective with mandatory recycling needed to achieve diversion of materials up to a certain target, then followed by voluntary implementation above the target which would allow for carbon trading offsets to provide economic incentives. In addition, increasing recycling opportunities would require enhanced market development to utilize the feed stocks from commercial recycling. Based on data from the 2004 Statewide Waste Characterization Study (adjusted for 2006), 5.5 million tons per year of cardboard, lumber, metals, paper, glass and plastic could be recovered from the CS100> waste stream and recycled back into respective products. Several assumptions have been made in using this data to project amounts currently in the waste stream: 1. In 2004, the CS100> sector contributed 54 percent of the commercial sector waste statewide. It is assumed that these percentages of the overall waste stream have not significantly changed through 2006. 2. The composition of waste disposed by the commercial and multifamily sectors has not significantly changed since the 2004 Statewide Waste Characterization Study. 3. The composition of the disposed waste stream for businesses with 100 or more employees is relatively homogeneous with the statewide overall commercial disposed waste stream. 4. The average amount of waste disposed per employee per year for businesses with 100 or more employees is not significantly different from the statewide average. 5. The commercial sector for this exercise is the same as defined in the 2004 Statewide Waste Characterization Study, and does not include the commercial self haul sector. 6. The multifamily sector for this exercise is the same as defined in the 2004 Statewide Waste Characterization Study, and includes complexes of 5 or more units & mobile home parks. Assumptions 1 and 2 are viewed as reasonable, based on the fact that population and business trends have not shifted drastically in the past few years. It is not known whether assumptions 3 and 4 are reasonable, and very little data exists to test these assumptions. Assumptions 5 and 6 were made in order to use existing data to make projections. Existing analyses have shown that significant reductions in GHG emissions would result from recycling versus landfilling of traditional recyclable materials. Based on the USEPA’s Waste Reduction Model (WARM), a one-percent increase in the national recycling rate would result in the reduction of six MMTCO2e. Calculations based on California’s waste stream indicate approximately one- MMTCO2e per percent increase in statewide diversion. If this commercial recycling measure were implemented, significant tonnages of cardboard, lumber, metals, paper, glass, and plastic could be recovered from the CS100> sector waste stream, which would result in over 5.5 MMTCO2E GHG emissions reductions by 2020. These GHG reductions would be felt along a broad sector of the economy from points of extraction, manufacturing, transportation and disposal. (Note: Depending on the scope of the Commercial Recycling measure, how
Commercial Recycling [July 16, 2008] Page 2

Measure Analysis for Public Distribution July 16, 2008 DRAFT Version 2.1
widely it is implemented, and how many types of waste commodities are recycled, the magnitude of GHG emissions reductions could be even greater by even two to three times.)
The implementation of this measure would increase the collection of recyclables through the expansion or establishment of commercial recycling programs. Under current law, there are no requirements for businesses or multi-family complexes to use recycling services, nor are these sectors required to report to CIWMB on their recycling efforts.
Because jurisdictions are uniquely positioned to facilitate commercial recycling, the potential to reduce GHGs in this sector is great. Currently, some local governments have commercial sector recycling requirements included in their general plans, zoning ordinances, business licenses or conditional use permits. Others have voluntary programs in place targeting the business sector.
The Commercial Recycling measure will target reductions by further increasing the recovery of traditional recyclable materials. This measure reduces GHG emissions primarily by reducing the vast energy use associated with the extraction or harvest of raw materials. As these raw materials are replaced with recyclables, a large reduction in fossil fuel energy consumption will be realized. The CIWMB has a long track record of working to combine recycling with economic development to fuel new businesses, expand existing ones, create jobs, and divert waste from landfills. CIWMB operates a Recycling Market Development Zone program that provides attractive loans, technical assistance, and free product marketing to businesses that use materials from the waste stream to manufacture their products and are located in California. Supporting the use of recycled materials in manufacturing processes within California is a key component of the commercial recycling measure. Additionally, in some cases, this measure will further reduce GHG emissions through reduced fossil fuel demands in transportation, the production of biofuels and bioenergy and avoided methane emissions at landfills.
Affected Entities This Commercial Recycling measure defines the commercial sector as only those commercial and industrial businesses with 100 or more employees and includes multi-family complexes consisting of more than five units and mobile home parks. The measure considers only those properties receiving collection service (no self-haul). Affected entities include: commercial businesses in the State, Material Recovery Facility (MRF) operators/owners, customers who source separate recyclables and/or drop off recyclables, haulers or customers who deliver waste streams to MRFs for processing/recycling, and local governments. There are approximately 150 MRF facilities, 23,974 commercial businesses with over 100 employees (1.9% of the total number of businesses in the State), 3,018,657 multi-family units and 586,988 mobile home units in California. There is no information on the total number of recyclers in the State and the total amount of materials they are processing. Over 500 local jurisdictions are responsible for implementing waste management programs throughout California.
Commercial Recycling [July 16, 2008] Page 3

Measure Analysis for Public Distribution July 16, 2008 DRAFT Version 2.1
Environmental Justice, Small Business, Public Health, Leakage, and CEQA Because the primary infrastructure for managing recyclable materials exists, there are no foreseeable environmental justice, public health or CEQA concerns. Exceptions might be if siting of new facilities or expanding facilities is necessary. Siting or expanding facilities requires extensive public input and CEQA. Because small businesses have fewer than 100 employees, there is no foreseeable impact to this sector. Public discussions of a potential commercial recycling measure for GHG emissions reductions took place at the May 2007 Strategic Policy Development Committee Meeting, at the December 2007 “Climate Change Workshop: CIWMB Early Action Measures meeting, and at the December 2007 Strategic Policy Development Committee Meeting: “Discussion of Climate Action Team Subgroup Activities” in Sacramento. Related Objectives The Commercial Recycling measure will achieve objectives other than the reduction of GHG emissions. Achieving 50 percent diversion of waste from landfills was motivated primarily by the mandate of AB 939 but has also resulted in significant GHG emissions reductions. However, this measure of Commercial Recycling moves beyond the 50 percent mandate and therefore is motivated primarily by its GHG emissions reductions. At the same time, there are multiple benefits that result from the diversion of additional waste from landfills. For this measure, GHG emissions reductions are achieved by recycling materials which reduce fossil fuel energy use and provide other beneficial offsets, and in some cases, avoided methane emissions at landfills.
Measure Metrics The primary proposed metric is tons of waste that will no longer be disposed due to recycling and source reduction by the commercial sector. The CIWMB tracks disposal statewide and this information will be used to assess if the disposal is being reduced by this measure, other measures, and other CIWMB activities. There is not a direct tracking mechanism to measure disposal or diversion from the commercial sector. However, the CIWMB does conduct periodic waste characterization studies and some of this data will be used to help measure the change in commercial disposal and diversion. Measure Goals and Implementation Approaches To implement a Commercial Recycling measure, there are several approaches that could be taken including state regulatory requirements, cap & trade (carbon offsets), teaching best management practices via technical assistance, developing and implementing local ordinances and instituting financial incentives. This measure is focused initially on voluntary implementation approaches, including technical assistance, model programs, and financial incentives. Because of the potential for carbon offsets the intent of this measure is to see if voluntary mechanisms will achieve the target. This measure assumes 50 percent successful diversion rate of cardboard, lumber, metals, paper, glass, and plastic from the CS100> sector using a combination of voluntary and regulatory practices at the local level. However, it is not known if this level of diversion can be achieved without a statewide commercial sector mandate. The
Commercial Recycling [July 16, 2008] Page 4
Measure Analysis for Public Distribution July 16, 2008 DRAFT Version 2.1
CIWMB would monitor the impacts of these efforts to determine if voluntary mechanisms achieve the proposed outcomes. This measure is based upon the following approaches:
1. Information and Technical Assistance Programs 2. Implementation of Recycling and Solid Waste Management concepts with the Institute
for Local Government’s California Climate Action Network 3. Financial Incentives for Jurisdictions
Information and Technical Assistance Programs The main implementation approach for this measure will be information programs directed to the communities, businesses, and industrial sectors of the affected entities. Since it is not known if there will be any mandatory requirements placed upon the commercial sector through legislation, the diversion measures will not be mandated programs and as such the GHG emissions reduction goals are justifiably lower than their full potential if the programs were mandatory. The information and technical assistance programs will be designed to focus on the potential GHG emissions reductions, energy savings and other cost-benefit information that will make the various diversion measures attractive to interested and affected entities. The CIWMB has numerous programs targeted at the commercial sector to help implement this measure.
An example is the Recycling Market Development Zone (RMDZ) program. This program combines recycling with economic development to fuel new businesses, expand existing ones, create jobs, and divert waste from landfills. This program provides attractive loans, technical assistance, and free product marketing to businesses that use materials from the waste stream to manufacture their products and are located in a zone. The zones cover roughly 71,790 square miles of California from the Oregon border to San Diego. Based on very preliminary calculations, the estimated annual GHG emission reductions for RMDZ participants is on the order of 1 MMTCO2e for the material types of cardboard, lumber, metals, paper, glass, and plastic. Additional data analyses and market surveys need to be completed to fully substantiate this number.
Assistance is provided by local zone administrators and the CIWMB's Local Assistance and Market Development team. Local government incentives may include relaxed building codes and zoning laws, streamlined local permit processes, reduced taxes and licensing, and increased and consistent secondary material feedstock supply. Local incentives vary from jurisdiction to jurisdiction. In addition to loans, the CIWMB offers free product marketing through the RecycleStore.
This program will help to further our efforts to expand markets for recycled materials and help to develop businesses that can manufacture materials in California. Through this program, GHG reductions would be felt along a broad sector of the economy as a result of manufacturing products from materials that were destined to be landfilled. Additional benefits include GHG emissions from reduced transportation because these manufacturers are located in California. California manufacturers of recycled products could benefit significantly if carbon offsets are put into place. This financial incentive would not only benefit the manufacturing businesses, but it could also stimulate market demand for recycled materials.
Recycling and Solid Waste Management concepts with Institute for Local Government’s California Climate Action Network
By partnering with the Institute for Local Government (ILG), the CIWMB would provide funding to allow ILG to provide expertise, tools and technical assistance to local jurisdictions to:
Commercial Recycling [July 16, 2008] Page 5
Measure Analysis for Public Distribution July 16, 2008 DRAFT Version 2.1
• conduct inventories of GHG emissions for solid waste management in cities and
counties, including emissions for solid waste and recycling infrastructure; • develop action plans for reducing GHG emissions; • implement policies; and, • monitor/verify results, with a specific focus on emissions associated with solid
waste management.
The CIWMB would partner with the ILG staff to build upon the work done by ICLEI - Local Governments for Sustainability USA (ICLEI), StopWaste.Org and others to help support the waste diversion programs and activities that are included in local jurisdictions' climate change plans. The ILG also will develop a model commercial recycling ordinance and will work with pilot local governments to implement the ordinance. Then, the ILG will evaluate the impacts of the ordinance by measuring the GHG emission reduction. The project’s success will be measured by an increase in the number of cities and counties that are implementing programs to reduce GHG emission reductions, as well as by an increase in the number of cities and counties designated to have achieved actual emission reductions through implementation of a variety of actions, including solid waste management programs.
Financial Incentives for Jurisdictions The CIWMB’s primary source of funding to address disposal issues comes from the landfill disposal fee. The current state disposal surcharge fee is $1.40 per ton, which is levied on top of the normal landfill tipping cost, which averages $40 per ton. This disposal surcharge has not been increased in over five years. To create a financial incentive that would have an impact on disposal reduction targets, a significant increase in this disposal surcharge would likely be necessary. Such an increase would create an economic incentive for material generated by the commercial sector to be either source reduced, recycled or composted. The funds collected from the increased disposal fee would allow the CIWMB to fund programs and better assist in activities such as recovering cardboard, lumber, metals, paper, glass, and plastic materials resulting in commercial waste recycling increases. This funding could include grant programs for jurisdictions to help with siting and infrastructure costs, along with other local jurisdiction program implementation efforts.
4. Technology The technologies used to achieve the diversion measures that make up the commercial recycling measure are primarily existing technologies for separating and processing waste components. For this measure, the infrastructure and technology is now in place and would effectively expand to process additional materials from the waste stream.
5. Statutory Status Currently, the CIWMB does not possess the statutory authority to require the implementation of commercial recycling or require reporting from businesses on their recycling activities. Additionally, Public Resources Code (PRC) 48000 maintains the state disposal fee surcharge at $1.40/ton.
Therefore, depending on the implementation approach, legislation may be required to achieve success with this measure. The ILG pilot project, for example, may show that mandatory commercial ordinances are needed in some communities to achieve higher levels of diversion
Commercial Recycling [July 16, 2008] Page 6

Measure Analysis for Public Distribution July 16, 2008 DRAFT Version 2.1
from the commercial and multi-family sector. Legislation would also be required to increase the disposal fees, thus creating an economic incentive for the commercial sector to divert materials.
6. Implementation Steps and Timeline The implementation steps for this diversion measure that contribute to the overall GHG emissions reduction goal of the Commercial Recycling Measure are planned as follows:
Step Estimated Timeline Conduct a study to analyze the cost-benefits of commercial diversion programs
2008-2011
Encourage business and industry to implement commercial recycling programs (ILG contract)
2008-2010
Monitor implementation by local government and evaluate results of new programs (ILG contract)
2011-2013
Develop and implement commercial recycling outreach and technical assistance program
2009-2012
Monitor disposal/recycling data related to commercial businesses
2011-2015
Measure the results of existing or pilot commercial recycling programs working cooperatively with local governments
2011-2015
Develop and implement marketing program for Recycling Market Development Zone (RMDZ)
2009-2012
Expand RMDZs and increase the number of RMDZ businesses and/or tonnage remanufactured by RMDZ businesses
Pursue legislative authority if necessary 2011-2015
7. Greenhouse Gas Emission Reductions The overall GHG emissions reduction goal for the Commercial Recycling measure is to recover 50 percent of six recyclable materials from this waste stream by 2020. The overall GHG emissions reductions depend on the success of the three previously stated “Measure Goals and Implementation Approaches”. Reaching this goal would achieve GHG reduction of over 5.5 MMTCO2E. This overall reduction goal will be achieved through a combination of:
1) Net energy savings (MMBtu) from recycling commercial materials, and
Commercial Recycling [July 16, 2008] Page 7
Measure Analysis for Public Distribution July 16, 2008 DRAFT Version 2.1
2) In some cases, avoided methane emissions at landfills (minus any greenhouse gas credits due to loss of carbon sequestration in the landfill and loss of energy savings from landfill gas recovery)
To date, most GHG emissions reductions are estimated using the United States Environmental Protection Agency’s WAste Reduction Model (WARM) calculator or the Northeast Recycling Council’s (NERC) calculator.
For the commercial recycling diversion measure, the tonnage and type of recyclables that are assumed to be recovered from the landfill are based on the recoverable tons of materials as identified in the 2004 CIWMB waste characterization study (see references) at an estimated recovery rate of 50 percent projected through 2020 for the CS100> sector only. To estimate the GHG emissions reductions for the increase in commercial recycling measure, the WARM calculator was used and the WARM spreadsheet is attached.
8. Costs and Cost Savings The diversion measure is difficult to assess in terms of the overall goal until CIWMB has completed a commercial cost benefit analysis which is estimated to be completed by 2011. Some businesses may incur initial startup costs for procuring processing equipment (such as cardboard balers) and recycling collection containers. Due to large variations in the types of businesses and volumes of materials, and also due to the competitive and proprietary nature of commercial waste and recycling services, it is difficult to quantify specific costs related to this measure. However, over the long-term many businesses should experience cost savings including reduced disposal costs and increased revenue for sales of commodities.
The general cost savings considered for this economic exercise is primarily avoided landfill expenses expressed as $/ton tipping fee multiplied by the number of tons that are diverted from the landfill to beneficial use. The $/ton tipping fee is assumed to be an average of $40/ton statewide based on surveys conducted in 2000. This number is somewhat dated and therefore likely underestimated; however, it is the most recent information found at this point. This number should be revised as more updated information becomes available.
Based on these assumptions, the cost savings for the commercial recycling measure total over $100 million. The costs of recycling are based on information from two economic reports that identify an extremely broad range as the cost per ton to process recyclables diverted from the landfill (“The Economic Impact of Waste Disposal and Diversion in California” and “California Recycling Economic Information Study”). Note that for this economic exercise it was arbitrarily assumed that the costs of recycling would be $55/ton, a number within the extremely broad range identified by the reports. At $55/ton, the costs of recycling exceed the cost savings for recycling, potentially making this diversion option look undesirable on paper.
However, if the lower end of the broad range of recycling costs is assumed, then the costs of recycling would be $35/ton. When contrasted to the avoided landfill tipping fee of $40/ton, the lower end cost of recycling becomes a highly attractive GHG reduction option. In addition, regional constraints play an important role in determining the economic viability of recycling programs. For example, the upper range of landfill tipping fees in the year 2000 was $85/ton; in 1999 it was $110/ton. So in areas of the state where it is very costly to dispose of waste and the recycling collection infrastructure is already in place, it is reasonable to assume economic viable recycling diversion programs. It is also important to note that if an increased tip fee of
Commercial Recycling [July 16, 2008] Page 8
Measure Analysis for Public Distribution July 16, 2008 DRAFT Version 2.1
10-20/ton was implemented, the economic benefits and therefore incentive to divert materials would be much greater than under current diversion and disposal fee structures.
To further address the potential impacts and cost-benefit savings from focusing on increasing diversion from the commercial sector, the CIWMB will initiate an economic study to analyze the cost-benefits of commercial diversion programs, focusing on the “top” commodities or materials in the disposal stream in terms of tons disposed and assessing the GHG emissions that could be achieved if part or all were recycled. The focus of the study will be on a desired recycling performance level or set of levels to obtain cost information for the commercial sector, since the marginal cost of recycling will increase as the recycling performance level approaches 100%. Objectives and factors of this study will be to:
o determine GHG reductions at a performance level of recycling 50 percent of the top GHG materials;
o define and analyze a commercial recycling program for the ARB Scoping Plan; o recognize that some materials may be too contaminated to recycle, and others may
not be big contributors to diversion or GHG reductions; o recognize that for businesses or multi-family dwellings under a certain size, it may
not be economically feasible to implement programs; and, o include a source reduction component.
Until the CIWMB’s economic studies can be completed, this measure recognizes that there are significant uncertainties in the assumptions that will need to be addressed in the future.
9. Other Benefits There are additional benefits that result from diverting waste from landfills, such as reduced leachate production at landfills, reduced impacts on groundwater, and reduced landfill capacity requirements. This measure would also result in general reductions in air pollution, water pollution, reduction in water consumption, and environmental degradation as a direct result of reduced raw materials harvest and extraction.
10. References • “Statewide Waste Characterization Study”, December 2004, Cascadia Consulting
Group, Inc.www.ciwmb.ca.gov/Publications/default.asp?pubid=1097
• Employment Development Department (EDD), Industry Projections - Introduction and Methods, "Economic Assumptions" accessed January 9, 2008 at: www.labormarketinfo.edd.ca.gov/article.asp?PAGEID=&SUBID=&ARTICLEID=718&SEGMENTID=6
• Department of Finance, Demographic Research Unit: www.dof.ca.gov/Research/Research.php
• USEPA WARM: www.epa.gov/climatechange/wycd/waste/calculators/Warm_home.html
Commercial Recycling [July 16, 2008] Page 9

Measure Analysis for Public Distribution July 16, 2008 DRAFT Version 2.1
Commercial Recycling [July 16, 2008] Page 10
• “Recovering Energy, Natural Resources, and Economic Benefit from Waste for LA, A Resource Management Blueprint for the City of Los Angeles, 2005 – 2025”, Los Angeles Councilman Greig Smith, June 2005.
• “The Economic Impact of Waste Disposal and Diversion in California”, George Goldman and Aya Ogishi, University of California, Berkeley, April 4, 2001.
• “California Recycling Economic Information Study”, prepared by the National Recycling Coalition for the USEPA in association with R.W. Beck, Inc., July 2001.
• Landfill Tipping Fee Surveys: www.ciwmb.ca.gov/landfills/tipfees/TFSums.
• ICLEI - Local Governments for Sustainability USA www.iclei-usa.org/programs/climate/ghg-protocol
Measure Analysis for Public Distribution July 16, 2008 Version 1.3
Climate Action Team Recycling Sector Sub Group
Scoping Plan Measure Development and Cost Analysis The purpose of this document is to provide the public with information about options considered and analyzed by the Climate Action Team (CAT) Sector Sub Groups for Air Board’s consideration and potential inclusion in the Scoping Plan. This information should be drawn from the Measure Analyses previously developed by each Sub Group. Information should only be updated to reflect significant changes in technology, staff assignments, and understanding of the issues.
Outline 1. Measure: Extended Producer Responsibility and Environmentally Preferable Purchasing 1 2. Agency: California Integrated Waste Management Board ............................................... 1 3. Measure Description ......................................................................................................... 1
Overview ........................................................................................................................ 1 Affected Entities ............................................................................................................. 3 Related Objectives ......................................................................................................... 3 Strategy Metrics ............................................................................................................. 3 Strategy Goals and Implementation Approaches ........................................................... 4
4. Technology ........................................................................................................................ 4 5. Statutory Status ................................................................................................................. 4 6. Implementation Steps ....................................................................................................... 4 7. Greenhouse Gas Emission Reductions ............................................................................ 5 8. Costs and Cost Savings .................................................................................................... 6 9. Other Benefits ................................................................................................................... 7 10. References ........................................................................................................................ 7
Page i
Measure Analysis for Public Distribution July 16, 2008 Version 1.3
Page ii
[Page intentionally blank]
Measure Analysis for Public Distribution July 16, 2008 DRAFT Version 2.1
Climate Action Team Recycling Sector Sub Group
Scoping Plan Measure Development and Cost Analysis The purpose of this document is to provide the public with information about options considered and analyzed by the Climate Action Team (CAT) Sector Sub Groups for Air Board’s consideration and potential inclusion in the Scoping Plan. This information should be drawn from the Measure Analyses previously developed by each Sub Group. Information should only be updated to reflect significant changes in technology, staff assignments, and understanding of the issues.
1. Measure: Extended Producer Responsibility and Environmentally Preferable Purchasing
2. Agency: California Integrated Waste Management Board Note: Implementation of this strategy will require the cooperation of Department of General Services, other state agencies that oversee state purchasing, or agencies that are authorized to make their own purchases.
3. Measure Description Overview
Extended Producer Responsibility (EPR) is a strategy to place a shared responsibility for end-of-life product management on the producers, and all entities involved in the product chain, instead of the general public; while encouraging product design changes that minimize a negative impact on human health and the environment at every stage of the product’s lifecycle. This allows the costs of treatment and disposal to be incorporated into the total cost of a product. It places primary responsibility on the producer, or brand owner, who makes design and marketing decisions. It also creates a setting for markets to emerge that truly reflect the environmental impacts of a product, and to which producers and consumers respond. It thereby incorporates the costs of product collection, recycling, and/or disposal into total product cost, and encourages product design, source reduction, and reuse so as to have a reduced impact on human health and the environment.
A related strategy is Environmentally Preferable Purchasing (EPP), which advances the purchase of products that have reduced green house gas emissions, along with other environmental benefits in their life-cycle as compared to baseline or commonly purchased products. The state as a large purchaser, especially working in partnership with other states such as through the Western States Contracting Alliance, is able to leverage markets. Our increase in demand for certain products creates an incentive for those products to be manufactured. Consequently, the success of this strategy depends greatly on a team effort with the Department of General Services (DGS), along with major purchasing entities (e.g., CalTrans, Department of Corrections, etc) to
Page 1
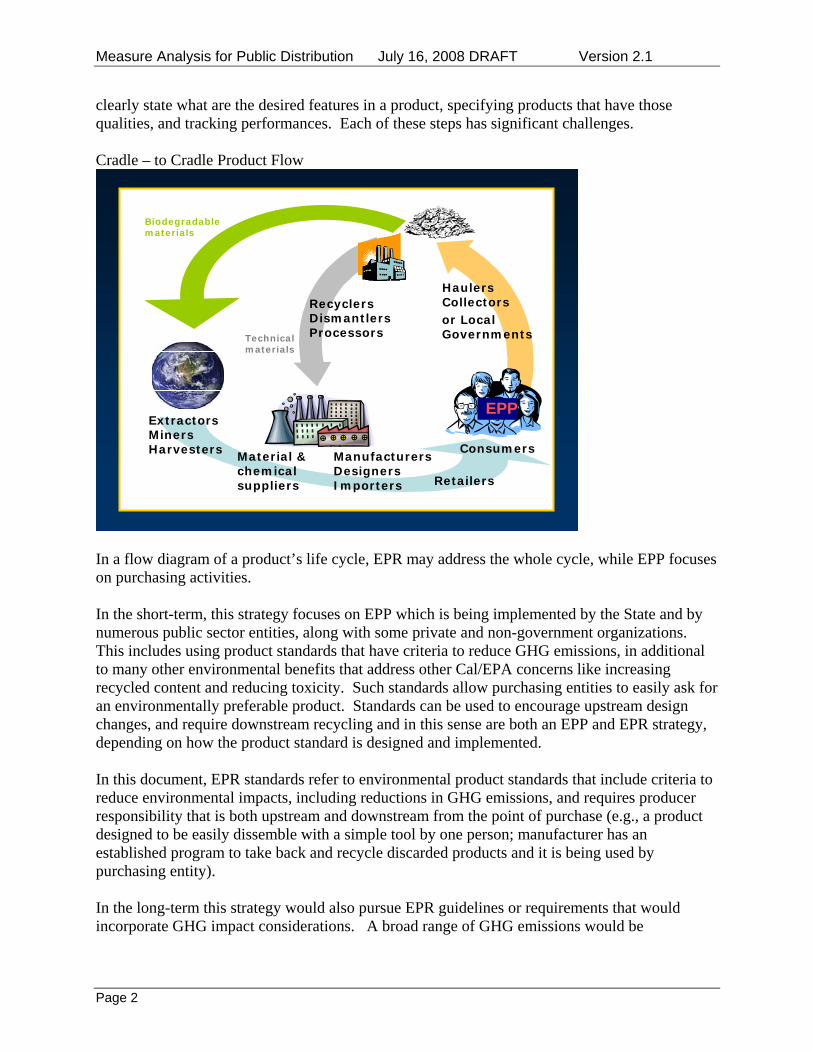
Measure Analysis for Public Distribution July 16, 2008 DRAFT Version 2.1
clearly state what are the desired features in a product, specifying products that have those qualities, and tracking performances. Each of these steps has significant challenges. Cradle – to Cradle Product Flow
8
Manufacturers Designers Importers
ExtractorsMinersHarvesters Material &
chemical suppliers
Consumers
Technical materials
Recyclers DismantlersProcessors
Retailers
Biodegradable materials
Haulers Collectorsor Local Governments
EPP
In a flow diagram of a product’s life cycle, EPR may address the whole cycle, while EPP focuses on purchasing activities. In the short-term, this strategy focuses on EPP which is being implemented by the State and by numerous public sector entities, along with some private and non-government organizations. This includes using product standards that have criteria to reduce GHG emissions, in additional to many other environmental benefits that address other Cal/EPA concerns like increasing recycled content and reducing toxicity. Such standards allow purchasing entities to easily ask for an environmentally preferable product. Standards can be used to encourage upstream design changes, and require downstream recycling and in this sense are both an EPP and EPR strategy, depending on how the product standard is designed and implemented. In this document, EPR standards refer to environmental product standards that include criteria to reduce environmental impacts, including reductions in GHG emissions, and requires producer responsibility that is both upstream and downstream from the point of purchase (e.g., a product designed to be easily dissemble with a simple tool by one person; manufacturer has an established program to take back and recycle discarded products and it is being used by purchasing entity). In the long-term this strategy would also pursue EPR guidelines or requirements that would incorporate GHG impact considerations. A broad range of GHG emissions would be
Page 2

Measure Analysis for Public Distribution July 16, 2008 DRAFT Version 2.1
considered, but it is likely that fossil CO2 through the extraction, manufacturing, transportation and use of the products being considered would be the primary focus. One challenge is that currently the state does not have centralized reporting for state purchases and this is unlikely to occur unless mandated. DGS collects data on individual contracts, but this only covers purchases made off of DGS-managed contracts (estimated to be about 60% of all state purchases) and no database has been developed to store that data. Without access by staff from other agencies to this information on a systematic basis, it is difficult to impossible to analyze environmental impacts associated with EPP activities; CIWMB staff, for example, have only been able to obtain limited information on state purchases when mandated by state law and for a few state contracts on a one-time basis.
Affected Entities Entities affected by this strategy would include manufacturers (national and international) of products primarily purchased by government agencies, and state agencies that would need to report on selected purchases. Without significant statutory changes, this would predominantly affect businesses that sell to state agencies. However, it has been observed that in most instances, once environmental standards are adopted by the State of California, local governments and corporate buyers will begin purchasing products meeting those requirements. CIWMB staff, at the September 19, 2007 Board Meeting, identified the following list of potential affected entities (AKA Stakeholders) in a Extended Producer Responsibility effort: 1. Producers and Product Stewardship Organization(s) 2. Retailers 3. Consumers 4. CA State government 5. Local government 6. Haulers, collectors 7. Recyclers, dismantlers, processors 8. Advisory committees and working groups
Related Objectives The strategy is motivated primarily by non-greenhouse gas benefits
This strategy is motivated by the broader concerns of resource conservation, public health and safety, and the general range of “end of life” issues related to various products. Strategy Metrics Metrics could include:
• Number of products covered under EPP/EPR policies adopted • Dollar amount of products purchased (or percent) by the State of California that meet
EPR standards (note, the CIWMB does not have access to these data so this strategy would require DGS and state agencies with delegated purchasing authority to provide data)
Page 3
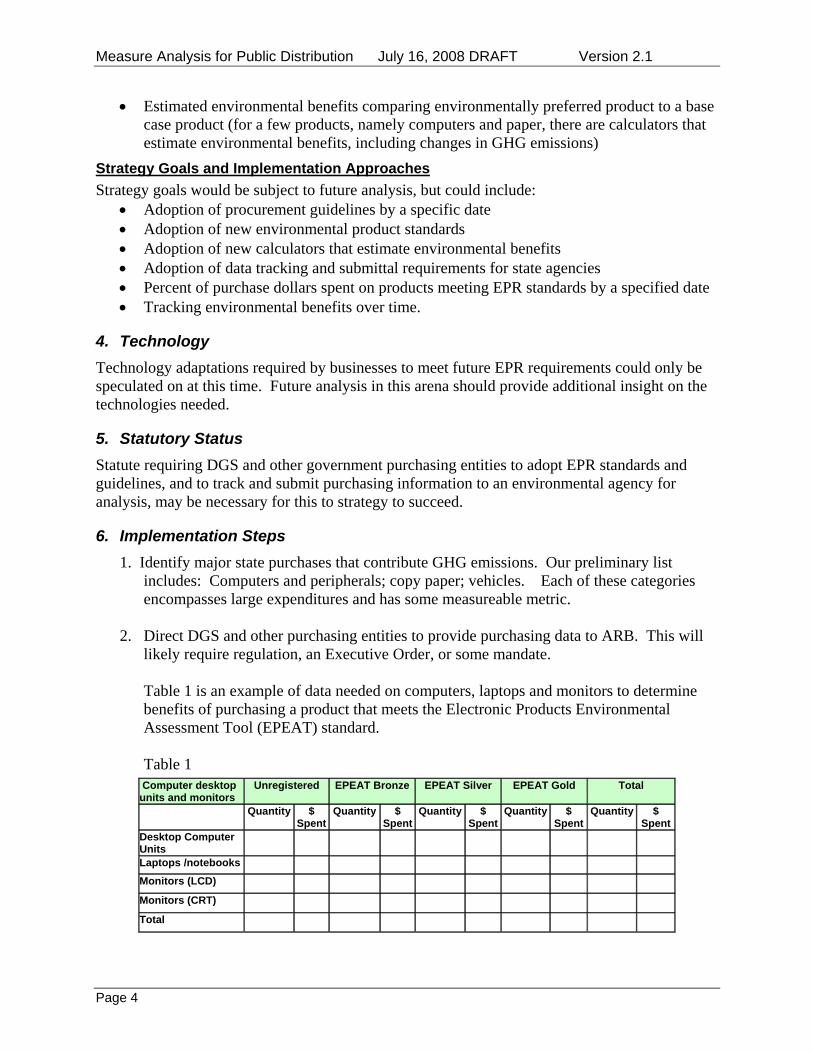
Measure Analysis for Public Distribution July 16, 2008 DRAFT Version 2.1
• Estimated environmental benefits comparing environmentally preferred product to a base case product (for a few products, namely computers and paper, there are calculators that estimate environmental benefits, including changes in GHG emissions)
Strategy Goals and Implementation Approaches Strategy goals would be subject to future analysis, but could include:
• Adoption of procurement guidelines by a specific date • Adoption of new environmental product standards • Adoption of new calculators that estimate environmental benefits • Adoption of data tracking and submittal requirements for state agencies • Percent of purchase dollars spent on products meeting EPR standards by a specified date • Tracking environmental benefits over time.
4. Technology Technology adaptations required by businesses to meet future EPR requirements could only be speculated on at this time. Future analysis in this arena should provide additional insight on the technologies needed.
5. Statutory Status Statute requiring DGS and other government purchasing entities to adopt EPR standards and guidelines, and to track and submit purchasing information to an environmental agency for analysis, may be necessary for this to strategy to succeed.
6. Implementation Steps 1. Identify major state purchases that contribute GHG emissions. Our preliminary list
includes: Computers and peripherals; copy paper; vehicles. Each of these categories encompasses large expenditures and has some measureable metric.
2. Direct DGS and other purchasing entities to provide purchasing data to ARB. This will
likely require regulation, an Executive Order, or some mandate.
Table 1 is an example of data needed on computers, laptops and monitors to determine benefits of purchasing a product that meets the Electronic Products Environmental Assessment Tool (EPEAT) standard.
Table 1
Computer desktop units and monitors
Unregistered EPEAT Bronze EPEAT Silver EPEAT Gold Total
Quantity $ Spent
Quantity $ Spent
Quantity $ Spent
Quantity $ Spent
Quantity $ Spent
Desktop Computer Units
Laptops /notebooks Monitors (LCD)
Monitors (CRT)
Total
Page 4
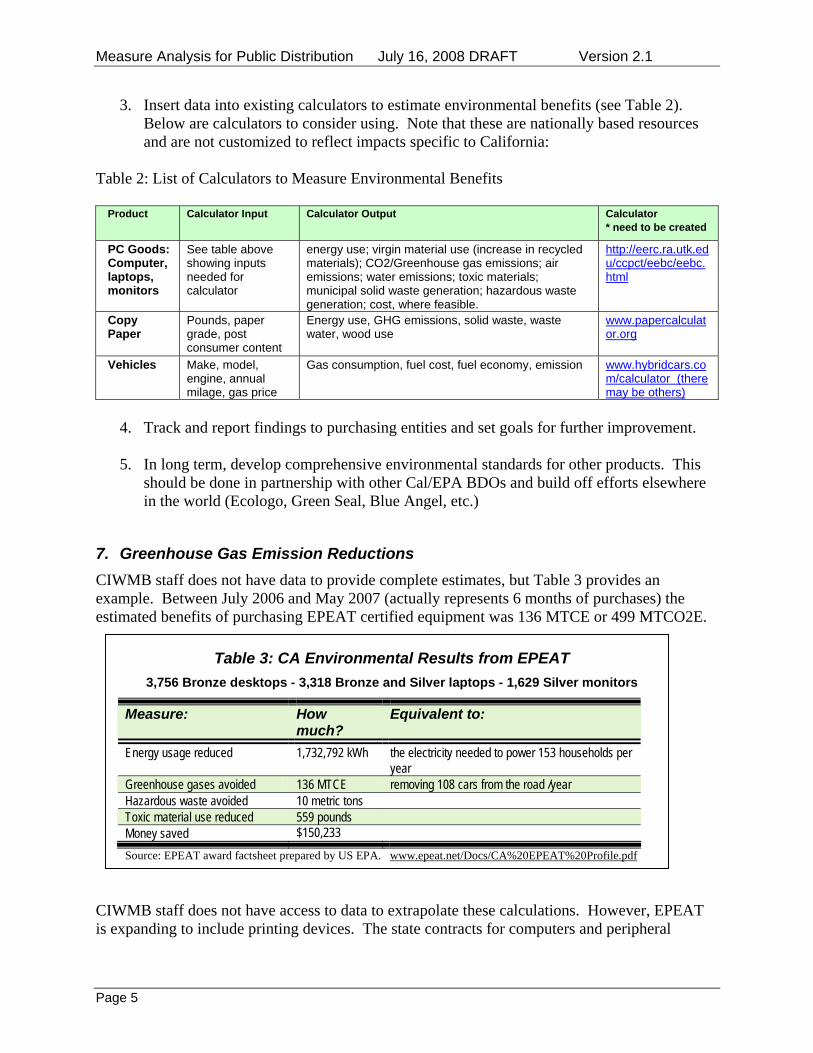
Measure Analysis for Public Distribution July 16, 2008 DRAFT Version 2.1
3. Insert data into existing calculators to estimate environmental benefits (see Table 2). Below are calculators to consider using. Note that these are nationally based resources and are not customized to reflect impacts specific to California:
Table 2: List of Calculators to Measure Environmental Benefits
Product Calculator Input Calculator Output Calculator * need to be created
PC Goods: Computer, laptops, monitors
See table above showing inputs needed for calculator
energy use; virgin material use (increase in recycled materials); CO2/Greenhouse gas emissions; air emissions; water emissions; toxic materials; municipal solid waste generation; hazardous waste generation; cost, where feasible.
http://eerc.ra.utk.edu/ccpct/eebc/eebc.html
Copy Paper
Pounds, paper grade, post consumer content
Energy use, GHG emissions, solid waste, waste water, wood use
www.papercalculator.org
Vehicles Make, model, engine, annual milage, gas price
Gas consumption, fuel cost, fuel economy, emission www.hybridcars.com/calculator (there may be others)
4. Track and report findings to purchasing entities and set goals for further improvement.
5. In long term, develop comprehensive environmental standards for other products. This
should be done in partnership with other Cal/EPA BDOs and build off efforts elsewhere in the world (Ecologo, Green Seal, Blue Angel, etc.)
7. Greenhouse Gas Emission Reductions CIWMB staff does not have data to provide complete estimates, but Table 3 provides an example. Between July 2006 and May 2007 (actually represents 6 months of purchases) the estimated benefits of purchasing EPEAT certified equipment was 136 MTCE or 499 MTCO2E.
Table 3: CA Environmental Results from EPEAT 3,756 Bronze desktops - 3,318 Bronze and Silver laptops - 1,629 Silver monitors
Measure: How much?
Equivalent to:
Energy usage reduced 1,732,792 kWh the electricity needed to power 153 households per year
Greenhouse gases avoided 136 MTCE removing 108 cars from the road /year Hazardous waste avoided 10 metric tons Toxic material use reduced 559 pounds Money saved $150,233 Source: EPEAT award factsheet prepared by US EPA. www.epeat.net/Docs/CA%20EPEAT%20Profile.pdf
CIWMB staff does not have access to data to extrapolate these calculations. However, EPEAT is expanding to include printing devices. The state contracts for computers and peripheral
Page 5
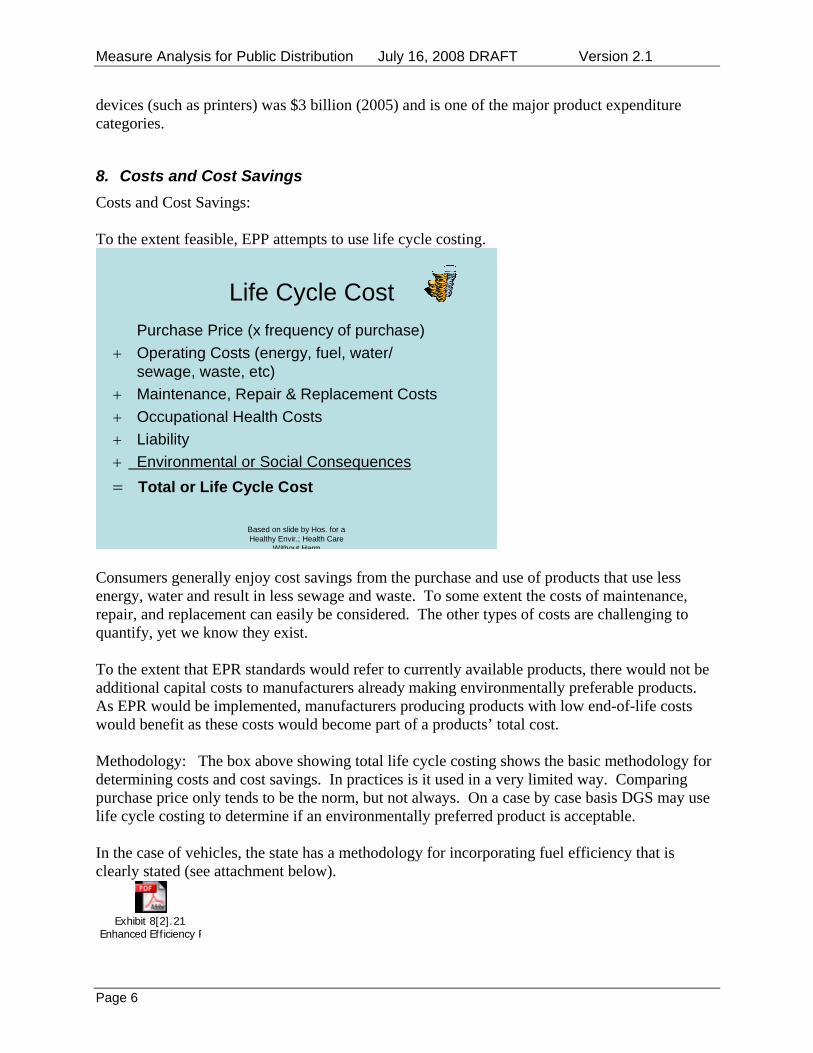
Measure Analysis for Public Distribution July 16, 2008 DRAFT Version 2.1
devices (such as printers) was $3 billion (2005) and is one of the major product expenditure categories.
8. Costs and Cost Savings Costs and Cost Savings: To the extent feasible, EPP attempts to use life cycle costing.
Based on slide by Hos. for a Healthy Envir.; Health Care
Without Harm
Life Cycle Cost Purchase Price (x frequency of purchase)+ Operating Costs (energy, fuel, water/
sewage, waste, etc)+ Maintenance, Repair & Replacement Costs+ Occupational Health Costs+ Liability+ Environmental or Social Consequences= Total or Life Cycle Cost
Consumers generally enjoy cost savings from the purchase and use of products that use less energy, water and result in less sewage and waste. To some extent the costs of maintenance, repair, and replacement can easily be considered. The other types of costs are challenging to quantify, yet we know they exist. To the extent that EPR standards would refer to currently available products, there would not be additional capital costs to manufacturers already making environmentally preferable products. As EPR would be implemented, manufacturers producing products with low end-of-life costs would benefit as these costs would become part of a products’ total cost.
Methodology: The box above showing total life cycle costing shows the basic methodology for determining costs and cost savings. In practices is it used in a very limited way. Comparing purchase price only tends to be the norm, but not always. On a case by case basis DGS may use life cycle costing to determine if an environmentally preferred product is acceptable. In the case of vehicles, the state has a methodology for incorporating fuel efficiency that is clearly stated (see attachment below).
Exhibit 8[2].21
Enhanced Efficiency F
Page 6
Measure Analysis for Public Distribution July 16, 2008 DRAFT Version 2.1
Page 7
9. Other Benefits This strategy would provide many unrelated environmental benefits including reductions in air pollution, water pollution, waste minimization, energy efficiency, and reduced impacts on landfills.
10. References • Draft tracking and measurement plan for EPP (not a public document) • EPEAT
http://www.epeat.net/Docs/CA%20EPEAT%20Profile.pdf
http://www.epeat.net/FastBenefits.aspx
• This presentation highlights emission reductions from various base case versus environmentally preferable products bearing an eco label in various countries. http://www.epa.gov/NCEI/international/ecolabelppt.pdf

DRAFT July 16, 2008 DRAFT
Climate Action Team Recycling and Waste Management Sector Sub Group
Scoping Plan Measure Development and Cost Analysis The purpose of this document is to provide the public with information about options considered and analyzed by the Climate Action Team (CAT) Sector Sub Groups for Air Board’s consideration and potential inclusion in the Scoping Plan. This information should be drawn from the Measure Analyses previously developed by each Sub Group. Information should only be updated to reflect significant changes in technology, staff assignments, and understanding of the issues.
Outline 1. Strategy: Expand Awareness of AB 1969 ........................................................................ 1 2. Agency: CPUC & CIWMB ................................................................................................ 1 3. Strategy Description .......................................................................................................... 1
Overview ........................................................................................................................ 1 Affected Entities ............................................................................................................. 1 Related Objectives ......................................................................................................... 1 Strategy Metrics ............................................................................................................. 2 Strategy Goals and Implementation Approaches ........................................................... 2
4. Technology ........................................................................................................................ 2 5. Statutory Status ................................................................................................................. 2 6. Implementation Steps ....................................................................................................... 2 7. Greenhouse Gas Emission Reductions ............................................................................ 3 8. Costs and Cost Savings .................................................................................................... 3 9. Other Benefits ................................................................................................................... 3 10. References ........................................................................................................................ 3
Page i

DRAFT July 16, 2008 DRAFT
Page ii
[Page intentionally blank]
Measure Analysis for Public Distribution July 16, 2008 DRAFT Version 2.1
Climate Action Team Recycling and Waste Management Sector Sub Group
Scoping Plan Measure Development and Cost Analysis The purpose of this document is to provide the public with information about options considered and analyzed by the Climate Action Team (CAT) Sector Sub Groups for Air Board’s consideration and potential inclusion in the Scoping Plan. This information should be drawn from the Measure Analyses previously developed by each Sub Group. Information should only be updated to reflect significant changes in technology, staff assignments, and understanding of the issues.
1. Measure: Expand Awareness of AB 1969
2. Agency: California Public Utilities Commission, Integrated Waste Management Board
3. Measure Description Overview
Through a CPUC decision implementing AB 1969, electrical corporations are required to purchase, at a CPUC approved price, renewable energy output from public water and wastewater facility projects with an effective capacity of not more than 1.5 megawatts (MW), up to a total program capacity of 250 MW. In that decision, the CPUC expanded the scope of AB 1969 to include an additional 230 MW from all other Renewable Portfolio Standard (RPS) eligible resources for projects up to 1 MW of effective capacity. The law provides new renewable energy generation resources that otherwise would not have been developed; helps electric utilities meet their RPS goals and resource adequacy requirements; reduces greenhouse gases; offsets rising energy demand; and decreases net water treatment and delivery costs. To further participation in this new program, the CPUC will work with the CIWMB and other relevant agencies to increase awareness of the feed-in-tariff by reaching out to qualifying landfill gas and other facilities.
Affected Entities The CPUC and the CIWMB would be the entities directly involved in outreach to qualifying facilities. Assuming the outreach is effective, it will result in an increase in the number of small, RPS facilities, each less than 1 or 1.5 MW. This growth could increase the workload of relevant permitting agencies, primarily at the local and county level. Related Objectives Besides contributing to a reduction in GHGs, this strategy will further the overall goals of the RPS program as articulated in Public Utilities Code Section 399.11, including promotion of stable electricity prices, protection of public health, improvement of environmental quality,
Page 1
Measure Analysis for Public Distribution July 16, 2008 DRAFT Version 2.1
stimulation of sustainable economic development, creation of new employment opportunities, and reduction of reliance on imported fuels.
Measure Metrics • Increased generation of RPS-eligible energy from facilities operating under the tariffs
established through the CPUC’s implementation of AB 1969;
• Reach capacity cap by 2010.
Measure Goals and Implementation Approaches Goals would include:
o Outreach by mail and through professional forums to all eligible generators.
o Creating a central web page with information for all relevant agencies to refer to.
o Working with the obligated utilities and their marketing departments to effectively reach eligible generators.
4. Technology If there aren’t enough eligible projects to reach the cap, generators may need to work with the CEC to certify their facility as RPS eligible.
5. Statutory Status
AB 1969, approved on September 29, 2006, adds PU Code Section 399.20, which requires all electrical corporations to file with the California Public Utilities Commission (Commission) a standard tariff to provide for payment for every kilowatthour (kWh) of renewable energy output produced at an eligible electric generation facility, as specified, at the market price determined by the Commission pursuant to PU Code Section 399.15 for a period of 10, 15 or 20 years. For purposes of PU Code Section 399.20, the electric generation facility must be an eligible renewable energy resource owned and operated by a public water or wastewater agency that is a retail customer of the electrical corporation, interconnected and operated in parallel with the electrical corporation's transmission and distribution system and be sized to offset part or all of the electric demand of the public agency.
The CPUC expanded the scope of AB 1969 in a Commission decision to include an additional 230 MW from all other Renewable Portfolio Standard (RPS) eligible resources for projects up to 1 MW of effective capacity.
6. Implementation Steps a. Work with obligated utilities to define generator base.
b. Provide informational materials (online, brochure) that outline participation guidelines.
c. Coordinate with utility marketing departments.
d. Use successful strategies to assist utilities with fewer resources.
Page 2
Measure Analysis for Public Distribution July 16, 2008 DRAFT Version 2.1
Page 3
7. Greenhouse Gas Emission Reductions Greenhouse Gas Emission Impact
Methodology:
8. Costs and Cost Savings Costs and Cost Savings: Utilities, especially small utilities, may reduce costs because the feed-in-tariff eliminates the need to use staff resources to negotiate contracts. Costs may include production of brochures or travel to professional events.
Methodology
9. Other Benefits This measure will further the overall goals of the RPS program as articulated in Public Utilities Code Section 399.11, including promotion of stable electricity prices, protection of public health, improvement of environmental quality, stimulation of sustainable economic development, creation of new employment opportunities, and reduction of reliance on imported fuels.
10. References
DRAFT July 16, 2008 DRAFT
Climate Action Team Recycling and Waste Management Sector Sub Group
Scoping Plan Measure Development and Cost Analysis The purpose of this document is to provide the public with information about options considered and analyzed by the Climate Action Team (CAT) Sector Sub Groups for Air Board’s consideration and potential inclusion in the Scoping Plan. This information should be drawn from the Measure Analyses previously developed by each Sub Group. Information should only be updated to reflect significant changes in technology, staff assignments, and understanding of the issues.
Outline 1. Measure: Increase Production and Markets for Compost ................................................ 1 2. Agency: Integrated Waste Management Board ............................................................... 1 3. Measure Description ......................................................................................................... 1
Overview ........................................................................................................................ 1 Affected Entities ............................................................................................................. 3 Related Objectives ......................................................................................................... 4 Measure Metrics ............................................................................................................. 4 Measure Goals and Potential Implementation Approaches ........................................... 4
4. Technology ........................................................................................................................ 4 5. Statutory Status ................................................................................................................. 5 6. Implementation Steps and Timeline .................................................................................. 5 7. Greenhouse Gas Emission Reductions ............................................................................ 5 8. Costs and Cost Savings .................................................................................................... 6 9. Other Benefits ................................................................................................................... 6 10. References ........................................................................................................................ 6
Page i

DRAFT July 16, 2008 DRAFT
Page ii
[Page intentionally blank]

Measure Analysis for Public Distribution July 16, 2008 DRAFT Version 2.1
Climate Action Team Recycling and Waste Management Sub Group
Scoping Plan Measure Development and Cost Analysis T The purpose of this document is to provide the public with information about options considered and analyzed by the Climate Action Team (CAT) Sector Sub Groups for Air Board’s consideration and potential inclusion in the Scoping Plan. This information should be drawn from the Measure Analyses previously developed by each Sub Group. Information should only be updated to reflect significant changes in technology, staff assignments, and understanding of the issues.
1. Measure: Increase Production and Markets for Compost
2. Agency: Integrated Waste Management Board
3. Measure Description Overview Greenhouse gas (GHG) emissions resulting from solid waste management have been identified as a major source of global climate change. Methane is produced from anaerobic decomposition of organic materials in landfills, which are the source of the majority of anthropogenic methane emissions in California. Compostable organic materials comprise approximately 10 million tons of disposed materials on an annual basis. Integrated Waste Management Board (IWMB) Strategic Directive 6.1 calls for a reduction in the amount of organics in the waste stream of 50 percent by 2020. Diversion of this material from landfills can provide a significant reduction of greenhouse gases through landfill methane avoidance and beneficial offsets. The California Integrated Waste Management Board (CIWMB) is conducting the following efforts to increase production and markets for compost. • Complete Life Cycle Assessment of Organic Diversion Alternatives; • Conduct Demonstration/Field Workshops on Compost Based Best Management
Practices; • Develop Compost Specifications for Agriculture; • Study the Effectiveness of Using Compost as Cover to Mitigate Methane Emissions
from Landfills; • Evaluate Economic Incentives and Disincentives; and • Siting & Capacity Issues (Workshops, Permits, Regs.) • Research, Product Standards, Technology Evaluation The CIWMB is conducting a Life Cycle Assessment (LCA) of organics diversion alternatives in support of Assembly Bill (AB) 32. The objectives of this project are to quantify GHG emission reductions from implementation of organic diversion alternatives and to perform an economic analysis to determine the associated costs and cost savings of the selected organic diversion alternatives on a regional and statewide basis. CIWMB anticipates this LCA will be completed in the spring of 2009. The completed LCA will result in a California-specific, peer-reviewed, GHG tool which will be used to prioritize organic diversion alternatives for maximum GHG reductions in a cost-effective manner on a regional and statewide basis. The LCA will not directly result in GHG reductions, but it will be used as a decision making tool for analyzing different diversion activities and determine the potential GHG reductions.
Page 1
Measure Analysis for Public Distribution July 16, 2008 DRAFT Version 2.1
CIWMB will also focus on the development of compost based Best Management Practices (BMPs). The BMPs will lead to water conservation in vegetation establishment, reduction in energy used to irrigate during the vegetation establishment phase, reduction in air and watershed pollution, and protection of water quality. BMPs demonstrations and field workshops will evaluate and quantify the benefits of compost and mulch across a variety of soil types and environmental conditions including:
• vegetation establishment on disturbed soil, • erosion control, • improved stormwater quality, and • greenhouse gas reduction.
CIWMB will also develop compost specifications for several agricultural crops (avocados, blueberries, grapes, lettuce, strawberries, and tomatoes) and will conduct workshops tailored to the agricultural community, composters, and other interested parties. The ultimate goal of this project is to increase compost use in agriculture. CIWMB will continue research to evaluate the long term effectiveness of biocover materials in the field and the utility of green material as a biocover medium. Preliminary results from the biocover research project at the Yolo County Central Landfill have shown that decomposed green material could perform well in oxidizing methane. The methane oxidation capacity is a function of physical properties of the biocover (e.g., porosity; moisture holding capacity, etc.) analyses and should quantify the changing nature of these biocover properties through time. This information is needed for biocover materials such as aged green material and compost. To help assess the performance of these materials through time and under different climatic conditions, field data will be used in computer models to evaluate how the time-dependent compaction and degradation of these materials affects gas diffusion, rainfall infiltration and moisture retention, and ultimately methane oxidation. The Economic and Technology Advancement and Advisory Committee (ETAAC) Final Report suggests that agricultural emissions can be reduced through composting. This research could lead to the implementation of more effective biocovers for methane oxidation at landfills which would then lead to reductions in GHG emissions. At its December 11, 2007 meeting, the Board directed staff to implement the Organics Policy Roadmap (OPR). One of the efforts the OPR focuses on is an analysis of economic incentives and disincentives for using compost. The CIWMB will analyze:
• Carbon credits, tradable diversion credits, tax credits; • Landfill surcharge with funds used for infrastructure development (e.g., composting,
anaerobic digestion) and other diversion programs; • State bonds requiring use of compost products; • The creation of incentives for co-location, resource parks; • Banning disposal of organics; • Requiring preprocessing prior to disposal; • A full-cost accounting analysis
The ETAAC suggests a possible phase out of diversion credit for greenwaste alternative daily cover, and a per-ton GHG emission surcharge on landfill operators to balance the playing field for composters.
Page 2

Measure Analysis for Public Distribution July 16, 2008 DRAFT Version 2.1
Also included in the OPR is siting & capacity development of organics diversion infrastructure. Through workshops, permits and regulations the CIWMB will identify barriers and corresponding solutions to the siting and expansion of organic diversion facilities that will be required to reduce the amount of organics landfilled by 50% in California by the year 2020. Efforts began with an electronic survey which was developed and distributed to composters, solid waste facility operators, planning directors, local governments, zone administrators, local enforcement agencies (LEAs) and other interested parties. Participation from a wide range of stakeholders and interested parties helps identify what CIWMB can do to help reduce the barriers; this information can then be used to identify stakeholders in key regions to contact for follow-up interviews. Final results will be used to draft a workplan which will then be the subject of discussion at two scheduled workshops, April 16 in San Diego and April 23 in Sacramento. The CIWMB will conduct a literature review to identify and document studies that quantify reduction of greenhouse gas emissions resulting from compost and mulch use. CIWMB will also conduct research to quantify water conservation effects of compost-based best management practices. These studies should provide information for use in CIWMB education and outreach efforts related to the use compost and mulch in reducing greenhouse gas emissions. Adoption of the BMPs and results from the research project will help reduce GHG emissions through water conservation, which reduces energy needed to transport water. The BMPs may also reduce GHG emissions as a result of the carbon sequestration benefits of compost and mulch and by reducing fossil fuel use required to produce pesticides and chemical fertilizers commonly used for vegetation establishment and crop production. Reductions in application of chemical fertilizers may also result in reduced nitrous oxide (N2O) emissions. The research project may also reduce greenhouse gas emissions through identification and dissemination of studies that quantify reductions resulting from specific compost and mulch use practices.
Affected Entities This proposed strategy could affect the organics recycling industry, agricultural sector, local government, landfills, and the general public. Regional businesses and homeowners may also be affected, depending on the extent of adoption by local government and Caltrans. Environmental Justice, Small Business, Public Health, Leakage and CEQA The measure is intended to protect public environmental resources which are accessible and used by all Californians. However, increasing compost production capacity has potential Environmental Justice ramifications related to the siting of new facilities and expansion of existing composting facilities.
Impacts on small businesses relate to potential changes needed by composters, including the siting of new facilities and expansion of existing composting facilities. Economic impacts to small business are expected to be positive as initial capital outlays would be offset by increased compost sales. Also, minimal impacts could be felt by farmers, landscapers and property managers. These impacts would most likely be predominantly related to practices and not likely require significant capital outlays.
These practices are unlikely to result in any leakages as their primary intention is to mitigate non-GHG related environmental impacts. These practices could be used as mitigation measures to resolve negative environmental impacts related to development of specific projects.
Page 3

Measure Analysis for Public Distribution July 16, 2008 DRAFT Version 2.1
Related Objectives The strategy is motivated primarily by non-greenhouse gas benefits. The primary objective of this effort is the diversion of compostable organic materials from landfills. The secondary motivation relates to protection of watersheds, the conservation of water through the use of compost and mulch BMPs for vegetation establishment, reduction in energy needed to transport water, carbon sequestration benefits of compost and mulch, and GHG emissions reduction by decreasing fossil fuel related to pesticide and chemical fertilizer use for vegetation establishment and crop production. Reductions in application of chemical fertilizers may also result in reduced N2O emissions.
Measure Metrics The life cycle assessment will determine greenhouse gas offsets from organic waste diversion technologies with a base comparison to landfill usage and emissions. Technologies that will be evaluated by the model are recycling, composting, grinding and chipping, biomass and waste to energy, acid hydrolysis, gasification and anaerobic digestion. These categories will be evaluated in terms of offset benefits and trade-offs in terms of greenhouse gas reduction, carbon sequestration, energy production, and energy balances. The economic aspect of the model will provide cost assessments for the incorporation of organic waste diversion technologies. When completed, in the spring of 2009, the Organics LCA will result in a California-specific, peer-reviewed, GHG tool. The GHG tool will be used to quantify GHG reductions from the use of compost and mulch in a cost-effective manner on a regional and statewide basis. Primary metrics would include increases in compost production (conversion factor of 2.1 yards/ton), decreases in the amount of compostable organic materials disposed in landfills, increases in compost used in agriculture, and increases in compost used for roadside applications (erosion control, vegetation, and filtration). Secondary metrics might include water conservation realized and improvement of water quality, such as, reductions in pesticide and chemical fertilizers found during local watershed sampling. While there is some data available regarding reduced water consumption in some applications, there is no existing source of data regarding the GHG reductions resulting from the implementation of this measure. Measure Goals and Potential Implementation Approaches The measure goals and the implementation approaches are not quantified at this time.
4. Technology This measure would require changes in the vegetation establishment practices used for erosion control in California. Traditional hydroseeding and other vegetation establishment practices would need to be modified. Changes would also be required in sustainable agricultural practices used in California. Sustainable agricultural practices, in contrast to traditional water and chemical intensive agricultural practice, would need to be encouraged.
Most applied technology is relatively low-tech and currently available (weather-based irrigation controllers, moisture sensors, organic soil amendments, education and outreach, development of knowledge base, etc.).
Page 4

Measure Analysis for Public Distribution July 16, 2008 DRAFT Version 2.1
5. Statutory Status This measure necessitates mandatory changes in current vegetation establishment practices or a statutory requirement for the adoption of ordinances by local government. This approach may require development of regulations. Guidelines could be developed in the near term without statutory support. Local governments could be encouraged to adopt sustainable vegetation establishment guidelines without a mandate. Financial incentive could be based on the reduction of infrastructure needed for increased water treatment and storm-water management.
6. Implementation Steps and Timeline Complete Life Cycle Assessment of Organic Diversion Alternatives
1. Develop life cycle assessment model– fall 2008. 2. Final Report – spring 2009.
Conduct Demonstration/Field Workshops on Compost Based Best Management Practices (conditional on future approval and availability of contractual funds)
1. Establish demonstrations – winter 2009. 2. Conduct field workshops – fall 2010.
Develop Compost Specifications for Agriculture
1. Design compost specifications – fall 2008. 2. Conduct workshops – spring 2009.
Study the Effectiveness of Using Compost as Cover to Mitigate Methane Emissions at Landfills
1. Design and construct landfill biocover demonstration project – within 6 months of contract execution
2. Conduct field and lab tests – prior to May 2010 3. Develop predictive computer model – prior to May 2010 4. Develop guidance document – May 2010
Evaluate Economic Incentives and Disincentives 1. Conduct literature review – June 2008. Siting & Capacity Issues (Workshops, Permits, Regs.)
1. Conduct siting and capacity workshop – April 2008. 2. Finalize workplan for Board on activities to facilitate siting of new or expansion of
existing organic processing facilities – fall 2008.
7. Greenhouse Gas Emission Reductions While there is little doubt that there would be significant impacts related to the implementation of this strategy, there are limited tools available upon which to base GHG reduction calculations. However, with CIWMB’s Strategic Directive 6.1 to reduce the amount of organics in the waste stream by 50 percent by 2020, preliminary estimates of GHG reductions are approximately 3.1 MMTCO2E by 2020 based on US EPA’s Waste Reduction Model (WARM) calculations. In addition, water conservation from adoption of increased applied compost and mulch could be
Page 5

Measure Analysis for Public Distribution July 16, 2008 DRAFT Version 2.1
greater that 25 percent over “business as usual” and there would be additional energy savings associated with reduced pumping of irrigation water. Additional GHG reductions associated with decreased use of pesticides and chemical fertilizers for vegetation establishment are not well quantified. Development of a new life cycle assessment model, scheduled for completion in spring 2009, should allow staff to conduct more accurate assessments than currently available using the WARM model. This will include carbon offsets associated with compost use, including reductions associated with water conservation and reduced fertilizer use.
8. Costs and Cost Savings − Cost savings in vegetation establishment should greatly exceed expenses.
− Significant damage to streets, sidewalks, fences, building foundations due to water
run-off could be avoided.
− Consumers and farmers would benefit by water conservation and environmental protection of their watershed.
− Local government would benefit by reduced capital costs associated with stormwater management and water treatment.
− Local government would also benefit from reduced watershed pollution.
− Infrastructure costs to compost operators could be significant, including purchase or lease of equipment and land; and permitting. However, this would be offset by increased sales of compost to farmers. Additional effects in implementation are mostly changes in agricultural practices and will have minimal capital costs associated with them.
9. Other Benefits − Emissions reductions due to less energy consumption related to water treatment
and irrigation distribution. − Reduced consumption of fossil fuels related to pesticide and fertilizer production
and use. − VOC emission reductions from less pesticide and fertilizer use. − Reduced watershed pollution.
.
10. References Organics Summit Background Discussion Paper, California Integrated Waste Management Board, Strategic Policy Development Committee, October 10, 2007: www.ciwmb.ca.gov/agendas/mtgdocs/2007/10/00022540.doc WARM Model:www.epa.gov/climatechange/wycd/waste/calculators/Warm_home.html
Page 6
Measure Analysis for Public Distribution July 16, 2008 DRAFT Version 2.1
Page 7
Discussion Of Organics Policy Roadmap And Schedule; And Consideration Of Organics Allocation Proposals (Integrated Waste Management Account, FY 2007/08), Board Meeting, December 11, 2007: www.ciwmb.ca.gov/agendas/mtgdocs/2007/12/00022750.doc Recommendations of the Economic and Technology Advancement and Advisory Committee (ETAAC) Final Report: http://www.arb.ca.gov/cc/etaac/etaac.htm Contractor’s Report to the Board - Comprehensive Compost Odor Response Project: http://www.ciwmb.ca.gov/Publications/Organics/44207001.pdf Additional CIWMB Organics Publications: http://www.ciwmb.ca.gov/Organics/Pubs.htm
Draft Measure Analysis for Public Distribution
Climate Action Team Recycling and Waste Management Sector Sub Group
Scoping Plan Measure Development and Cost Analysis The purpose of this document is to provide the public with information about options considered and analyzed by the Climate Action Team (CAT) Sector Sub Groups for Air Board’s consideration and potential inclusion in the Scoping Plan. This information should be drawn from the Measure Analyses previously developed by each Sub Group. Information should only be updated to reflect significant changes in technology, staff assignments, and understanding of the issues.
Outline
1. Measure: Landfill Methane Control Measure ................................................................... 3 2. Agency: Air Resources Board .......................................................................................... 3 3. Measure Description ......................................................................................................... 3
Overview ........................................................................................................................ 3 Affected Entities ............................................................................................................. 3 Measure Metrics ............................................................................................................. 4 Measure Goals and Potential Implementation Approaches ........................................... 4
4. Technology ........................................................................................................................ 5 5. Statutory Status ................................................................................................................. 5 6. Implementation Steps and Timeline .................................................................................. 5 7. Greenhouse Gas Emission Reductions ............................................................................ 5 8. Costs and Cost Savings .................................................................................................... 6 9. Other Benefits ................................................................................................................... 6
August 11, 2008 Page 1
Draft Measure Analysis for Public Distribution
[Page intentionally blank]
August 11, 2008 Page 2

Draft Measure Analysis for Public Distribution
Climate Action Team Recycling and Waste Management Sector Sub Group
Scoping Plan Measure Development and Cost Analysis The purpose of this document is to provide the public with information about options considered and analyzed by the Climate Action Team (CAT) Sector Sub Groups for Air Board’s consideration and potential inclusion in the Scoping Plan. This information should be drawn from the Measure Analyses previously developed by each Sub Group. Information should only be updated to reflect significant changes in technology, staff assignments, and understanding of the issues.
1. Measure: Landfill Methane Control Measure
2. Agencies: California Air Resources Board, California Integrated Waste Management Board
3. Measure Description Overview The purpose of the Landfill Methane Control Measure is to reduce methane emissions from municipal solid waste (MSW) landfills. The control measure is a performance-based measure that requires owners or operators of MSW landfills having 450,000 tons of waste-in-place (WIP), or more, to install a gas collection and control system to be operated on a continuous basis. If a flare is used as the methane control device, it must be an enclosed flare. The measure establishes statewide standards for the gas collection and control system, including: methane destruction efficiency requirements for the emission control equipment, wellhead monitoring requirements, and a landfill methane surface emission standard of 200 parts per million by volume (ppvm). Owners or operators installing a gas collection and control system would be required to submit a gas collection and control system design plan prepared by a professional engineer that would address best management practices to minimize methane emissions and maximize methane collection efficiencies. The measure would also include reporting requirements for MSW landfills.
Affected Entities The Landfill Methane Control Measure will primarily affect MSW landfill owners and operators, particularly those who do not already capture the methane generated by their landfills. However, all MSW landfills will be subject to the statewide standards and reporting requirements. ARB and CIWMB staff have identified approximately 372 landfills with potential to generate landfill gas, of which approximately 150 are active permitted facilities receiving waste. Landfill owners and operators are both private and public entities with the breakdown for active facilities of 2/3 public and 1/3 private entities. As of June 2008, ARB and CIWMB staff identified 41 landfills above 450,000 tons of WIP without methane destruction systems. This number is subject to change as new information from CIWMB and the local air districts is obtained. Most MSW landfills having less than 450,000 tons of WIP are expected to emit negligible amounts of methane.
August 11, 2008 Page 3
Draft Measure Analysis for Public Distribution
Environmental Justice, Small Business, Public Health, Leakage and CEQA Environmental Justice: Environmental justice is not expected to be a concern since landfills are typically located in remote areas.
Small Business: MSW landfills that are closed and have no incoming revenue may not have the necessary funding to install and operate a gas collection and control system, if required to do so.
Public Health and Leakage: It is not anticipated that the proposed Landfill Methane Capture Measure will interfere with any public health efforts such as achieving and maintaining federal and State air quality standards and reducing toxic emissions. ARB staff does not anticipate any potential for leakage (i.e., garbage being transported out of the state) as a result of this measure. Some municipalities in California already ship waste out-of-state for economic reasons.
CEQA: The proposed Landfill Methane Control Measure is not expected to result in significant negative impacts in any community. The proposed measure is designed to reduce landfill gas emissions (primarily methane). By reducing methane emissions, the public’s exposure to toxic compound emissions such as NMOCs, are also reduced.
Related Objectives Increasing the capture of landfill methane also increases the removal of NMOCs that would be otherwise emitted. The measure requires the installation and operation of a gas collection and control system. Landfill methane would be collected and routed to a methane control system, such as: flares, internal combustion engines, boilers, or gas turbines. The operation of these emission control devices may result in a slight increase of criteria pollutant emissions such as oxides of nitrogen and carbon monoxide. Energy recovery systems, such as reciprocating engines, may result in slightly higher criteria pollutant emissions in comparison to flares. Potential benefits of increasing landfill methane capture include reducing explosive gas migration, odors, and water quality impacts.
Measure Metrics The primary metrics for the Landfill Methane Control Measure include the percent of total waste-in-place in landfills with methane control systems and how consistently landfills are in compliance with surface emission standards. Metrics for maximizing landfill methane capture efficiency cannot be established at this time because estimation of landfill methane emissions is poorly understood and is an area identified for additional research. A currently ongoing CEC study to develop and validate a new inventory and methodology for determining landfill methane emissions and assigned capture efficiencies may be a basis for a metric of percent of total WIP that is under the influence of methane control systems. This metric is expected to be superior to the metric of percent of total WIP in landfills with methane control systems because narrowing the gap in time between placement of waste in the landfill and installation and operation of the gas collection system pulling gas from that waste may provide the best opportunity for increasing capture efficiency. The inventory and metrics will be revised accordingly based on the CEC study.
Measure Goals and Potential Implementation Approaches The goal of the Landfill Methane Control Measure is to reduce methane emissions from municipal solid waste (MSW) landfills and is a direct regulation.
August 11, 2008 Page 4

Draft Measure Analysis for Public Distribution
4. Technology The capture and control of landfill gas relies primarily on standard landfill gas collection and control system technologies which are readily available and well understood. Mechanical blowers and compressors pull landfill gas from the waste mass through vertical wells and horizontal trenches. The landfill gas is conveyed via piping and headers to combustion via enclosed ground type flares or energy recovery systems such as reciprocating engines, combustion turbines, steam-cycle power plants, or microturbines. Landfill gas may also be purified to various extents as appropriate for direct use as boiler fuel, pipeline quality gas, or vehicle fuels including compressed natural gas (CNG) and liquefied natural gas (LNG). Research and development on emerging landfill gas recovery technologies is ongoing. Landfill gas flares are the most common recovery systems and are available from multiple vendors.
Landfill design, construction, operation, and closure and post-closure practices may also present opportunities to increase capture efficiencies. For example, gas extraction systems can be installed at particular planned stages and construction specifications to maximize capture. In addition, final cover systems installed early as portions of the landfill reaches final grades provide an early barrier to fugitive methane emissions by thickened soil and low permeability layers. Natural methane oxidation has been shown to occur in landfill cover materials thereby reducing emissions, and it may be possible to cost-effectively enhance such oxidation through use of compost in cover soils.
ARB staff will continue to work with CIWMB in their ongoing evaluation of viable technologies related to increasing landfill methane capture. CIWMB has provided funding to a bioreactor landfill demonstration project and is also providing funding for a project to demonstrate an innovative anaerobic composting design and process to increase recovery of biogas for energy and recover a residual compost product from yard wastes otherwise used as landfill alternative daily cover. Other related CIWMB funded studies include an assessment by UC Davis of the technical and economic feasibility of producing hydrogen from landfill gas for vehicle use, power generation, and other applications.
5. Statutory Status ARB has sufficient authority under AB 32 to implement the Landfill Methane Control Measure.
6. Implementation Steps and Timeline 1st Public Workshop October 10, 2007
2nd Public Workshop March 24, 2008
Additional Workshops As Needed
Public Hearing to Consider Adoption of the Landfill Methane Control Measure
January 2009
Project Completion Date (OAL approval) November 2009
Compliance Begins January 1, 2010
7. Greenhouse Gas Emission Reductions Preliminary total GHG reduction estimates for installing new control systems and increasing landfill methane capture efficiencies are expected to be on the order of 1.0 MMTCO2E by 2020.
August 11, 2008 Page 5
Draft Measure Analysis for Public Distribution
August 11, 2008 Page 6
Approximately 0.8 MMTCO2E of these reductions results from the installation of new gas collection and control systems. This estimate assumes that it will be feasible to reduce approximately 93 percent of the gross theoretical reductions (0.86 MMTCO2E) from smaller landfills with 0.45 to 4.1 million tons waste-in-place (based on an assumed landfill gas heat input capacity of 3.0 million British thermal units per hour of collected gas, 75 percent capture efficiency with control system, and 10 percent methane oxidation factor). ARB estimated 1990 GHG emissions from MSW landfills to be 6.26 MMTCO2E; in 2006 the GHG emission level dropped to 5.8 MMTCO2E. These emissions are forecasted to increase to approximately 7.64 MMTCO2E in 2020. ARB estimates that fugitive emissions of methane from landfills represent one to two percent of the statewide GHG inventory.
Emission reduction estimates will be refined as development of the control measure proceeds.
8. Costs and Cost Savings Economic impacts will be estimated as part of the regulatory development process. Preliminary cost estimates made by ARB control measure development staff are as follows:
• Costs to implement controls at an active MSW landfill having 450,000 tons of waste-in-place were estimated to be approximately $70 per ton of CO2 reduced.
• Costs for closed MSW landfills having the same amounts of waste-in-place were
estimated to be approximately $52. Capital costs are estimated to be approximately $2,400,000 and annual operating costs are estimated to be approximately $300,000. These estimates are preliminary only and will be revised as the development of the control measure proceeds.
9. Other Benefits Increasing capture of landfill methane may remove additional NMOCs that would otherwise be emitted. Quantification of potential benefits of increasing landfill methane on reducing explosive gas migration, odors, and water quality impacts is not available at this time. These benefits, in addition to other environmental impacts, will be discussed in the staff report for the control measure.

DRAFT July 16, 2008 DRAFT
Climate Action Team Recycling and Waste Management Sector Sub Group
Scoping Plan Measure Development and Cost Analysis The purpose of this document is to provide the public with information about options considered and analyzed by the Climate Action Team (CAT) Sector Sub Groups for Air Board’s consideration and potential inclusion in the Scoping Plan. This information should be drawn from the Measure Analyses previously developed by each Sub Group. Information should only be updated to reflect significant changes in technology, staff assignments, and understanding of the issues.
Outline 1. Measure ............................................................................................................................ 1 2. Agency: Integrated Waste Management Board ................................................................ 1 3. Measure Description ......................................................................................................... 1
Overview ........................................................................................................................ 1 Affected Entities ............................................................................................................. 2 Related Objectives ......................................................................................................... 2 Measure Metrics ............................................................................................................. 2 Measure Goals and Potential Implementation Approaches ........................................... 3
4. Technology ........................................................................................................................ 3 5. Statutory Status ................................................................................................................. 4 6. Implementation Steps and Timeline .................................................................................. 4 7. Greenhouse Gas Emission Reductions ............................................................................ 5 8. Costs and Cost Savings .................................................................................................... 5 9. Other Benefits ................................................................................................................... 5 10. References ........................................................................................................................ 5
Page i

DRAFT July 16, 2008 DRAFT
Page ii
[Page intentionally blank]

Measure Analysis for Public Distribution July 16, 2008 DRAFT
Climate Action Team Recycling and Waste Management Sector Sub Group
Scoping Plan Measure Development and Cost Analysis The purpose of this document is to provide the public with information about options considered and analyzed by the Climate Action Team (CAT) Sector Sub Groups for Air Resources Board’s consideration and potential inclusion in the Scoping Plan. This information should be drawn from the Measure Analyses previously developed by each Sub Group and submitted to the California Air Resources Board.
1. Measure Industry outreach on increasing the efficiency of landfill methane capture (Landfill Methane Capture Guidance Document).
2. Agency: Integrated Waste Management Board
3. Measure Description Overview The Landfill Methane Capture Guidance Document measure develops a document listing numerous best management practices (BMPs) and options that municipal solid waste (MSW) landfill owners and operators may reference to maximize greenhouse gas (GHG) emission reductions from their operations. The guidance document is not intended for regulatory purposes but may be used by the California Air Resources Board (CARB), CIWMB, and other agencies as a technical resource for rulemaking processes. CARB is in the process of developing regulations to implement the AB 32 discrete early action measure adopted June 2007 for landfill methane capture. In addition, the guidance document may provide technical support for landfill voluntary GHG registry protocols adopted by the California Climate Action Registry (CCAR).
Methane is a potent GHG, with approximately twenty-one (21) times the Global Warming Potential (GWP) as carbon dioxide. The CARB estimates that methane from landfill gas (LFG) accounts for 6.26 million metric tons of CO2 equivalent (MMTCO2E) in 1990 or 1.5% of total net GHG emissions. In 2004 landfill methane emissions were reduced to 5.62 MMTCO2E or 1.2% of total net GHG emissions. Methane emissions estimates for landfills contain large uncertainties and the California Energy Commission (CEC) is funding a study in consultation with staff from the CIWMB and CARB to develop and validate improved GHG inventory methods for landfill methane emissions. CIWMB staff estimate that the vast majority of total waste in landfills (93.5% by weight) is contained in landfills with approved LFG collection and control technologies that combust and destroy methane. These technologies include flares and energy recovery devices, such as internal combustion engines, turbines, pipeline, and direct use systems. Landfill design, construction, operation, and closure/postclosure practices also may affect the ability and efficiency of reducing landfill GHG emissions. Optimization of these practices could enhance the efficiency of capture of LFG that would otherwise be emitted. Specific areas include: LFG collection system design, construction, timing, and operation; landfill unit and cell design and construction; waste placement methods; and daily and intermediate cover materials and practices. For example, natural methane oxidation has been shown to occur in landfill cover materials. It may be possible to cost-effectively enhance such oxidation thereby reducing emissions through use of compost or other biologically
Page 1
Measure Analysis for Public Distribution July 16, 2008 DRAFT
active materials in cover soils. Furthermore, early installation of gas collection and control systems ahead of regulatory deadlines may achieve greater reductions in methane emissions. At this time there is no overall practical and cost-effective guide including BMPs or alternative options for landfill owners and operators to reduce GHG emissions from landfills tailored to the specific needs in California. The guidance document provides such a document that could be used on a voluntary basis by landfill owners and operators to reduce GHG emissions and may be used by agencies as technical supporting information for regulations and market-based registry protocols.
Affected Entities This measure will affect municipal solid waste landfill owners and operators. The CIWMB has identified approximately 366 landfills with potential to generate LFG, of which approximately 145 are active permitted facilities receiving waste. The total number of owners and operators affected will be less than 366 because specific owners and operators typically own and operate multiple sites and facilities, and a significant proportion of landfills are of a size and age expected to emit negligible methane. Landfill owners and operators are both private and public entities with the breakdown for active facilities of 2/3 public and 1/3 private entities. The CIWMB maintains owner contact and mailing list information for landfills in the Solid Waste Information System (SWIS).
Environmental Justice, Small Business, Public Health, Leakage and CEQA This measure incorporated substantial opportunity for interested parties and stakeholders to comment on the development of the measure. Approval of the contract concept and award of the contract were conducted at regularly scheduled CIWMB public Board meetings, as well as the final report which was presented in April 2008. An additional public workshop on the draft final report was conducted on February 26, 2008.
This measure does not interfere with public health efforts such as achieving and maintaining federal and State air quality standards and reducing toxic emissions and is consistent with activities of the Environmental Justice Advisory Committee. This measure does not have potential for leakage and would not impact small business.
Related Objectives This measure is motivated primarily by GHG reduction benefits but has other multiple benefits. Increasing capture of landfill methane has significant other potential multi-media environmental and public health and safety benefits beyond reduction in climate change emissions. These potential benefits would include reduction in explosive gases hazards, and increase in the capture of trace gases including toxic and odorous compounds which otherwise might be released and result in human exposure and health risk, ground water contamination, or nuisance.
Measure Metrics The primary metric for this measure has been the completion of the final report and presentation to the CIWMB at a public Board meeting in April 2008.
Page 2

Measure Analysis for Public Distribution July 16, 2008 DRAFT
Measure Goals and Potential Implementation Approaches The measure does not directly result in measurable GHG reductions, however, may indirectly assist achievement of the 2-4 MMTCO2E reduction originally estimated by CARB for the Landfill Methane Capture Early Action Measure. However, recently, CARB has updated this value to 1.0 MMTCO2E in their Draft Scoping Plan (June 2008). The implementation approach is an outreach program, whereby the guidance document is developed in consultation with stakeholders, presented at a formal public meeting, posted on the CIWMB’s website, and distributed by link to affected entities and other interested stakeholders. CIWMB staff will also seek appropriate venues to present the report for training and technical assistance purposes on minimizing landfill greenhouse gas emissions.
4. Technology The measure evaluates existing and emerging technologies and management practices for applicability, cost and overall effectiveness in GHG emissions reductions, including, but not limited to design, construction, and operational practices for:
• LFG collection and control systems; • Landfill waste management unit design and construction practices; • Landfill operational practices including: daily cell development and construction; • Waste acceptance and placement; • Leachate recirculation and bioreactor landfill operation; • Daily, intermediate, and final cover materials and practices; • Use of compost and other recycled materials as landfill biocovers for GHG emissions
reduction; and • Landfill closure and post-closure maintenance practices including partial closure.
For LFG collection and control system, the study assesses the following topics:
• LFG design techniques that could be used to maximize methane collection and • destruction. • LFG system operational strategies to enhance the efficiency, uptime, and overall • effectiveness of the LFG system. • LFG construction techniques and materials to ensure the highest level of LFG control, • performance, system longevity, and operational ease. • Early installation of LFG collection systems into new landfills, existing landfills, and/or • expansion areas ahead of current regulatory requirements and criteria for
implementation. • The efficacy of installation of LFG control systems for smaller and/or older landfills,
which are currently not required to have LFG control, and the possible criteria that could be used to determine when this would be warranted.
• Potential enhanced monitoring strategies to assess methane emissions and to measure the increased GHG emissions reduction through the BMPs.
For landfill design and operational options, including closure and post-closure operational aspects, the study assesses the following topics:
• New cell design and impacts on LFG collection, including design of gas collectors in bottom liner systems, protection against gas escaping through liner anchor trenches, etc.
• Use of leachate collection and removal system (LCRS) components for LFG control. • Landfill construction impacts on LFG systems and how to minimize.
Page 3
Measure Analysis for Public Distribution July 16, 2008 DRAFT
• Landfill operational and phasing impacts on LFG systems and how to minimize, including waste acceptance practices, waste placement activities, and cell development.
• Designing, constructing, and operating LFG systems at sites with leachate recirculation or at bioreactor landfills and minimizing liquids impacts while enhancing LFG system design to accommodate increased gas production.
• Cover design and practices and impacts on LFG collection, including daily cover, alternative daily covers (ADCs), intermediate cover, final cover, synthetic versus soil covers, and closure phasing.
• Closure and post-closure activities and how to minimize impacts on the LFG system. For the organics recycling and biocovers options, the study assesses the following topics:
• Types of biocovers and their comparative value for methane oxidation. • Biocover design criteria. • A brief qualitative analysis of the GHG emissions reduction potential from organic waste
diversion based on published literature on the subject. • Alternatives to landfilling (composting and anaerobic digestion) were also considered as
possible options within the landfill facility property boundary since these waste management strategies would serve to reduce landfill methane emissions by waste diversion.
5. Statutory Status No additional statutory authority is required at this time to implement this measure.
6. Implementation Steps and Timeline A Scope of Work for this measure was issued as part of a Request for Proposals (RFP) secondary method competitive bidding process. One proposal was received from SCS Engineers dated April 23, 2007. This proposal met the qualifications and minimum score requirements. The CIWMB approved SCS Engineers as the contractor on May 15, 2007.
The SCS Project Team included a Project Management team located in Sacramento and technical support Task Managers located throughout California. SCS also subcontracted to Integrated Waste Management Consulting to provide assistance on composting and use of recycled organic waste at landfills; Pacific Waste Consulting Group to provide assistance on landfill operations; and GC Environmental, Inc. to provide assistance in LFG design, operations, and construction. In addition to the Project Team, a Technical Advisory Group (TAG) was formed that included representatives from the private and public solid waste industry, academia, the regulatory community, environmental groups, and other technical experts on landfills and/or other GHG emissions to review the report.
The Scope of Work consisted of six tasks. Under Task 1, the Project Team developed a detailed work plan and budget that identified and described the specific tasks to be performed, schedule for completion, deliverables including draft and final reports, and itemized costs per task. For Task 2, the Project Team convened an advisory group to review the project. The Project Team then reviewed available literature on the technologies and practices for reducing GHG emissions from landfills for Task 3. Under Task 4, the Project Team developed and evaluated technologies and management practices for cost and effectiveness in GHG reductions. The TAG reviewed the Task 4 deliverable prior to inclusion in the final report. Task 5 was to develop the final report or guidance document. Finally, Task 6 included one stakeholder workshop to solicit comments from all
Page 4
Measure Analysis for Public Distribution July 16, 2008 DRAFT
Page 5
interested parties and to present the final report to the Board. The final report represents the efforts from the Project Team and input from various stakeholder groups.
The stakeholder workshop was held on February 26, 2008. The contractor also presented the final report at a public CIWMB Board meeting in April 2008 including a description of the Project Team, Technical Advisory Group, and stakeholder interaction; main contract deliverables; and key findings. The final report is posted on the CIWMB’s climate change website (http://www.ciwmb.ca.gov/Climate/) and was distributed by link to LEAs, landfill operators, and other interested stakeholders. CIWMB staff will also seek appropriate venues to present the report for training and technical assistance purposes on minimizing landfill greenhouse gas emissions.
The study provides voluntary options for reducing GHG emissions from landfills and is not intended for regulatory purposes. However, the study may be used by CARB, CIWMB, and other agencies as a technical resource for rulemaking processes. CARB is currently in the informal rulemaking process to adopt regulations to implement the AB 32 discrete early action measure adopted June 2007 for landfill methane capture. Upon completion of the CARB rulemaking in early 2009, Board staff plan to consult with CARB staff and seek Board direction on the potential need for Board rulemaking concepts relating to LFG to assist in AB 32 implementation.
7. Greenhouse Gas Emission Reductions The measure is outreach and therefore does not directly result in measurable GHG reductions. However, this measure may indirectly assist achievement of the 1.0 MMTCO2E reduction estimated by CARB for the Landfill Methane Capture Discrete Early Action Measure. Additional technical documentation concerning the estimates of GHG reductions for landfill methane capture is provided in CIWMB’s CAT Landfill Methane Capture Strategy.
8. Costs and Cost Savings The measure cost is up to $150,000 from discretionary CIWMB Fiscal Year (FY) 2006/07 funding, not including CIWMB staff resources. The study provides general cost information for the recommended BMP options. However, BMP costs are highly variable and must be assessed on a site-specific basis for implementation.
9. Other Benefits Increasing capture of landfill methane may remove additional toxic and ozone precursor Non-Methane Organic Chemicals (NMOCs) that would otherwise be emitted from landfills, and may provide other benefits in reducing explosive gas migration, odors, and water quality impacts.
10. References Final Report: Technologies and Management Practices for Reducing Greenhouse Gas Emissions From Landfills, SCS Engineers, April 2008.
Climate Change Draft Scoping Plan, CARB, June 2008 Discussion Draft
DRAFT July 16, 2008 DRAFT
Climate Action Team Sector Sub Group
Scoping Plan Measure Development and Cost Analysis The purpose of this document is to provide the public with information about options considered and analyzed by the Climate Action Team (CAT) Sector Sub Groups for Air Board’s consideration and potential inclusion in the Scoping Plan. This information should be drawn from the Measure Analyses previously developed by each Sub Group. Information should only be updated to reflect significant changes in technology, staff assignments, and understanding of the issues.
Outline 1. Measure: ........................................................................................................................... 1 2. Agency: ............................................................................................................................. 1 3. Measure Description ......................................................................................................... 1
Overview ........................................................................................................................ 1 Affected Entities ............................................................................................................. 2 Related Objectives ......................................................................................................... 2 Measure Metrics ............................................................................................................. 3 Measure Goals and Potential Implementation Approaches ........................................... 3
4. Technology ........................................................................................................................ 3 5. Statutory Status ................................................................................................................. 4 6. Implementation Steps and Timeline .................................................................................. 4 7. Greenhouse Gas Emission Reductions ............................................................................ 5 8. Costs and Cost Savings .................................................................................................... 6 9. Other Benefits ................................................................................................................... 6 10. References ........................................................................................................................ 7
July 16, 2008 Page i
DRAFT July 16, 2008 DRAFT
July 16, 2008 Page ii
[Page intentionally blank]
Measure Analysis for Public Distribution July 16, 2008 DRAFT
Climate Action Team Sector Sub Group
Scoping Plan Measure Development and Cost Analysis The purpose of this document is to provide the public with information about options considered and analyzed by the Climate Action Team (CAT) Sector Sub Groups for Air Resources Board’s consideration and potential inclusion in the Scoping Plan. This information should be drawn from the Measure Analyses previously developed by each Sub Group and submitted to the California Air Resources Board.
1. Measure: Landfill Methane as a Biomass Renewable Energy Source: Expand Production of Liquefied Natural Gas (LNG) from Landfill Gas through Funding of Commercial Scale Demonstration Projects (LNG from Landfill Gas Measure)
2. Agency: Integrated Waste Management Board
3. Measure Description Overview The Liquefied Natural Gas (LNG) from Landfill Gas Measure implements grant-funded projects at two landfills to demonstrate commercial-scale technologies for converting landfill gas to LNG vehicle fuel.
Recovery of landfill methane that is otherwise flared as a biomass renewable energy source reduces climate change emissions by avoiding the emissions associated with fossil fuel energy sources. Increasing energy recovery from landfill methane is a primary component of the Climate Action Team (CAT) Landfill Methane Capture strategy. In addition, Executive Order S-06-06 directs state agencies participating in the Bioenergy Interagency Working Group to enhance the sustainable management and development of biomass resources for electricity generation and production of alternative fuels (biofuels). Production of alternative fuels recovered from methane in landfill gas is one means of achieving these goals.
The California Integrated Waste Management Board (CIWMB) and California Biomass Collaborative estimate significant potential for increasing in-state production of biofuels such as LNG from landfill gas that is currently collected and otherwise flared with no energy recovery. However, current production of biofuels from landfill gas is limited and substantial technical and financial barriers to wider use remain. Stakeholders have conveyed that public funding and commitment is necessary to surmount private sector risk in order for significant commercialization and production to occur.
To support development of LNG production from landfill gas, the CIWMB and California Air Resources Board (CARB) approved in 2007 matching grant funding for two commercial scale demonstration projects. These projects include Gas Technology Institute (GTI) for a demonstration project at the Altamont Landfill and Resource Recovery Facility, Alameda County, and Prometheus Energy Company (PEC) for a demonstration project at the F.R. Bowerman Landfill, Orange County. The GTI project would provide 13,000 gallons per day (gpd) of LNG fuel for the facility refuse collection fleet. The PEC project would provide 18,600 gpd of LNG fuel to the local municipal bus fleet.
Page 1 [July 16, 2008]
Measure Analysis for Public Distribution July 16, 2008 DRAFT
The total 31,600 gpd (11,534,000 gallons per year) of LNG from landfill gas to be demonstrated in this measure will avoid (thereby reduce) climate change emissions by 0.08 MMTCO2E per year, and displace 18,921 gpd (6,906,165 gallons per year) in diesel fuel use. In addition to the direct benefit of these projects, documentation of actual LNG production from landfill gas would occur; information would be obtained on technical and economic aspects of such production, as well as information on end-use of the LNG produced. This information would assist the related outreach goal for this measure for the technology to be transferred such that expanded production of LNG from landfill gas occurs statewide well beyond the 31,600 gpd level. According to the GTI proposal, successful demonstration of commercial scale LNG production from landfill gas could reasonably lead to the offset of up to 90 million gallons of non-renewable diesel fuel per year being used in California and reduction of 1.0 million tons of carbon dioxide emissions annually.
Affected Entities This measure will affect municipal solid waste landfill owners and operators. The CIWMB has identified approximately 366 landfills with potential to generate landfill gas, of which approximately 145 are active permitted facilities receiving waste. The total number of owners and operators affected will be less than 366 because specific owners and operators typically own and operate multiple sites and facilities, and a significant proportion of landfills are of a size and age expected to emit negligible methane. Landfill owners and operators are both private and public entities with the breakdown for active facilities of 2/3 public and 1/3 private entities. The CIWMB maintains owner contact and mailing list information for landfills in the Solid Waste Information System (SWIS).
Environmental Justice, Small Business, Public Health, Leakage and CEQA The LNG from Landfill Gas Measure incorporates substantial opportunity for interested parties and stakeholders to comment on the development of the measure. Approval of the CIWMB grant concept (February 13, 2007) and award (May 15, 2007) were conducted at regularly scheduled CIWMB public Board meetings.
This measure is consistent with activities of the Environmental Justice Advisory Committee, and does not interfere with public health efforts such as achieving and maintaining federal and State air quality standards and reducing toxic emissions. This measure does not have potential for leakage and would not impact small business.
Each applicant for CIWMB grants is required to certify under penalty of perjury that, if awarded a grant, it shall, in the performance of the Grant Agreement, conduct its program, policies, and activities that substantially affect human health and safety or the environment in a manner that ensures the fair treatment of people of all races, cultures, and income levels, including minority populations, and low-income populations of the State. All grantees are also contractually required to perform their grant projects in a manner that is consistent with the principles of Environmental Justice as defined in Government Code Section 65040.12(e).
Related Objectives The LNG from Landfill Gas Measure is motivated by multiple benefits. In addition to greenhouse gas emission reductions, this measure reduces criteria and toxic pollutant emissions by avoiding emissions from landfill flares and the displaced diesel fuel.
Page 2 [July 16, 2008]

Measure Analysis for Public Distribution July 16, 2008 DRAFT
Recovery of landfill gas for production of electricity and vehicle fuels also plays an important role in California’s goals and mandates for increasing production of renewable energy and biofuels. Landfill gas also constitutes a significant portion of current and potential in-state renewable energy production from biomass.
Mandates and Executive Orders with significant relation to recovery of landfill gas for bioenergy include:
• Executive Order S-1-07, the Low Carbon Fuel Standard (LCFS) (issued on January 18, 2007), calls for a reduction of at least 10 percent in the carbon intensity of California's transportation fuels by 2020.
• BioEnergy/Fuels Targets and Action Plan (Executive Order S-06-06). • State plan to increase the use of alternative transportation fuels in California (AB1007
Pavley, Chapter 371, Statutes of 2005). • California Renewables Portfolio Standard (RPS) Program (SB1078 Sher, Chapter 516,
Statutes of 2002).
Measure Metrics Metrics for the LNG from Landfill Gas Measure include the production capacity and actual production of LNG from landfill gas on an annual basis starting in 2009 when the grant projects conclude.
Measure Goals and Potential Implementation Approaches Measure goals include actual production meeting production capacity at 31,600 gpd (11,534,000 gallons per year) LNG at the conclusion of the demonstration projects starting June 2009. For the purposes of this analysis these production rates are projected to be sustained through the 2020 AB 32 compliance date.
Production capacity would be confirmed by the CIWMB and ARB staff managing the grant projects at the time the grants are concluded. Future production capacities and actual production would be tracked in consultation with the ARB Alternative Fuels Program.
The implementation approach for the LNG from Landfill Gas Measure is a one-time financial incentive (grant) program. The final reports for the demonstration grant programs will be presented at a formal public meeting, posted on the CIWMB’s website, and distributed by link to affected entities and other interested stakeholders and agencies. CIWMB staff will also seek appropriate venues in consultation with CARB and CEC to present the report for training and technical assistance for the purpose of expanding production of LNG from landfill gas statewide.
4. Technology Landfill methane is a biomass renewable energy source. Recovery of landfill methane and use as LNG vehicle fuel provides reductions in climate change emissions by avoiding the emissions from the displaced fuel used from combustion of conventional gasoline and diesel fossil fuels.
Landfill gas to vehicle fuel technologies are under development but show considerable promise. The County Sanitation Districts of Los Angeles has been producing Compressed Natural Gas (CNG) vehicle fuel from landfill gas (250 scfm inlet landfill gas at 55% methane) at the Puente Hills Landfill. In Sonoma County, a landfill gas to CNG project will result in a system to fuel 6 buses.
Page 3 [July 16, 2008]

Measure Analysis for Public Distribution July 16, 2008 DRAFT
Landfill gas to LNG takes yet another step than the technical sequence from landfill gas to CNG. Prometheus Energy, Inc. is currently in shakedown phase of the first full scale landfill gas to LNG project in California located at the Orange County F.R. Bowerman Landfill.
The demonstration grant projects in the LNG from Landfill Gas Measure include a new project at the Altamont Landfill, Alameda County (GTI proposal) and significant expansion of the production at the F.R. Bowerman Landfill (Prometheus Energy Company proposal). A third landfill gas to LNG project is being developed by Prometheus Energy Company at the Kiefer Landfill, Sacramento County.
The technology to produce LNG from landfill gas includes the following four main components:
1. Landfill gas collection and control system, including the well field, headers, blowers, and flares. These systems convey landfill gas by pipe to the LNG production plant and destroy landfill gas not otherwise recovered for beneficial use.
2. Purification system to remove unwanted components such as carbon dioxide (CO2), nitrogen (N2), hydrogen sulfide (H2S), moisture, and reactive organic compounds. These systems include patented membrane filters and other systems to ensure that the converted gas meets LNG fuel standards.
3. Liquefaction system to compress and cool the purified gas to a liquid form. These systems include patented cryogenic and other refrigeration components.
4. LNG storage and dispenser systems to transfer product LNG to users. These systems may include on-site fueling stations or may transfer stored product by truck to offsite fueling systems.
More detailed information on the specific demonstration project technologies is provided in the grant proposals (see reference list) and will be documented in the final grant reports.
5. Statutory Status No additional statutory authority is required at this time to implement this measure.
6. Implementation Steps and Timeline To support efforts under the auspices of both the Climate Action Team and Bioenergy Interagency Working Group, the CIWMB approved Allocation Proposal 2006-D-17 at its February 13, 2007 Board meeting. Allocation Proposal 2006-D-17 is for Liquefied Natural Gas from Landfill Gas Demonstration Grant(s) in an amount up to $740,000 from the Integrated Waste Management Account (IWMA). The basis of this appropriation is the Fiscal Year 2006/07 Budget Act whereby the Legislature provided the following permissive funding authority from the IWMA for the Board:
“Of this appropriation, an amount not to exceed $1,000,000 may be awarded in the form of a grant for demonstration projects that convert landfill gas to liquefied natural gas (LNG) for use as a clean transportation fuel, provided that the demonstration project meets all of the following conditions:
(a) The project shall produce at least 10,000 gallons of LNG per day. (b) The project shall utilize landfill gas that is currently flared. (c) The project shall have obtained all applicable land use permits before award of the grant.
Page 4 [July 16, 2008]
Measure Analysis for Public Distribution July 16, 2008 DRAFT
The grant amount shall not exceed 15 percent of the total project cost.”
With this one-time grant program, the CIWMB would meet the requirements as stated in the Budget Act of 2006. Additionally, documentation of actual LNG production from landfill gas would occur, information would be obtained on technical and economic aspects of such production, as well as information on end-use of the LNG produced.
The CIWMB received and competitively scored three qualifying applications under this grant program and awarded on May 15, 2007, a grant totaling $740,000 to Gas Technology Institute (GTI) for a demonstration project at the Altamont Landfill and Resource Recovery Facility, Alameda County. The GTI project would provide 13,000 gpd of LNG fuel for the facility refuse collection fleet. A grant agreement was successfully negotiated and the project is in progress and scheduled for completion in May 2009. Additional funding was identified by CIWMB to partially fund a grant awarded to Prometheus Energy Company (PEC) for a demonstration project at the Kiefer Landfill, Sacramento. However, the PEC grant agreement could not be successfully negotiated and the application was withdrawn.
Additional grant funding for LNG from landfill gas demonstration projects was approved by the CARB in 2007. Pursuant to Assembly Bill (AB) 1811, CARB was required to develop a joint plan with the CEC to spend $25 million to increase the use and production of alternative fuels. On May 24, 2007, CARB awarded $610,000 in funding through the AB 1811 program to the GTI Altamont Landfill project (also funded in part by CIWMB) and $640,000 to PEC for a demonstration project at the F. R. Bowerman (Bowerman) Landfill in Orange County. The PEC project would provide 18,600 gpd of LNG fuel to the local municipal bus fleet. ARB successfully negotiated grant agreements for both projects. The total state funding approved for the GTI Altamont Landfill project is $1,350,000 with matching funds of approximately $11,000,000. The total state funding approved for the PEC Bowerman Landfill project is $640,000 with matching funds of approximately $16,800,000.
The final reports for the demonstration grant programs will be presented at a formal public meeting in July or August 2009, posted on the CIWMB’s website, and distributed by link to affected entities and other interested stakeholders and agencies.
A related outreach goal for this measure is for the technology to be transferred such that expanded production of LNG from landfill gas occurs statewide well beyond the 31,600 gpd level. CIWMB staff will explore further funding incentives or other measures to expand production and seek appropriate venues in consultation with CARB and CEC to present the report for training and technical assistance for the purpose of expanding production of LNG from landfill gas statewide.
7. Greenhouse Gas Emission Reductions Landfill methane is a biomass renewable energy source. Recovery of landfill methane and use as LNG vehicle fuel provides reductions in climate change emissions by avoiding the emissions from the displaced fuel used from combustion of conventional gasoline and diesel fossil fuels.
The PEC F.R. Bowerman landfill proposal estimates that an additional expansion of 23,600 gpd of LNG production would require only an additional roughly 3,000 scfm for a total of approximately 3,900 scfm of landfill gas utilization. The GTI grant proposal estimates 2,600 standard cubic feet per minute (scfm) of landfill gas at 50% methane content will produce 13,000 gpd LNG.
LNG is less energy dense than diesel fuel, a gallon of diesel fuel equals 1.67 gallons of LNG, on an energy content basis. Therefore, 13,000 gpd of LNG will displace 7,784 gallons of diesel fuel per day or 2,841,317 gallons of diesel fuel per year. The conversion factor used for avoided
Page 5 [July 16, 2008]
Measure Analysis for Public Distribution July 16, 2008 DRAFT
CO2 emissions is 22.5 lbs per gallon of avoided diesel fuel. Therefore, the total 31,600 gpd (11,534,000 gallons per year) of LNG from landfill gas to be demonstrated in this measure will avoid (thereby reduce) climate change emissions by 0.08 MMTCO2E per year, and displace 18,921 gpd (6,906,165 gallons per year) in diesel fuel use.
The GTI grant proposal provides the following summary of reductions from potential expansion of LNG production from landfill gas and other biogas sources beyond the demonstration projects in this measure:
“The total potential biomethane resource from landfills in California is estimated at 80 bcf (CEC-500-2005-066-D, April 2005). This resource is further supplemented by biomethane from wastewater treatment plants (11 bcf) and dairy sources (14 bcf), secondary markets for this liquefaction technology (Biomethane from Dairy Waste, July 2005). California’s current biomethane resources are estimated at 125 bcf per year, a quantity that could grow over time with expanded use of digesters. The current supply could displace over 900 million gallons per year of diesel fuel if fully used as a vehicle fuel. Recognizing there are currently other value-added uses of biomethane, if only 10% biomethane is use for vehicles (around 12.5 bcf), it could offset California’s need for imported diesel fuel by over 90 million gallons per year as well as avoid fossil fuel CO2 emissions of 1.0 million tons on an annual basis.”
Given the above potential to further expand production of LNG and avoid additional GHG emissions, a related outreach goal for this measure is to transfer the technology to other landfills throughout the State. For the purposes of this analysis, a direct reduction of 0.08 MMTCO2E per year in emissions is proposed through the 2020 compliance year with a 10% uncertainty factor. Potential reductions beyond this level from outreach are not included.
8. Costs and Cost Savings The total state funding for capital costs in 2007 dollars approved for the GTI Altamont Landfill project is $1,350,000 with matching funds of approximately $11,000,000. The total state funding approved for the PEC Bowerman Landfill project is $640,000 with matching funds of approximately $16,800,000. The total capital cost in 2007 dollars (to occur in 2009) is $29,790,000.
Detailed operations and maintenance (O&M) costs for these projects are uncertain and beyond the scope of this analysis. For the purposes of this analysis the total O&M costs are assumed on an annual basis at 10% of the total capital costs or $2,979,000 per year (2007 dollars). A cost uncertainty factor of 25% is assumed.
Landfill gas to energy projects typically use a 15-year equipment replacement cost interval for financing purposes. For this measure, replacement costs under this scenario would occur in 2024 (2007 dollars).
9. Other Benefits Additional benefits expected from the Liquefied Natural Gas (LNG) from Landfill Gas Measure include the reduction of criteria and toxic pollutants otherwise emitted by the displaced diesel fuel and landfill flare combustion, in addition to the increased production of local sources of alternative fuels.
Therefore, the total 31,600 gpd (11,534,000 gallons per year) of LNG from landfill gas to be demonstrated in this measure will avoid (thereby reduce) climate change emissions by 0.08 MMTCO2E per year, and displace 18,921 gpd (6,906,165 gallons per year) in diesel fuel use.
Page 6 [July 16, 2008]
Measure Analysis for Public Distribution July 16, 2008 DRAFT
Page 7 [July 16, 2008]
It is recommended that CARB use standard diesel emissions and landfill gas flare baseline emissions to provide a quantitative comparison of criteria and other pollutant reductions resulting from this measure. The approximate conversion for flare calculations is approximately 0.2 scfm landfill gas at 50% methane per 1 gpd LNG.
10. References April 2, 2007; GTI PROPOSAL NUMBER: 10109.1.64; Liquefied Natural Gas from Landfill Gas Demonstration Grant Submitted To: California Integrated Waste Management Board Remediation, Closure and Technical Services Branch April 2, 2007; Prometheus Energy Company; F.R. Bowerman Landfill Liquefied Natural Gas from Landfill Gas Demonstration Grant Proposal Submitted To: California Integrated Waste Management Board Remediation, Closure and Technical Services Branch April 2005; BIOMASS RESOURCE ASSESSMENT IN CALIFORNIA IN SUPPORT OF THE 2005 INTEGRATED ENERGY POLICY REPORT; Prepared for: California Energy Commission Public Interest Energy Research Program; Prepared by: California Biomass Collaborative (http://www.energy.ca.gov/2005publications/CEC-500-2005-066/CEC-500-2005-066-D.PDF)

DRAFT July 16, 2008 DRAFT
Climate Action Team Recycling and Waste Management Sector Sub Group
Scoping Plan Measure Development and Cost Analysis The purpose of this document is to provide the public with information about options considered and analyzed by the Climate Action Team (CAT) Sector Sub Groups for Air Board’s consideration and potential inclusion in the Scoping Plan. This information should be drawn from the Measure Analyses previously developed by each Sub Group. Information should only be updated to reflect significant changes in technology, staff assignments, and understanding of the issues.
Outline 1. Strategy: Waste Technology, Demonstration, Assessment, and Development ............... 1 2. Agency: CIWMB & CPUC ................................................................................................ 1 3. Strategy Description .......................................................................................................... 1
Overview ........................................................................................................................ 1 Affected Entities ............................................................................................................. 1 Related Objectives ......................................................................................................... 1 Strategy Metrics ............................................................................................................. 2 Strategy Goals and Implementation Approaches ........................................................... 2
4. Technology ........................................................................................................................ 2 5. Statutory Status ................................................................................................................. 2 6. Implementation Steps ....................................................................................................... 2 7. Greenhouse Gas Emission Reductions ............................................................................ 3 8. Costs and Cost Savings .................................................................................................... 3 9. Other Benefits ................................................................................................................... 3 10. References ........................................................................................................................ 3
[Author] July 16, 2008 Page i
DRAFT July 16, 2008 DRAFT
[Author] July 16, 2008 Page ii
[Page intentionally blank]
Measure Analysis for Public Distribution July 16, 2008 DRAFT Version 2.1
Climate Action Team Recycling and Waste Management Subgroup
Scoping Plan Measure Development and Cost Analysis The purpose of this document is to provide the public with information about options considered and analyzed by the Climate Action Team (CAT) Sector Sub Groups for Air Board’s consideration and potential inclusion in the Scoping Plan. This information should be drawn from the Measure Analyses previously developed by each Sub Group. Information should only be updated to reflect significant changes in technology, staff assignments, and understanding of the issues.
1. Strategy: Waste Technology Demonstration, Assessment, and Development
2. Agency: Integrated Waste Management Board, Public Utilities Commission, Energy Commission, Air Resources Board
3. Strategy Description Overview This strategy is to help aid the development of new technologies to reduce greenhouse gases by providing necessary funding that will assist developers in demonstrating their technology on a commercial scale. The working group has identified two potential funding mechanisms for this strategy. The first is an existing fund of approximately $500,000 that the CIWMB could dedicate to perhaps the demonstration of one waste-to-energy project. The second possible funding source is the Emerging Renewable Resource Program (ERRP), a proposed program currently under consideration at the CPUC that would provide San Diego Gas & Electric and Pacific Gas and Electric – two of the state’s three large Investor Owned Utilities (IOUs) – with $45 million over two years to demonstrate commercialization of promising emerging renewable technologies or renewable-enabling technologies. The program envisions the possibility of renewal every two years, i.e. additional funds would be available every two years, conditional upon CPUC approval. CPUC staff has requested that, for each 2 year funding cycle, each IOU include at least one project involving a biofuel technology or biofuel-enabling technology. Participating agencies include PUC, CIWMB, ARB and CEC. Additional funding may also be available through the Public Interest Energy Research (PIER) Renewables Program. The PIER Renewables Program helps accelerate research, development and demonstration (RD&D) of landfill gas to energy technologies that will help meet the targets of RPS, Bioenergy Action Plan and Executive Order S-00-06 and AB 32.
Affected Entities Affected entities range from developers of new technologies, load serving entities obligated under the state RPS, and public entities or persons who manage waste. Related Objectives This strategy combines the need to more efficiently and effectively manage or reduce the waste stream, as well as increase the state’s use of clean, renewable energy. The Governor has set a goal to increase the use of biofuels.
[July 16, 2008] Page 1

Measure Analysis for Public Distribution July 16, 2008 DRAFT Version 2.1
Strategy Metrics Please define one or more metrics for describing the size, progress, and timing of the strategy. The following are several examples of strategy metrics:
• Increased acceptance/use of technologies demonstrated using the funding – more RPS Power Purchase Agreements, etc.
Strategy Goals and Implementation Approaches Goals would include:
o Identifying the most promising technologies
o Accelerating RD&D that meets air and water quality standards
o Successfully commercializing new technologies by increasing acceptance and improving cost-effectiveness.
4. Technology This requires accelerating RD&D and help commercialize emerging and early stage technologies.
5. Statutory Status The CPUC has not yet authorized funding for emerging renewable technologies. A decision is expected early in 2008. CIWMB has an existing fund of $500,000. The PIER Program has been re-authorized to fund RD&D projects through SB 1250 with general goal of developing and helping to bring to market, energy technologies that provide increased environmental benefits, greater system reliability, and lower system costs. Specific goals include:
• “Advanced transportation technologies that reduce air pollution and greenhouse gas emissions beyond applicable standards, and that benefit electricity and natural gas ratepayers.
• “Advanced electricity generation technologies that exceed applicable standards to increase reductions in greenhouse gas emissions from electricity generation, and that benefit electric utility customers.
• “Advanced electricity technologies that reduce or eliminate consumption of water or other finite resources, increase use of renewable energy resources, or improve transmission or distribution of electricity generated from renewable energy resources.”
6. Implementation Steps a. Identify most promising projects
b. Fund most cost-effective projects
c. Make sure project development stays in line with the goals of the CPUC, PIER Program and CIWMB.
[July 16, 2008] Page 2

Measure Analysis for Public Distribution July 16, 2008 DRAFT Version 2.1
[July 16, 2008] Page 3
7. Greenhouse Gas Emission Reductions
8. Costs and Cost Savings Costs and Cost Savings: Costs include the $500,000 from CIWMB and an approximate range of $100,000 to $7 million per project from the CPUC. Funding from the CPUC will ultimately benefit electric ratepayers through any cost savings that occur from technology advances.
9. Other Benefits This strategy could result in price decreases of renewable energy purchases by introducing new technologies.
10. References List of references used in the write up.

DRAFT July 16, 2008 DRAFT
Climate Action Team Recycling and Waste Management Sector Sub Group
Scoping Plan Measure Development and Cost Analysis The purpose of this document is to provide the public with information about options considered and analyzed by the Climate Action Team (CAT) Sector Sub Groups for Air Board’s consideration and potential inclusion in the Scoping Plan. This information should be drawn from the Measure Analyses previously developed by each Sub Group. Information should only be updated to reflect significant changes in technology, staff assignments, and understanding of the issues.
Outline 1. Measure: Watershed Friendly, Sustainable Landscaping Guidelines .............................. 1 2. Agency: Integrated Waste Management Board ............................................................... 1 3. Measure Description ......................................................................................................... 1
Overview ........................................................................................................................ 1 Affected Entities ............................................................................................................. 1 Environmental Justice, Small Business, Public Health, Leakage and CEQA ................ 1 Related Objectives ......................................................................................................... 2 Measure Metrics ............................................................................................................. 2 Measure Goals and Potential Implementation Approaches ........................................... 2
4. Technology ........................................................................................................................ 2 5. Statutory Status ................................................................................................................. 2 6. Implementation Steps and Timeline .................................................................................. 3 7. Greenhouse Gas Emission Reductions ............................................................................ 3 8. Costs and Cost Savings .................................................................................................... 5 9. Other Benefits ................................................................................................................... 5 10. References ........................................................................................................................ 5
July 16, 2008 Page i
DRAFT July 16, 2008 DRAFT
July 16, 2008 Page ii
[Page intentionally blank]

Measure Analysis for Public Distribution July 16, 2008 DRAFT Version 2.1
Climate Action Team Recycling and Waste Management Sector Sub Group
Scoping Plan Measure Development and Cost Analysis The purpose of this document is to provide the public with information about options considered and analyzed by the Climate Action Team (CAT) Sector Sub Groups for Air Board’s consideration and potential inclusion in the Scoping Plan. This information should be drawn from the Measure Analyses previously developed by each Sub Group. Information should only be updated to reflect significant changes in technology, staff assignments, and understanding of the issues.
1. Measure: Watershed Friendly, Sustainable Landscaping Guidelines
2. Agency: Integrated Waste Management Board
3. Measure Description Overview Develop “Watershed-Friendly” Landscaping Guidelines for adoption and customization for local climates and conditions. The guidelines will conserve water, reduce green waste, reduce air pollution, and protect water quality. Adoption of these guidelines would reduce GHG emissions related to transportation of green material and generation of methane related to disposal of green materials in landfills. The guidelines can also reduce fossil fuel consumption by reducing landscape power equipment usage and by reducing the use of chemical fertilizers. The guidelines will also reduce GHG emissions related to water treatment and distribution.
Affected Entities This strategy could affect the landscape industry, local government, and development community (especially production homebuilders). This could affect homeowners depending on the aggressiveness of any local ordinances adopted. As an example of how this could be implemented locally, the Metropolitan Water District of Southern California currently offers financial incentives to home builders to install “California Friendly” landscaping and weather-based irrigation controllers. Environmental Justice, Small Business, Public Health, Leakage and CEQA This measure originated in a community based effort to protect surface waters (specifically the San Francisco Bay watershed) and has been vetted by environmental, citizen, municipal, and industry groups. The measure is intended to protect public environmental resources accessible and used by all Californians and therefore would have no Environmental Justice ramifications. There are no known impacts on small businesses other than potential changes needed by landscapers and property managers. These impacts would most likely be predominantly related to practices and not likely require significant capital outlays. These practices are unlikely to result in any leakages as their primary intention is to mitigate non-GHG related environmental impacts. These practices could be used as mitigation
July 16,2008 Page 1
Measure Analysis for Public Distribution July 16, 2008 DRAFT Version 2.1
measures to resolve negative environmental impacts related to development of specific projects.
Related Objectives The strategy is motivated primarily by non-greenhouse gas benefits. The primary objective of this effort is the protection of watersheds through the use of sustainable landscaping practices. The secondary motivation is the reduction in and on-site management of green waste.
Measure Metrics Metrics would include the number of local governments adopting “Watershed-Friendly” Landscaping Guidelines, green waste diversion from landfills, reduction in water consumption, avoided fuel consumption, and reductions in pesticides and fertilizers found in local watersheds. While there is some data available regarding reduced water consumption in some applications, there is no existing source of data regarding the GHG reductions resulting from the implementation of this measure.
Measure Goals and Potential Implementation Approaches The measure goals and implementation approaches are not quantified at this time.
4. Technology This would require changes in the landscaping practices used in California. Traditional water and chemical intensive landscaping practices would need to be discouraged or prohibited. Most technology required is relatively low-tech and currently available. (Weather-based irrigation controllers, moisture sensors, mulching mowers, compost bins, organic soil amendments, education and outreach, development of knowledge base)
5. Statutory Status This may require a statutory requirement for the adoption of landscaping ordinances by local government or mandatory changes in current landscaping practices. This could require development of regulations. Guidelines could be developed in the near term without statutory support. Local governments could be encouraged to adopt sustainable landscaping guidelines without mandate. (Indeed, they already have financial incentive based on the reduction of infrastructure needed for water treatment and storm-water management.) Existing statute, AB 1881, requirements are consistent with the proposals included in this measure. Assembly Bill 1881 was passed by the Legislature and signed by the Governor on September 28, 2006. The legislation’s key provisions include:
• The California Department of Water Resources (DWR) is directed to update the State Model Water Efficient Landscape Ordinance, based on recommendations set forth in the Landscape Task Force report, by January 1, 2009;
• Local ordinances must be “at least as effective as” the State Model Ordinance by January 1, 2010;
• Charter cities and counties, once exempt, are now subject to these regulations; • Common interest development (property owners associations) shall not prohibit the use
of low water-using plants; • The California Energy Commission (CEC) is directed to adopt performance standards
and labeling requirements for landscape irrigation controllers and moisture sensors by 2010;
July 16,2008 Page 2
Measure Analysis for Public Distribution July 16, 2008 DRAFT Version 2.1
• The sale or installation of irrigation controllers or moisture sensors is prohibited unless the equipment meets the requirements adopted by the CEC by 2012; and
• Directs water purveyors to require separate landscape water meters for new development with landscaped area greater than 5,000 square feet by 2008, excluding single-family homes.
6. Implementation Steps and Timeline • Develop generic guidelines • Develop outreach strategy • Monitor adoption by locals • Monitor environmental impacts related to implementation of guidelines
7. Greenhouse Gas Emission Reductions
While there is little doubt that there would be significant impacts related to the implementation of this strategy, there is little data available upon which to base GHG reduction calculations. Green waste reduction from adoption of sustainable landscaping practices could be significant, as well as major reductions in water consumption. The Alameda County Climate Change Protection Project has estimated GHG reductions based on implementing Bay-Friendly Landscaping Guidelines in Alameda County. Assuming the Bay-Friendly Landscaping Guidelines are utilized on 50% of the landscape acreage in California by 2020, estimated GHG reductions is 2.7 MMTCO2E per year. 1. Select plants that require less shearing, reduce lawn size, and grasscycle
Estimated annual CO2e gross reduction = 1,711,465 tons Estimated annual CO2e gross reduction: 2.5 tons per acre 2.5 tons per acre x 1,369,148 acres x .50 (% adopting landscaping guidelines)
= 1,711,465 Assumptions:
- Approximately 8 tons of yard waste per acre, per year can be avoided by implementing this group of measures http://www.ciwmb.ca.gov/organics/Landscaping/KeepGreen/Manage.htm
- National average methane recovery rate at the landfill is ~50% - No sequestration factor at the landfill has been take into account - 1,369,148 acres based on An Economic Analysis of Environmental
Horticulture With A Focus on California, Scott R. Templeton, Assistant Research Economist. UC Berkeley
Emission Factor : - Gross methane emissions factor of yard waste at landfill is 0.686 tons
CO2e per ton of yard waste (CACP software)
2. Keep green waste on-site to reduce transport to the landfill
Estimated annual CO2e reduction = 787,260 tons Estimated annual CO2e reduction: 1.15 tons (2,300 lbs)
July 16,2008 Page 3
Measure Analysis for Public Distribution July 16, 2008 DRAFT Version 2.1
1.15 tons/acre x 1,369,148 acres x .50 (% adopting landscaping guidelines) = 787, 260 tons
Assumptions: - Approximately 8 tons of yard waste per acre, per year can be avoided - This measure eliminates twelve, 50-mile trips by heavy, diesel-fuelled
trucks to get the yard waste to the landfill, which equals 600 VMT annually
- Fuel efficiency Diesel Heavy truck = 5.6 mpg Emission Factor:
- The GHG Emission Factor for a diesel heavy truck is: 21.166 lbs. of CO2e per U.S. gallon (CACP software)
3. Avoid fuel consumption due to avoided trimming and mowing
Estimated annual CO2e reduction: 107,820 tons Estimated annual CO2e reduction: 315 lbs. per acre .1575 tons/ acre x 1,369,148 acres x .50 (% adopting landscaping guidelines) =
107,820 tons Assumptions:
- On average, 15 gallons of gas are consumed per acre of lawn Emission Factor:
- The GHG Emission Factor for a gasoline is: 21.501 lbs. of CO2e per U.S. gallon (CACP software)
4. Avoid irrigation by choosing appropriately sized lawns, choosing appropriate plant species, and using compost and mulch
Estimated annual CO2e reduction: 114,523 tons Estimated annual CO2e reduction: 54 lbs. per year per single family lawn or
9,450 tons for the whole Alameda County (assuming all households have single lawns)
8,483,149 single family lawns x 54 lbs per single family lawn = 229,045 tons 229,045 tons x .50 (percent adopting landscaping guidelines) = 114,523 tons Assumptions:
- Sustainable landscaping practices can reduce water consumption by 50 percent (provided by Bay Friendly Landscaping)
- In Costal areas of California, an average home–single family lawn consumes 55,395 gal of water/year (0.17 acre-feet of water/year) http://www.ppic.org/content/pubs/cep/EP_706EHEP.pdf
- There are about 350,000 households in Alameda County - For every million gallons of water, 3,950 kWh are consumed in Northern
California (California Energy Commission) http://www.energy.ca.gov/2005publications/CEC-700-2005-011/CEC-
700-2005-011-SF.PDF
- 7,533, 408 detached homes + 949,741 attached homes = 8,483,149 single family homes http://www.dof.ca.gov/HTML/DEMOGRAP/ReportsPapers/Estimates/E5/E5-06/documents/E-5a.xls
July 16,2008 Page 4

Measure Analysis for Public Distribution July 16, 2008 DRAFT Version 2.1
- Emission Factor:
- The GHG emission factor for average grid electricity delivered by PG&E in 2005 is: 0.49 lbs. of CO2e per kWh (PG&E)
Total estimated GHG reductions is 2.7 MMTCO2E per year based on implementation of Bay-Friendly Landscaping Guidelines on 50% of the landscape acreage in California by 2020.
8. Costs and Cost Savings
1. Costs for implantation should be minimal. The effects in implementation are mostly changes in landscaping practices and will have minimal capital costs associated with them. People and communities would be required to use plants that are adaptable to local climate and soil conditions. (eg, turf might not work well in Riverside)
2. Cost savings should greatly exceed expenses.
3. Reduced damages to hardscape (streets, sidewalks, fences, building
foundations) due to reduced water run-off are significant.
4. Consumers would benefit by reduced water bills.
5. Municipalities would benefit by reduced capital costs associated with stormwater management, water treatment, and pumping and distribution.
6. Municipalities would also benefit from reduced green waste management
costs (transportation, management, disposal).
9. Other Benefits
Emissions reductions due to less energy consumption related to water treatment, pumping and distribution; Less particulate emissions related to landscaping equipment (mowers, blowers, edgers, etc.); Reduced consumption of fossil fuels related to manufacturing less chemical fertilizers; Reduced surface water pollution;
10. References 1. An Economic Analysis of Environmental Horticulture With A Focus on California, Scott R. Templeton, Assistant Research Economist. UC Berkeley
2. Alameda County Climate Protection Project
3. StopWaste.org’s Bay-Friendly Landscaping Guidelines www.stopwaste.org
July 16,2008 Page 5
Measure Analysis for Public Distribution July 16, 2008 DRAFT Version 2.1
July 16,2008 Page 6
4. Department of Finance:
http://www.dof.ca.gov/HTML/DEMOGRAP/ReportsPapers/Estimates/E5/E5-06/E-5text2.php