reconstruction of sectional images in frequency-domain based photoacoustic imaging
TRANSCRIPT
Reconstruction of sectional images in frequency-
domain based photoacoustic imaging
Banghe Zhu* and Eva M. Sevick-Muraca
Center for Molecular Imaging, The Brown Foundation Institute of Molecular Medicine, The University of Texas
Health Science Center at Houston, Houston, Texas 77030, USA *[email protected]
Abstract: Photoacoustic (PA) imaging is based upon the generation of an
ultrasound pulse arising from subsurface tissue absorption due to pulsed
laser excitation, and measurement of its surface time-of-arrival. Expensive
and bulky pulsed lasers with high peak fluence powers may provide
shortcomings for applications of PA imaging in medicine and biology.
These limitations may be overcome with the frequency-domain PA
measurements, which employ modulated rather than pulsed light to generate
the acoustic wave. In this contribution, we model the single modulation
frequency based PA pressures on the measurement plane through the
diffraction approximation and then employ a convolution approach to
reconstruct the sectional image slices. The results demonstrate that the
proposed method with appropriate data post-processing is capable of
recovering sectional images while suppressing the defocused noise resulting
from the other sections.
©2011 Optical Society of America
OCIS codes: (170.2655) Functional monitoring and imaging; (170.5120) Photoacoustic
imaging; (170.6960) Functional monitoring and imaging; (170.3660) Light propagation in
tissues.
References and Links
1. X. Wang, Y. Pang, G. Ku, X. Xie, G. Stoica, and L. V. Wang, “Non-invasive laser-induced photoacoustic
tomography for structural and functional imaging of the brain in vivo,” Nat. Biotechnol. 21(7), 803–806 (2003).
2. H. P. Brecht, R. Su, M. Fronheiser, S. A. Ermilov, A. Conjusteau, and A. A. Oraevsky, “Whole-body three-
dimensional opto-acoustic tomography system for small animals,” J. Biomed. Opt. 14(6), 064007 (2009).
3. D. Razansky, M. Distel, C. Vinegoni, R. Ma, N. Perrimon, R. W. Köster, and V. Ntziachristos, “Multispectral
opto-acoustic tomography of deep-seated fluorescent proteins in vivo,” Nat. Photonics 3(7), 412–417 (2009).
4. Y. Sun and H. Jiang, “Quantitative three-dimensional photoacoustic tomography of the finger joints: phantom
studies in a spherical scanning geometry,” Phys. Med. Biol. 54(18), 5457–5467 (2009).
5. L. V. Wang, “Prospects of photoacoustic tomography,” Med. Phys. 35(12), 5758–5767 (2008).
6. L. V. Wang, “Multiscale photoacoustic microscopy and computed tomography,” Nat. Photonics 3(9), 503–509
(2009).
7. B. T. Cox, S. R. Arridge, and P. C. Beard, “Estimating chromophore distributions from multiwavelength
photoacoustic images,” J. Opt. Soc. Am. A 26(2), 443–455 (2009).
8. L. V. Wang, “Tutorial on photoacoustic microscopy and computed tomography,” IEEE J. Sel. Top. Quantum
Electron. 14(1), 171–179 (2008).
9. B. E. Treeby and B. T. Cox, “k-Wave: MATLAB toolbox for the simulation and reconstruction of photoacoustic
wave fields,” J. Biomed. Opt. 15(2), 021314 (2010).
10. N. Baddour, “Theory and analysis of frequency-domain photoacoustic tomography,” J. Acoust. Soc. Am. 123(5),
2577–2590 (2008).
11. A. Petschke and P. J. La Rivière, “Comparison of intensity-modulated continuous-wave lasers with a chirped
modulation frequency to pulsed lasers for photoacoustic imaging applications,” Biomed. Opt. Express 1(4),
1188–1195 (2010).
12. K. Maslov and L. V. Wang, “Photoacoustic imaging of biological tissue with intensity-modulated continuous-
wave laser,” J. Biomed. Opt. 13(2), 024006 (2008).
13. U. Schnars and W. P. O. Jutner, “Digital recording and numerical reconstruction of holograms,” Meas. Sci.
Technol. 13(9), R85–R101 (2002).
14. X. Zhang, E. Y. Lam, and T. C. Poon, “Reconstruction of sectional images in holography using inverse
imaging,” Opt. Express 16(22), 17215–17226 (2008).
#152622 - $15.00 USD Received 14 Sep 2011; revised 4 Oct 2011; accepted 5 Oct 2011; published 1 Nov 2011(C) 2011 OSA 7 November 2011 / Vol. 19, No. 23 / OPTICS EXPRESS 23286

15. E. Y. Lam, X. Zhang, H. Vo, T. C. Poon, and G. Indebetouw, “Three-dimensional microscopy and sectional
image reconstruction using optical scanning holography,” Appl. Opt. 48(34), H113–H119 (2009).
16. Z. Yuan, C. Wu, H. Zhao, and H. Jiang, “Imaging of small nanoparticle-containing objects by finite-element-
based photoacoustic tomography,” Opt. Lett. 30(22), 3054–3056 (2005).
17. Z. Yuan, Q. Wang, and H. Jiang, “Reconstruction of optical absorption coefficient maps of heterogeneous media
by photoacoustic tomography coupled with diffusion equation based regularized Newton method,” Opt. Express
15(26), 18076–18081 (2007).
18. M. S. Patterson, B. Chance, and B. C. Wilson, “Time resolved reflectance and transmittance for the non-invasive
measurement of tissue optical properties,” Appl. Opt. 28(12), 2331–2336 (1989).
19. E. M. Sevick, B. Chance, J. Leigh, S. Nioka, and M. Maris, “Quantitation of time- and frequency-resolved
optical spectra for the determination of tissue oxygenation,” Anal. Biochem. 195(2), 330–351 (1991).
20. F. Fedele, J. P. Laible, and M. J. Eppstein, “Coupled complex adjoint sensitivities for frequency-domain
fluorescence tomography: theory and vectorized implementation,” J. Comput. Phys. 187(2), 597–619 (2003).
21. P. Baluk, J. Fuxe, H. Hashizume, T. Romano, E. Lashnits, S. Butz, D. Vestweber, M. Corada, C. Molendini, E.
Dejana, and D. M. McDonald, “Functionally specialized junctions between endothelial cells of lymphatic
vessels,” J. Exp. Med. 204(10), 2349–2362 (2007).
22. J. C. Rasmussen, I. C. Tan, M. V. Marshall, C. E. Fife, and E. M. Sevick-Muraca, “Lymphatic imaging in
humans with near-infrared fluorescence,” Curr. Opin. Biotechnol. 20(1), 74–82 (2009).
23. C. Kim, K. H. Song, F. Gao, and L. V. Wang, “Sentinel lymph nodes and lymphatic vessels: noninvasive dual-
modality in vivo mapping by using indocyanine green in rats--volumetric spectroscopic photoacoustic imaging
and planar fluorescence imaging,” Radiology 255(2), 442–450 (2010).
24. A. D. Klose and E. W. Larsen, “Light transport in biological tissue based on the simplified spherical harmonics
equations,” J. Comput. Phys. 220(1), 441–470 (2006).
25. Y. Lu, B. Zhu, H. Shen, J. C. Rasmussen, G. Wang, and E. M. Sevick-Muraca, “A parallel adaptive finite
element simplified spherical harmonics approximation solver for frequency domain fluorescence molecular
imaging,” Phys. Med. Biol. 55(16), 4625–4645 (2010).
26. H. Shen and G. Wang, “A tetrahedron-based inhomogeneous Monte Carlo optical simulator,” Phys. Med. Biol.
55(4), 947–962 (2010).
27. X. Zhang and E. Y. Lam, “Edge-preserving sectional image reconstruction in optical scanning holography,” J.
Opt. Soc. Am. A 27(7), 1630–1637 (2010).
1. Introduction
In recent years photoacoustic (PA) imaging has experienced rapid development in the
biophotonics community [1–7]. PA takes the advantage of both the optical and ultrasonic
imaging modalities, promising high-resolution structural and functional imaging of tissue [8].
Pulsed lasers are generally used to induce ultrasonic waves that originate from transient
absorption of the propagating light pulse creating a local tissue expansion. The local
expansion generates an ultrasonic pulse that travels to the tissue interface for facile detection.
The pressure of PA wave is detected by ultrasound transducers positioned outside or on the
surface of tissue and can be used to reconstruct the origin of the initial PA pulse. The
technique is thus suitable for quantifying tissue properties or identifying pathological
structures. PA has been demonstrated to image the blood vasculature in both small animals
and humans via high resolution [9]. However, time-domain PA requires a short laser pulses in
order to fulfill the assumptions upon which PA imaging is based [10]. In addition, expensive
and bulky pulsed lasers with high peak powers can limit time-domain PA applications in
medicine and biology.
Frequency-domain (FD) based PA methodologies may offer an attractive alternative
measurement scheme although its signal-to-noise ratio (SNR) is 20dB - 40 dB worse than that
of pulse system [11, 12]. In this approach, instead of a pulse of laser light, the tissue or object
surface is illuminated with intensity-modulated continuous-wave (CW) laser or laser diode as
an excitation source. Generally the modulation frequency in FD-based PA imaging system is
scanned over the frequency range of interest to preserve full axial (depth) resolution, but this
method may be time-consuming and can complicate instrumentation. Recently, a single-
frequency detection using amplitude-based axial resolution has been demonstrated for
imaging subsurface blood vessels in tissues [12]. However, in order to localize the PA sources
one needs to sweep the modulation frequency within the bandwidth of ultrasonic transducer.
Herein we propose a convolution approach for the reconstruction of sectional images in
FD based PA imaging using the complex information (i.e. both amplitude and phase). In our
#152622 - $15.00 USD Received 14 Sep 2011; revised 4 Oct 2011; accepted 5 Oct 2011; published 1 Nov 2011(C) 2011 OSA 7 November 2011 / Vol. 19, No. 23 / OPTICS EXPRESS 23287
method, the PA pressure on the measurement plane is modeled using diffraction
approximation and the inversion is implemented by performing the convolution operation and
appropriate post-processing. This approach is similar to digital holography [13–15], and is the
first time, to the best our knowledge, to be introduced to the FD based photoacosutic
tomography. In comparison to digital holography PA based methods have a significant
advantage in that the ultrasound amplitude attenuation is two orders of magnitude less than
that of a propagating light imaging, allowing the acoustic waves to travel long distances in
tissue without significant distortion or attenuation. Thus, the technique may be especially
suitable to image deep biological tissues if incident fluence rates can be reasonably controlled
and interference from other light absorbing structures not within the focus plane can be
accounted for. To remove the defocused noise from the other sections, only real part of the
reconstructed sectional image was used. Then the finding of maximum focus measure instead
of sweeping modulation frequency was applied to determine the depth information. Combined
with the light propagation model in tissue, the absorption coefficients of blood vessels can be
quantitatively retrieved, making it possible for functional imaging.
2. Methods
2.1 Photoacoustic wave equation
In the frequency domain, the generation and propagation of laser-induced acoustic wave
through highly scattering media (such as biological tissue) can be described by the following
Helmholtz-like equation [10, 16, 17]:
( ) ( )( )
( )2 2 0
0 0, ,
p
c rp r k p r ik A r
C
βω ω
Φ∇ + = = Φ
(1)
where p is the pressure wave; 0 0
/k cω= is the wavenumber related to the angular frequency
ω and the speed of the acoustic wave 0
c in the tissue; β is the isobaric volume expansion
coefficient; p
C is the specific heat; Φ is the absorbed light energy density that is the product
of the optical absorption coefficient, a
µ , and optical fluence, Ψ (i.e. a
µΦ = Ψ ); and
0
0
p
ckA i
C
β= . To recover the optical absorption coefficient
aµ from the pressure wave
( ),p r ω
, the distribution of photon fluence Ψ in scattering media is required.
2.2 Light propagation in scattering media
The gold standard for describing light propagation in turbid media is the radiative transport
equation (RTE). However, a direct solution of RTE is a challenging task even with high
performance computers. Instead, an approximation to the radiative transport equation is used
and has been accomplished in biological tissues [18]. In this approximation, the multiply
scattered light intensity is described by the diffusion equation, which is given in the frequency
domain over a 3D bounded domain Ω by [19, 20]
( )D k S on−∇ ∇Ψ + Ψ = Ωi
(2)
and subject to the Robin boundary conditions on the domain boundary ∂Ω of
( ) 0n D b on∇Ψ + Ψ = ∂Ωi
(3)
#152622 - $15.00 USD Received 14 Sep 2011; revised 4 Oct 2011; accepted 5 Oct 2011; published 1 Nov 2011(C) 2011 OSA 7 November 2011 / Vol. 19, No. 23 / OPTICS EXPRESS 23288
where the excitation source S is intensity modulated at angular frequency ω and propagates
through medium resulting in the complex photon fluence Ψ ; a
ik
c
ωµ= + is the decay
coefficient described by the angular frequency ω and the speed of light c in the tissue; the
optical diffusion coefficient D is given by ( )'1/ 3 ,a sD µ µ= + where '
sµ is the reduced optical
scattering coefficient; and the Robin boundary coefficient b is governed by the reflection
coefficient R range from 0 (no reflectance) to 1 (total reflectance), ( )( )1
.2 1
Rb
R
−=
+
2.3 Reconstruction of sectional images by the convolution approach
The PA wave on the measurement plane ( ), , 0x y z = can be expressed as the assembly of the
spherical waves which converge at the different points ( , , )zζ η within the tissue. The
measured acoustic wave ( ), ,p x y ω can be computed by the diffraction formula:
( ) ( ) ( ), , , , , , , ,p x y A z g x y z d d dzω ζ η ζ η ζ η
+∞
−∞= Φ∫∫ ∫ (4)
where the impulse response ( )g , , , ,x y zζ η originating from ( , , )zζ η and detected at ( , )x y is
given by
( )( ) ( )
( ) ( )
2 22
2 22
2exp
, , , ;
i z x yi
g x y z
z x y
πζ η
λζ ηλ ζ η
− + − + − =+ − + −
(5)
where λ is the wavelength of the acoustic wave. The mathematical approach was first applied
for numerical reconstruction of suboptical holography and later for optical holograms [13].
Since Eq. (5) represents a shift-invariant linear system characterized by
( ) ( )g , , , g , ,x y x yζ η ζ η= − − the diffraction integral is a convolution. For discretized
sectional images, z can be denoted by 1 2, ,....,
Mz z z and the PA pressure wave on the
measurement plane ( , )x y can be represented by a summation:
( ) ( )
1, , ( ) , ,
M
mmp x y A g x y zω
== Φ⊗∑
(6)
where ( ) 2 2 2 2 2 22, ; exp
m m m
ig x y z i z x y z x y
πλ λ
= − + + + + ; and ⊗ represents the
convolution operator. The impulse response function, g, has a different form compared to that
from sweeping modulation frequency and also the convolution is operated in the space
domains x and y , not the space domain z described in the reference [12].
2.4 Data post-processing
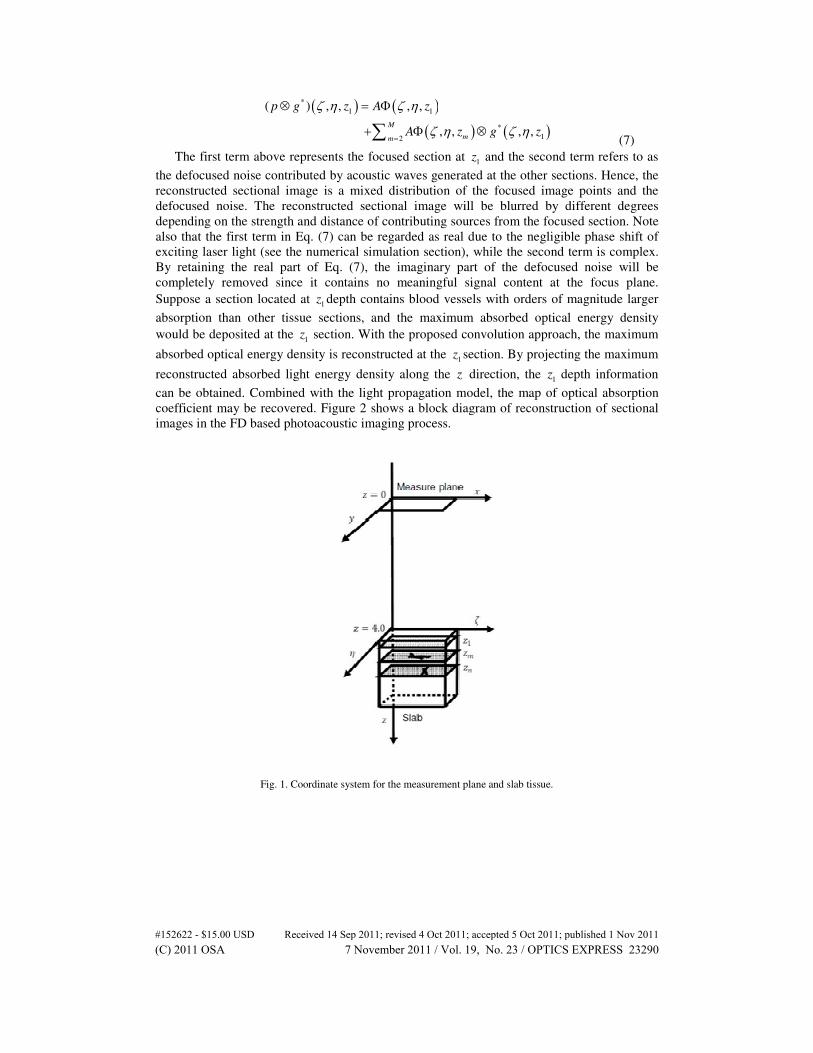
Suppose the focused plane is located at 1
z , as shown in Fig. 1. A reconstruction of this
sectional image requires recovering ( )1Φ , ,A zζ η from the PA wave of ( ), , .p x y ω The
conventional approach to obtain sectional images involves computing the convolution of PA
wave with the conjugate of the impulse response *( )g at the focused position 1
z :
#152622 - $15.00 USD Received 14 Sep 2011; revised 4 Oct 2011; accepted 5 Oct 2011; published 1 Nov 2011(C) 2011 OSA 7 November 2011 / Vol. 19, No. 23 / OPTICS EXPRESS 23289
( ) ( )
( ) ( )
*
1 1
*
12
( ) , , , ,
, , , ,M
mm
p g z A z
A z g z
ζ η ζ η
ζ η ζ η=
⊗ = Φ
+ Φ ⊗∑ (7)
The first term above represents the focused section at 1
z and the second term refers to as
the defocused noise contributed by acoustic waves generated at the other sections. Hence, the
reconstructed sectional image is a mixed distribution of the focused image points and the
defocused noise. The reconstructed sectional image will be blurred by different degrees
depending on the strength and distance of contributing sources from the focused section. Note
also that the first term in Eq. (7) can be regarded as real due to the negligible phase shift of
exciting laser light (see the numerical simulation section), while the second term is complex.
By retaining the real part of Eq. (7), the imaginary part of the defocused noise will be
completely removed since it contains no meaningful signal content at the focus plane.
Suppose a section located at 1
z depth contains blood vessels with orders of magnitude larger
absorption than other tissue sections, and the maximum absorbed optical energy density
would be deposited at the 1
z section. With the proposed convolution approach, the maximum
absorbed optical energy density is reconstructed at the 1
z section. By projecting the maximum
reconstructed absorbed light energy density along the z direction, the 1
z depth information
can be obtained. Combined with the light propagation model, the map of optical absorption
coefficient may be recovered. Figure 2 shows a block diagram of reconstruction of sectional
images in the FD based photoacoustic imaging process.
Fig. 1. Coordinate system for the measurement plane and slab tissue.
#152622 - $15.00 USD Received 14 Sep 2011; revised 4 Oct 2011; accepted 5 Oct 2011; published 1 Nov 2011(C) 2011 OSA 7 November 2011 / Vol. 19, No. 23 / OPTICS EXPRESS 23290
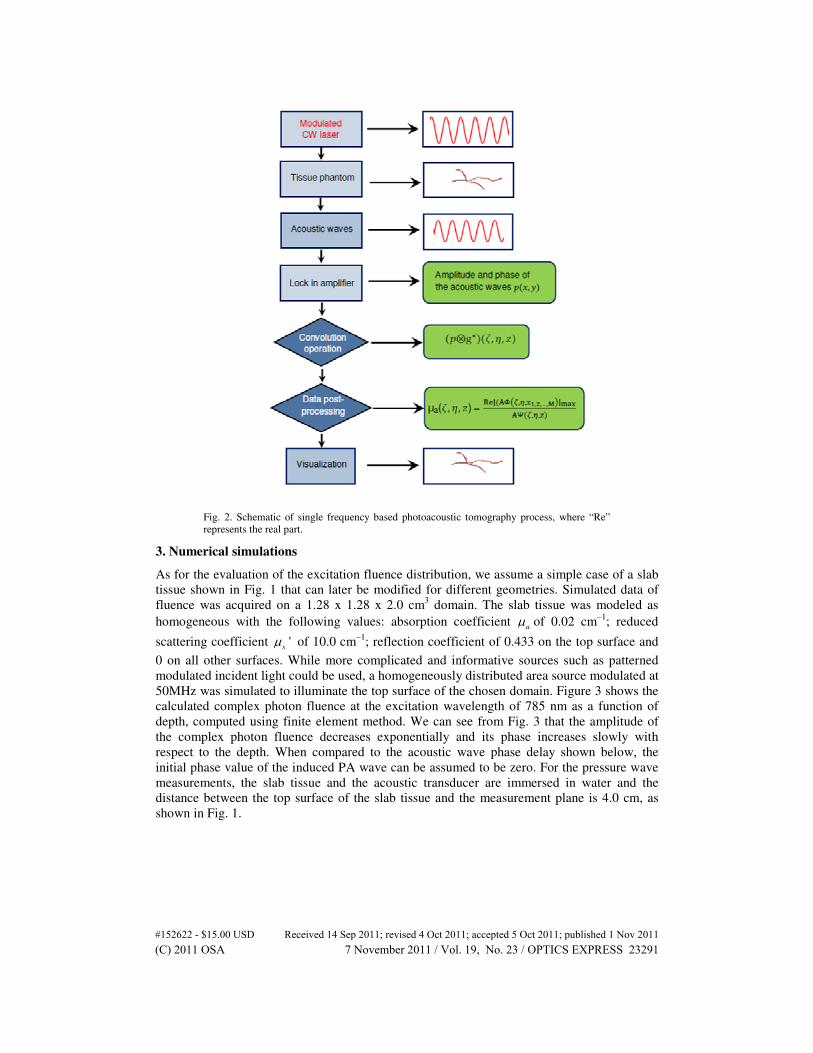
Fig. 2. Schematic of single frequency based photoacoustic tomography process, where “Re”
represents the real part.
3. Numerical simulations
As for the evaluation of the excitation fluence distribution, we assume a simple case of a slab
tissue shown in Fig. 1 that can later be modified for different geometries. Simulated data of
fluence was acquired on a 1.28 x 1.28 x 2.0 cm3 domain. The slab tissue was modeled as
homogeneous with the following values: absorption coefficient a
µ of 0.02 cm−1
; reduced
scattering coefficient 's
µ of 10.0 cm−1
; reflection coefficient of 0.433 on the top surface and
0 on all other surfaces. While more complicated and informative sources such as patterned
modulated incident light could be used, a homogeneously distributed area source modulated at
50MHz was simulated to illuminate the top surface of the chosen domain. Figure 3 shows the
calculated complex photon fluence at the excitation wavelength of 785 nm as a function of
depth, computed using finite element method. We can see from Fig. 3 that the amplitude of
the complex photon fluence decreases exponentially and its phase increases slowly with
respect to the depth. When compared to the acoustic wave phase delay shown below, the
initial phase value of the induced PA wave can be assumed to be zero. For the pressure wave
measurements, the slab tissue and the acoustic transducer are immersed in water and the
distance between the top surface of the slab tissue and the measurement plane is 4.0 cm, as
shown in Fig. 1.
#152622 - $15.00 USD Received 14 Sep 2011; revised 4 Oct 2011; accepted 5 Oct 2011; published 1 Nov 2011(C) 2011 OSA 7 November 2011 / Vol. 19, No. 23 / OPTICS EXPRESS 23291
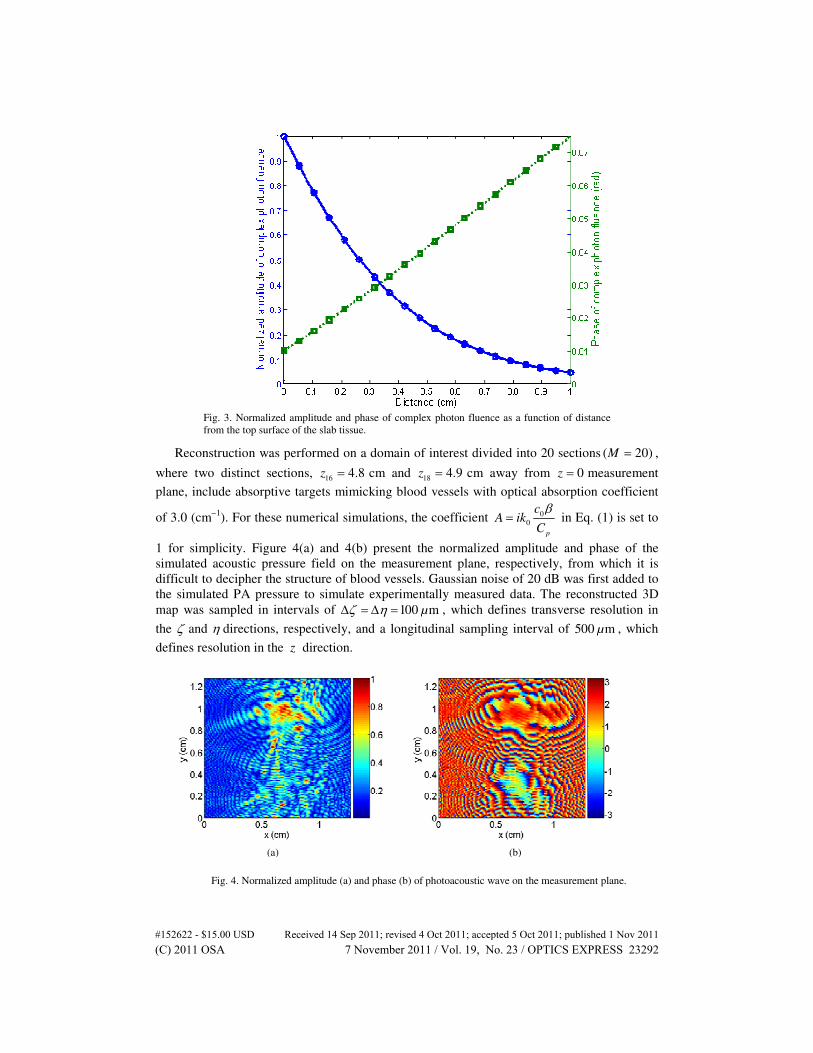
Fig. 3. Normalized amplitude and phase of complex photon fluence as a function of distance
from the top surface of the slab tissue.
Reconstruction was performed on a domain of interest divided into 20 sections ( 20)M = ,
where two distinct sections, 16
4.8z = cm and 18
4.9z = cm away from 0z = measurement
plane, include absorptive targets mimicking blood vessels with optical absorption coefficient
of 3.0 (cm−1
). For these numerical simulations, the coefficient 0
0
p
ckA i
C
β= in Eq. (1) is set to
1 for simplicity. Figure 4(a) and 4(b) present the normalized amplitude and phase of the
simulated acoustic pressure field on the measurement plane, respectively, from which it is
difficult to decipher the structure of blood vessels. Gaussian noise of 20 dB was first added to
the simulated PA pressure to simulate experimentally measured data. The reconstructed 3D
map was sampled in intervals of 100 mµζ η∆ = ∆ = , which defines transverse resolution in
the ζ and η directions, respectively, and a longitudinal sampling interval of 500 mµ , which
defines resolution in the z direction.
Fig. 4. Normalized amplitude (a) and phase (b) of photoacoustic wave on the measurement plane.
(a) (b)
#152622 - $15.00 USD Received 14 Sep 2011; revised 4 Oct 2011; accepted 5 Oct 2011; published 1 Nov 2011(C) 2011 OSA 7 November 2011 / Vol. 19, No. 23 / OPTICS EXPRESS 23292
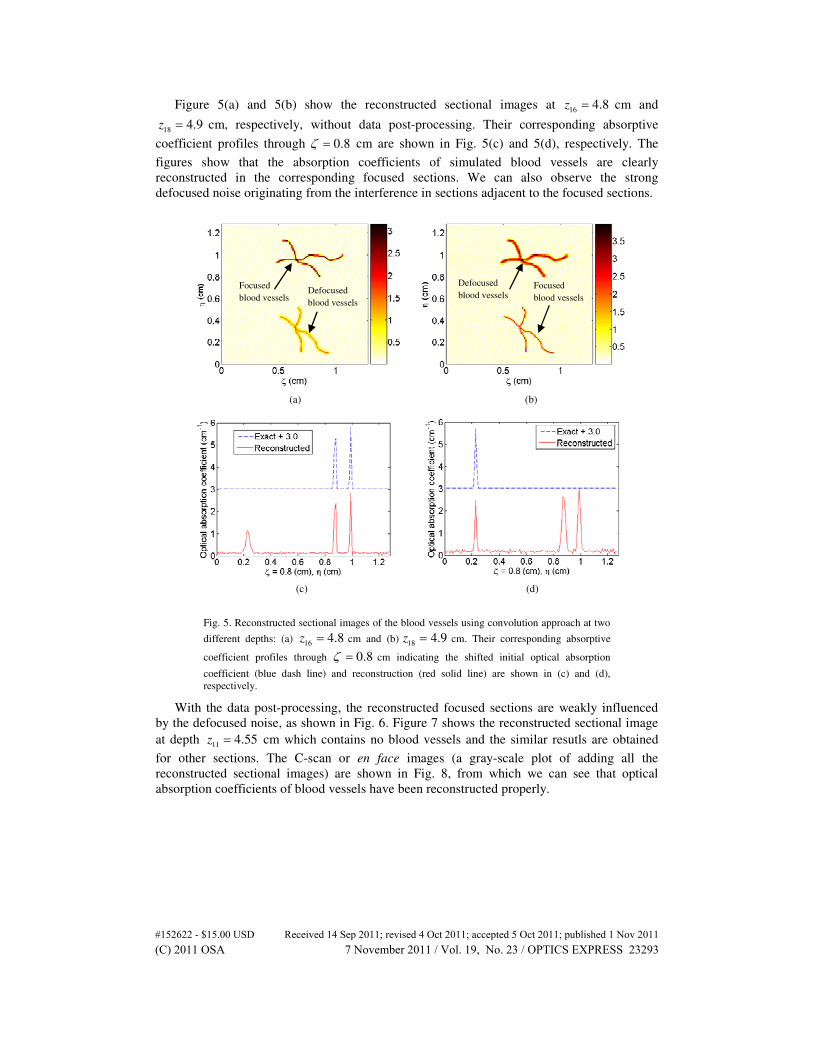
Figure 5(a) and 5(b) show the reconstructed sectional images at 16
4.8z = cm and
184.9z = cm, respectively, without data post-processing. Their corresponding absorptive
coefficient profiles through 0.8ζ = cm are shown in Fig. 5(c) and 5(d), respectively. The
figures show that the absorption coefficients of simulated blood vessels are clearly
reconstructed in the corresponding focused sections. We can also observe the strong
defocused noise originating from the interference in sections adjacent to the focused sections.
Fig. 5. Reconstructed sectional images of the blood vessels using convolution approach at two
different depths: (a) 16
4.8z = cm and (b)18
4.9z = cm. Their corresponding absorptive
coefficient profiles through 0.8ζ = cm indicating the shifted initial optical absorption
coefficient (blue dash line) and reconstruction (red solid line) are shown in (c) and (d),
respectively.
With the data post-processing, the reconstructed focused sections are weakly influenced
by the defocused noise, as shown in Fig. 6. Figure 7 shows the reconstructed sectional image
at depth 11
55 4.z = cm which contains no blood vessels and the similar resutls are obtained
for other sections. The C-scan or en face images (a gray-scale plot of adding all the
reconstructed sectional images) are shown in Fig. 8, from which we can see that optical
absorption coefficients of blood vessels have been reconstructed properly.
Focused
blood vessels Defocused
blood vessels
Defocused
blood vessels Focused
blood vessels
(a) (b)
(c) (d)
#152622 - $15.00 USD Received 14 Sep 2011; revised 4 Oct 2011; accepted 5 Oct 2011; published 1 Nov 2011(C) 2011 OSA 7 November 2011 / Vol. 19, No. 23 / OPTICS EXPRESS 23293
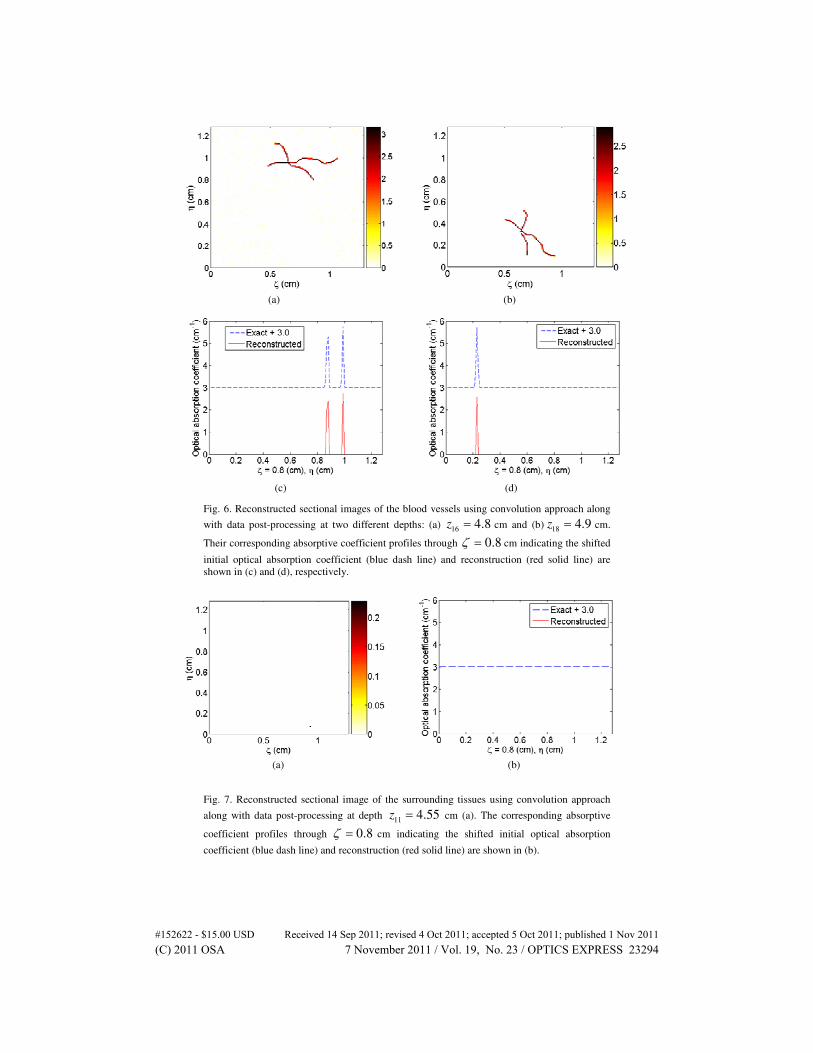
Fig. 6. Reconstructed sectional images of the blood vessels using convolution approach along
with data post-processing at two different depths: (a) 16
4.8z = cm and (b)18
4.9z = cm.
Their corresponding absorptive coefficient profiles through 0.8ζ = cm indicating the shifted
initial optical absorption coefficient (blue dash line) and reconstruction (red solid line) are
shown in (c) and (d), respectively.
Fig. 7. Reconstructed sectional image of the surrounding tissues using convolution approach
along with data post-processing at depth 11
55 4.z = cm (a). The corresponding absorptive
coefficient profiles through 0.8ζ = cm indicating the shifted initial optical absorption
coefficient (blue dash line) and reconstruction (red solid line) are shown in (b).
(a) (b)
(a) (b)
(c) (d)
#152622 - $15.00 USD Received 14 Sep 2011; revised 4 Oct 2011; accepted 5 Oct 2011; published 1 Nov 2011(C) 2011 OSA 7 November 2011 / Vol. 19, No. 23 / OPTICS EXPRESS 23294
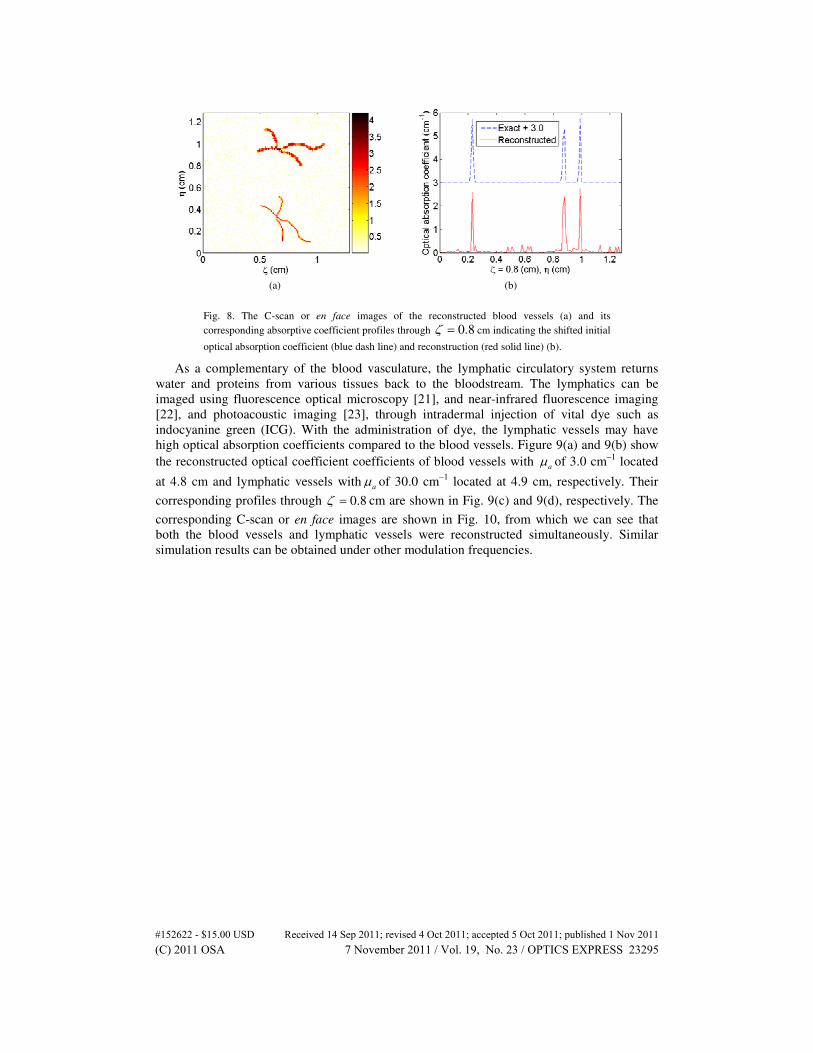
Fig. 8. The C-scan or en face images of the reconstructed blood vessels (a) and its
corresponding absorptive coefficient profiles through 0.8ζ = cm indicating the shifted initial
optical absorption coefficient (blue dash line) and reconstruction (red solid line) (b).
As a complementary of the blood vasculature, the lymphatic circulatory system returns
water and proteins from various tissues back to the bloodstream. The lymphatics can be
imaged using fluorescence optical microscopy [21], and near-infrared fluorescence imaging
[22], and photoacoustic imaging [23], through intradermal injection of vital dye such as
indocyanine green (ICG). With the administration of dye, the lymphatic vessels may have
high optical absorption coefficients compared to the blood vessels. Figure 9(a) and 9(b) show
the reconstructed optical coefficient coefficients of blood vessels with a
µ of 3.0 cm−1
located
at 4.8 cm and lymphatic vessels witha
µ of 30.0 cm−1
located at 4.9 cm, respectively. Their
corresponding profiles through 0.8ζ = cm are shown in Fig. 9(c) and 9(d), respectively. The
corresponding C-scan or en face images are shown in Fig. 10, from which we can see that
both the blood vessels and lymphatic vessels were reconstructed simultaneously. Similar
simulation results can be obtained under other modulation frequencies.
(a) (b)
#152622 - $15.00 USD Received 14 Sep 2011; revised 4 Oct 2011; accepted 5 Oct 2011; published 1 Nov 2011(C) 2011 OSA 7 November 2011 / Vol. 19, No. 23 / OPTICS EXPRESS 23295
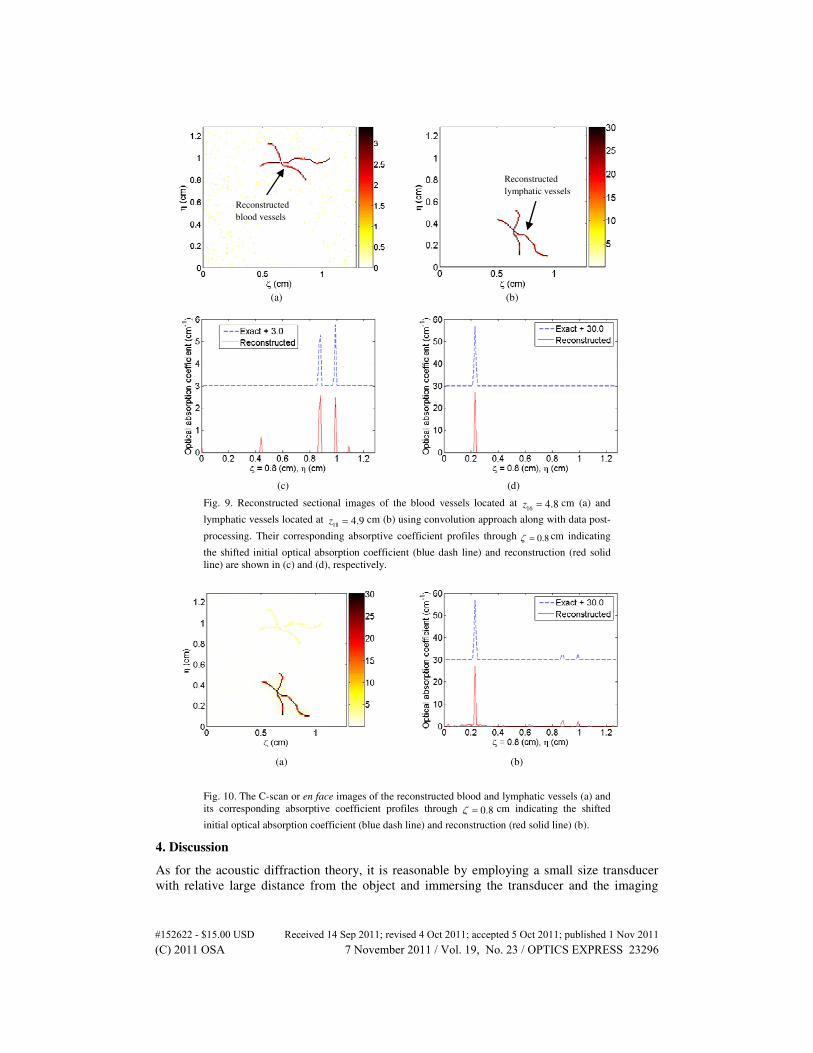
Fig. 9. Reconstructed sectional images of the blood vessels located at 16
4.8z = cm (a) and
lymphatic vessels located at 18 4.9z = cm (b) using convolution approach along with data post-
processing. Their corresponding absorptive coefficient profiles through 0.8ζ = cm indicating
the shifted initial optical absorption coefficient (blue dash line) and reconstruction (red solid
line) are shown in (c) and (d), respectively.
Fig. 10. The C-scan or en face images of the reconstructed blood and lymphatic vessels (a) and
its corresponding absorptive coefficient profiles through 0.8ζ = cm indicating the shifted
initial optical absorption coefficient (blue dash line) and reconstruction (red solid line) (b).
4. Discussion
As for the acoustic diffraction theory, it is reasonable by employing a small size transducer
with relative large distance from the object and immersing the transducer and the imaging
(a) (b)
(a) (b)
(c) (d)
Reconstructed
blood vessels
Reconstructed
lymphatic vessels
#152622 - $15.00 USD Received 14 Sep 2011; revised 4 Oct 2011; accepted 5 Oct 2011; published 1 Nov 2011(C) 2011 OSA 7 November 2011 / Vol. 19, No. 23 / OPTICS EXPRESS 23296
domain in water. In addition, the acoustic pressure, as given in Eq. (4), does not consider the
photonic and thermal contributions to the system. This implies that the thermal and acoustic
confinements are satisfied. It should be noted that both the thermal and stress confinements
can be measured by the ratios of the squared photonic to the thermal and acoustic wave
numbers, respectively [10]. For the parameters given in the numerical simulations as well as
the typical thermal diffusivity of soft tissue as 0.11mm2/s and the speed of light in tissue is on
the order of 2 x10⁸ m/s, the calculated ratios of the photonic to the thermal and acoustic wave
numbers are small and it follows that the thermal subsystem has little effects on the
measurements [10]. If acoustic attenuation in tissue is not negligible, one may need to modify
the photoacoutic wave Eq. (1). As photons experience attenuation in tissue, the photonic
contribution becomes negligible and only the acoustic contribution remains at a large
distance. Otherwise, one needs to consider the photonic contribution by modifying the
impulse response, ( )g , , , ,x y zζ η . To obtain more accuracy distribution of photon fluence in
biological tissues, high order spherical harmonics and simplified spherical harmonics models
may be used to solve the RTE [24, 25]. On the other hand, using the Monte Carlo simulation
to solve the RTE, one can obtain any desired accuracy [26].
In numerical simulations, we assume that the blood vessels at different sections are not
overlapped along the z direction and thus this technique is suitable for imaging the shape of
tissue of object. If the blood vessels overlap along z direction, based on the proposed
convolution method with data post-processing techniques, the blood vessel with the maximum
absorbed optical energy density in z direction would be constructed. The proposed approach
is direct and fast. If one wants to reconstruct the overlapping structures, the Wiener filter
approach, the Wigner distribution function approach and the inversion methods used in the
field of optical scanning holography [14-15, 27] can be adapted and applied to the
photoacoustic imaging. Both the Wiener filter and Wigner distribution function approaches
work well for only two sections. In addition, the Wiener filter approach requires no noise
virtually introduced in the imaging system, and the imaging reconstruction is a time-
consuming process for the Wigner distribution approach. Fortunately, inverse imaging
approaches, such as the conjugate-gradient based algorithm with Tikhonov regularization, are
more effective in suppressing noise and retrieving the multiple sections. However, the sharp
edges become blurred in the reconstructed sections, due to minimizing the total energy in the
reconstruction algorithm. With the total-variation regularization and a nonnegativity
constraint, the sharp edges can be well preserved in the reconstructed sections using a primal-
dual Newton’s method combined with gradient projection. The minimum separation between
two sections depends on the modulation frequency, SNR and the sampling size in the z
direction. For our experimental conditions, two sections with minimum separation of
500 mµ can be reconstructed.
In summary, we demonstrate that the distributions of the optical absorption are possibly to
be reconstructed using the convolution approach with appropriate data post processing
coupled with optical diffusion equation in the FD based PA imaging.
#152622 - $15.00 USD Received 14 Sep 2011; revised 4 Oct 2011; accepted 5 Oct 2011; published 1 Nov 2011(C) 2011 OSA 7 November 2011 / Vol. 19, No. 23 / OPTICS EXPRESS 23297