recommended funds 2016 – portfolio & performance update ... · 5 recommended funds 2016 –...
TRANSCRIPT
0 Recommended Funds 2016 – Portfolio & Performance Update (Mar’16-June’16) – iFAST Research
1 Recommended Funds 2016 – Portfolio & Performance Update (Mar’16-June’16) – iFAST Research
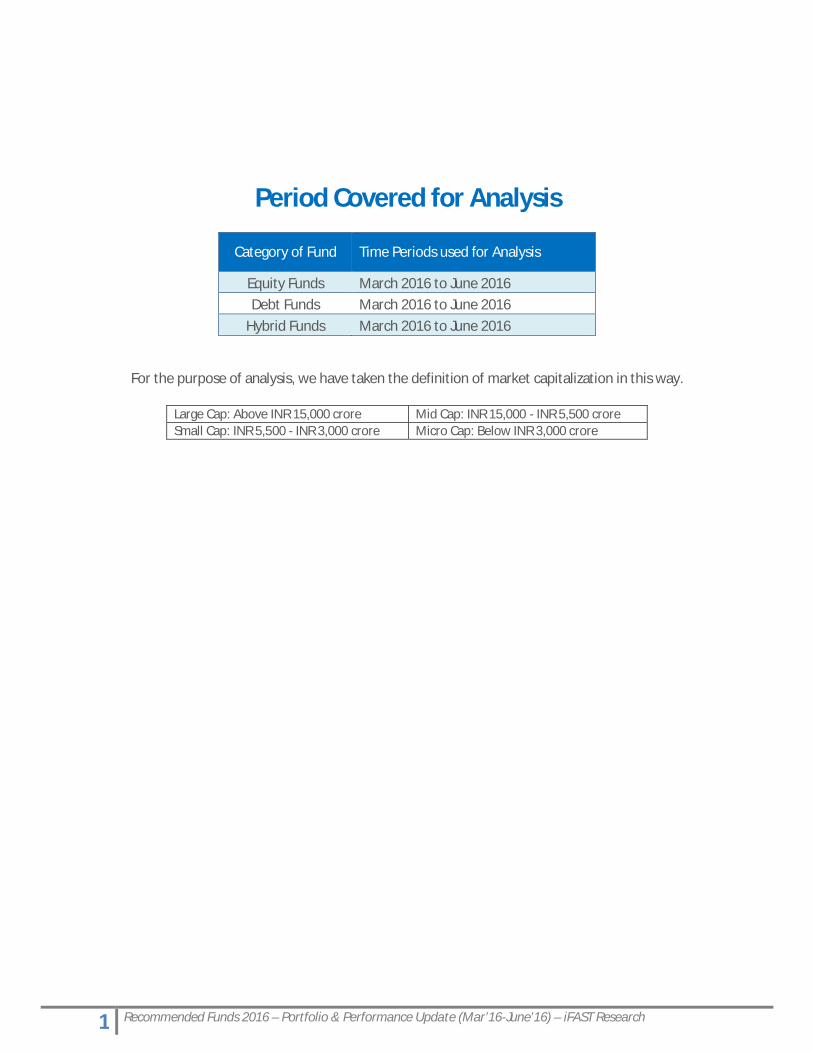
Period Covered for Analysis
Category of Fund Time Periods used for Analysis
Equity Funds March 2016 to June 2016Debt Funds March 2016 to June 2016
Hybrid Funds March 2016 to June 2016
For the purpose of analysis, we have taken the definition of market capitalization in this way.
Large Cap: Above INR 15,000 crore Mid Cap: INR 15,000 - INR 5,500 croreSmall Cap: INR 5,500 - INR 3,000 crore Micro Cap: Below INR 3,000 crore

2 Recommended Funds 2016 – Portfolio & Performance Update (Mar’16-June’16) – iFAST Research
Recommended Equity Funds
3 Recommended Funds 2016 – Portfolio & Performance Update (Mar’16-June’16) – iFAST Research
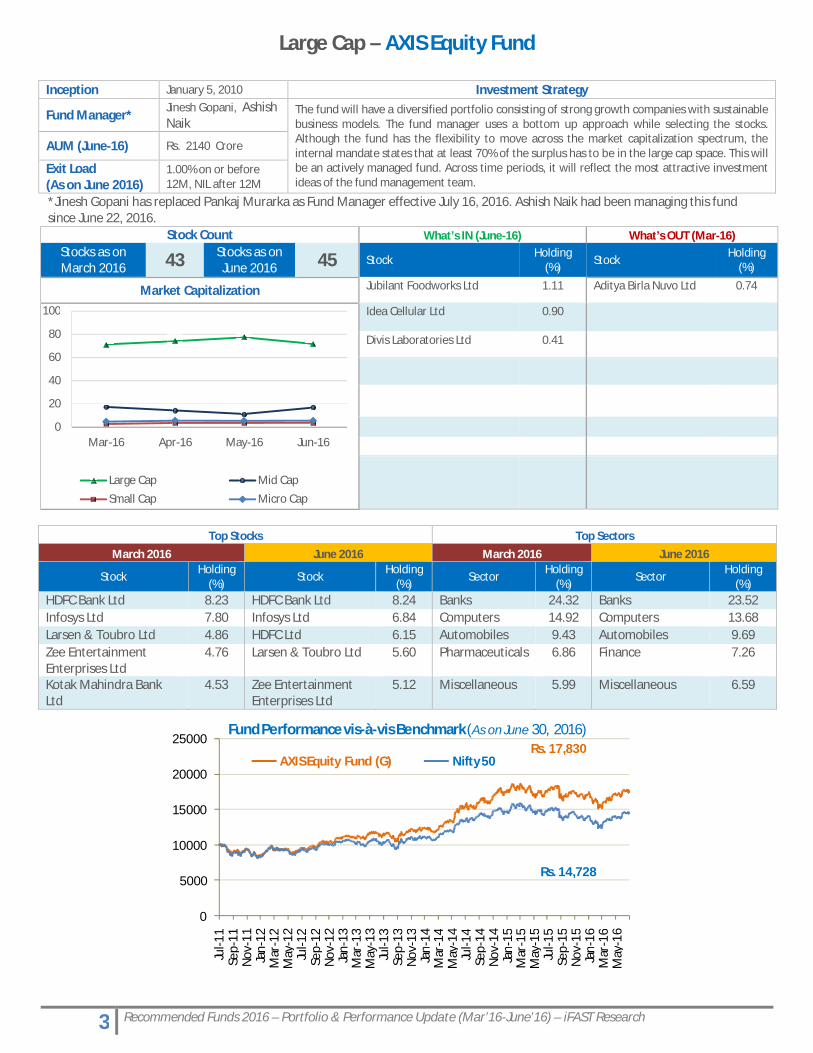
Large Cap – AXIS Equity Fund
*Jinesh Gopani has replaced Pankaj Murarka as Fund Manager effective July 16, 2016. Ashish Naik had been managing this fund since June 22, 2016.
Stock Count What’s IN (June-16) What’s OUT (Mar-16)Stocks as on March 2016 43 Stocks as on
June 2016 45 StockHolding
(%) StockHolding
(%)
Market Capitalization Jubilant Foodworks Ltd 1.11 Aditya Birla Nuvo Ltd 0.74
Idea Cellular Ltd 0.90
Divis Laboratories Ltd 0.41
Top Stocks Top SectorsMarch 2016 June 2016 March 2016 June 2016
StockHolding
(%)Stock
Holding (%)
SectorHolding
(%)Sector
Holding (%)
HDFC Bank Ltd 8.23 HDFC Bank Ltd 8.24 Banks 24.32 Banks 23.52Infosys Ltd 7.80 Infosys Ltd 6.84 Computers 14.92 Computers 13.68Larsen & Toubro Ltd 4.86 HDFC Ltd 6.15 Automobiles 9.43 Automobiles 9.69Zee Entertainment Enterprises Ltd
4.76 Larsen & Toubro Ltd 5.60 Pharmaceuticals 6.86 Finance 7.26
Kotak Mahindra Bank Ltd
4.53 Zee Entertainment Enterprises Ltd
5.12 Miscellaneous 5.99 Miscellaneous 6.59
0
20
40
60
80
100
Mar-16 Apr-16 May-16 Jun-16
Large Cap Mid Cap
Small Cap Micro Cap
0
5000
10000
15000
20000
25000
Jul-1
1Se
p-11
Nov
-11
Jan-
12M
ar-1
2M
ay-1
2Ju
l-12
Sep-
12N
ov-1
2Ja
n-13
Mar
-13
May
-13
Jul-1
3Se
p-13
Nov
-13
Jan-
14M
ar-1
4M
ay-1
4Ju
l-14
Sep-
14N
ov-1
4Ja
n-15
Mar
-15
May
-15
Jul-1
5Se
p-15
Nov
-15
Jan-
16M
ar-1
6M
ay-1
6
Fund Performance vis-à-vis Benchmark (As on June 30, 2016)
AXIS Equity Fund (G) Nifty 50
Rs. 14,728
Rs. 17,830
Inception January 5, 2010 Investment Strategy
Fund Manager*Jinesh Gopani, Ashish Naik
The fund will have a diversified portfolio consisting of strong growth companies with sustainable business models. The fund manager uses a bottom up approach while selecting the stocks. Although the fund has the flexibility to move across the market capitalization spectrum, the internal mandate states that at least 70% of the surplus has to be in the large cap space. This will be an actively managed fund. Across time periods, it will reflect the most attractive investment ideas of the fund management team.
AUM (June-16) Rs. 2140 Crore
Exit Load(As on June 2016)
1.00% on or before 12M, NIL after 12M
4 Recommended Funds 2016 – Portfolio & Performance Update (Mar’16-June’16) – iFAST Research
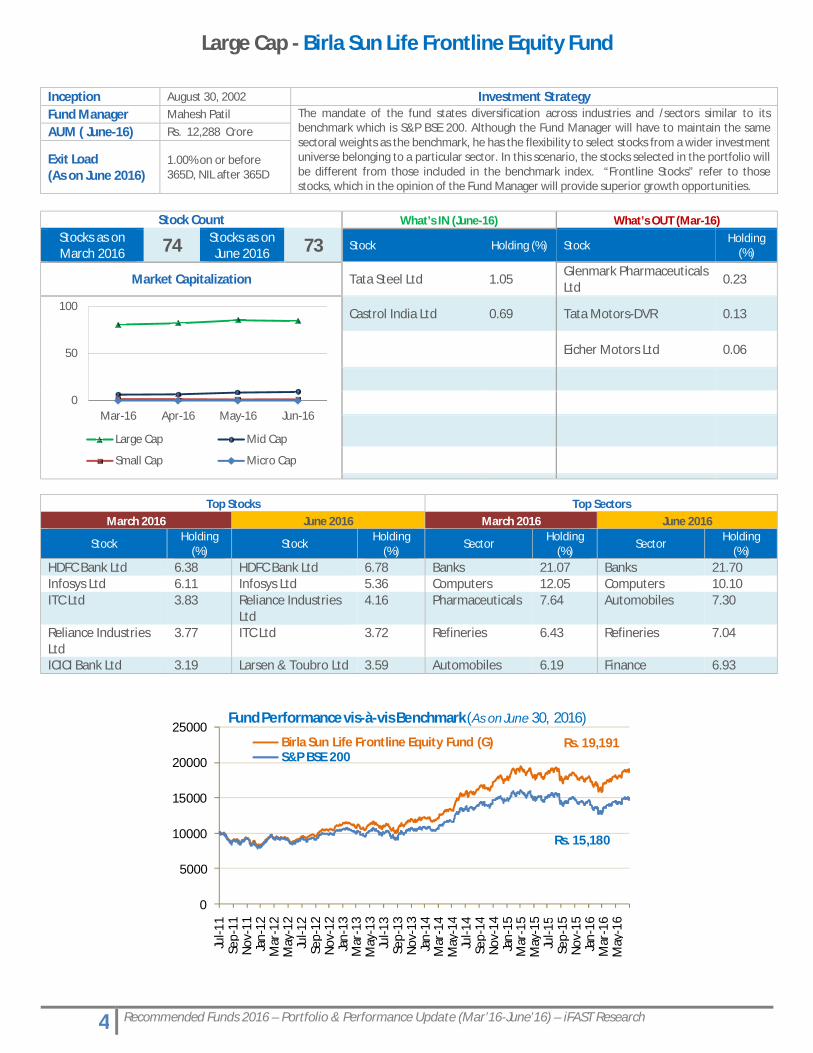
Large Cap - Birla Sun Life Frontline Equity Fund
Stock Count What’s IN (June-16) What’s OUT (Mar-16)Stocks as on March 2016 74 Stocks as on
June 2016 73 Stock Holding (%) StockHolding
(%)
Market Capitalization Tata Steel Ltd 1.05Glenmark Pharmaceuticals Ltd
0.23
Castrol India Ltd 0.69 Tata Motors-DVR 0.13
Eicher Motors Ltd 0.06
Top Stocks Top SectorsMarch 2016 June 2016 March 2016 June 2016
StockHolding
(%)Stock
Holding (%)
SectorHolding
(%)Sector
Holding (%)
HDFC Bank Ltd 6.38 HDFC Bank Ltd 6.78 Banks 21.07 Banks 21.70Infosys Ltd 6.11 Infosys Ltd 5.36 Computers 12.05 Computers 10.10ITC Ltd 3.83 Reliance Industries
Ltd4.16 Pharmaceuticals 7.64 Automobiles 7.30
Reliance Industries Ltd
3.77 ITC Ltd 3.72 Refineries 6.43 Refineries 7.04
ICICI Bank Ltd 3.19 Larsen & Toubro Ltd 3.59 Automobiles 6.19 Finance 6.93
0
50
100
Mar-16 Apr-16 May-16 Jun-16
Large Cap Mid Cap
Small Cap Micro Cap
0
5000
10000
15000
20000
25000
Jul-1
1Se
p-11
Nov
-11
Jan-
12M
ar-1
2M
ay-1
2Ju
l-12
Sep-
12N
ov-1
2Ja
n-13
Mar
-13
May
-13
Jul-1
3Se
p-13
Nov
-13
Jan-
14M
ar-1
4M
ay-1
4Ju
l-14
Sep-
14N
ov-1
4Ja
n-15
Mar
-15
May
-15
Jul-1
5Se
p-15
Nov
-15
Jan-
16M
ar-1
6M
ay-1
6
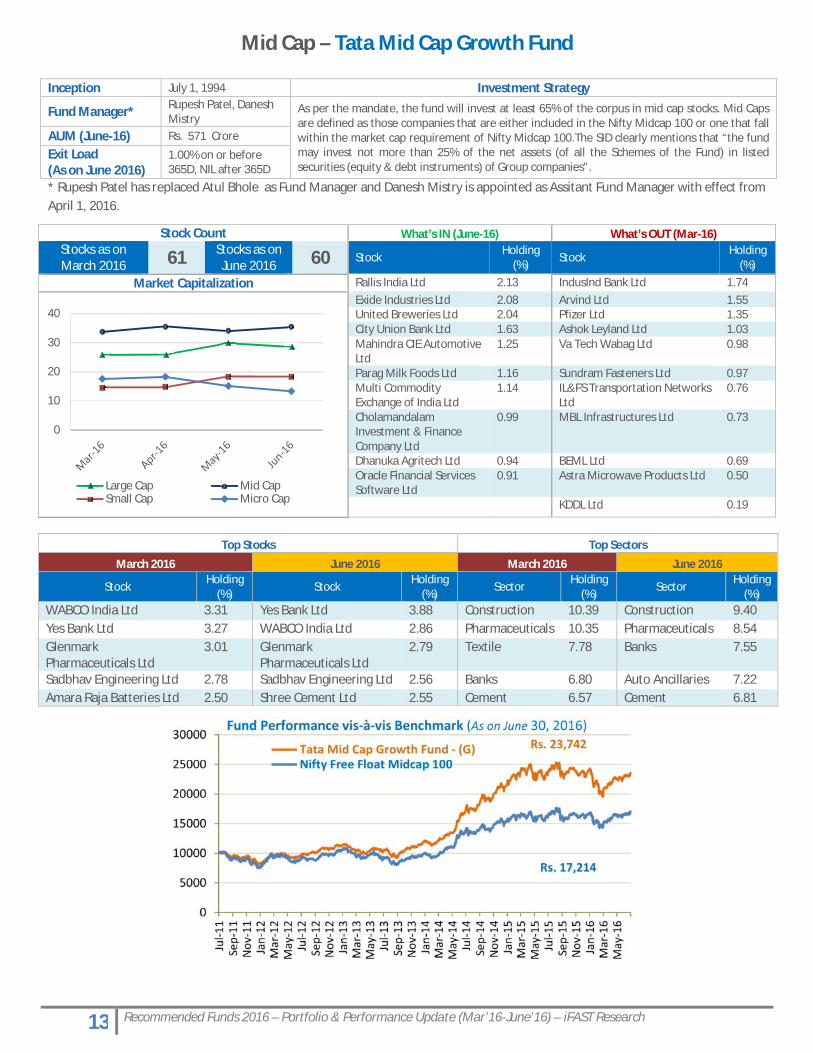
Fund Performance vis-à-vis Benchmark (As on June 30, 2016)
Birla Sun Life Frontline Equity Fund (G)S&P BSE 200
Rs. 15,180
Rs. 19,191
Inception August 30, 2002 Investment StrategyFund Manager Mahesh Patil The mandate of the fund states diversification across industries and /sectors similar to its
benchmark which is S&P BSE 200. Although the Fund Manager will have to maintain the same sectoral weights as the benchmark, he has the flexibility to select stocks from a wider investment universe belonging to a particular sector. In this scenario, the stocks selected in the portfolio will be different from those included in the benchmark index. “Frontline Stocks” refer to those stocks, which in the opinion of the Fund Manager will provide superior growth opportunities.
AUM ( June-16) Rs. 12,288 Crore
Exit Load(As on June 2016)
1.00% on or before 365D, NIL after 365D
5 Recommended Funds 2016 – Portfolio & Performance Update (Mar’16-June’16) – iFAST Research
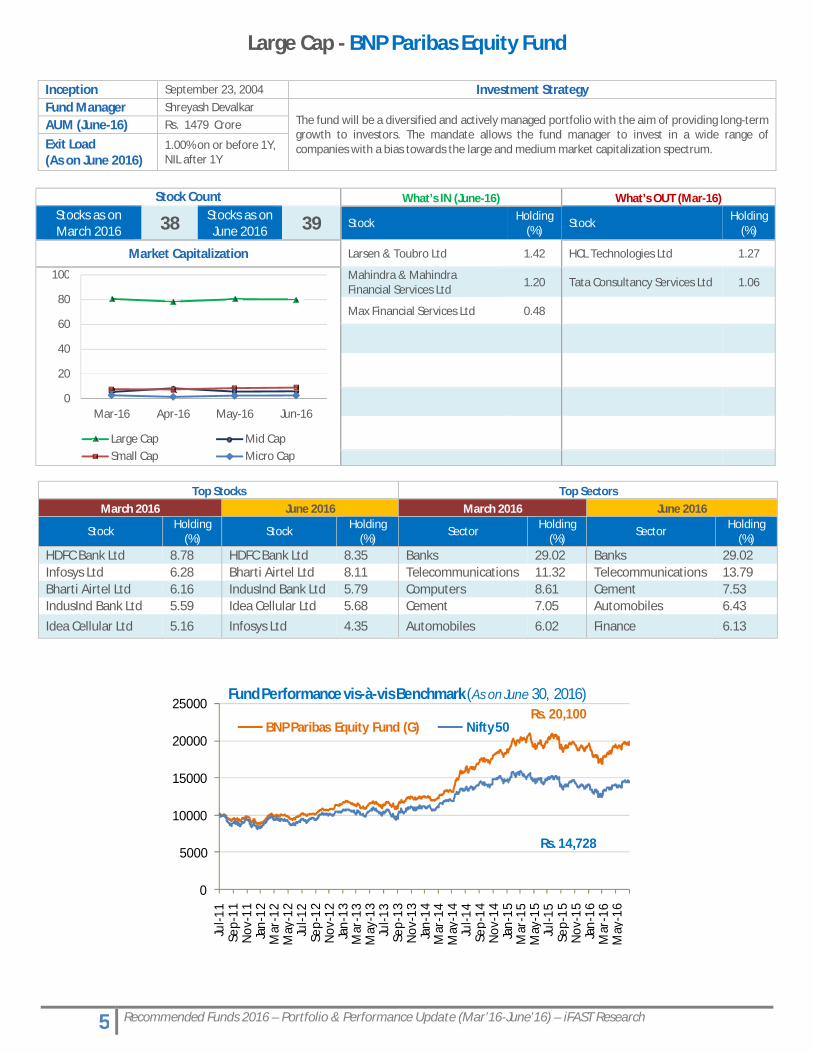
Large Cap - BNP Paribas Equity Fund
Stock Count What’s IN (June-16) What’s OUT (Mar-16)Stocks as on March 2016 38 Stocks as on
June 2016 39 StockHolding
(%)Stock
Holding (%)
Market Capitalization Larsen & Toubro Ltd 1.42 HCL Technologies Ltd 1.27
Mahindra & Mahindra Financial Services Ltd
1.20 Tata Consultancy Services Ltd 1.06
Max Financial Services Ltd 0.48
Top Stocks Top SectorsMarch 2016 June 2016 March 2016 June 2016
Stock Holding (%)
Stock Holding (%)
Sector Holding (%)
Sector Holding (%)
HDFC Bank Ltd 8.78 HDFC Bank Ltd 8.35 Banks 29.02 Banks 29.02Infosys Ltd 6.28 Bharti Airtel Ltd 8.11 Telecommunications 11.32 Telecommunications 13.79Bharti Airtel Ltd 6.16 IndusInd Bank Ltd 5.79 Computers 8.61 Cement 7.53IndusInd Bank Ltd 5.59 Idea Cellular Ltd 5.68 Cement 7.05 Automobiles 6.43
Idea Cellular Ltd 5.16 Infosys Ltd 4.35 Automobiles 6.02 Finance 6.13
0
20
40
60
80
100
Mar-16 Apr-16 May-16 Jun-16
Large Cap Mid CapSmall Cap Micro Cap
0
5000
10000
15000
20000
25000
Jul-1
1Se
p-11
Nov
-11
Jan-
12M
ar-1
2M
ay-1
2Ju
l-12
Sep-
12N
ov-1
2Ja
n-13
Mar
-13
May
-13
Jul-1
3Se
p-13
Nov
-13
Jan-
14M
ar-1
4M
ay-1
4Ju
l-14
Sep-
14N
ov-1
4Ja
n-15
Mar
-15
May
-15
Jul-1
5Se
p-15
Nov
-15
Jan-
16M
ar-1
6M
ay-1
6
Fund Performance vis-à-vis Benchmark (As on June 30, 2016)
BNP Paribas Equity Fund (G) Nifty 50
Rs. 14,728
Rs. 20,100
Inception September 23, 2004 Investment StrategyFund Manager Shreyash Devalkar
The fund will be a diversified and actively managed portfolio with the aim of providing long-term growth to investors. The mandate allows the fund manager to invest in a wide range of companies with a bias towards the large and medium market capitalization spectrum.
AUM (June-16) Rs. 1479 Crore
Exit Load(As on June 2016)
1.00% on or before 1Y,NIL after 1Y
6 Recommended Funds 2016 – Portfolio & Performance Update (Mar’16-June’16) – iFAST Research
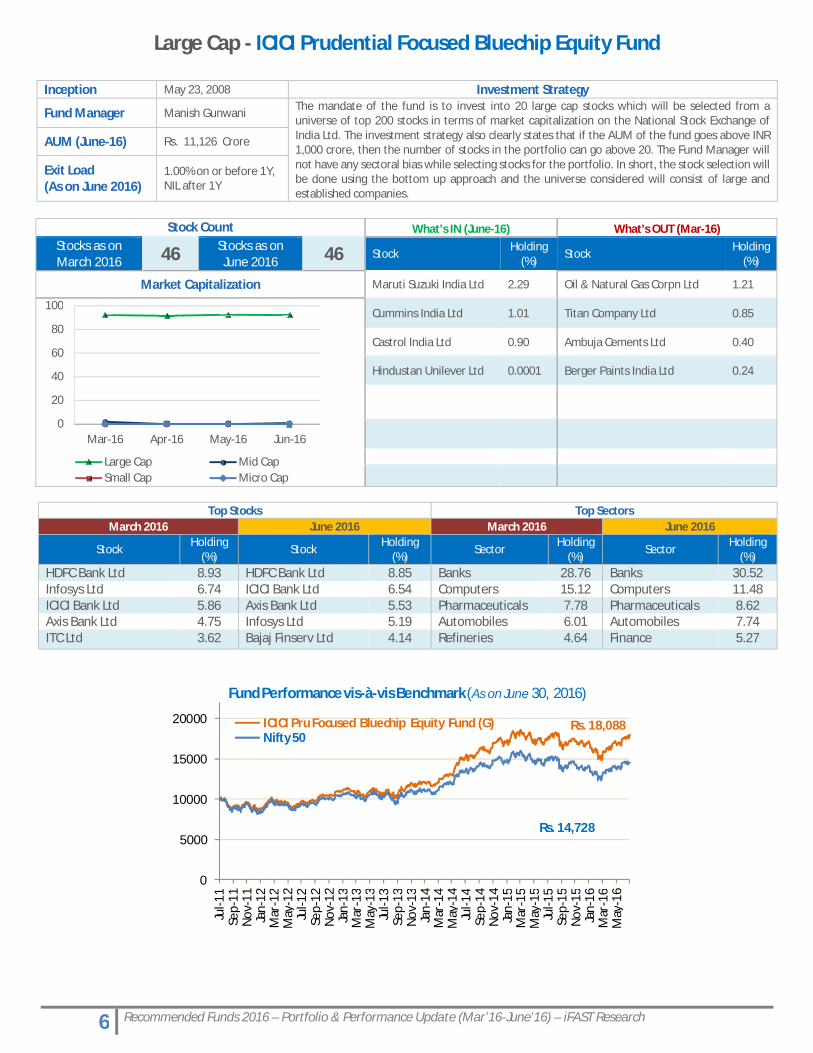
Large Cap - ICICI Prudential Focused Bluechip Equity Fund
Stock Count What’s IN (June-16) What’s OUT (Mar-16)Stocks as on March 2016 46 Stocks as on
June 2016 46 StockHolding
(%)Stock
Holding (%)
Market Capitalization Maruti Suzuki India Ltd 2.29 Oil & Natural Gas Corpn Ltd 1.21
Cummins India Ltd 1.01 Titan Company Ltd 0.85
Castrol India Ltd 0.90 Ambuja Cements Ltd 0.40
Hindustan Unilever Ltd 0.0001 Berger Paints India Ltd 0.24
Top Stocks Top SectorsMarch 2016 June 2016 March 2016 June 2016
StockHolding
(%)Stock
Holding (%)
SectorHolding
(%)Sector
Holding (%)
HDFC Bank Ltd 8.93 HDFC Bank Ltd 8.85 Banks 28.76 Banks 30.52Infosys Ltd 6.74 ICICI Bank Ltd 6.54 Computers 15.12 Computers 11.48ICICI Bank Ltd 5.86 Axis Bank Ltd 5.53 Pharmaceuticals 7.78 Pharmaceuticals 8.62Axis Bank Ltd 4.75 Infosys Ltd 5.19 Automobiles 6.01 Automobiles 7.74ITC Ltd 3.62 Bajaj Finserv Ltd 4.14 Refineries 4.64 Finance 5.27
0
20
40
60
80
100
Mar-16 Apr-16 May-16 Jun-16
Large Cap Mid CapSmall Cap Micro Cap
0
5000
10000
15000
20000
Jul-1
1Se
p-11
Nov
-11
Jan-
12M
ar-1
2M
ay-1
2Ju
l-12
Sep-
12N
ov-1
2Ja
n-13
Mar
-13
May
-13
Jul-1
3Se
p-13
Nov
-13
Jan-
14M
ar-1
4M
ay-1
4Ju
l-14
Sep-
14N
ov-1
4Ja
n-15
Mar
-15
May
-15
Jul-1
5Se
p-15
Nov
-15
Jan-
16M
ar-1
6M
ay-1
6
Fund Performance vis-à-vis Benchmark (As on June 30, 2016)
ICICI Pru Focused Bluechip Equity Fund (G)Nifty 50
Rs. 14,728
Rs. 18,088
Inception May 23, 2008 Investment Strategy
Fund Manager Manish Gunwani The mandate of the fund is to invest into 20 large cap stocks which will be selected from a universe of top 200 stocks in terms of market capitalization on the National Stock Exchange of India Ltd. The investment strategy also clearly states that if the AUM of the fund goes above INR 1,000 crore, then the number of stocks in the portfolio can go above 20. The Fund Manager will not have any sectoral bias while selecting stocks for the portfolio. In short, the stock selection will be done using the bottom up approach and the universe considered will consist of large and established companies.
AUM (June-16) Rs. 11,126 Crore
Exit Load(As on June 2016)
1.00% on or before 1Y,NIL after 1Y
7 Recommended Funds 2016 – Portfolio & Performance Update (Mar’16-June’16) – iFAST Research
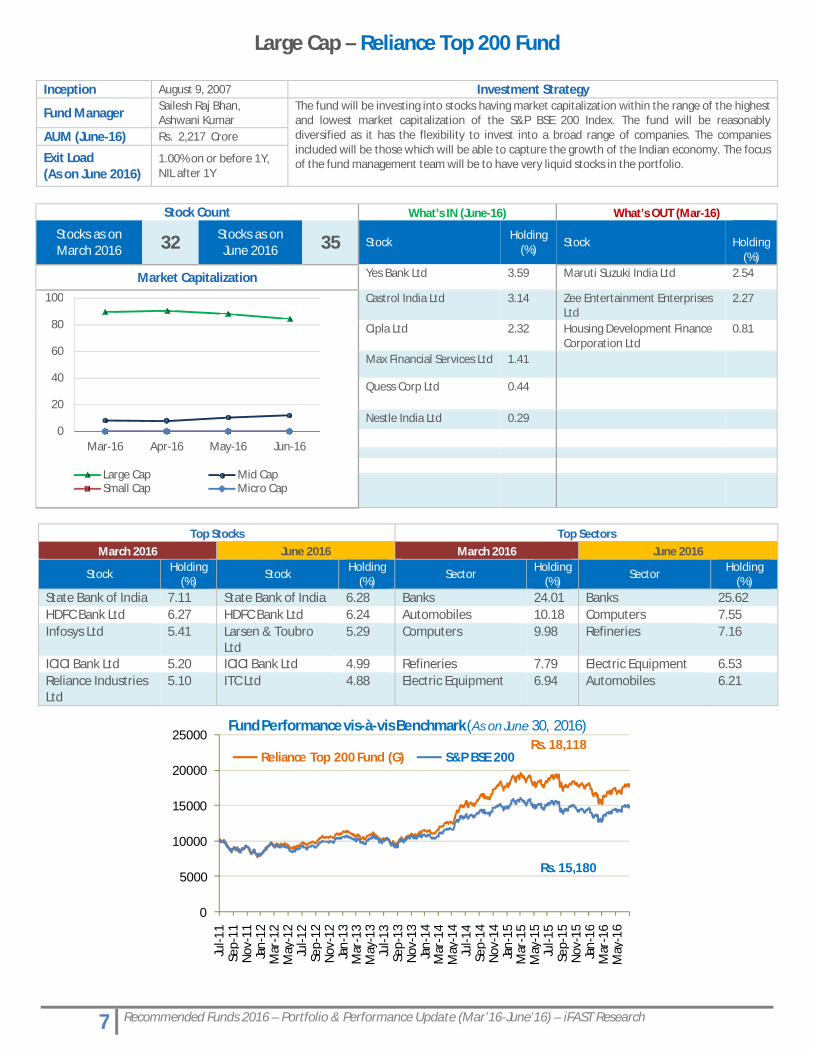
Large Cap – Reliance Top 200 Fund
Stock Count What’s IN (June-16) What’s OUT (Mar-16)
Stocks as on March 2016 32 Stocks as on
June 2016 35 StockHolding
(%)Stock Holding
(%)
Market Capitalization Yes Bank Ltd 3.59 Maruti Suzuki India Ltd 2.54
Castrol India Ltd 3.14 Zee Entertainment Enterprises Ltd
2.27
Cipla Ltd 2.32 Housing Development Finance Corporation Ltd
0.81
Max Financial Services Ltd 1.41
Quess Corp Ltd 0.44
Nestle India Ltd 0.29
Top Stocks Top SectorsMarch 2016 June 2016 March 2016 June 2016
Stock Holding (%)
Stock Holding (%)
Sector Holding (%)
Sector Holding (%)
State Bank of India 7.11 State Bank of India 6.28 Banks 24.01 Banks 25.62HDFC Bank Ltd 6.27 HDFC Bank Ltd 6.24 Automobiles 10.18 Computers 7.55Infosys Ltd 5.41 Larsen & Toubro
Ltd5.29 Computers 9.98 Refineries 7.16
ICICI Bank Ltd 5.20 ICICI Bank Ltd 4.99 Refineries 7.79 Electric Equipment 6.53Reliance Industries Ltd
5.10 ITC Ltd 4.88 Electric Equipment 6.94 Automobiles 6.21
0
20
40
60
80
100
Mar-16 Apr-16 May-16 Jun-16
Large Cap Mid CapSmall Cap Micro Cap
0
5000
10000
15000
20000
25000
Jul-1
1Se
p-11
Nov
-11
Jan-
12M
ar-1
2M
ay-1
2Ju
l-12
Sep-
12N
ov-1
2Ja
n-13
Mar
-13
May
-13
Jul-1
3Se
p-13
Nov
-13
Jan-
14M
ar-1
4M
ay-1
4Ju
l-14
Sep-
14N
ov-1
4Ja
n-15
Mar
-15
May
-15
Jul-1
5Se
p-15
Nov
-15
Jan-
16M
ar-1
6M
ay-1
6
Fund Performance vis-à-vis Benchmark (As on June 30, 2016)
Reliance Top 200 Fund (G) S&P BSE 200
Rs. 15,180
Rs. 18,118
Inception August 9, 2007 Investment Strategy
Fund Manager Sailesh Raj Bhan, Ashwani Kumar
The fund will be investing into stocks having market capitalization within the range of the highest and lowest market capitalization of the S&P BSE 200 Index. The fund will be reasonably diversified as it has the flexibility to invest into a broad range of companies. The companies included will be those which will be able to capture the growth of the Indian economy. The focus of the fund management team will be to have very liquid stocks in the portfolio.
AUM (June-16) Rs. 2,217 Crore
Exit Load(As on June 2016)
1.00% on or before 1Y,NIL after 1Y

8 Recommended Funds 2016 – Portfolio & Performance Update (Mar’16-June’16) – iFAST Research
Large Cap – SBI Blue Chip Fund
Stock Count What’s IN (June-16) What’s OUT (Mar-16)Stocks as on March 2016 51 Stocks as on
June 2016 52 StockHolding
(%)Stock
Holding (%)
Market Capitalization Nestle India Ltd 1.07 Adani Ports & Special Economic Zone Ltd
0.95
Eicher Motors Ltd 0.97 United Breweries Ltd 0.91
Lupin Ltd 0.55 Axis Bank Ltd 0.78
Tech Mahindra Ltd 0.46 Bajaj Finance Ltd 0.36
Tata Power Company Ltd 0.31 Alstom T&D India Ltd 0.34
NTPC Ltd 0.22
Top Stocks Top SectorsMarch 2016 June 2016 March 2016 June 2016
StockHolding
(%) StockHolding
(%) SectorHolding
(%) SectorHolding
(%)HDFC Bank Ltd 6.18 HDFC Bank Ltd 6.44 Banks 13.79 Banks 13.65Reliance Industries Ltd 5.64 Infosys Ltd 4.62 Pharmaceuticals 10.75 Pharmaceuticals 10.59Infosys Ltd 5.06 Reliance Industries Ltd 4.09 Computers 9.12 Computers 8.28Sun Pharmaceuticals Industries Ltd
4.55 Sun Pharmaceuticals Industries Ltd
3.61 Refineries 7.79 Finance 7.94
Tata Consultancy Services Ltd
2.82 Larsen & Toubro Ltd 2.71 Automobiles 7.28 Automobiles 7.91
0
20
40
60
80
100
Mar-16 Apr-16 May-16 Jun-16
Large Cap Mid CapSmall Cap Micro Cap
0
5000
10000
15000
20000
25000
Jul-1
1Se
p-11
Nov
-11
Jan-
12M
ar-1
2M
ay-1
2Ju
l-12
Sep-
12N
ov-1
2Ja
n-13
Mar
-13
May
-13
Jul-1
3Se
p-13
Nov
-13
Jan-
14M
ar-1
4M
ay-1
4Ju
l-14
Sep-
14N
ov-1
4Ja
n-15
Mar
-15
May
-15
Jul-1
5Se
p-15
Nov
-15
Jan-
16M
ar-1
6M
ay-1
6
Fund Performance vis-à-vis Benchmark (As on June 30, 2016)
SBI BlueChip Fund (G) S&P BSE 100
Rs. 14,764
Rs. 20,915
Inception February 14, 2006 Investment Strategy
Fund Manager Sohini Andani The mandate of the fund states that it will be a diversified portfolio consisting of stocks whose market capitalization is at least equal to or more than the least market capitalized stock of S&P BSE 100 stocks. As per the SID, "Blue chip stocks would normally qualify as those stocks which are typically large companies with an established business presence, good reputation and are possibly market leaders in their industries with less uncertainty in topline/ bottom line growth. Blue chip companies normally have a history of successful growth, high visibility and reach, good credit ratings and excellent brand equity amongst the general public and widespread interest amongst investing public."
AUM (June-16) Rs. 7066 Crore
Exit Load(As on June 2016)
1.00% on or before 1Y,NIL after 1Y
9 Recommended Funds 2016 – Portfolio & Performance Update (Mar’16-June’16) – iFAST Research
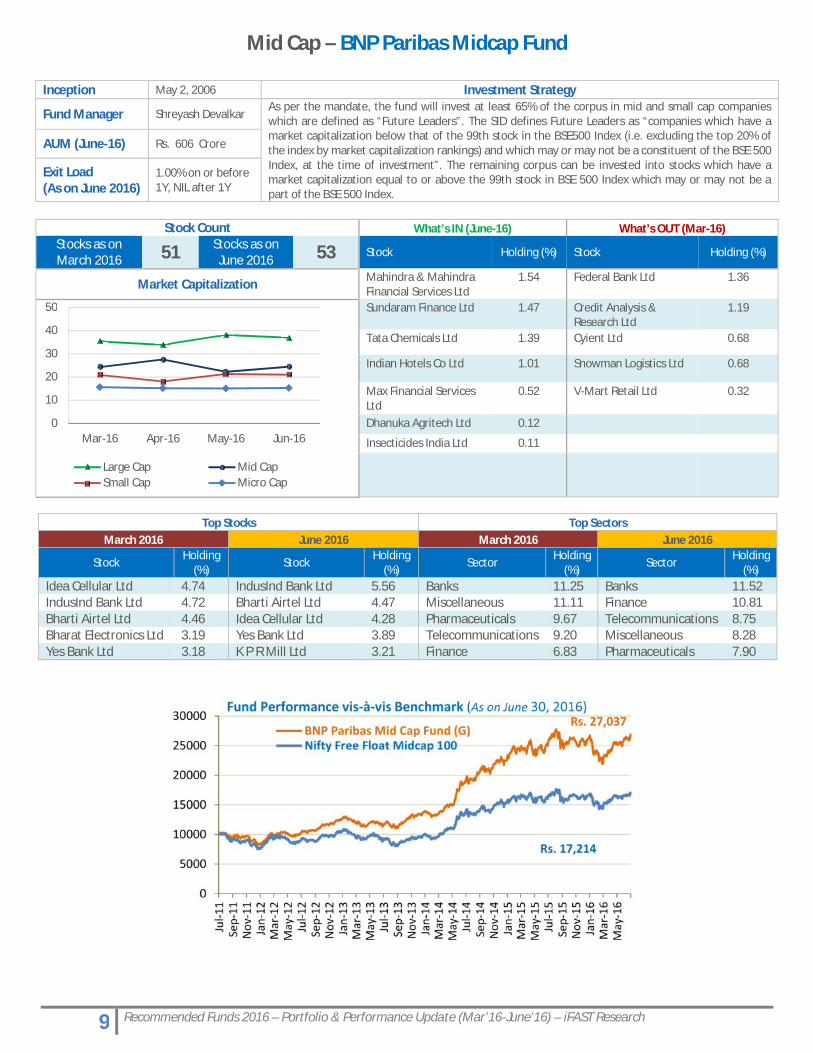
Mid Cap – BNP Paribas Midcap Fund
Stock Count What’s IN (June-16) What’s OUT (Mar-16)Stocks as on March 2016 51 Stocks as on
June 2016 53 Stock Holding (%) Stock Holding (%)
Market Capitalization Mahindra & Mahindra Financial Services Ltd
1.54 Federal Bank Ltd 1.36
Sundaram Finance Ltd 1.47 Credit Analysis & Research Ltd
1.19
Tata Chemicals Ltd 1.39 Cyient Ltd 0.68
Indian Hotels Co Ltd 1.01 Snowman Logistics Ltd 0.68
Max Financial Services Ltd
0.52 V-Mart Retail Ltd 0.32
Dhanuka Agritech Ltd 0.12
Insecticides India Ltd 0.11
Top Stocks Top SectorsMarch 2016 June 2016 March 2016 June 2016
StockHolding
(%)Stock
Holding (%)
SectorHolding
(%)Sector
Holding (%)
Idea Cellular Ltd 4.74 IndusInd Bank Ltd 5.56 Banks 11.25 Banks 11.52IndusInd Bank Ltd 4.72 Bharti Airtel Ltd 4.47 Miscellaneous 11.11 Finance 10.81Bharti Airtel Ltd 4.46 Idea Cellular Ltd 4.28 Pharmaceuticals 9.67 Telecommunications 8.75Bharat Electronics Ltd 3.19 Yes Bank Ltd 3.89 Telecommunications 9.20 Miscellaneous 8.28Yes Bank Ltd 3.18 K P R Mill Ltd 3.21 Finance 6.83 Pharmaceuticals 7.90
0
10
20
30
40
50
Mar-16 Apr-16 May-16 Jun-16
Large Cap Mid CapSmall Cap Micro Cap
Inception May 2, 2006 Investment Strategy
Fund Manager Shreyash DevalkarAs per the mandate, the fund will invest at least 65% of the corpus in mid and small cap companies which are defined as “Future Leaders”. The SID defines Future Leaders as “companies which have a market capitalization below that of the 99th stock in the BSE500 Index (i.e. excluding the top 20% of the index by market capitalization rankings) and which may or may not be a constituent of the BSE 500 Index, at the time of investment”. The remaining corpus can be invested into stocks which have a market capitalization equal to or above the 99th stock in BSE 500 Index which may or may not be a part of the BSE 500 Index.
AUM (June-16) Rs. 606 Crore
Exit Load(As on June 2016)
1.00% on or before 1Y, NIL after 1Y
10 Recommended Funds 2016 – Portfolio & Performance Update (Mar’16-June’16) – iFAST Research
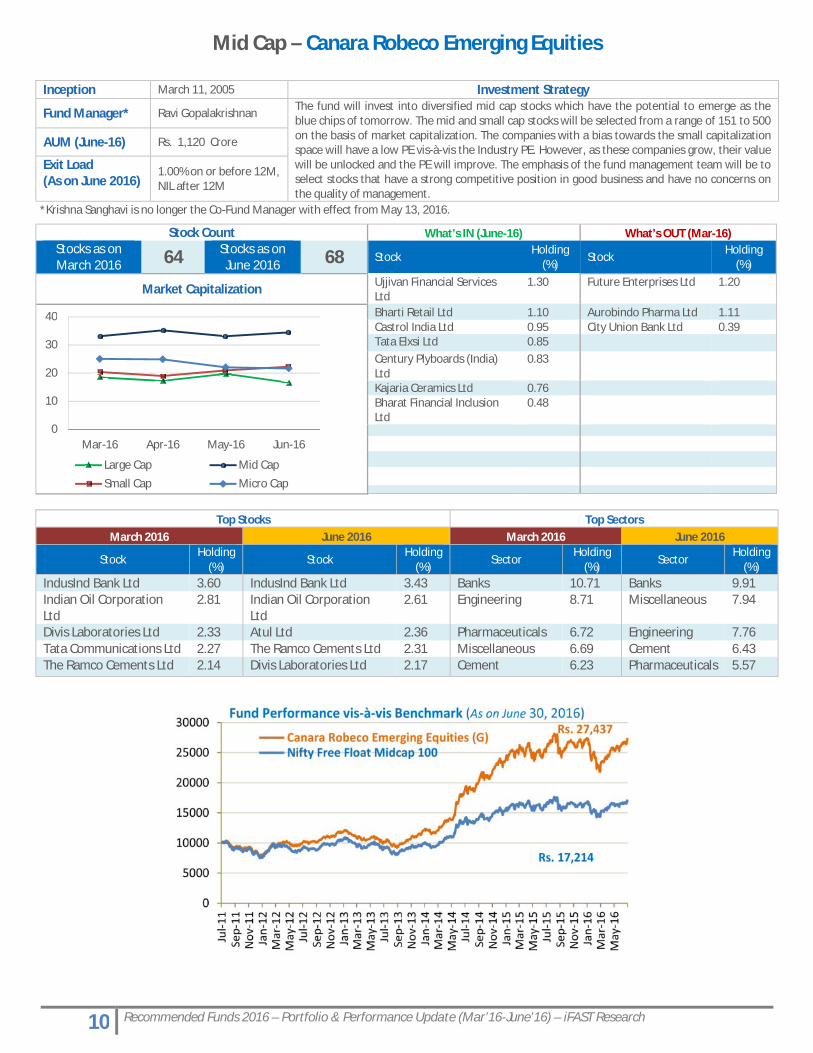
Mid Cap – Canara Robeco Emerging Equities
Stock Count What’s IN (June-16) What’s OUT (Mar-16)Stocks as on March 2016 64 Stocks as on
June 2016 68 StockHolding
(%)Stock
Holding (%)
Market Capitalization Ujjivan Financial Services Ltd
1.30 Future Enterprises Ltd 1.20
Bharti Retail Ltd 1.10 Aurobindo Pharma Ltd 1.11Castrol India Ltd 0.95 City Union Bank Ltd 0.39Tata Elxsi Ltd 0.85Century Plyboards (India) Ltd
0.83
Kajaria Ceramics Ltd 0.76Bharat Financial Inclusion Ltd
0.48
Top Stocks Top SectorsMarch 2016 June 2016 March 2016 June 2016
StockHolding
(%)Stock
Holding (%)
SectorHolding
(%)Sector
Holding (%)
IndusInd Bank Ltd 3.60 IndusInd Bank Ltd 3.43 Banks 10.71 Banks 9.91Indian Oil Corporation Ltd
2.81 Indian Oil Corporation Ltd
2.61 Engineering 8.71 Miscellaneous 7.94
Divis Laboratories Ltd 2.33 Atul Ltd 2.36 Pharmaceuticals 6.72 Engineering 7.76Tata Communications Ltd 2.27 The Ramco Cements Ltd 2.31 Miscellaneous 6.69 Cement 6.43The Ramco Cements Ltd 2.14 Divis Laboratories Ltd 2.17 Cement 6.23 Pharmaceuticals 5.57
0
10
20
30
40
Mar-16 Apr-16 May-16 Jun-16
Large Cap Mid Cap
Small Cap Micro Cap
Inception March 11, 2005 Investment Strategy
Fund Manager* Ravi Gopalakrishnan The fund will invest into diversified mid cap stocks which have the potential to emerge as the blue chips of tomorrow. The mid and small cap stocks will be selected from a range of 151 to 500 on the basis of market capitalization. The companies with a bias towards the small capitalization space will have a low PE vis-à-vis the Industry PE. However, as these companies grow, their value will be unlocked and the PE will improve. The emphasis of the fund management team will be to select stocks that have a strong competitive position in good business and have no concerns on the quality of management.
AUM (June-16) Rs. 1,120 Crore
Exit Load(As on June 2016)
1.00% on or before 12M,NIL after 12M
*Krishna Sanghavi is no longer the Co-Fund Manager with effect from May 13, 2016.
11 Recommended Funds 2016 – Portfolio & Performance Update (Mar’16-June’16) – iFAST Research
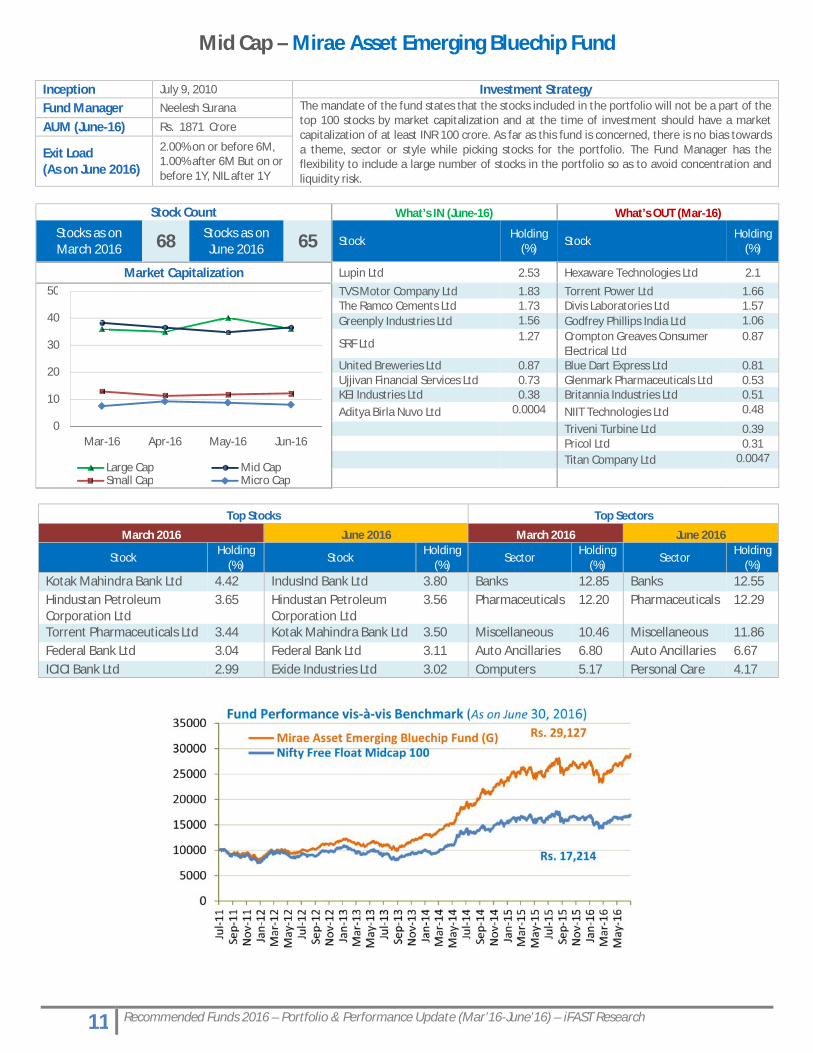
Mid Cap – Mirae Asset Emerging Bluechip Fund
Stock Count What’s IN (June-16) What’s OUT (Mar-16)
Stocks as on March 2016 68 Stocks as on
June 2016 65 StockHolding
(%)Stock
Holding (%)
Market Capitalization Lupin Ltd 2.53 Hexaware Technologies Ltd 2.1
TVS Motor Company Ltd 1.83 Torrent Power Ltd 1.66The Ramco Cements Ltd 1.73 Divis Laboratories Ltd 1.57Greenply Industries Ltd 1.56 Godfrey Phillips India Ltd 1.06
SRF Ltd1.27 Crompton Greaves Consumer
Electrical Ltd0.87
United Breweries Ltd 0.87 Blue Dart Express Ltd 0.81Ujjivan Financial Services Ltd 0.73 Glenmark Pharmaceuticals Ltd 0.53KEI Industries Ltd 0.38 Britannia Industries Ltd 0.51Aditya Birla Nuvo Ltd 0.0004 NIIT Technologies Ltd 0.48
Triveni Turbine Ltd 0.39Pricol Ltd 0.31Titan Company Ltd 0.0047
Top Stocks Top Sectors
March 2016 June 2016 March 2016 June 2016
StockHolding
(%)Stock
Holding (%)
SectorHolding
(%)Sector
Holding (%)
Kotak Mahindra Bank Ltd 4.42 IndusInd Bank Ltd 3.80 Banks 12.85 Banks 12.55Hindustan Petroleum Corporation Ltd
3.65 Hindustan Petroleum Corporation Ltd
3.56 Pharmaceuticals 12.20 Pharmaceuticals 12.29
Torrent Pharmaceuticals Ltd 3.44 Kotak Mahindra Bank Ltd 3.50 Miscellaneous 10.46 Miscellaneous 11.86Federal Bank Ltd 3.04 Federal Bank Ltd 3.11 Auto Ancillaries 6.80 Auto Ancillaries 6.67ICICI Bank Ltd 2.99 Exide Industries Ltd 3.02 Computers 5.17 Personal Care 4.17
0
10
20
30
40
50
Mar-16 Apr-16 May-16 Jun-16
Large Cap Mid CapSmall Cap Micro Cap
Inception July 9, 2010 Investment StrategyFund Manager Neelesh Surana The mandate of the fund states that the stocks included in the portfolio will not be a part of the
top 100 stocks by market capitalization and at the time of investment should have a market capitalization of at least INR 100 crore. As far as this fund is concerned, there is no bias towards a theme, sector or style while picking stocks for the portfolio. The Fund Manager has the flexibility to include a large number of stocks in the portfolio so as to avoid concentration and liquidity risk.
AUM (June-16) Rs. 1871 Crore
Exit Load(As on June 2016)
2.00% on or before 6M,1.00% after 6M But on or before 1Y, NIL after 1Y
12 Recommended Funds 2016 – Portfolio & Performance Update (Mar’16-June’16) – iFAST Research
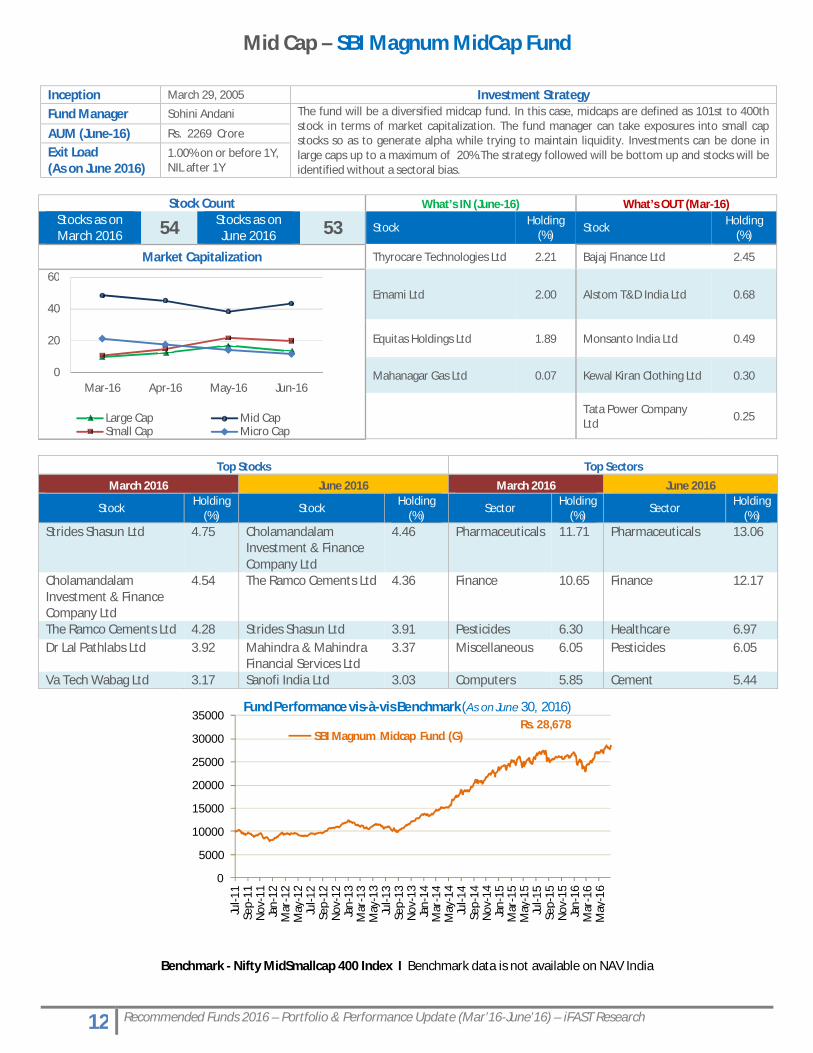
Mid Cap – SBI Magnum MidCap Fund
Stock Count What’s IN (June-16) What’s OUT (Mar-16)Stocks as on March 2016 54 Stocks as on
June 2016 53 Stock Holding (%)
Stock Holding (%)
Market Capitalization Thyrocare Technologies Ltd 2.21 Bajaj Finance Ltd 2.45
Emami Ltd 2.00 Alstom T&D India Ltd 0.68
Equitas Holdings Ltd 1.89 Monsanto India Ltd 0.49
Mahanagar Gas Ltd 0.07 Kewal Kiran Clothing Ltd 0.30
Tata Power Company Ltd
0.25
Top Stocks Top Sectors
March 2016 June 2016 March 2016 June 2016
StockHolding
(%)Stock
Holding (%)
SectorHolding
(%)Sector
Holding (%)
Strides Shasun Ltd 4.75 Cholamandalam Investment & Finance Company Ltd
4.46 Pharmaceuticals 11.71 Pharmaceuticals 13.06
Cholamandalam Investment & Finance Company Ltd
4.54 The Ramco Cements Ltd 4.36 Finance 10.65 Finance 12.17
The Ramco Cements Ltd 4.28 Strides Shasun Ltd 3.91 Pesticides 6.30 Healthcare 6.97Dr Lal Pathlabs Ltd 3.92 Mahindra & Mahindra
Financial Services Ltd3.37 Miscellaneous 6.05 Pesticides 6.05
Va Tech Wabag Ltd 3.17 Sanofi India Ltd 3.03 Computers 5.85 Cement 5.44
Benchmark - Nifty MidSmallcap 400 Index I Benchmark data is not available on NAV India
0
20
40
60
Mar-16 Apr-16 May-16 Jun-16
Large Cap Mid CapSmall Cap Micro Cap
0
5000
10000
15000
20000
25000
30000
35000
Jul-1
1Se
p-11
Nov
-11
Jan-
12M
ar-1
2M
ay-1
2Ju
l-12
Sep-
12N
ov-1
2Ja
n-13
Mar
-13
May
-13
Jul-1
3Se
p-13
Nov
-13
Jan-
14M
ar-1
4M
ay-1
4Ju
l-14
Sep-
14N
ov-1
4Ja
n-15
Mar
-15
May
-15
Jul-1
5Se
p-15
Nov
-15
Jan-
16M
ar-1
6M
ay-1
6
Fund Performance vis-à-vis Benchmark (As on June 30, 2016)
SBI Magnum Midcap Fund (G)Rs. 28,678
Inception March 29, 2005 Investment StrategyFund Manager Sohini Andani The fund will be a diversified midcap fund. In this case, midcaps are defined as 101st to 400th
stock in terms of market capitalization. The fund manager can take exposures into small cap stocks so as to generate alpha while trying to maintain liquidity. Investments can be done in large caps up to a maximum of 20%.The strategy followed will be bottom up and stocks will be identified without a sectoral bias.
AUM (June-16) Rs. 2269 Crore
Exit Load(As on June 2016)
1.00% on or before 1Y,NIL after 1Y
13 Recommended Funds 2016 – Portfolio & Performance Update (Mar’16-June’16) – iFAST Research
Mid Cap – Tata Mid Cap Growth Fund
* Rupesh Patel has replaced Atul Bhole as Fund Manager and Danesh Mistry is appointed as Assitant Fund Manager with effect from April 1, 2016.
Stock Count What’s IN (June-16) What’s OUT (Mar-16)Stocks as on March 2016 61 Stocks as on
June 2016 60 StockHolding
(%)Stock
Holding (%)
Market Capitalization Rallis India Ltd 2.13 IndusInd Bank Ltd 1.74Exide Industries Ltd 2.08 Arvind Ltd 1.55United Breweries Ltd 2.04 Pfizer Ltd 1.35City Union Bank Ltd 1.63 Ashok Leyland Ltd 1.03Mahindra CIE Automotive Ltd
1.25 Va Tech Wabag Ltd 0.98
Parag Milk Foods Ltd 1.16 Sundram Fasteners Ltd 0.97Multi Commodity Exchange of India Ltd
1.14 IL&FS Transportation Networks Ltd
0.76
Cholamandalam Investment & Finance Company Ltd
0.99 MBL Infrastructures Ltd 0.73
Dhanuka Agritech Ltd 0.94 BEML Ltd 0.69Oracle Financial Services Software Ltd
0.91 Astra Microwave Products Ltd 0.50
KDDL Ltd 0.19
Top Stocks Top Sectors
March 2016 June 2016 March 2016 June 2016
StockHolding
(%)Stock
Holding (%)
SectorHolding
(%)Sector
Holding (%)
WABCO India Ltd 3.31 Yes Bank Ltd 3.88 Construction 10.39 Construction 9.40Yes Bank Ltd 3.27 WABCO India Ltd 2.86 Pharmaceuticals 10.35 Pharmaceuticals 8.54Glenmark Pharmaceuticals Ltd
3.01 Glenmark Pharmaceuticals Ltd
2.79 Textile 7.78 Banks 7.55
Sadbhav Engineering Ltd 2.78 Sadbhav Engineering Ltd 2.56 Banks 6.80 Auto Ancillaries 7.22Amara Raja Batteries Ltd 2.50 Shree Cement Ltd 2.55 Cement 6.57 Cement 6.81
0
10
20
30
40
Large Cap Mid CapSmall Cap Micro Cap
Inception July 1, 1994 Investment Strategy
Fund Manager* Rupesh Patel, Danesh Mistry
As per the mandate, the fund will invest at least 65% of the corpus in mid cap stocks. Mid Caps are defined as those companies that are either included in the Nifty Midcap 100 or one that fall within the market cap requirement of Nifty Midcap 100.The SID clearly mentions that “the fund may invest not more than 25% of the net assets (of all the Schemes of the Fund) in listed securities (equity & debt instruments) of Group companies”.
AUM (June-16) Rs. 571 Crore
Exit Load(As on June 2016)
1.00% on or before 365D, NIL after 365D
14 Recommended Funds 2016 – Portfolio & Performance Update (Mar’16-June’16) – iFAST Research
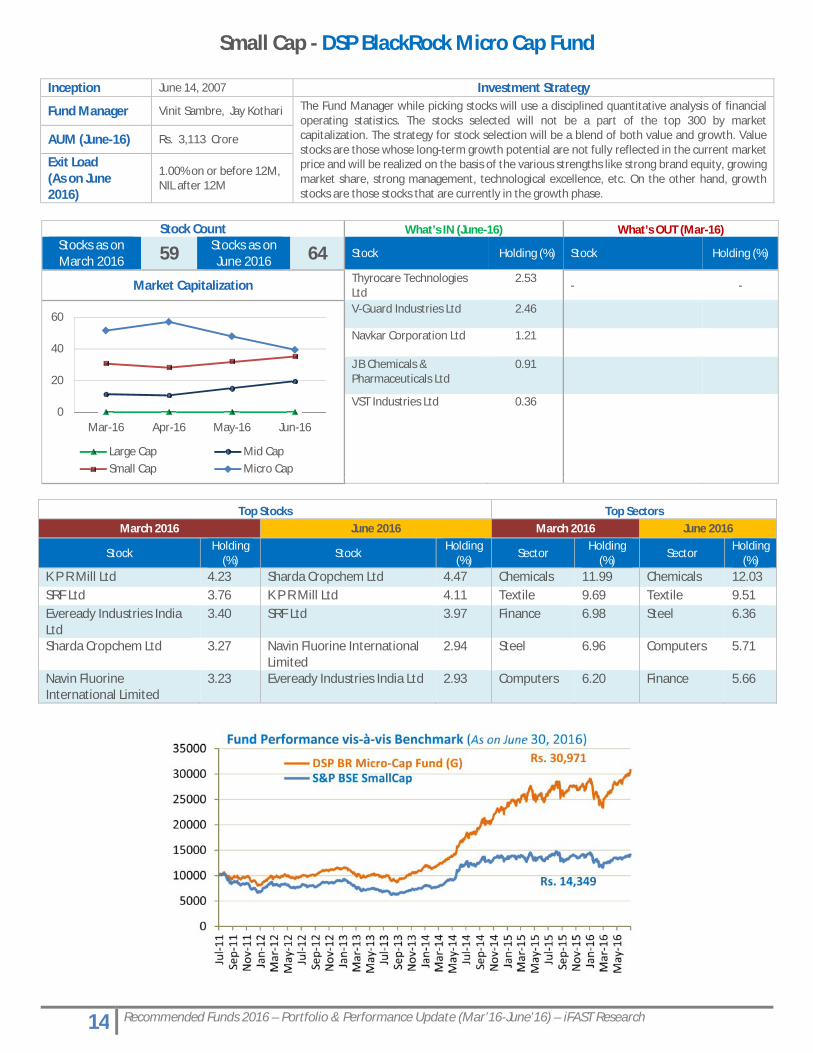
Small Cap - DSP BlackRock Micro Cap Fund
Stock Count What’s IN (June-16) What’s OUT (Mar-16)Stocks as on March 2016 59 Stocks as on
June 2016 64 Stock Holding (%) Stock Holding (%)
Market Capitalization Thyrocare Technologies Ltd
2.53- -
V-Guard Industries Ltd 2.46
Navkar Corporation Ltd 1.21
J B Chemicals & Pharmaceuticals Ltd
0.91
VST Industries Ltd 0.36
Top Stocks Top SectorsMarch 2016 June 2016 March 2016 June 2016
StockHolding
(%) StockHolding
(%) SectorHolding
(%) SectorHolding
(%)K P R Mill Ltd 4.23 Sharda Cropchem Ltd 4.47 Chemicals 11.99 Chemicals 12.03SRF Ltd 3.76 K P R Mill Ltd 4.11 Textile 9.69 Textile 9.51Eveready Industries India Ltd
3.40 SRF Ltd 3.97 Finance 6.98 Steel 6.36
Sharda Cropchem Ltd 3.27 Navin Fluorine International Limited
2.94 Steel 6.96 Computers 5.71
Navin Fluorine International Limited
3.23 Eveready Industries India Ltd 2.93 Computers 6.20 Finance 5.66
0
20
40
60
Mar-16 Apr-16 May-16 Jun-16
Large Cap Mid CapSmall Cap Micro Cap
Inception June 14, 2007 Investment Strategy
Fund Manager Vinit Sambre, Jay Kothari The Fund Manager while picking stocks will use a disciplined quantitative analysis of financial operating statistics. The stocks selected will not be a part of the top 300 by market capitalization. The strategy for stock selection will be a blend of both value and growth. Value stocks are those whose long-term growth potential are not fully reflected in the current market price and will be realized on the basis of the various strengths like strong brand equity, growing market share, strong management, technological excellence, etc. On the other hand, growth stocks are those stocks that are currently in the growth phase.
AUM (June-16) Rs. 3,113 Crore
Exit Load(As on June 2016)
1.00% on or before 12M,NIL after 12M
15 Recommended Funds 2016 – Portfolio & Performance Update (Mar’16-June’16) – iFAST Research
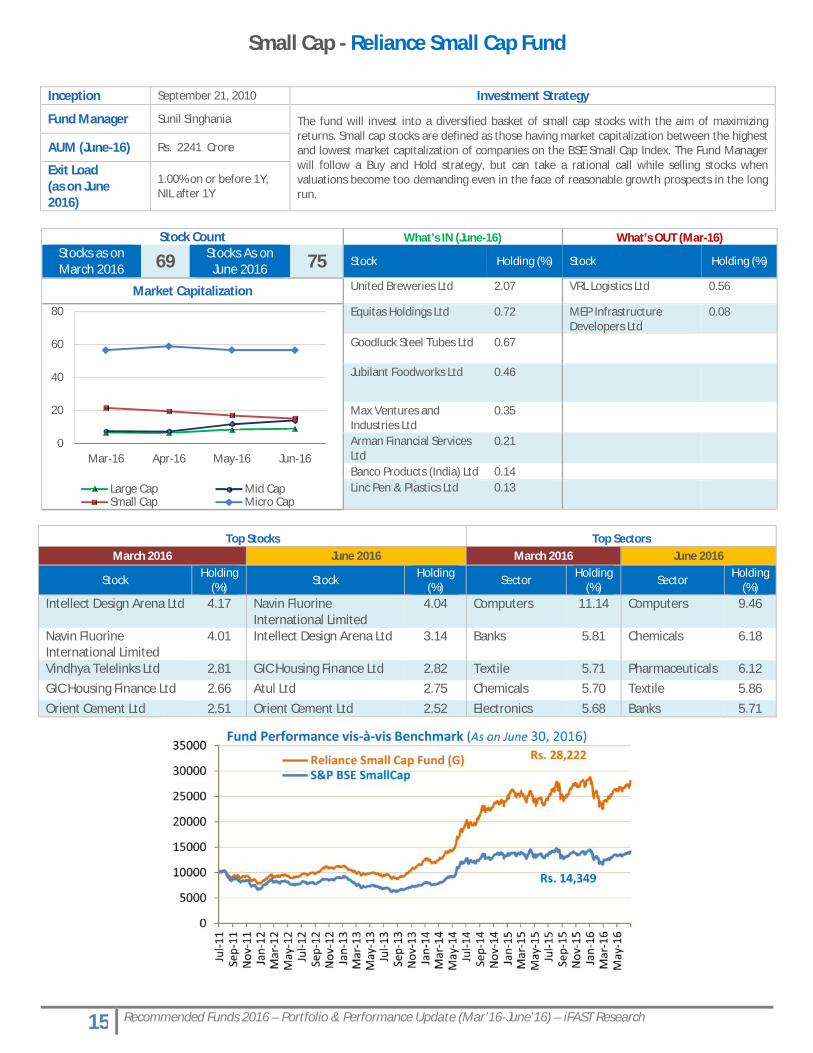
Small Cap - Reliance Small Cap Fund
Stock Count What’s IN (June-16) What’s OUT (Mar-16)Stocks as on March 2016 69 Stocks As on
June 2016 75 Stock Holding (%) Stock Holding (%)
Market Capitalization United Breweries Ltd 2.07 VRL Logistics Ltd 0.56
Equitas Holdings Ltd 0.72 MEP Infrastructure Developers Ltd
0.08
Goodluck Steel Tubes Ltd 0.67
Jubilant Foodworks Ltd 0.46
Max Ventures and Industries Ltd
0.35
Arman Financial Services Ltd
0.21
Banco Products (India) Ltd 0.14Linc Pen & Plastics Ltd 0.13
Top Stocks Top SectorsMarch 2016 June 2016 March 2016 June 2016
StockHolding
(%) StockHolding
(%) SectorHolding
(%) SectorHolding
(%)Intellect Design Arena Ltd 4.17 Navin Fluorine
International Limited4.04 Computers 11.14 Computers 9.46
Navin Fluorine International Limited
4.01 Intellect Design Arena Ltd 3.14 Banks 5.81 Chemicals 6.18
Vindhya Telelinks Ltd 2.81 GIC Housing Finance Ltd 2.82 Textile 5.71 Pharmaceuticals 6.12GIC Housing Finance Ltd 2.66 Atul Ltd 2.75 Chemicals 5.70 Textile 5.86Orient Cement Ltd 2.51 Orient Cement Ltd 2.52 Electronics 5.68 Banks 5.71
0
20
40
60
80
Mar-16 Apr-16 May-16 Jun-16
Large Cap Mid CapSmall Cap Micro Cap
Inception September 21, 2010 Investment Strategy
Fund Manager Sunil Singhania The fund will invest into a diversified basket of small cap stocks with the aim of maximizing returns. Small cap stocks are defined as those having market capitalization between the highest and lowest market capitalization of companies on the BSE Small Cap Index. The Fund Manager will follow a Buy and Hold strategy, but can take a rational call while selling stocks when valuations become too demanding even in the face of reasonable growth prospects in the long run.
AUM (June-16) Rs. 2241 Crore
Exit Load(as on June 2016)
1.00% on or before 1Y,NIL after 1Y
16 Recommended Funds 2016 – Portfolio & Performance Update (Mar’16-June’16) – iFAST Research
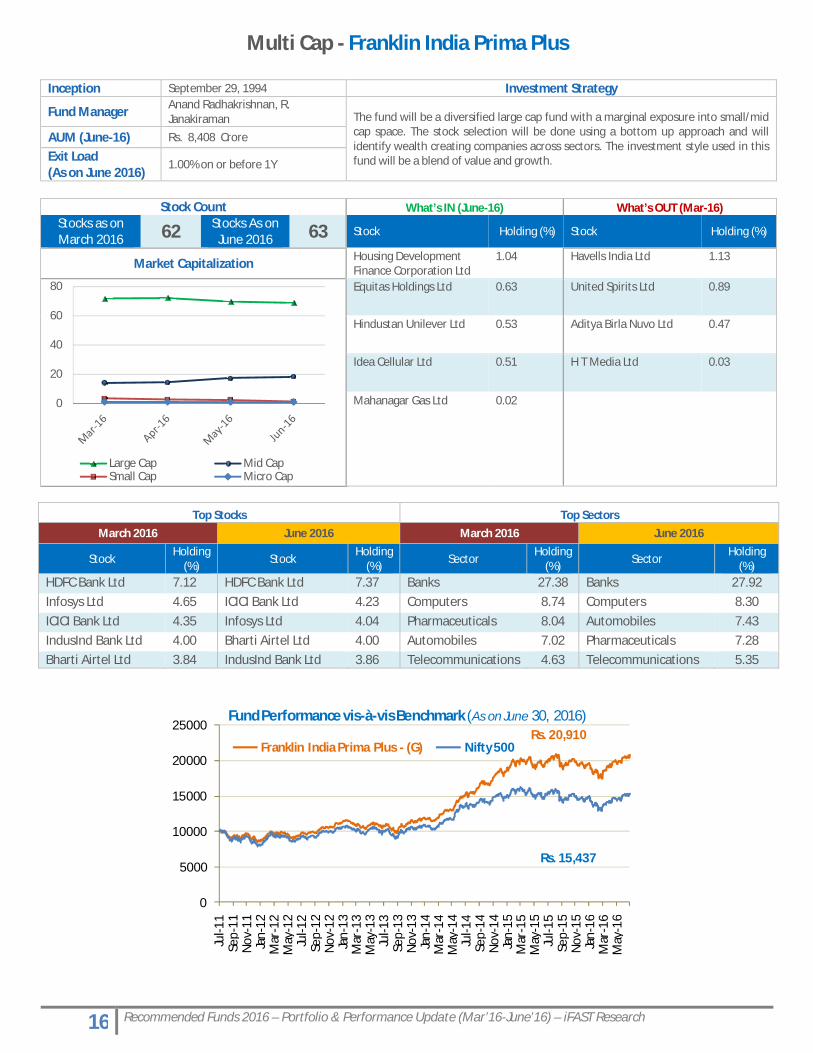
Multi Cap - Franklin India Prima Plus
Stock Count What’s IN (June-16) What’s OUT (Mar-16)Stocks as on March 2016 62 Stocks As on
June 2016 63 Stock Holding (%) Stock Holding (%)
Market Capitalization Housing Development Finance Corporation Ltd
1.04 Havells India Ltd 1.13
Equitas Holdings Ltd 0.63 United Spirits Ltd 0.89
Hindustan Unilever Ltd 0.53 Aditya Birla Nuvo Ltd 0.47
Idea Cellular Ltd 0.51 H T Media Ltd 0.03
Mahanagar Gas Ltd 0.02
Top Stocks Top SectorsMarch 2016 June 2016 March 2016 June 2016
StockHolding
(%) StockHolding
(%) SectorHolding
(%) SectorHolding
(%)HDFC Bank Ltd 7.12 HDFC Bank Ltd 7.37 Banks 27.38 Banks 27.92Infosys Ltd 4.65 ICICI Bank Ltd 4.23 Computers 8.74 Computers 8.30ICICI Bank Ltd 4.35 Infosys Ltd 4.04 Pharmaceuticals 8.04 Automobiles 7.43IndusInd Bank Ltd 4.00 Bharti Airtel Ltd 4.00 Automobiles 7.02 Pharmaceuticals 7.28Bharti Airtel Ltd 3.84 IndusInd Bank Ltd 3.86 Telecommunications 4.63 Telecommunications 5.35
0
20
40
60
80
Large Cap Mid CapSmall Cap Micro Cap
0
5000
10000
15000
20000
25000
Jul-1
1Se
p-11
Nov
-11
Jan-
12M
ar-1
2M
ay-1
2Ju
l-12
Sep-
12N
ov-1
2Ja
n-13
Mar
-13
May
-13
Jul-1
3Se
p-13
Nov
-13
Jan-
14M
ar-1
4M
ay-1
4Ju
l-14
Sep-
14N
ov-1
4Ja
n-15
Mar
-15
May
-15
Jul-1
5Se
p-15
Nov
-15
Jan-
16M
ar-1
6M
ay-1
6
Fund Performance vis-à-vis Benchmark (As on June 30, 2016)
Franklin India Prima Plus - (G) Nifty 500
Rs. 15,437
Rs. 20,910
Inception September 29, 1994 Investment Strategy
Fund Manager Anand Radhakrishnan, R. Janakiraman The fund will be a diversified large cap fund with a marginal exposure into small/mid
cap space. The stock selection will be done using a bottom up approach and will identify wealth creating companies across sectors. The investment style used in this fund will be a blend of value and growth.
AUM (June-16) Rs. 8,408 Crore
Exit Load(As on June 2016)
1.00% on or before 1Y
17 Recommended Funds 2016 – Portfolio & Performance Update (Mar’16-June’16) – iFAST Research
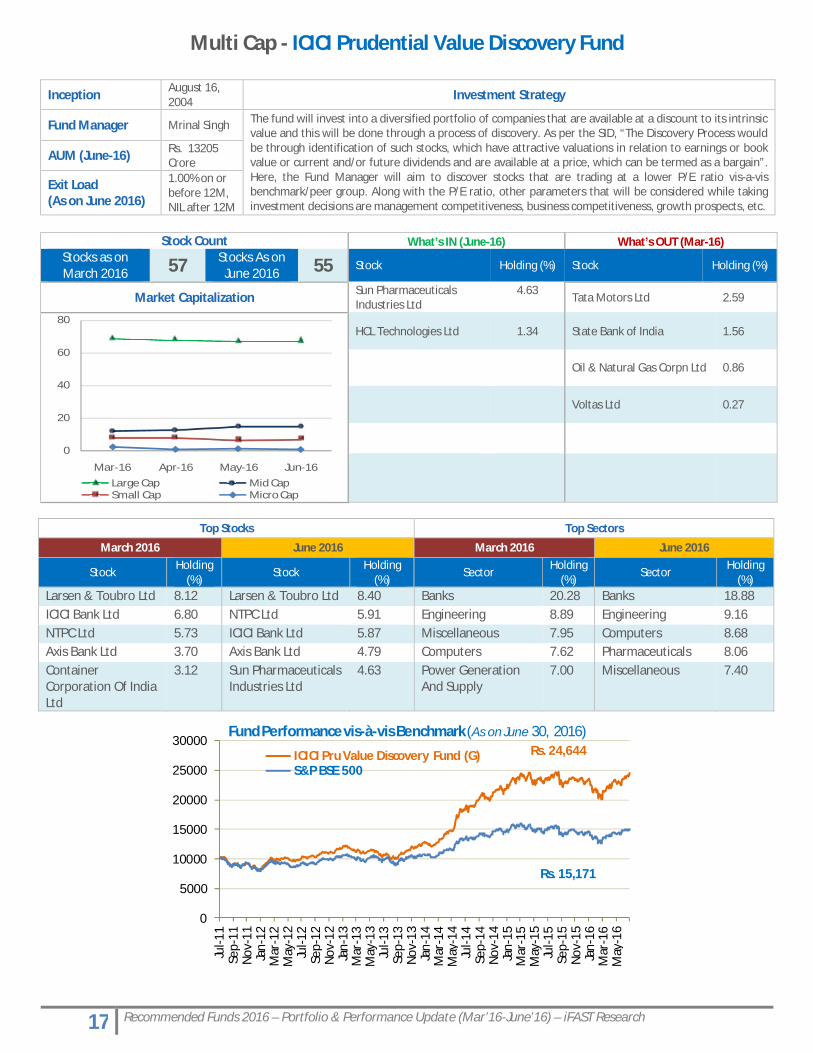
Multi Cap - ICICI Prudential Value Discovery Fund
Stock Count What’s IN (June-16) What’s OUT (Mar-16)Stocks as on March 2016 57 Stocks As on
June 2016 55 Stock Holding (%) Stock Holding (%)
Market Capitalization Sun Pharmaceuticals Industries Ltd
4.63Tata Motors Ltd 2.59
HCL Technologies Ltd 1.34 State Bank of India 1.56
Oil & Natural Gas Corpn Ltd 0.86
Voltas Ltd 0.27
Top Stocks Top Sectors
March 2016 June 2016 March 2016 June 2016
StockHolding
(%)Stock
Holding (%)
SectorHolding
(%)Sector
Holding (%)
Larsen & Toubro Ltd 8.12 Larsen & Toubro Ltd 8.40 Banks 20.28 Banks 18.88ICICI Bank Ltd 6.80 NTPC Ltd 5.91 Engineering 8.89 Engineering 9.16NTPC Ltd 5.73 ICICI Bank Ltd 5.87 Miscellaneous 7.95 Computers 8.68Axis Bank Ltd 3.70 Axis Bank Ltd 4.79 Computers 7.62 Pharmaceuticals 8.06Container Corporation Of India Ltd
3.12 Sun Pharmaceuticals Industries Ltd
4.63 Power Generation And Supply
7.00 Miscellaneous 7.40
0
20
40
60
80
Mar-16 Apr-16 May-16 Jun-16Large Cap Mid CapSmall Cap Micro Cap
0
5000
10000
15000
20000
25000
30000
Jul-1
1Se
p-11
Nov-
11Ja
n-12
Mar
-12
May
-12
Jul-1
2Se
p-12
Nov-
12Ja
n-13
Mar
-13
May
-13
Jul-1
3Se
p-13
Nov-
13Ja
n-14
Mar
-14
May
-14
Jul-1
4Se
p-14
Nov-
14Ja
n-15
Mar
-15
May
-15
Jul-1
5Se
p-15
Nov-
15Ja
n-16
Mar
-16
May
-16
Fund Performance vis-à-vis Benchmark (As on June 30, 2016)
ICICI Pru Value Discovery Fund (G)S&P BSE 500
Rs. 15,171
Rs. 24,644
Inception August 16, 2004 Investment Strategy
Fund Manager Mrinal Singh The fund will invest into a diversified portfolio of companies that are available at a discount to its intrinsic value and this will be done through a process of discovery. As per the SID, “The Discovery Process would be through identification of such stocks, which have attractive valuations in relation to earnings or book value or current and/or future dividends and are available at a price, which can be termed as a bargain”. Here, the Fund Manager will aim to discover stocks that are trading at a lower P/E ratio vis-a-vis benchmark/peer group. Along with the P/E ratio, other parameters that will be considered while taking investment decisions are management competitiveness, business competitiveness, growth prospects, etc.
AUM (June-16) Rs. 13205 Crore
Exit Load(As on June 2016)
1.00% on or before 12M,NIL after 12M
18 Recommended Funds 2016 – Portfolio & Performance Update (Mar’16-June’16) – iFAST Research
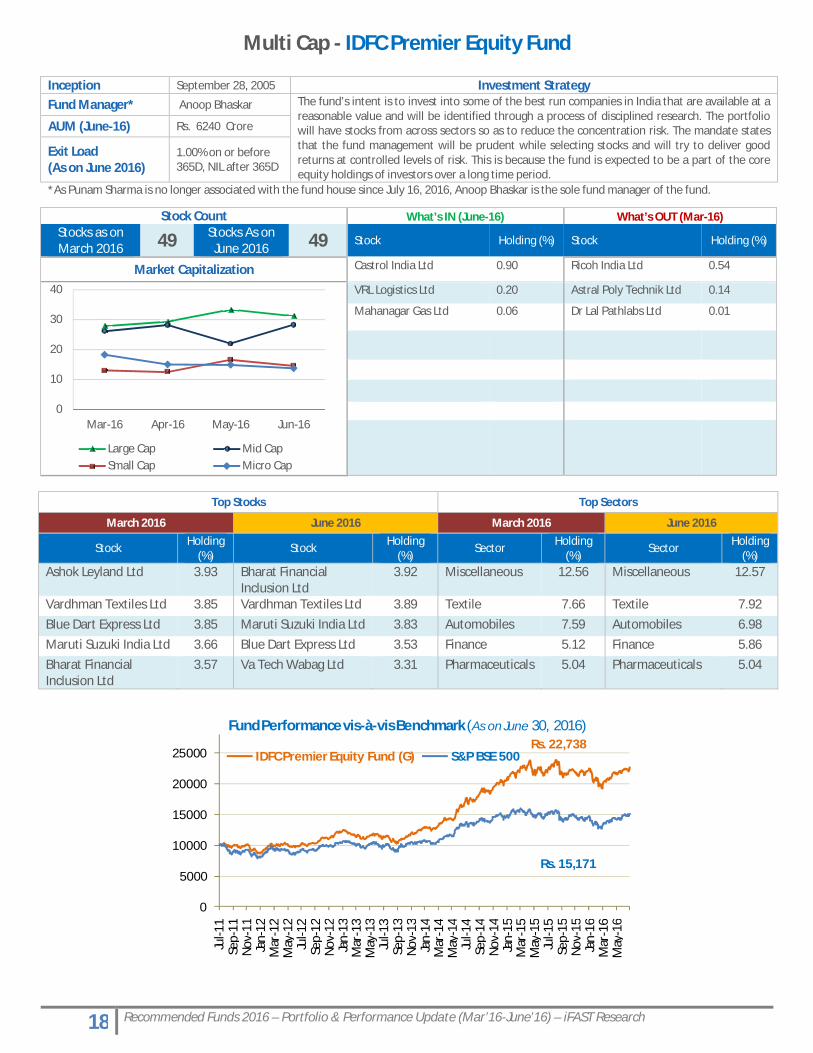
Multi Cap - IDFC Premier Equity Fund
*As Punam Sharma is no longer associated with the fund house since July 16, 2016, Anoop Bhaskar is the sole fund manager of the fund.
Stock Count What’s IN (June-16) What’s OUT (Mar-16)Stocks as on March 2016 49 Stocks As on
June 2016 49 Stock Holding (%) Stock Holding (%)
Market Capitalization Castrol India Ltd 0.90 Ricoh India Ltd 0.54
VRL Logistics Ltd 0.20 Astral Poly Technik Ltd 0.14
Mahanagar Gas Ltd 0.06 Dr Lal Pathlabs Ltd 0.01
Top Stocks Top Sectors
March 2016 June 2016 March 2016 June 2016
Stock Holding (%)
Stock Holding (%)
Sector Holding (%)
Sector Holding (%)
Ashok Leyland Ltd 3.93 Bharat Financial Inclusion Ltd
3.92 Miscellaneous 12.56 Miscellaneous 12.57
Vardhman Textiles Ltd 3.85 Vardhman Textiles Ltd 3.89 Textile 7.66 Textile 7.92Blue Dart Express Ltd 3.85 Maruti Suzuki India Ltd 3.83 Automobiles 7.59 Automobiles 6.98Maruti Suzuki India Ltd 3.66 Blue Dart Express Ltd 3.53 Finance 5.12 Finance 5.86Bharat Financial Inclusion Ltd
3.57 Va Tech Wabag Ltd 3.31 Pharmaceuticals 5.04 Pharmaceuticals 5.04
0
10
20
30
40
Mar-16 Apr-16 May-16 Jun-16
Large Cap Mid CapSmall Cap Micro Cap
0
5000
10000
15000
20000
25000
Jul-1
1Se
p-11
Nov-
11Ja
n-12
Mar
-12
May
-12
Jul-1
2Se
p-12
Nov-
12Ja
n-13
Mar
-13
May
-13
Jul-1
3Se
p-13
Nov-
13Ja
n-14
Mar
-14
May
-14
Jul-1
4Se
p-14
Nov-
14Ja
n-15
Mar
-15
May
-15
Jul-1
5Se
p-15
Nov-
15Ja
n-16
Mar
-16
May
-16
Fund Performance vis-à-vis Benchmark (As on June 30, 2016)
IDFC Premier Equity Fund (G) S&P BSE 500
Rs. 15,171
Rs. 22,738
Inception September 28, 2005 Investment StrategyFund Manager* Anoop Bhaskar The fund’s intent is to invest into some of the best run companies in India that are available at a
reasonable value and will be identified through a process of disciplined research. The portfolio will have stocks from across sectors so as to reduce the concentration risk. The mandate states that the fund management will be prudent while selecting stocks and will try to deliver good returns at controlled levels of risk. This is because the fund is expected to be a part of the core equity holdings of investors over a long time period.
AUM (June-16) Rs. 6240 Crore
Exit Load(As on June 2016)
1.00% on or before 365D, NIL after 365D
19 Recommended Funds 2016 – Portfolio & Performance Update (Mar’16-June’16) – iFAST Research
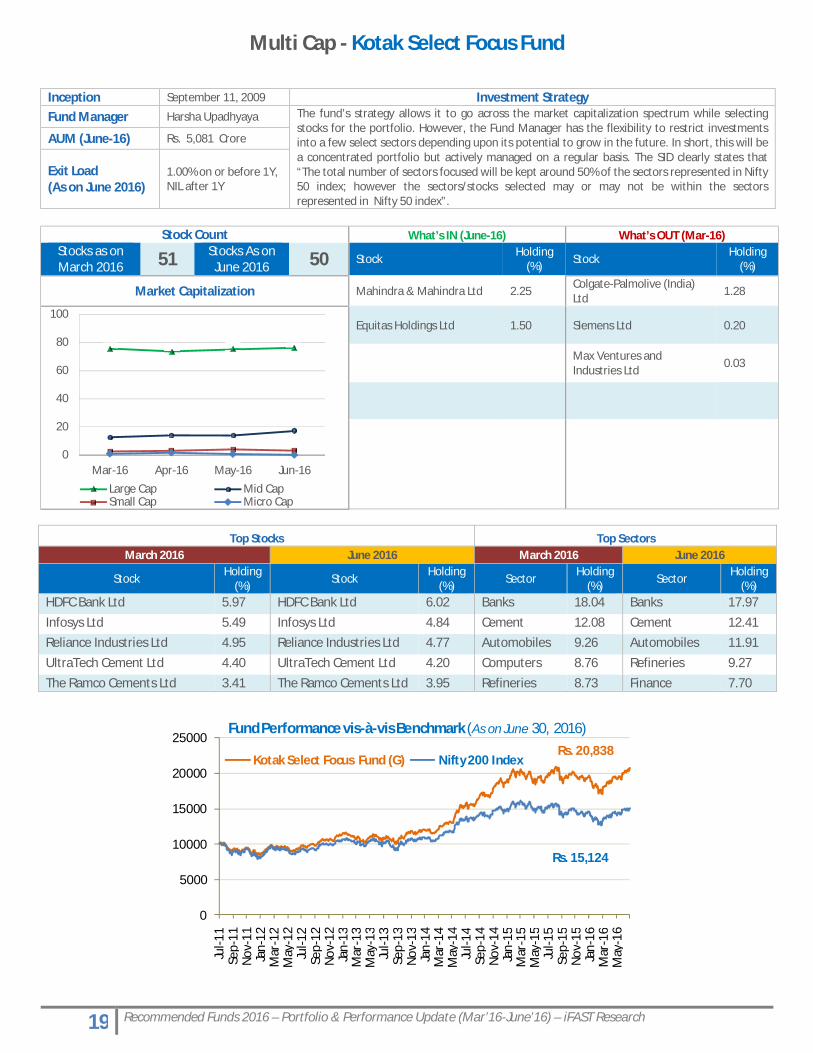
Multi Cap - Kotak Select Focus Fund
Stock Count What’s IN (June-16) What’s OUT (Mar-16)Stocks as on March 2016 51 Stocks As on
June 2016 50 StockHolding
(%) StockHolding
(%)
Market Capitalization Mahindra & Mahindra Ltd 2.25Colgate-Palmolive (India) Ltd
1.28
Equitas Holdings Ltd 1.50 Siemens Ltd 0.20
Max Ventures and Industries Ltd
0.03
Top Stocks Top SectorsMarch 2016 June 2016 March 2016 June 2016
StockHolding
(%) StockHolding
(%) SectorHolding
(%) SectorHolding
(%)HDFC Bank Ltd 5.97 HDFC Bank Ltd 6.02 Banks 18.04 Banks 17.97
Infosys Ltd 5.49 Infosys Ltd 4.84 Cement 12.08 Cement 12.41Reliance Industries Ltd 4.95 Reliance Industries Ltd 4.77 Automobiles 9.26 Automobiles 11.91
UltraTech Cement Ltd 4.40 UltraTech Cement Ltd 4.20 Computers 8.76 Refineries 9.27
The Ramco Cements Ltd 3.41 The Ramco Cements Ltd 3.95 Refineries 8.73 Finance 7.70
0
20
40
60
80
100
Mar-16 Apr-16 May-16 Jun-16
Large Cap Mid CapSmall Cap Micro Cap
0
5000
10000
15000
20000
25000
Jul-1
1Se
p-11
Nov
-11
Jan-
12M
ar-1
2M
ay-1
2Ju
l-12
Sep-
12N
ov-1
2Ja
n-13
Mar
-13
May
-13
Jul-1
3Se
p-13
Nov
-13
Jan-
14M
ar-1
4M
ay-1
4Ju
l-14
Sep-
14N
ov-1
4Ja
n-15
Mar
-15
May
-15
Jul-1
5Se
p-15
Nov
-15
Jan-
16M
ar-1
6M
ay-1
6
Fund Performance vis-à-vis Benchmark (As on June 30, 2016)
Kotak Select Focus Fund (G) Nifty 200 Index
Rs. 15,124
Rs. 20,838
Inception September 11, 2009 Investment StrategyFund Manager Harsha Upadhyaya The fund’s strategy allows it to go across the market capitalization spectrum while selecting
stocks for the portfolio. However, the Fund Manager has the flexibility to restrict investments into a few select sectors depending upon its potential to grow in the future. In short, this will be a concentrated portfolio but actively managed on a regular basis. The SID clearly states that “The total number of sectors focused will be kept around 50% of the sectors represented in Nifty50 index; however the sectors/stocks selected may or may not be within the sectors represented in Nifty 50 index”.
AUM (June-16) Rs. 5,081 Crore
Exit Load(As on June 2016)
1.00% on or before 1Y,NIL after 1Y
20 Recommended Funds 2016 – Portfolio & Performance Update (Mar’16-June’16) – iFAST Research
Multi Cap - Reliance Equity Opportunities Fund
Inception March 31, 2005 Investment Strategy
Fund Manager Sailesh Raj Bhan The fund will be a diversified portfolio consisting of a broad range of companies. The selection of stocks will be a combination of top down approach, which is Sector-Industry-Company and Bottoms up approach, which is Company-Industry-Sector. The Fund Manager will be using a blend of both value and growth strategies while scouting for stocks on the belief that there will be ongoing structural changes in the government policies, infrastructure spending and continuous global economic reforms that tries to integrate different economies across the globe.
AUM (June-16) Rs. 10,824 Crore
Exit Load(As on June 2016)
1.00% on or before 1Y,NIL after 1Y
Stock Count What’s IN (June-16) What’s OUT (Mar-16)Stocks as on March 2016 56 Stocks As on
June 2016 52 StockHolding
(%)Stock
Holding (%)
Market Capitalization ITC Ltd 1.77 Cyient Ltd 0.83
Indian Oil Corporation Ltd 0.47 Oriental Bank of Commerce
0.45
Thermax Ltd 0.44
Hindustan Media Ventures Ltd
0.08
Adlabs Entertainment Ltd 0.07Max Ventures and Industries Ltd 0.04
Top Stocks Top SectorsMarch 2016 June 2016 March 2016 June 2016
StockHolding
(%)Stock
Holding (%)
SectorHolding
(%)Sector
Holding (%)
State Bank of India 5.97 State Bank of India 6.86 Banks 21.72 Banks 22.60
HDFC Bank Ltd 5.97 Indian Hotels Co Ltd 5.73 Pharmaceuticals 10.62 Pharmaceuticals 8.62
ICICI Bank Ltd 4.78 ICICI Bank Ltd 5.41 Electric Equipment 8.21 Electric Equipment 8.27
Indian Hotels Co Ltd 4.48 HDFC Bank Ltd 5.40 Computers 7.90 Hotels 7.64Divis Laboratories Ltd 3.98 Larsen & Toubro Ltd 4.14 Textile 7.49 Textile 7.00
0
10
20
30
40
50
60
Mar-16 Apr-16 May-16 Jun-16
Large Cap Mid CapSmall Cap Micro Cap
21 Recommended Funds 2016 – Portfolio & Performance Update (Mar’16-June’16) – iFAST Research
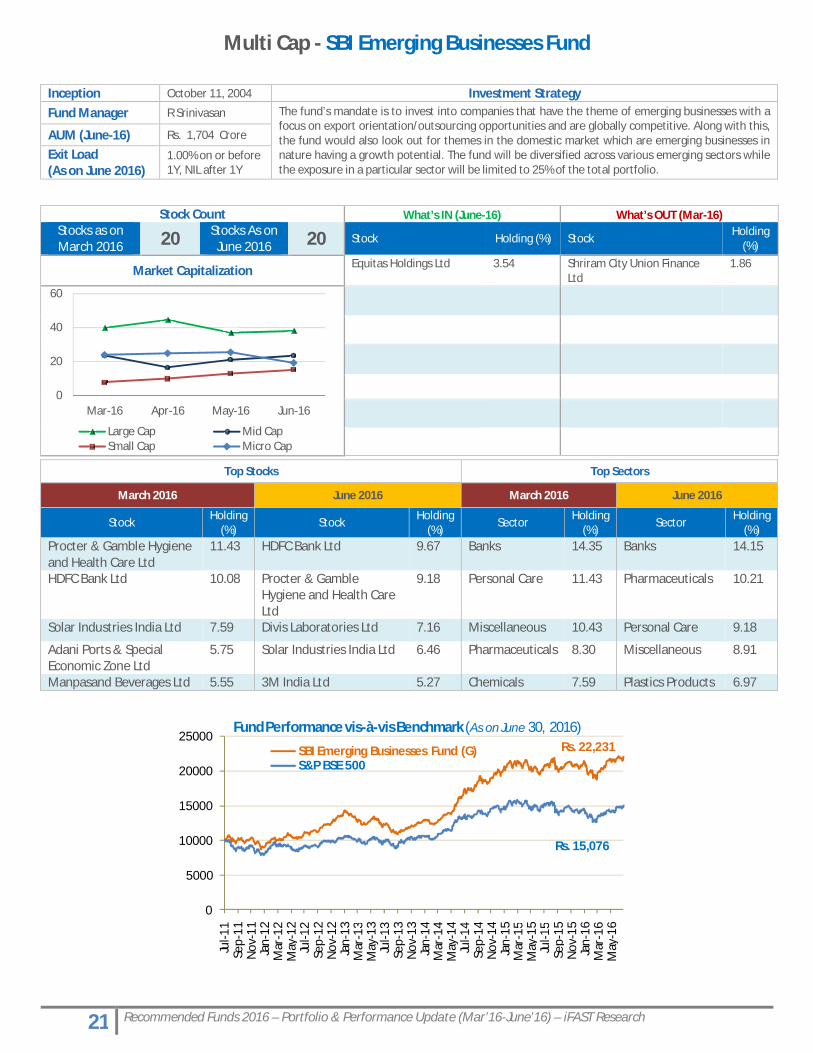
Multi Cap - SBI Emerging Businesses Fund
0
5000
10000
15000
20000
25000
Jul-1
1Se
p-11
Nov
-11
Jan-
12M
ar-1
2M
ay-1
2Ju
l-12
Sep-
12N
ov-1
2Ja
n-13
Mar
-13
May
-13
Jul-1
3Se
p-13
Nov
-13
Jan-
14M
ar-1
4M
ay-1
4Ju
l-14
Sep-
14N
ov-1
4Ja
n-15
Mar
-15
May
-15
Jul-1
5Se
p-15
Nov
-15
Jan-
16M
ar-1
6M
ay-1
6
Fund Performance vis-à-vis Benchmark (As on June 30, 2016)
SBI Emerging Businesses Fund (G)S&P BSE 500
Rs. 15,076
Rs. 22,231
Inception October 11, 2004 Investment StrategyFund Manager R Srinivasan The fund’s mandate is to invest into companies that have the theme of emerging businesses with a
focus on export orientation/outsourcing opportunities and are globally competitive. Along with this, the fund would also look out for themes in the domestic market which are emerging businesses in nature having a growth potential. The fund will be diversified across various emerging sectors while the exposure in a particular sector will be limited to 25% of the total portfolio.
AUM (June-16) Rs. 1,704 Crore
Exit Load(As on June 2016)
1.00% on or before 1Y, NIL after 1Y
Top Stocks Top Sectors
March 2016 June 2016 March 2016 June 2016
Stock Holding (%)
Stock Holding (%)
Sector Holding (%)
Sector Holding (%)
Procter & Gamble Hygiene and Health Care Ltd
11.43 HDFC Bank Ltd 9.67 Banks 14.35 Banks 14.15
HDFC Bank Ltd 10.08 Procter & Gamble Hygiene and Health Care Ltd
9.18 Personal Care 11.43 Pharmaceuticals 10.21
Solar Industries India Ltd 7.59 Divis Laboratories Ltd 7.16 Miscellaneous 10.43 Personal Care 9.18
Adani Ports & Special Economic Zone Ltd
5.75 Solar Industries India Ltd 6.46 Pharmaceuticals 8.30 Miscellaneous 8.91
Manpasand Beverages Ltd 5.55 3M India Ltd 5.27 Chemicals 7.59 Plastics Products 6.97
Stock Count What’s IN (June-16) What’s OUT (Mar-16)Stocks as on March 2016 20 Stocks As on
June 2016 20 Stock Holding (%) StockHolding
(%)
Market Capitalization Equitas Holdings Ltd 3.54 Shriram City Union Finance Ltd
1.86
0
20
40
60
Mar-16 Apr-16 May-16 Jun-16
Large Cap Mid CapSmall Cap Micro Cap
22 Recommended Funds 2016 – Portfolio & Performance Update (Mar’16-June’16) – iFAST Research
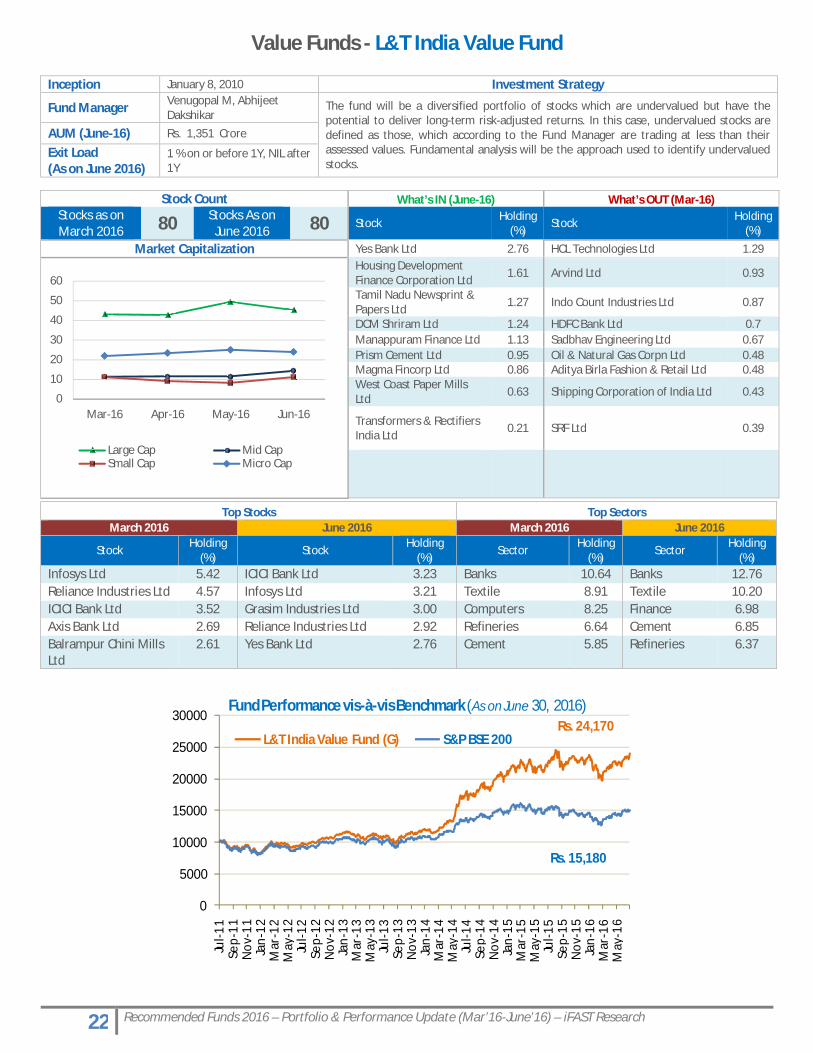
Value Funds - L&T India Value Fund
0
5000
10000
15000
20000
25000
30000
Jul-1
1Se
p-11
Nov
-11
Jan-
12M
ar-1
2M
ay-1
2Ju
l-12
Sep-
12N
ov-1
2Ja
n-13
Mar
-13
May
-13
Jul-1
3Se
p-13
Nov
-13
Jan-
14M
ar-1
4M
ay-1
4Ju
l-14
Sep-
14N
ov-1
4Ja
n-15
Mar
-15
May
-15
Jul-1
5Se
p-15
Nov
-15
Jan-
16M
ar-1
6M
ay-1
6
Fund Performance vis-à-vis Benchmark (As on June 30, 2016)
L&T India Value Fund (G) S&P BSE 200
Rs. 15,180
Rs. 24,170
Inception January 8, 2010 Investment Strategy
Fund Manager Venugopal M, Abhijeet Dakshikar
The fund will be a diversified portfolio of stocks which are undervalued but have the potential to deliver long-term risk-adjusted returns. In this case, undervalued stocks are defined as those, which according to the Fund Manager are trading at less than their assessed values. Fundamental analysis will be the approach used to identify undervalued stocks.
AUM (June-16) Rs. 1,351 Crore
Exit Load(As on June 2016)
1 % on or before 1Y, NIL after 1Y
Top Stocks Top SectorsMarch 2016 June 2016 March 2016 June 2016
StockHolding
(%)Stock
Holding (%)
SectorHolding
(%)Sector
Holding (%)
Infosys Ltd 5.42 ICICI Bank Ltd 3.23 Banks 10.64 Banks 12.76Reliance Industries Ltd 4.57 Infosys Ltd 3.21 Textile 8.91 Textile 10.20ICICI Bank Ltd 3.52 Grasim Industries Ltd 3.00 Computers 8.25 Finance 6.98Axis Bank Ltd 2.69 Reliance Industries Ltd 2.92 Refineries 6.64 Cement 6.85Balrampur Chini Mills Ltd
2.61 Yes Bank Ltd 2.76 Cement 5.85 Refineries 6.37
Stock Count What’s IN (June-16) What’s OUT (Mar-16)Stocks as on March 2016 80 Stocks As on
June 2016 80 Stock Holding (%)
Stock Holding (%)
Market Capitalization Yes Bank Ltd 2.76 HCL Technologies Ltd 1.29Housing Development Finance Corporation Ltd
1.61 Arvind Ltd 0.93
Tamil Nadu Newsprint & Papers Ltd
1.27 Indo Count Industries Ltd 0.87
DCM Shriram Ltd 1.24 HDFC Bank Ltd 0.7Manappuram Finance Ltd 1.13 Sadbhav Engineering Ltd 0.67Prism Cement Ltd 0.95 Oil & Natural Gas Corpn Ltd 0.48Magma Fincorp Ltd 0.86 Aditya Birla Fashion & Retail Ltd 0.48West Coast Paper Mills Ltd
0.63 Shipping Corporation of India Ltd 0.43
Transformers & Rectifiers India Ltd
0.21 SRF Ltd 0.39
0
10
20
30
40
50
60
Mar-16 Apr-16 May-16 Jun-16
Large Cap Mid CapSmall Cap Micro Cap
23 Recommended Funds 2016 – Portfolio & Performance Update (Mar’16-June’16) – iFAST Research
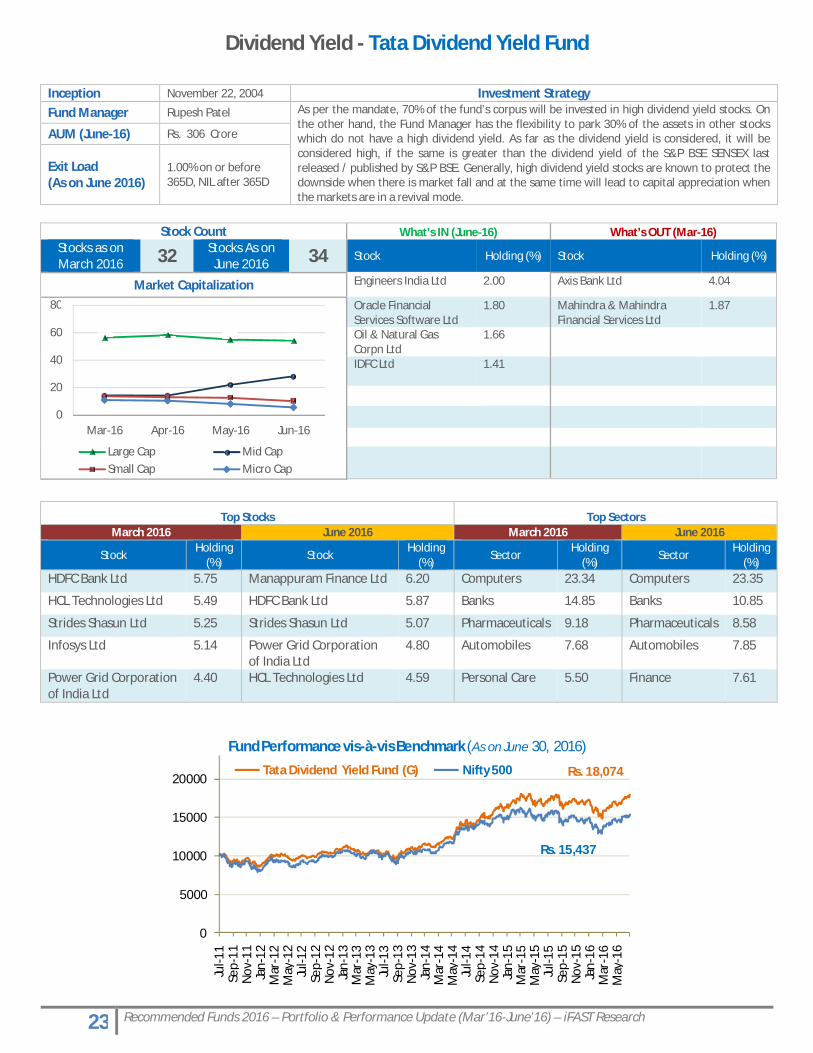
Dividend Yield - Tata Dividend Yield Fund
0
5000
10000
15000
20000
Jul-1
1Se
p-11
Nov
-11
Jan-
12M
ar-1
2M
ay-1
2Ju
l-12
Sep-
12N
ov-1
2Ja
n-13
Mar
-13
May
-13
Jul-1
3Se
p-13
Nov
-13
Jan-
14M
ar-1
4M
ay-1
4Ju
l-14
Sep-
14N
ov-1
4Ja
n-15
Mar
-15
May
-15
Jul-1
5Se
p-15
Nov
-15
Jan-
16M
ar-1
6M
ay-1
6
Fund Performance vis-à-vis Benchmark (As on June 30, 2016)
Tata Dividend Yield Fund (G) Nifty 500
Rs. 15,437
Rs. 18,074
Inception November 22, 2004 Investment StrategyFund Manager Rupesh Patel As per the mandate, 70% of the fund’s corpus will be invested in high dividend yield stocks. On
the other hand, the Fund Manager has the flexibility to park 30% of the assets in other stocks which do not have a high dividend yield. As far as the dividend yield is considered, it will be considered high, if the same is greater than the dividend yield of the S&P BSE SENSEX last released / published by S&P BSE. Generally, high dividend yield stocks are known to protect the downside when there is market fall and at the same time will lead to capital appreciation when the markets are in a revival mode.
AUM (June-16) Rs. 306 Crore
Exit Load(As on June 2016)
1.00% on or before 365D, NIL after 365D
Stock Count What’s IN (June-16) What’s OUT (Mar-16)Stocks as on March 2016 32 Stocks As on
June 2016 34 Stock Holding (%) Stock Holding (%)
Market Capitalization Engineers India Ltd 2.00 Axis Bank Ltd 4.04
Oracle Financial Services Software Ltd
1.80 Mahindra & Mahindra Financial Services Ltd
1.87
Oil & Natural Gas Corpn Ltd
1.66
IDFC Ltd 1.41
Top Stocks Top SectorsMarch 2016 June 2016 March 2016 June 2016
StockHolding
(%)Stock
Holding (%)
SectorHolding
(%)Sector
Holding (%)
HDFC Bank Ltd 5.75 Manappuram Finance Ltd 6.20 Computers 23.34 Computers 23.35
HCL Technologies Ltd 5.49 HDFC Bank Ltd 5.87 Banks 14.85 Banks 10.85
Strides Shasun Ltd 5.25 Strides Shasun Ltd 5.07 Pharmaceuticals 9.18 Pharmaceuticals 8.58
Infosys Ltd 5.14 Power Grid Corporation of India Ltd
4.80 Automobiles 7.68 Automobiles 7.85
Power Grid Corporation of India Ltd
4.40 HCL Technologies Ltd 4.59 Personal Care 5.50 Finance 7.61
0
20
40
60
80
Mar-16 Apr-16 May-16 Jun-16
Large Cap Mid CapSmall Cap Micro Cap
24 Recommended Funds 2016 – Portfolio & Performance Update (Mar’16-June’16) – iFAST Research
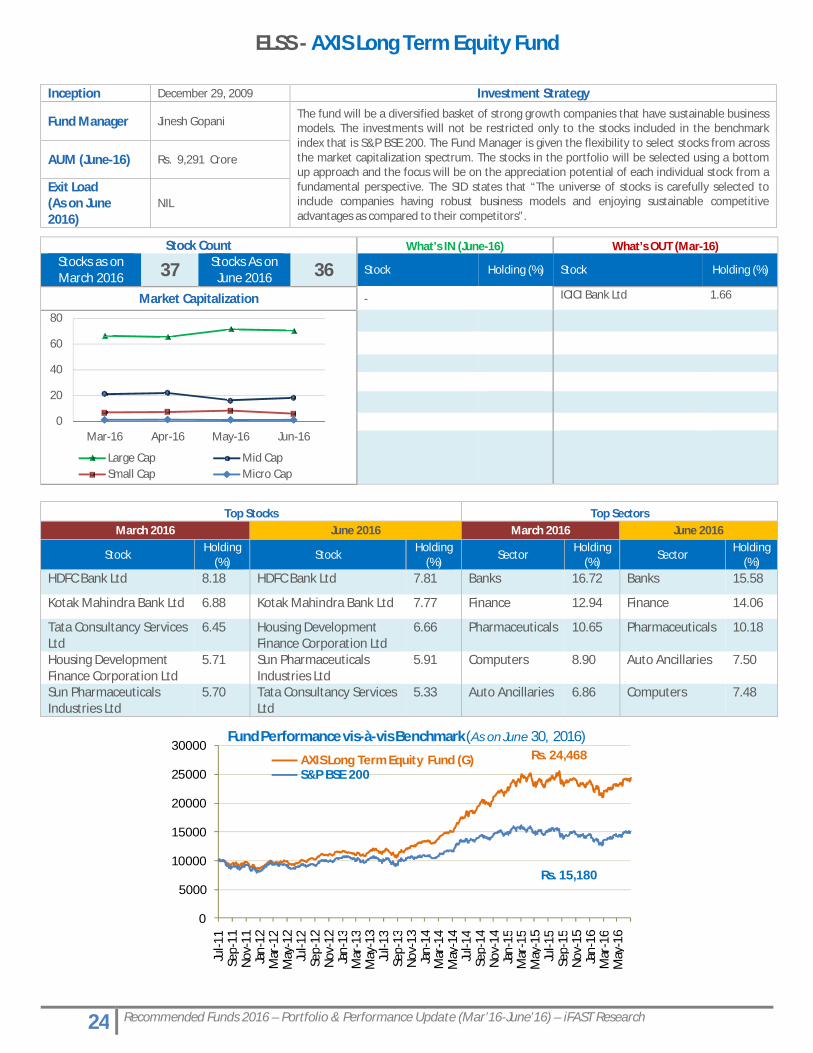
ELSS - AXIS Long Term Equity Fund
0
5000
10000
15000
20000
25000
30000
Jul-1
1Se
p-11
Nov-
11Ja
n-12
Mar
-12
May
-12
Jul-1
2Se
p-12
Nov-
12Ja
n-13
Mar
-13
May
-13
Jul-1
3Se
p-13
Nov-
13Ja
n-14
Mar
-14
May
-14
Jul-1
4Se
p-14
Nov-
14Ja
n-15
Mar
-15
May
-15
Jul-1
5Se
p-15
Nov-
15Ja
n-16
Mar
-16
May
-16
Fund Performance vis-à-vis Benchmark (As on June 30, 2016)
AXIS Long Term Equity Fund (G)S&P BSE 200
Rs. 15,180
Rs. 24,468
Inception December 29, 2009 Investment Strategy
Fund Manager Jinesh GopaniThe fund will be a diversified basket of strong growth companies that have sustainable business models. The investments will not be restricted only to the stocks included in the benchmark index that is S&P BSE 200. The Fund Manager is given the flexibility to select stocks from across the market capitalization spectrum. The stocks in the portfolio will be selected using a bottom up approach and the focus will be on the appreciation potential of each individual stock from a fundamental perspective. The SID states that “The universe of stocks is carefully selected to include companies having robust business models and enjoying sustainable competitive advantages as compared to their competitors”.
AUM (June-16) Rs. 9,291 Crore
Exit Load(As on June 2016)
NIL
Stock Count What’s IN (June-16) What’s OUT (Mar-16)Stocks as on March 2016 37 Stocks As on
June 2016 36 Stock Holding (%) Stock Holding (%)
Market Capitalization - ICICI Bank Ltd 1.66
Top Stocks Top SectorsMarch 2016 June 2016 March 2016 June 2016
StockHolding
(%)Stock
Holding (%)
SectorHolding
(%)Sector
Holding (%)
HDFC Bank Ltd 8.18 HDFC Bank Ltd 7.81 Banks 16.72 Banks 15.58
Kotak Mahindra Bank Ltd 6.88 Kotak Mahindra Bank Ltd 7.77 Finance 12.94 Finance 14.06
Tata Consultancy Services Ltd
6.45 Housing Development Finance Corporation Ltd
6.66 Pharmaceuticals 10.65 Pharmaceuticals 10.18
Housing Development Finance Corporation Ltd
5.71 Sun Pharmaceuticals Industries Ltd
5.91 Computers 8.90 Auto Ancillaries 7.50
Sun Pharmaceuticals Industries Ltd
5.70 Tata Consultancy Services Ltd
5.33 Auto Ancillaries 6.86 Computers 7.48
0
20
40
60
80
Mar-16 Apr-16 May-16 Jun-16
Large Cap Mid CapSmall Cap Micro Cap
25 Recommended Funds 2016 – Portfolio & Performance Update (Mar’16-June’16) – iFAST Research
ELSS - BNP Paribas Long Term Equity Fund
0
5000
10000
15000
20000
25000
Jul-1
1Se
p-11
Nov-
11Ja
n-12
Mar
-12
May
-12
Jul-1
2Se
p-12
Nov-
12Ja
n-13
Mar
-13
May
-13
Jul-1
3Se
p-13
Nov-
13Ja
n-14
Mar
-14
May
-14
Jul-1
4Se
p-14
Nov-
14Ja
n-15
Mar
-15
May
-15
Jul-1
5Se
p-15
Nov-
15Ja
n-16
Mar
-16
May
-16
Fund Performance vis-à-vis Benchmark (As on June 30, 2016)
BNP Paribas Long Term Equity Fund (G)Nifty 200 Index
Rs. 15,124
Rs. 21,122
Inception January 5, 2006 Investment StrategyFund Manager Shreyash Devalkar
The fund will have a diversified portfolio of stocks that aim at generating long-term capital growth. The fund will be actively managed across the different market cycles. The fund, in its endeavour to manage the liquidity requirements, will take a small exposure in debt and money market instruments.
AUM (June-16) Rs. 468 Crore
Exit Load(As on June 2016)
NIL
Stock Count What’s IN (June-16) What’s OUT (Mar-16)Stocks as on March 2016 43 Stocks As on
June 2016 46 Stock Holding (%) Stock Holding (%)
Market CapitalizationMahindra & Mahindra Financial Services Ltd
1.33 Tata Consultancy Services Ltd
1.3
Mahanagar Gas Ltd 1.30 HCL Technologies Ltd 1.15
Larsen & Toubro Ltd 1.02
J K Cements Ltd 1.00
Max Financial Services Ltd 0.50
Top Stocks Top SectorsMarch 2016 June 2016 March 2016 June 2016
StockHolding
(%) StockHolding
(%) SectorHolding
(%) SectorHolding
(%)HDFC Bank Ltd 8.43 Bharti Airtel Ltd 8.28 Banks 24.70 Banks 24.32
Bharti Airtel Ltd 6.18 HDFC Bank Ltd 7.80 Telecommunications 11.36 Telecommunications 13.21
IndusInd Bank Ltd 5.68 IndusInd Bank Ltd
5.70 Computers 7.74 Cement 7.29
Infosys Ltd 5.29 Idea Cellular Ltd 4.93 Cement 6.14 Finance 6.42
Idea Cellular Ltd 5.18 Kotak Mahindra Bank Ltd
4.26 Pharmaceuticals 5.34 Miscellaneous 6.39
0
20
40
60
80
Mar-16 Apr-16 May-16 Jun-16
Large Cap Mid CapSmall Cap Micro Cap
26 Recommended Funds 2016 – Portfolio & Performance Update (Mar’16-June’16) – iFAST Research
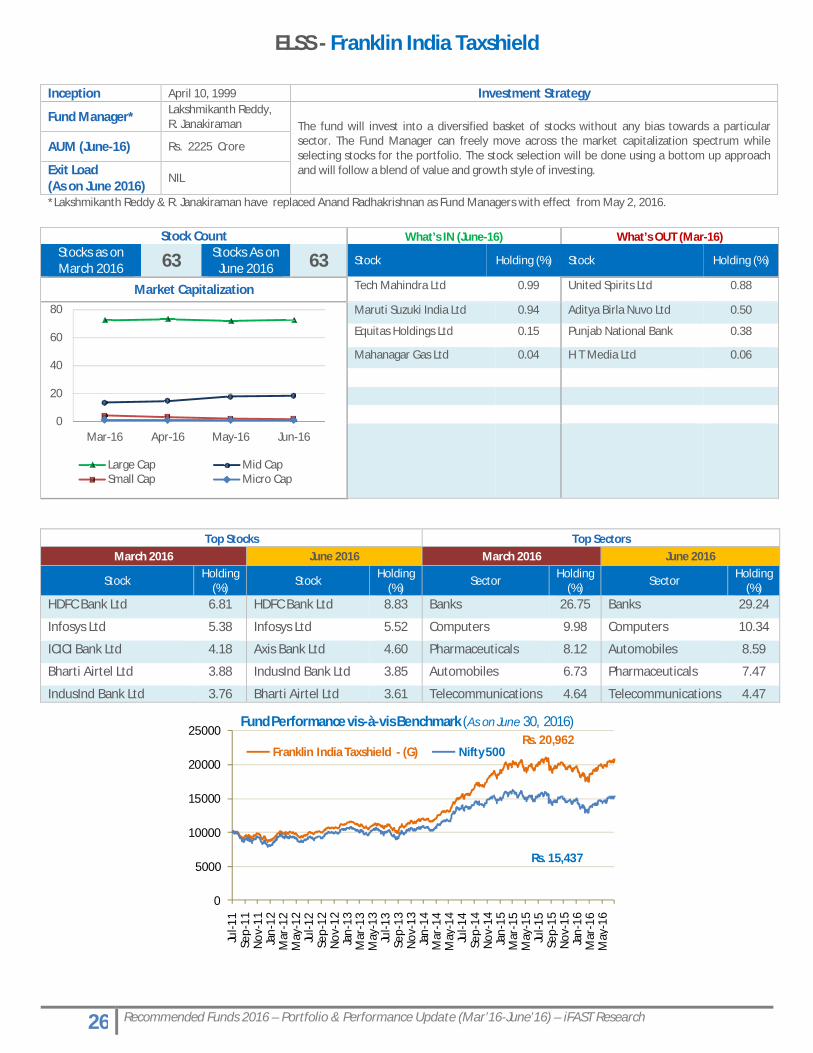
ELSS - Franklin India Taxshield
*Lakshmikanth Reddy & R. Janakiraman have replaced Anand Radhakrishnan as Fund Managers with effect from May 2, 2016.
0
5000
10000
15000
20000
25000
Jul-1
1Se
p-11
Nov
-11
Jan-
12M
ar-1
2M
ay-1
2Ju
l-12
Sep-
12N
ov-1
2Ja
n-13
Mar
-13
May
-13
Jul-1
3Se
p-13
Nov
-13
Jan-
14M
ar-1
4M
ay-1
4Ju
l-14
Sep-
14N
ov-1
4Ja
n-15
Mar
-15
May
-15
Jul-1
5Se
p-15
Nov
-15
Jan-
16M
ar-1
6M
ay-1
6
Fund Performance vis-à-vis Benchmark (As on June 30, 2016)
Franklin India Taxshield - (G) Nifty 500
Rs. 15,437
Rs. 20,962
Inception April 10, 1999 Investment Strategy
Fund Manager* Lakshmikanth Reddy, R. Janakiraman The fund will invest into a diversified basket of stocks without any bias towards a particular
sector. The Fund Manager can freely move across the market capitalization spectrum while selecting stocks for the portfolio. The stock selection will be done using a bottom up approach and will follow a blend of value and growth style of investing.
AUM (June-16) Rs. 2225 Crore
Exit Load(As on June 2016)
NIL
Stock Count What’s IN (June-16) What’s OUT (Mar-16)Stocks as on March 2016 63 Stocks As on
June 2016 63 Stock Holding (%) Stock Holding (%)
Market Capitalization Tech Mahindra Ltd 0.99 United Spirits Ltd 0.88
Maruti Suzuki India Ltd 0.94 Aditya Birla Nuvo Ltd 0.50
Equitas Holdings Ltd 0.15 Punjab National Bank 0.38
Mahanagar Gas Ltd 0.04 H T Media Ltd 0.06
Top Stocks Top SectorsMarch 2016 June 2016 March 2016 June 2016
StockHolding
(%) StockHolding
(%) SectorHolding
(%) SectorHolding
(%)HDFC Bank Ltd 6.81 HDFC Bank Ltd 8.83 Banks 26.75 Banks 29.24
Infosys Ltd 5.38 Infosys Ltd 5.52 Computers 9.98 Computers 10.34
ICICI Bank Ltd 4.18 Axis Bank Ltd 4.60 Pharmaceuticals 8.12 Automobiles 8.59
Bharti Airtel Ltd 3.88 IndusInd Bank Ltd 3.85 Automobiles 6.73 Pharmaceuticals 7.47
IndusInd Bank Ltd 3.76 Bharti Airtel Ltd 3.61 Telecommunications 4.64 Telecommunications 4.47
0
20
40
60
80
Mar-16 Apr-16 May-16 Jun-16
Large Cap Mid CapSmall Cap Micro Cap
27 Recommended Funds 2016 – Portfolio & Performance Update (Mar’16-June’16) – iFAST Research
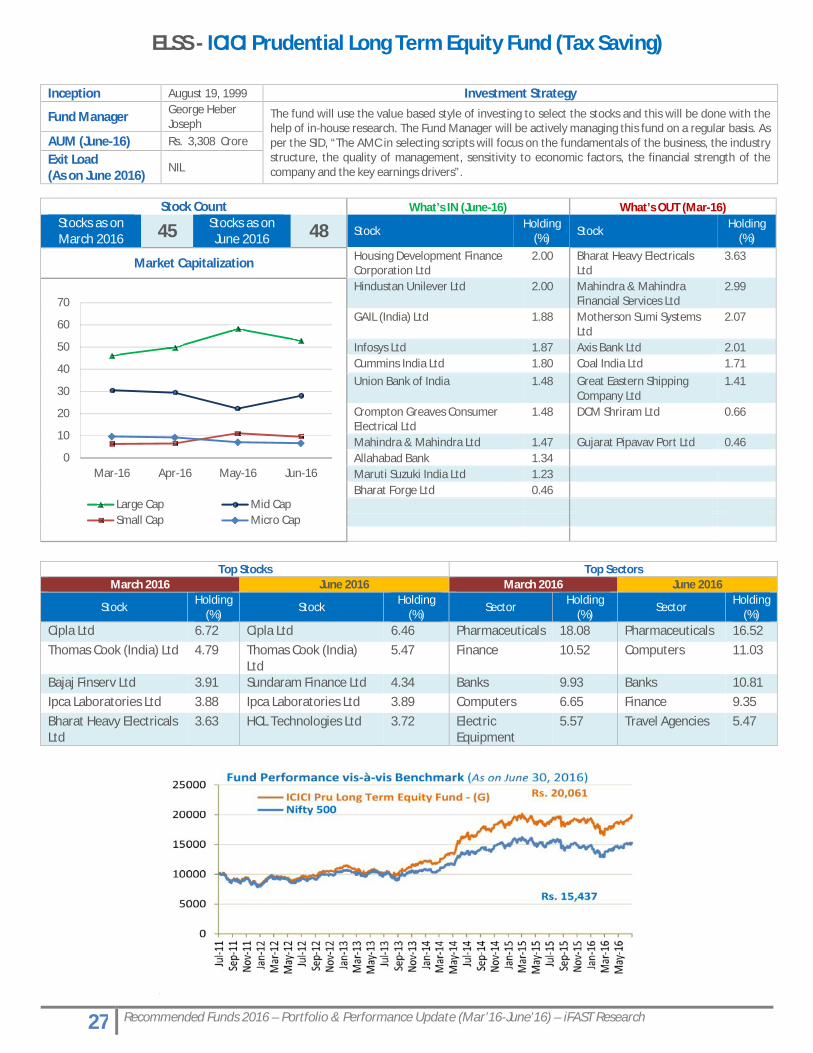
ELSS - ICICI Prudential Long Term Equity Fund (Tax Saving)
w
Inception August 19, 1999 Investment Strategy
Fund Manager George Heber Joseph
The fund will use the value based style of investing to select the stocks and this will be done with the help of in-house research. The Fund Manager will be actively managing this fund on a regular basis. As per the SID, “The AMC in selecting scripts will focus on the fundamentals of the business, the industry structure, the quality of management, sensitivity to economic factors, the financial strength of the company and the key earnings drivers”.
AUM (June-16) Rs. 3,308 Crore
Exit Load(As on June 2016)
NIL
Top Stocks Top SectorsMarch 2016 June 2016 March 2016 June 2016
StockHolding
(%)Stock
Holding (%)
SectorHolding
(%)Sector
Holding (%)
Cipla Ltd 6.72 Cipla Ltd 6.46 Pharmaceuticals 18.08 Pharmaceuticals 16.52Thomas Cook (India) Ltd 4.79 Thomas Cook (India)
Ltd5.47 Finance 10.52 Computers 11.03
Bajaj Finserv Ltd 3.91 Sundaram Finance Ltd 4.34 Banks 9.93 Banks 10.81Ipca Laboratories Ltd 3.88 Ipca Laboratories Ltd 3.89 Computers 6.65 Finance 9.35Bharat Heavy Electricals Ltd
3.63 HCL Technologies Ltd 3.72 Electric Equipment
5.57 Travel Agencies 5.47
Stock Count What’s IN (June-16) What’s OUT (Mar-16)Stocks as on March 2016 45 Stocks as on
June 2016 48 StockHolding
(%) StockHolding
(%)
Market Capitalization Housing Development Finance Corporation Ltd
2.00 Bharat Heavy Electricals Ltd
3.63
Hindustan Unilever Ltd 2.00 Mahindra & Mahindra Financial Services Ltd
2.99
GAIL (India) Ltd 1.88 Motherson Sumi Systems Ltd
2.07
Infosys Ltd 1.87 Axis Bank Ltd 2.01Cummins India Ltd 1.80 Coal India Ltd 1.71Union Bank of India 1.48 Great Eastern Shipping
Company Ltd1.41
Crompton Greaves Consumer Electrical Ltd
1.48 DCM Shriram Ltd 0.66
Mahindra & Mahindra Ltd 1.47 Gujarat Pipavav Port Ltd 0.46Allahabad Bank 1.34Maruti Suzuki India Ltd 1.23Bharat Forge Ltd 0.46
0
10
20
30
40
50
60
70
Mar-16 Apr-16 May-16 Jun-16
Large Cap Mid CapSmall Cap Micro Cap
28 Recommended Funds 2016 – Portfolio & Performance Update (Mar’16-June’16) – iFAST Research
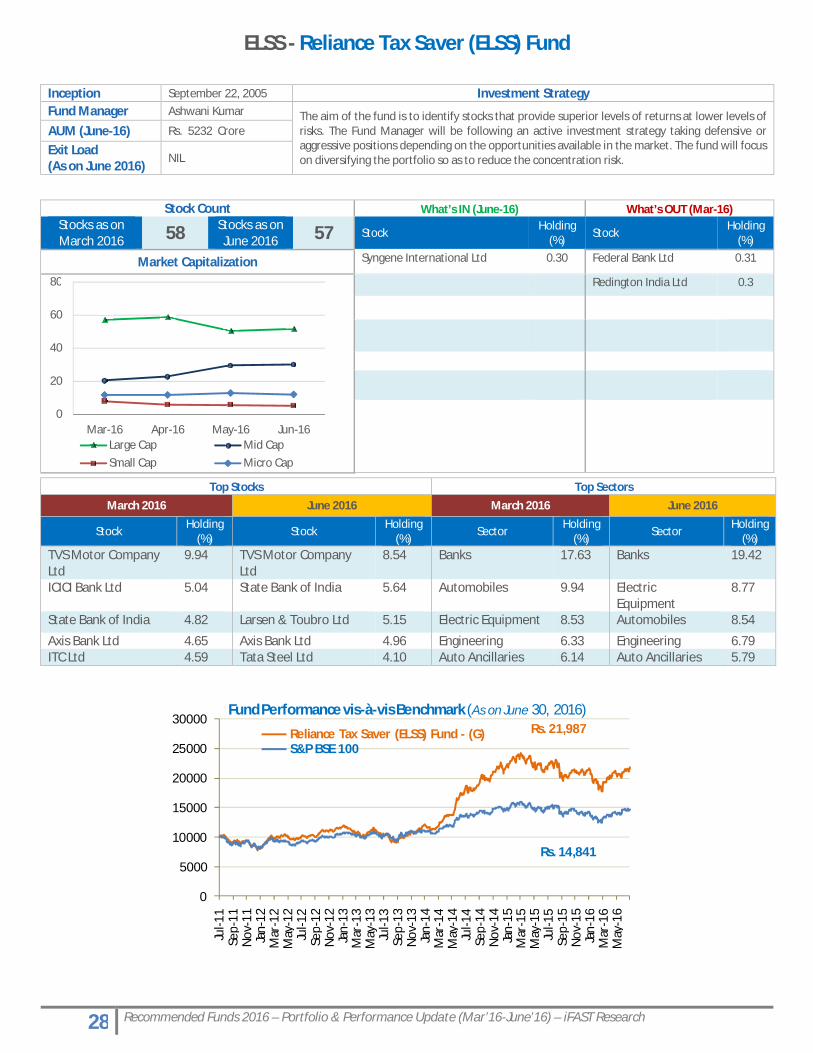
ELSS - Reliance Tax Saver (ELSS) Fund
0
5000
10000
15000
20000
25000
30000
Jul-1
1Se
p-11
Nov
-11
Jan-
12M
ar-1
2M
ay-1
2Ju
l-12
Sep-
12N
ov-1
2Ja
n-13
Mar
-13
May
-13
Jul-1
3Se
p-13
Nov
-13
Jan-
14M
ar-1
4M
ay-1
4Ju
l-14
Sep-
14N
ov-1
4Ja
n-15
Mar
-15
May
-15
Jul-1
5Se
p-15
Nov
-15
Jan-
16M
ar-1
6M
ay-1
6
Fund Performance vis-à-vis Benchmark (As on June 30, 2016)
Reliance Tax Saver (ELSS) Fund - (G)S&P BSE 100
Rs. 14,841
Rs. 21,987
Inception September 22, 2005 Investment StrategyFund Manager Ashwani Kumar The aim of the fund is to identify stocks that provide superior levels of returns at lower levels of
risks. The Fund Manager will be following an active investment strategy taking defensive or aggressive positions depending on the opportunities available in the market. The fund will focus on diversifying the portfolio so as to reduce the concentration risk.
AUM (June-16) Rs. 5232 Crore
Exit Load(As on June 2016)
NIL
Stock Count What’s IN (June-16) What’s OUT (Mar-16)Stocks as on March 2016 58 Stocks as on
June 2016 57 StockHolding
(%)Stock
Holding (%)
Market Capitalization Syngene International Ltd 0.30 Federal Bank Ltd 0.31
Redington India Ltd 0.3
Top Stocks Top Sectors
March 2016 June 2016 March 2016 June 2016
StockHolding
(%)Stock
Holding (%)
SectorHolding
(%)Sector
Holding (%)
TVS Motor Company Ltd
9.94 TVS Motor Company Ltd
8.54 Banks 17.63 Banks 19.42
ICICI Bank Ltd 5.04 State Bank of India 5.64 Automobiles 9.94 Electric Equipment
8.77
State Bank of India 4.82 Larsen & Toubro Ltd 5.15 Electric Equipment 8.53 Automobiles 8.54
Axis Bank Ltd 4.65 Axis Bank Ltd 4.96 Engineering 6.33 Engineering 6.79ITC Ltd 4.59 Tata Steel Ltd 4.10 Auto Ancillaries 6.14 Auto Ancillaries 5.79
0
20
40
60
80
Mar-16 Apr-16 May-16 Jun-16Large Cap Mid CapSmall Cap Micro Cap
29 Recommended Funds 2016 – Portfolio & Performance Update (Mar’16-June’16) – iFAST Research
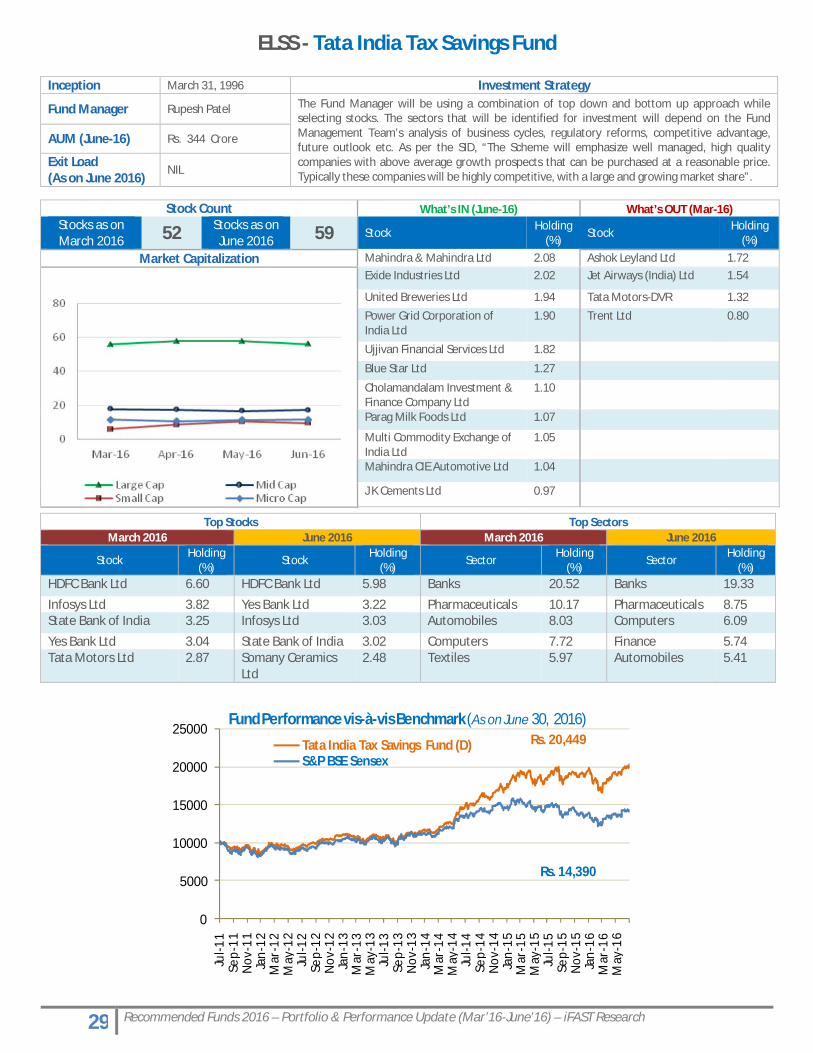
ELSS - Tata India Tax Savings Fund
0
5000
10000
15000
20000
25000
Jul-1
1Se
p-11
Nov
-11
Jan-
12M
ar-1
2M
ay-1
2Ju
l-12
Sep-
12N
ov-1
2Ja
n-13
Mar
-13
May
-13
Jul-1
3Se
p-13
Nov
-13
Jan-
14M
ar-1
4M
ay-1
4Ju
l-14
Sep-
14N
ov-1
4Ja
n-15
Mar
-15
May
-15
Jul-1
5Se
p-15
Nov
-15
Jan-
16M
ar-1
6M
ay-1
6
Fund Performance vis-à-vis Benchmark (As on June 30, 2016)
Tata India Tax Savings Fund (D)S&P BSE Sensex
Rs. 14,390
Rs. 20,449
Stock Count What’s IN (June-16) What’s OUT (Mar-16)Stocks as on March 2016 52 Stocks as on
June 2016 59 StockHolding
(%)Stock
Holding (%)
Market Capitalization Mahindra & Mahindra Ltd 2.08 Ashok Leyland Ltd 1.72Exide Industries Ltd 2.02 Jet Airways (India) Ltd 1.54
United Breweries Ltd 1.94 Tata Motors-DVR 1.32
Power Grid Corporation of India Ltd
1.90 Trent Ltd 0.80
Ujjivan Financial Services Ltd 1.82
Blue Star Ltd 1.27
Cholamandalam Investment & Finance Company Ltd
1.10
Parag Milk Foods Ltd 1.07
Multi Commodity Exchange of India Ltd
1.05
Mahindra CIE Automotive Ltd 1.04
J K Cements Ltd 0.97
Inception March 31, 1996 Investment Strategy
Fund Manager Rupesh Patel The Fund Manager will be using a combination of top down and bottom up approach while selecting stocks. The sectors that will be identified for investment will depend on the Fund Management Team’s analysis of business cycles, regulatory reforms, competitive advantage, future outlook etc. As per the SID, “The Scheme will emphasize well managed, high quality companies with above average growth prospects that can be purchased at a reasonable price. Typically these companies will be highly competitive, with a large and growing market share”.
AUM (June-16) Rs. 344 Crore
Exit Load(As on June 2016)
NIL
Top Stocks Top SectorsMarch 2016 June 2016 March 2016 June 2016
StockHolding
(%)Stock
Holding (%)
SectorHolding
(%)Sector
Holding (%)
HDFC Bank Ltd 6.60 HDFC Bank Ltd 5.98 Banks 20.52 Banks 19.33
Infosys Ltd 3.82 Yes Bank Ltd 3.22 Pharmaceuticals 10.17 Pharmaceuticals 8.75State Bank of India 3.25 Infosys Ltd 3.03 Automobiles 8.03 Computers 6.09
Yes Bank Ltd 3.04 State Bank of India 3.02 Computers 7.72 Finance 5.74Tata Motors Ltd 2.87 Somany Ceramics
Ltd2.48 Textiles 5.97 Automobiles 5.41
30 Recommended Funds 2016 – Portfolio & Performance Update (Mar’16-June’16) – iFAST Research
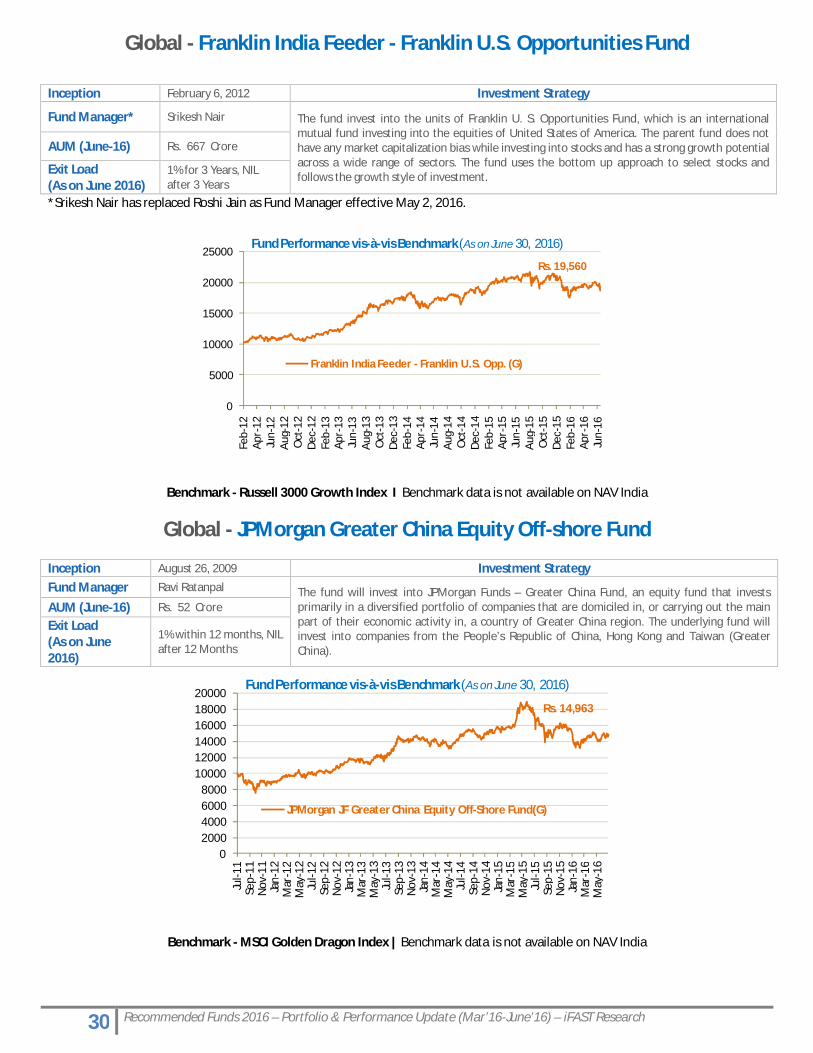
Global - Franklin India Feeder - Franklin U.S. Opportunities Fund
*Srikesh Nair has replaced Roshi Jain as Fund Manager effective May 2, 2016.
Benchmark - Russell 3000 Growth Index I Benchmark data is not available on NAV India
Global - JPMorgan Greater China Equity Off-shore Fund
Benchmark - MSCI Golden Dragon Index | Benchmark data is not available on NAV India
0
5000
10000
15000
20000
25000Fe
b-12
Apr-
12Ju
n-12
Aug
-12
Oct
-12
Dec
-12
Feb-
13Ap
r-13
Jun-
13A
ug-1
3O
ct-1
3D
ec-1
3Fe
b-14
Apr-
14Ju
n-14
Aug
-14
Oct
-14
Dec
-14
Feb-
15Ap
r-15
Jun-
15A
ug-1
5O
ct-1
5D
ec-1
5Fe
b-16
Apr-
16Ju
n-16
Fund Performance vis-à-vis Benchmark (As on June 30, 2016)
Franklin India Feeder - Franklin U.S. Opp. (G)
Rs. 19,560
02000400060008000
100001200014000160001800020000
Jul-1
1Se
p-11
Nov
-11
Jan-
12M
ar-1
2M
ay-1
2Ju
l-12
Sep-
12N
ov-1
2Ja
n-13
Mar
-13
May
-13
Jul-1
3Se
p-13
Nov
-13
Jan-
14M
ar-1
4M
ay-1
4Ju
l-14
Sep-
14N
ov-1
4Ja
n-15
Mar
-15
May
-15
Jul-1
5Se
p-15
Nov
-15
Jan-
16M
ar-1
6M
ay-1
6
Fund Performance vis-à-vis Benchmark (As on June 30, 2016)
JPMorgan JF Greater China Equity Off-Shore Fund(G)
Rs. 14,963
Inception February 6, 2012 Investment Strategy
Fund Manager* Srikesh Nair The fund invest into the units of Franklin U. S. Opportunities Fund, which is an international mutual fund investing into the equities of United States of America. The parent fund does not have any market capitalization bias while investing into stocks and has a strong growth potential across a wide range of sectors. The fund uses the bottom up approach to select stocks and follows the growth style of investment.
AUM (June-16) Rs. 667 Crore
Exit Load(As on June 2016)
1% for 3 Years, NILafter 3 Years
Inception August 26, 2009 Investment StrategyFund Manager Ravi Ratanpal The fund will invest into JPMorgan Funds – Greater China Fund, an equity fund that invests
primarily in a diversified portfolio of companies that are domiciled in, or carrying out the main part of their economic activity in, a country of Greater China region. The underlying fund will invest into companies from the People’s Republic of China, Hong Kong and Taiwan (Greater China).
AUM (June-16) Rs. 52 Crore
Exit Load(As on June 2016)
1% within 12 months, NIL after 12 Months
31 Recommended Funds 2016 – Portfolio & Performance Update (Mar’16-June’16) – iFAST Research
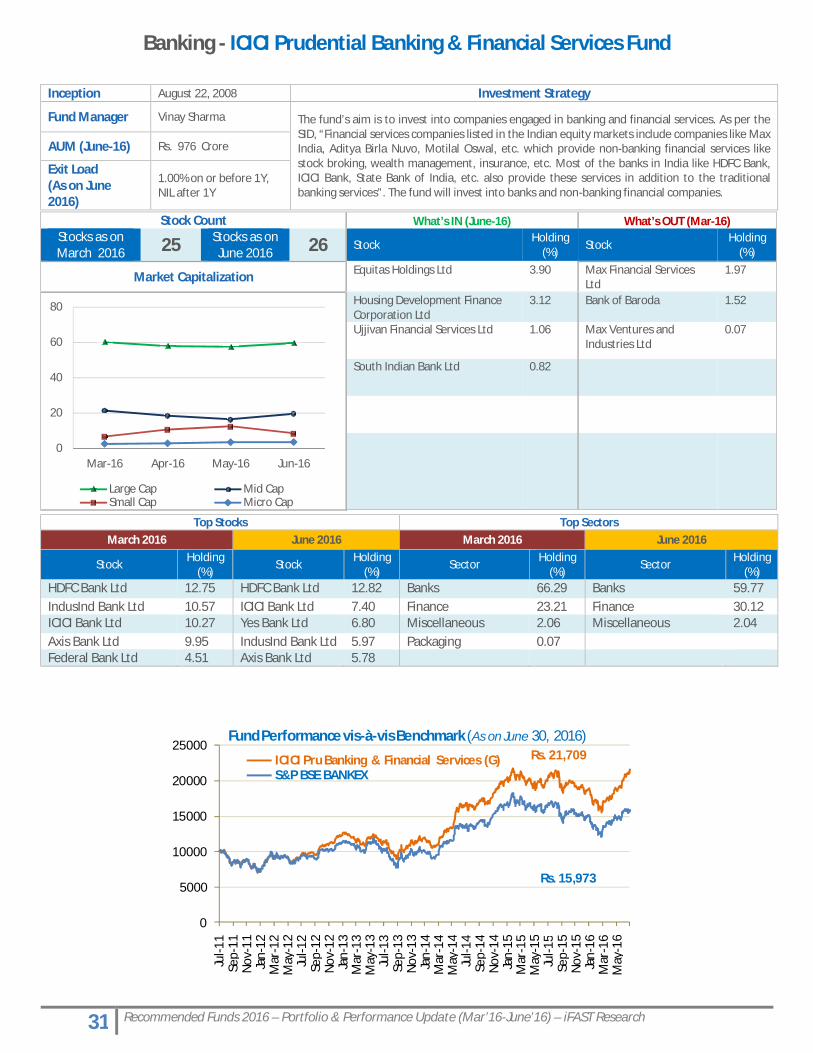
Banking - ICICI Prudential Banking & Financial Services Fund
0
5000
10000
15000
20000
25000
Jul-1
1Se
p-11
Nov
-11
Jan-
12M
ar-1
2M
ay-1
2Ju
l-12
Sep-
12N
ov-1
2Ja
n-13
Mar
-13
May
-13
Jul-1
3Se
p-13
Nov
-13
Jan-
14M
ar-1
4M
ay-1
4Ju
l-14
Sep-
14N
ov-1
4Ja
n-15
Mar
-15
May
-15
Jul-1
5Se
p-15
Nov
-15
Jan-
16M
ar-1
6M
ay-1
6
Fund Performance vis-à-vis Benchmark (As on June 30, 2016)
ICICI Pru Banking & Financial Services (G)S&P BSE BANKEX
Rs. 15,973
Rs. 21,709
Inception August 22, 2008 Investment Strategy
Fund Manager Vinay Sharma The fund’s aim is to invest into companies engaged in banking and financial services. As per the SID, “Financial services companies listed in the Indian equity markets include companies like Max India, Aditya Birla Nuvo, Motilal Oswal, etc. which provide non-banking financial services like stock broking, wealth management, insurance, etc. Most of the banks in India like HDFC Bank, ICICI Bank, State Bank of India, etc. also provide these services in addition to the traditional banking services”. The fund will invest into banks and non-banking financial companies.
AUM (June-16) Rs. 976 Crore
Exit Load(As on June 2016)
1.00% on or before 1Y,NIL after 1Y
Stock Count What’s IN (June-16) What’s OUT (Mar-16)Stocks as on March 2016 25 Stocks as on
June 2016 26 StockHolding
(%)Stock
Holding (%)
Market Capitalization Equitas Holdings Ltd 3.90 Max Financial Services Ltd
1.97
Housing Development Finance Corporation Ltd
3.12 Bank of Baroda 1.52
Ujjivan Financial Services Ltd 1.06 Max Ventures and Industries Ltd
0.07
South Indian Bank Ltd 0.82
Top Stocks Top SectorsMarch 2016 June 2016 March 2016 June 2016
StockHolding
(%)Stock
Holding (%)
SectorHolding
(%)Sector
Holding (%)
HDFC Bank Ltd 12.75 HDFC Bank Ltd 12.82 Banks 66.29 Banks 59.77IndusInd Bank Ltd 10.57 ICICI Bank Ltd 7.40 Finance 23.21 Finance 30.12ICICI Bank Ltd 10.27 Yes Bank Ltd 6.80 Miscellaneous 2.06 Miscellaneous 2.04Axis Bank Ltd 9.95 IndusInd Bank Ltd 5.97 Packaging 0.07Federal Bank Ltd 4.51 Axis Bank Ltd 5.78
0
20
40
60
80
Mar-16 Apr-16 May-16 Jun-16
Large Cap Mid CapSmall Cap Micro Cap
32 Recommended Funds 2016 – Portfolio & Performance Update (Mar’16-June’16) – iFAST Research
Pharmaceuticals - SBI Pharma Fund
0
5000
10000
15000
20000
25000
30000
35000
40000
Jul-1
1Se
p-11
Nov
-11
Jan-
12M
ar-1
2M
ay-1
2Ju
l-12
Sep-
12N
ov-1
2Ja
n-13
Mar
-13
May
-13
Jul-1
3Se
p-13
Nov
-13
Jan-
14M
ar-1
4M
ay-1
4Ju
l-14
Sep-
14N
ov-1
4Ja
n-15
Mar
-15
May
-15
Jul-1
5Se
p-15
Nov
-15
Jan-
16M
ar-1
6M
ay-1
6
Fund Performance vis-à-vis Benchmark (As on June 30, 2016)
SBI Pharma Fund (G) S&P BSE Healthcare
Rs. 24,135
Rs. 29,020
Inception July 14, 1999 Investment StrategyFund Manager Tanmaya Desai
The funds mandate is to invest into pharmaceutical companies.AUM (June-16) Rs. 1,011 Crore
Exit Load(As on June 2016)
NIL
Stock Count What’s IN (June-16) What’s OUT (Mar-16)Stocks as on March 2016 16 Stocks as on
June 2016 18 Stock Holding (%) Stock Holding (%)
Market Capitalization Thyrocare Technologies Ltd 3.39Alembic Pharmaceuticals Ltd 0.85
Top Stocks Top SectorsMarch 2016 June 2016 March 2016 June 2016
StockHolding
(%)Stock
Holding (%)
SectorHolding
(%)Sector
Holding (%)
Sun Pharmaceuticals Industries Ltd
22.48 Sun Pharmaceuticals Industries Ltd
19.65 Pharmaceuticals 89.07 Pharmaceuticals 87.62
Aurobindo Pharma Ltd 10.21 Lupin Ltd 10.69 Healthcare 7.89 Healthcare 10.68Lupin Ltd 9.82 Aurobindo Pharma Ltd 9.55Strides Shasun Ltd 9.14 Strides Shasun Ltd 8.94Divis Laboratories Ltd 8.33 Divis Laboratories Ltd 8.79
0
10
20
30
40
50
60
70
Large Cap Mid CapSmall Cap Micro Cap
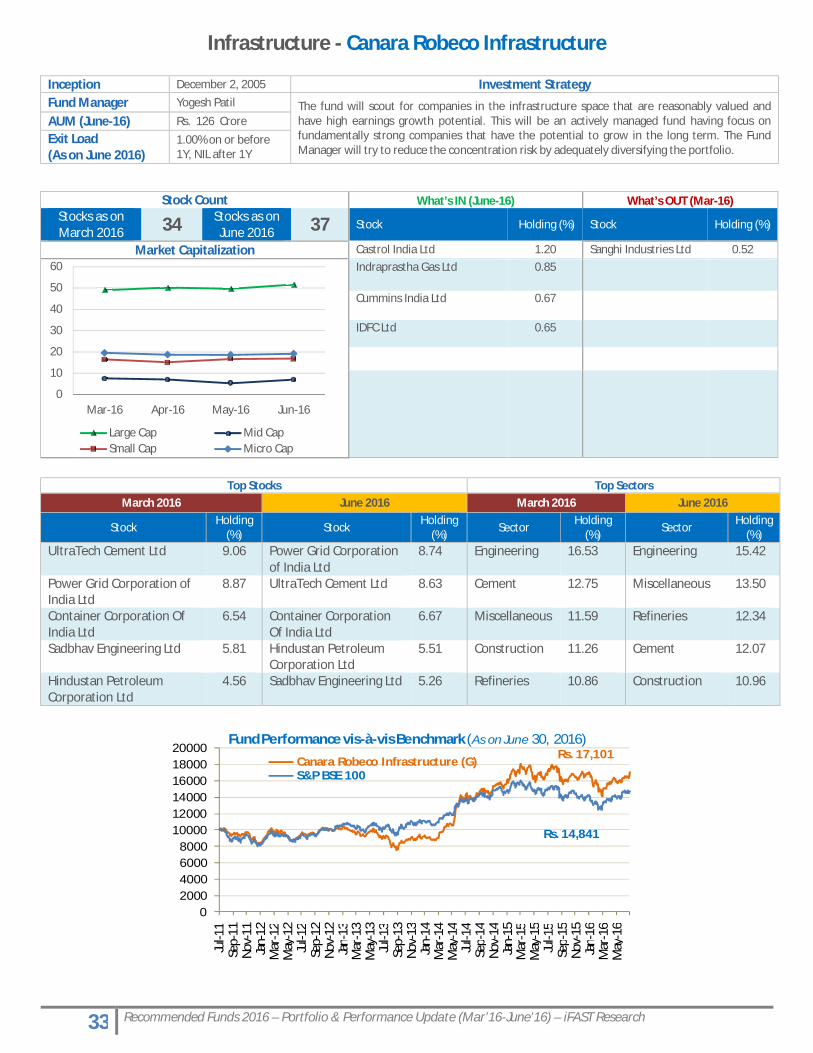
33 Recommended Funds 2016 – Portfolio & Performance Update (Mar’16-June’16) – iFAST Research
Infrastructure - Canara Robeco Infrastructure
02000400060008000
100001200014000160001800020000
Jul-1
1Se
p-11
Nov-
11Ja
n-12
Mar
-12
May
-12
Jul-1
2Se
p-12
Nov-
12Ja
n-13
Mar
-13
May
-13
Jul-1
3Se
p-13
Nov-
13Ja
n-14
Mar
-14
May
-14
Jul-1
4Se
p-14
Nov-
14Ja
n-15
Mar
-15
May
-15
Jul-1
5Se
p-15
Nov-
15Ja
n-16
Mar
-16
May
-16
Fund Performance vis-à-vis Benchmark (As on June 30, 2016)
Canara Robeco Infrastructure (G)S&P BSE 100
Rs. 14,841
Rs. 17,101
Inception December 2, 2005 Investment StrategyFund Manager Yogesh Patil The fund will scout for companies in the infrastructure space that are reasonably valued and
have high earnings growth potential. This will be an actively managed fund having focus on fundamentally strong companies that have the potential to grow in the long term. The Fund Manager will try to reduce the concentration risk by adequately diversifying the portfolio.
AUM (June-16) Rs. 126 CroreExit Load(As on June 2016)
1.00% on or before 1Y, NIL after 1Y
Stock Count What’s IN (June-16) What’s OUT (Mar-16)Stocks as on March 2016 34 Stocks as on
June 2016 37 Stock Holding (%) Stock Holding (%)
Market Capitalization Castrol India Ltd 1.20 Sanghi Industries Ltd 0.52Indraprastha Gas Ltd 0.85
Cummins India Ltd 0.67
IDFC Ltd 0.65
Top Stocks Top SectorsMarch 2016 June 2016 March 2016 June 2016
StockHolding
(%) StockHolding
(%) SectorHolding
(%) SectorHolding
(%)UltraTech Cement Ltd 9.06 Power Grid Corporation
of India Ltd8.74 Engineering 16.53 Engineering 15.42
Power Grid Corporation of India Ltd
8.87 UltraTech Cement Ltd 8.63 Cement 12.75 Miscellaneous 13.50
Container Corporation Of India Ltd
6.54 Container Corporation Of India Ltd
6.67 Miscellaneous 11.59 Refineries 12.34
Sadbhav Engineering Ltd 5.81 Hindustan Petroleum Corporation Ltd
5.51 Construction 11.26 Cement 12.07
Hindustan Petroleum Corporation Ltd
4.56 Sadbhav Engineering Ltd 5.26 Refineries 10.86 Construction 10.96
0
10
20
30
40
50
60
Mar-16 Apr-16 May-16 Jun-16
Large Cap Mid CapSmall Cap Micro Cap
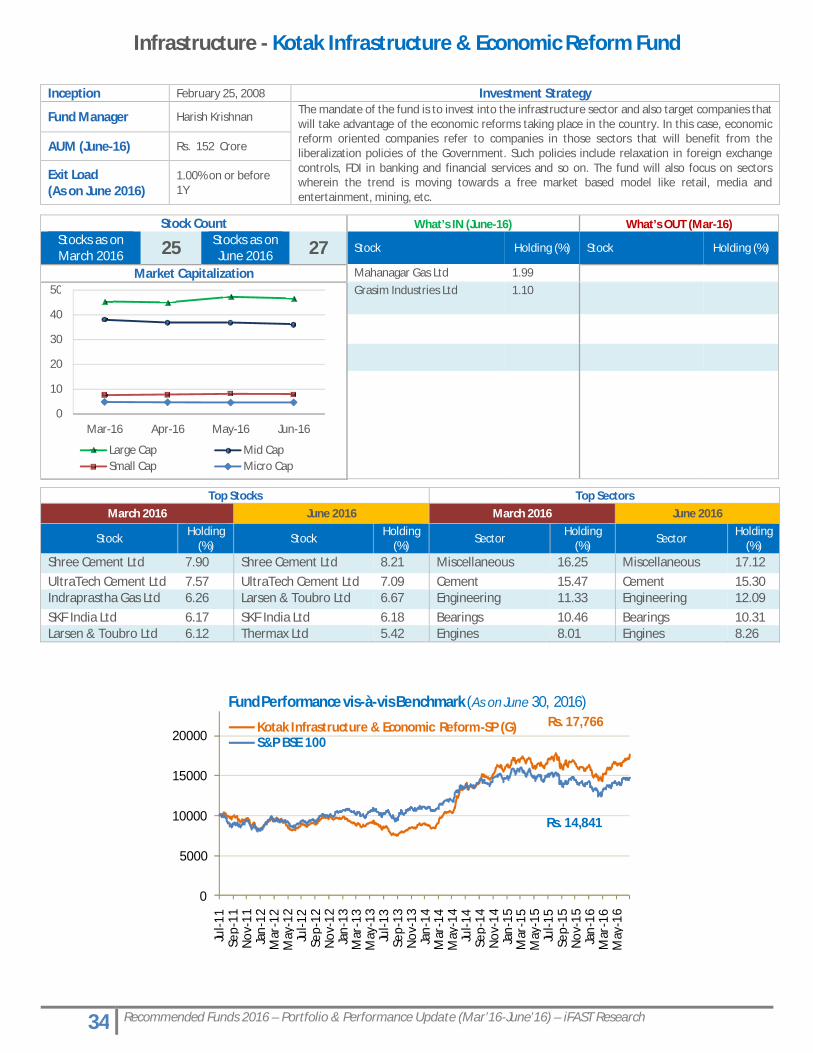
34 Recommended Funds 2016 – Portfolio & Performance Update (Mar’16-June’16) – iFAST Research
Infrastructure - Kotak Infrastructure & Economic Reform Fund
0
5000
10000
15000
20000
Jul-1
1Se
p-11
Nov
-11
Jan-
12M
ar-1
2M
ay-1
2Ju
l-12
Sep-
12N
ov-1
2Ja
n-13
Mar
-13
May
-13
Jul-1
3Se
p-13
Nov
-13
Jan-
14M
ar-1
4M
ay-1
4Ju
l-14
Sep-
14N
ov-1
4Ja
n-15
Mar
-15
May
-15
Jul-1
5Se
p-15
Nov
-15
Jan-
16M
ar-1
6M
ay-1
6
Fund Performance vis-à-vis Benchmark (As on June 30, 2016)
Kotak Infrastructure & Economic Reform-SP (G)S&P BSE 100
Rs. 14,841
Rs. 17,766
Inception February 25, 2008 Investment Strategy
Fund Manager Harish KrishnanThe mandate of the fund is to invest into the infrastructure sector and also target companies that will take advantage of the economic reforms taking place in the country. In this case, economic reform oriented companies refer to companies in those sectors that will benefit from the liberalization policies of the Government. Such policies include relaxation in foreign exchange controls, FDI in banking and financial services and so on. The fund will also focus on sectors wherein the trend is moving towards a free market based model like retail, media and entertainment, mining, etc.
AUM (June-16) Rs. 152 Crore
Exit Load(As on June 2016)
1.00% on or before 1Y
Stock Count What’s IN (June-16) What’s OUT (Mar-16)Stocks as on March 2016 25 Stocks as on
June 2016 27 Stock Holding (%) Stock Holding (%)
Market Capitalization Mahanagar Gas Ltd 1.99Grasim Industries Ltd 1.10
Top Stocks Top SectorsMarch 2016 June 2016 March 2016 June 2016
StockHolding
(%) StockHolding
(%) SectorHolding
(%) SectorHolding
(%)Shree Cement Ltd 7.90 Shree Cement Ltd 8.21 Miscellaneous 16.25 Miscellaneous 17.12UltraTech Cement Ltd 7.57 UltraTech Cement Ltd 7.09 Cement 15.47 Cement 15.30Indraprastha Gas Ltd 6.26 Larsen & Toubro Ltd 6.67 Engineering 11.33 Engineering 12.09SKF India Ltd 6.17 SKF India Ltd 6.18 Bearings 10.46 Bearings 10.31Larsen & Toubro Ltd 6.12 Thermax Ltd 5.42 Engines 8.01 Engines 8.26
0
10
20
30
40
50
Mar-16 Apr-16 May-16 Jun-16
Large Cap Mid CapSmall Cap Micro Cap

35 Recommended Funds 2016 – Portfolio & Performance Update (Mar’16-June’16) – iFAST Research
FMCG - SBI FMCG Fund
0
5000
10000
15000
20000
25000
30000
Jul-1
1Se
p-11
Nov
-11
Jan-
12M
ar-1
2M
ay-1
2Ju
l-12
Sep-
12N
ov-1
2Ja
n-13
Mar
-13
May
-13
Jul-1
3Se
p-13
Nov
-13
Jan-
14M
ar-1
4M
ay-1
4Ju
l-14
Sep-
14N
ov-1
4Ja
n-15
Mar
-15
May
-15
Jul-1
5Se
p-15
Nov
-15
Jan-
16M
ar-1
6M
ay-1
6
Fund Performance vis-à-vis Benchmark (As on June 30, 2016)
SBI FMCG Fund (D)S&P BSE Fast Moving Consumer Goods
Rs. 20,923
Rs. 24,775
Stock Count What’s IN (June-16) What’s OUT (Mar-16)Stocks as on March 2016 15 Stocks as on
June 2016 17 Stock Holding (%) Stock Holding (%)
Market Capitalization Greenply Industries Ltd 2.27 Kansai Nerolac Paints Ltd
5.35
Emami Ltd 2.16 Agro Tech Foods Ltd 1.98Lloyd Electric & Engineering Ltd
1.66
United Spirits Ltd 0.98
Inception July 14, 1999 Investment Strategy
Fund Manager Saurabh Pant
The fund will invest into FMCG companies.AUM (June-16) Rs. 255 Crore
Exit Load(As on June 2016)
NIL
Top Stocks Top SectorsMarch 2016 June 2016 March 2016 June 2016
StockHolding
(%) StockHolding
(%) SectorHolding
(%) SectorHolding
(%)ITC Ltd 40.19 ITC Ltd 37.80 Cigarettes 40.19 Cigarettes 37.80Titan Company Ltd 6.00 Jubilant Foodworks Ltd 6.79 Food 17.88 Food 20.51Procter & Gamble Hygiene and Health Care Ltd
5.77 Nestle India Ltd 5.98 Jewellery 7.28 Jewellery 7.40
Kansai Nerolac Paints Ltd 5.35 Titan Company Ltd 5.66 Breweries & Distilleries
6.28 Personal Care 6.83
United Breweries Ltd 5.24 Manpasand Beverages Ltd
5.03 Personal Care 5.77 Breweries & Distilleries
6.16
0
20
40
60
80
Mar-16 Apr-16 May-16 Jun-16
Large Cap Mid CapSmall Cap Micro Cap

36 Recommended Funds 2016 – Portfolio & Performance Update (Mar’16-June’16) – iFAST Research
Technology - ICICI Prudential Technology Fund
0
5000
10000
15000
20000
25000
30000
Jul-1
1Se
p-11
Nov
-11
Jan-
12M
ar-1
2M
ay-1
2Ju
l-12
Sep-
12N
ov-1
2Ja
n-13
Mar
-13
May
-13
Jul-1
3Se
p-13
Nov
-13
Jan-
14M
ar-1
4M
ay-1
4Ju
l-14
Sep-
14N
ov-1
4Ja
n-15
Mar
-15
May
-15
Jul-1
5Se
p-15
Nov
-15
Jan-
16M
ar-1
6M
ay-1
6
Fund Performance vis-à-vis Benchmark (As on June 30, 2016)
ICICI Pru Technology Fund (G)S&P BSE Information Technology
Rs. 18,217
Rs. 22,434
Inception March 3, 2000 Investment StrategyFund Manager Mrinal Singh The fund will invest into technology and technology dependent companies. A majority of the
corpus would be invested in companies constituting the benchmark index that is S&P BSE IT. The Fund Manager has the flexibility to invest into companies outside this index; however, they have to be a part of the Information Technology Services Industry.
AUM (June-16) Rs. 349 Crore
Exit Load(As on June 2016)
1.00% on or before 1Y,NIL after 1Y
Stock Count What’s IN (June-16) What’s OUT (Mar-16)Stocks as on March 2016 15 Stocks as on
June 2016 15 Stock Holding (%) Stock Holding (%)
Market Capitalization - - - -
Top Stocks Top SectorsMarch 2016 June 2016 March 2016 June 2016
Stock Holding (%)
Stock Holding (%)
Sector Holding (%)
Sector Holding (%)
Infosys Ltd 32.56 Infosys Ltd 29.31 Computers 94.25 Computers 94.32Tata Consultancy Services Ltd
17.50 Tata Consultancy Services Ltd
11.21
HCL Technologies Ltd 7.94 Wipro Ltd 8.67Wipro Ltd 7.31 HCL Technologies Ltd 8.55Persistent Systems Ltd 7.27 Persistent Systems Ltd 7.99
0
20
40
60
80
Mar-16 Apr-16 May-16 Jun-16
Large Cap Mid CapSmall Cap Micro Cap

37 Recommended Funds 2016 – Portfolio & Performance Update (Mar’16-June’16) – iFAST Research
Recommended Debt Funds
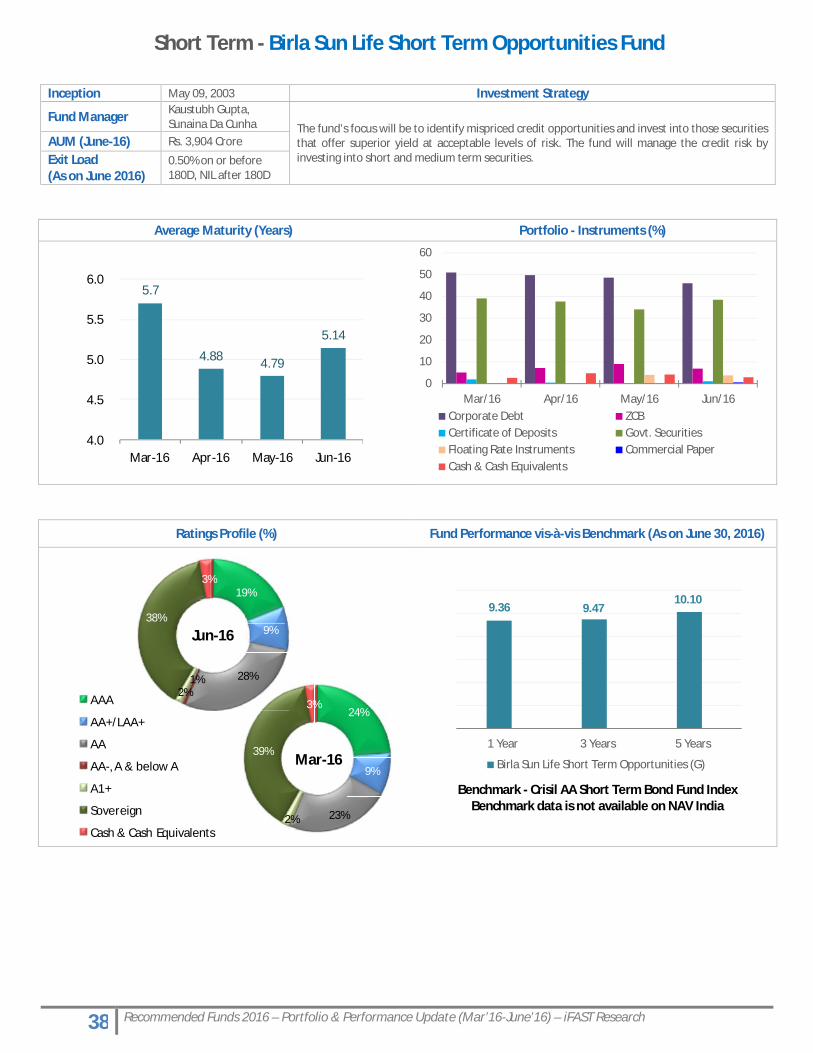
38 Recommended Funds 2016 – Portfolio & Performance Update (Mar’16-June’16) – iFAST Research
Short Term - Birla Sun Life Short Term Opportunities Fund
Average Maturity (Years) Portfolio - Instruments (%)
Ratings Profile (%) Fund Performance vis-à-vis Benchmark (As on June 30, 2016)
Benchmark - Crisil AA Short Term Bond Fund IndexBenchmark data is not available on NAV India
5.7
4.88 4.79
5.14
4.0
4.5
5.0
5.5
6.0
Mar-16 Apr-16 May-16 Jun-16
0
10
20
30
40
50
60
Mar/16 Apr/16 May/16 Jun/16Corporate Debt ZCBCertificate of Deposits Govt. SecuritiesFloating Rate Instruments Commercial PaperCash & Cash Equivalents
19%
9%
28%1%2%
38%
3%
Jun-16
24%
9%
23%2%
39%
3%
Mar-16
AAA
AA+/LAA+
AA
AA-, A & below A
A1+
Sovereign
Cash & Cash Equivalents
9.36 9.4710.10
1 Year 3 Years 5 Years
Birla Sun Life Short Term Opportunities (G)
Inception May 09, 2003 Investment Strategy
Fund Manager Kaustubh Gupta, Sunaina Da Cunha The fund’s focus will be to identify mispriced credit opportunities and invest into those securities
that offer superior yield at acceptable levels of risk. The fund will manage the credit risk by investing into short and medium term securities.
AUM (June-16) Rs. 3,904 Crore
Exit Load(As on June 2016)
0.50% on or before 180D, NIL after 180D
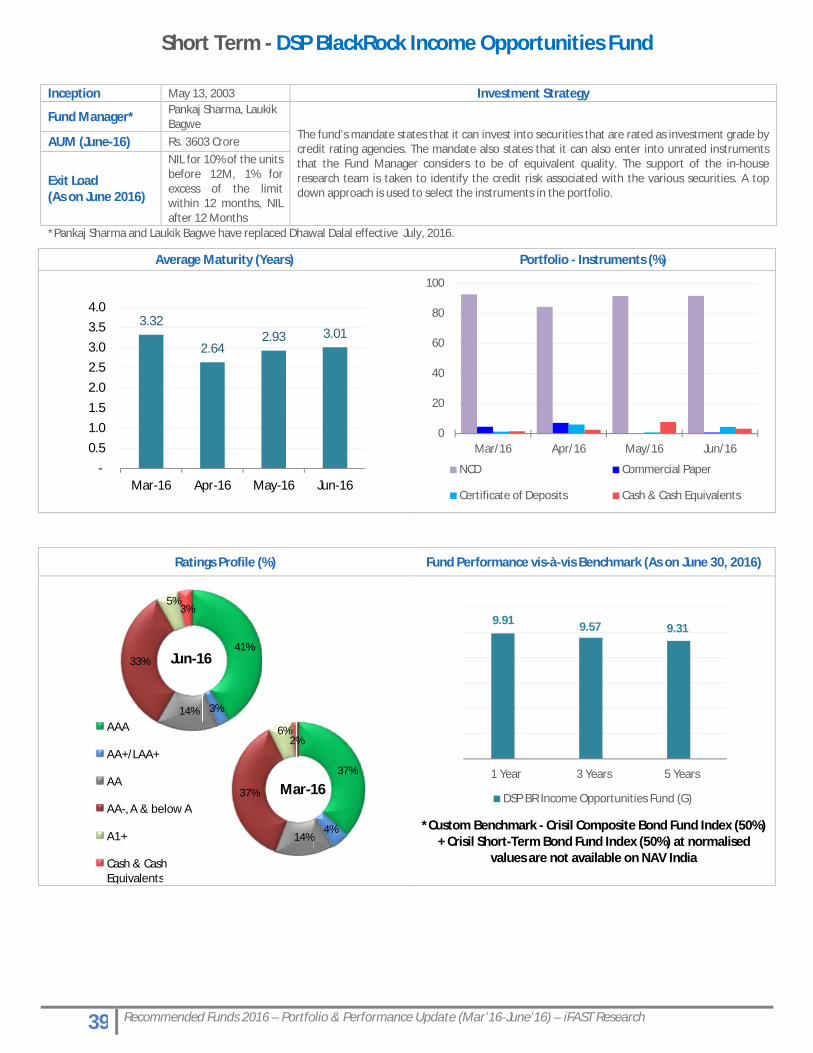
39 Recommended Funds 2016 – Portfolio & Performance Update (Mar’16-June’16) – iFAST Research
Short Term - DSP BlackRock Income Opportunities Fund
*Pankaj Sharma and Laukik Bagwe have replaced Dhawal Dalal effective July, 2016.
Average Maturity (Years) Portfolio - Instruments (%)
Ratings Profile (%) Fund Performance vis-à-vis Benchmark (As on June 30, 2016)
*Custom Benchmark - Crisil Composite Bond Fund Index (50%) + Crisil Short-Term Bond Fund Index (50%) at normalised
values are not available on NAV India
3.32
2.642.93 3.01
- 0.5 1.0 1.5
2.0 2.5 3.0 3.5 4.0
Mar-16 Apr-16 May-16 Jun-16
0
20
40
60
80
100
Mar/16 Apr/16 May/16 Jun/16
NCD Commercial Paper
Certificate of Deposits Cash & Cash Equivalents
41%
3%14%
33%
5%3%
Jun-16
37%
4%14%
37%
6%2%
Mar-16
AAA
AA+/LAA+
AA
AA-, A & below A
A1+
Cash & Cash Equivalents
9.91 9.57 9.31
1 Year 3 Years 5 Years
DSP BR Income Opportunities Fund (G)
Inception May 13, 2003 Investment Strategy
Fund Manager* Pankaj Sharma, Laukik Bagwe
The fund’s mandate states that it can invest into securities that are rated as investment grade by credit rating agencies. The mandate also states that it can also enter into unrated instruments that the Fund Manager considers to be of equivalent quality. The support of the in-house research team is taken to identify the credit risk associated with the various securities. A top down approach is used to select the instruments in the portfolio.
AUM (June-16) Rs. 3603 Crore
Exit Load(As on June 2016)
NIL for 10% of the unitsbefore 12M, 1% for excess of the limit within 12 months, NIL after 12 Months
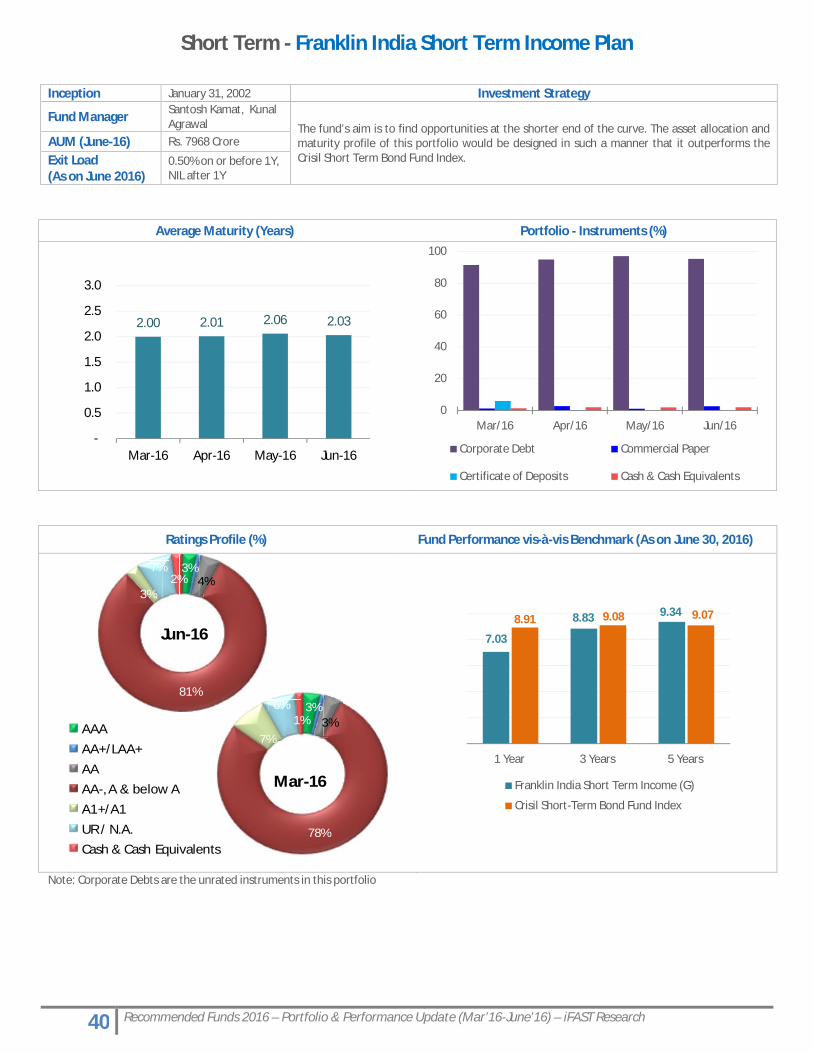
40 Recommended Funds 2016 – Portfolio & Performance Update (Mar’16-June’16) – iFAST Research
Short Term - Franklin India Short Term Income Plan
Average Maturity (Years) Portfolio - Instruments (%)
Ratings Profile (%) Fund Performance vis-à-vis Benchmark (As on June 30, 2016)
Note: Corporate Debts are the unrated instruments in this portfolio
2.00 2.01 2.06 2.03
-
0.5
1.0
1.5
2.0
2.5
3.0
Mar-16 Apr-16 May-16 Jun-16
0
20
40
60
80
100
Mar/16 Apr/16 May/16 Jun/16
Corporate Debt Commercial Paper
Certificate of Deposits Cash & Cash Equivalents
3%4%
81%
3%
7%2%
Jun-16
3%3%
78%
7%
6%1%
Mar-16
AAA
AA+/LAA+
AA
AA-, A & below A
A1+/A1
UR / N.A.
Cash & Cash Equivalents
7.03
8.83 9.348.91 9.08 9.07
1 Year 3 Years 5 Years
Franklin India Short Term Income (G)
Crisil Short-Term Bond Fund Index
Inception January 31, 2002 Investment Strategy
Fund Manager Santosh Kamat, Kunal Agrawal The fund’s aim is to find opportunities at the shorter end of the curve. The asset allocation and
maturity profile of this portfolio would be designed in such a manner that it outperforms the Crisil Short Term Bond Fund Index.
AUM (June-16) Rs. 7968 Crore
Exit Load(As on June 2016)
0.50% on or before 1Y,NIL after 1Y
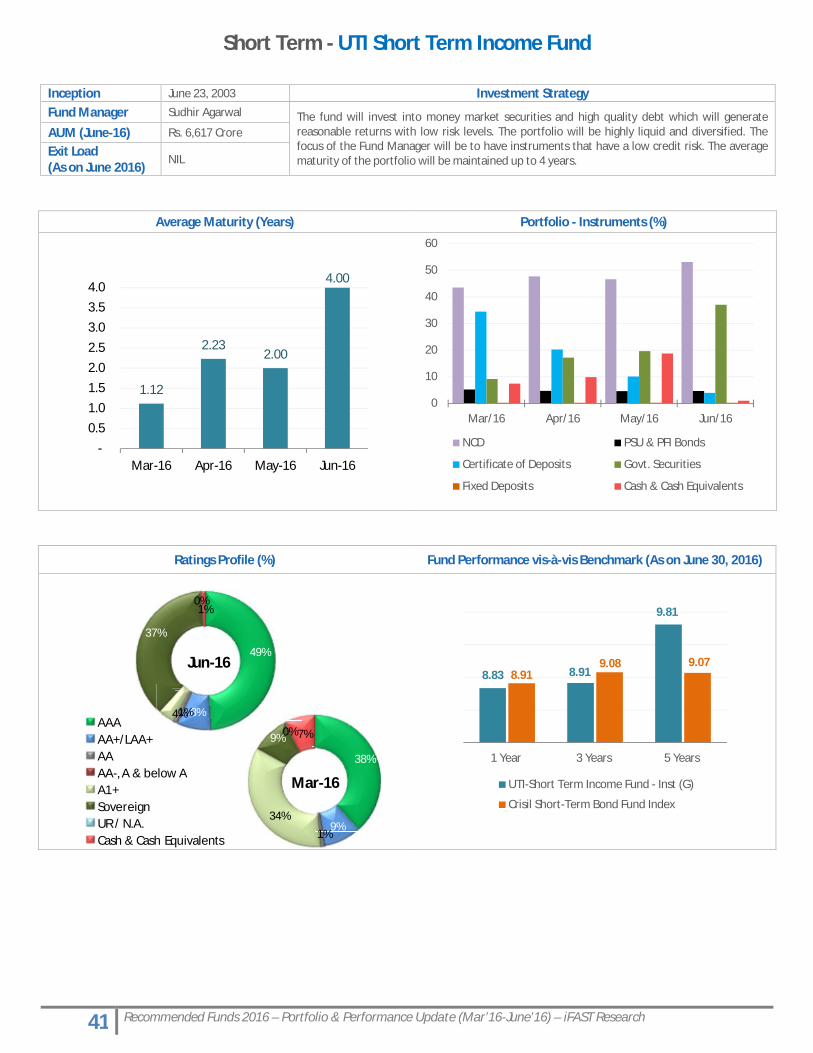
41 Recommended Funds 2016 – Portfolio & Performance Update (Mar’16-June’16) – iFAST Research
Short Term - UTI Short Term Income Fund
Average Maturity (Years) Portfolio - Instruments (%)
Ratings Profile (%) Fund Performance vis-à-vis Benchmark (As on June 30, 2016)
1.12
2.232.00
4.00
-
0.5 1.0 1.5 2.0 2.5
3.0 3.5 4.0
Mar-16 Apr-16 May-16 Jun-16
0
10
20
30
40
50
60
Mar/16 Apr/16 May/16 Jun/16
NCD PSU & PFI Bonds
Certificate of Deposits Govt. Securities
Fixed Deposits Cash & Cash Equivalents
49%
8%1%4%
37%
0%1%
Jun-16
38%
9%1%
34%
9%0%7%
Mar-16
AAAAA+/LAA+AAAA-, A & below AA1+SovereignUR / N.A.Cash & Cash Equivalents
8.83 8.91
9.81
8.919.08 9.07
1 Year 3 Years 5 Years
UTI-Short Term Income Fund - Inst (G)
Crisil Short-Term Bond Fund Index
Inception June 23, 2003 Investment StrategyFund Manager Sudhir Agarwal The fund will invest into money market securities and high quality debt which will generate
reasonable returns with low risk levels. The portfolio will be highly liquid and diversified. The focus of the Fund Manager will be to have instruments that have a low credit risk. The average maturity of the portfolio will be maintained up to 4 years.
AUM (June-16) Rs. 6,617 Crore
Exit Load(As on June 2016)
NIL
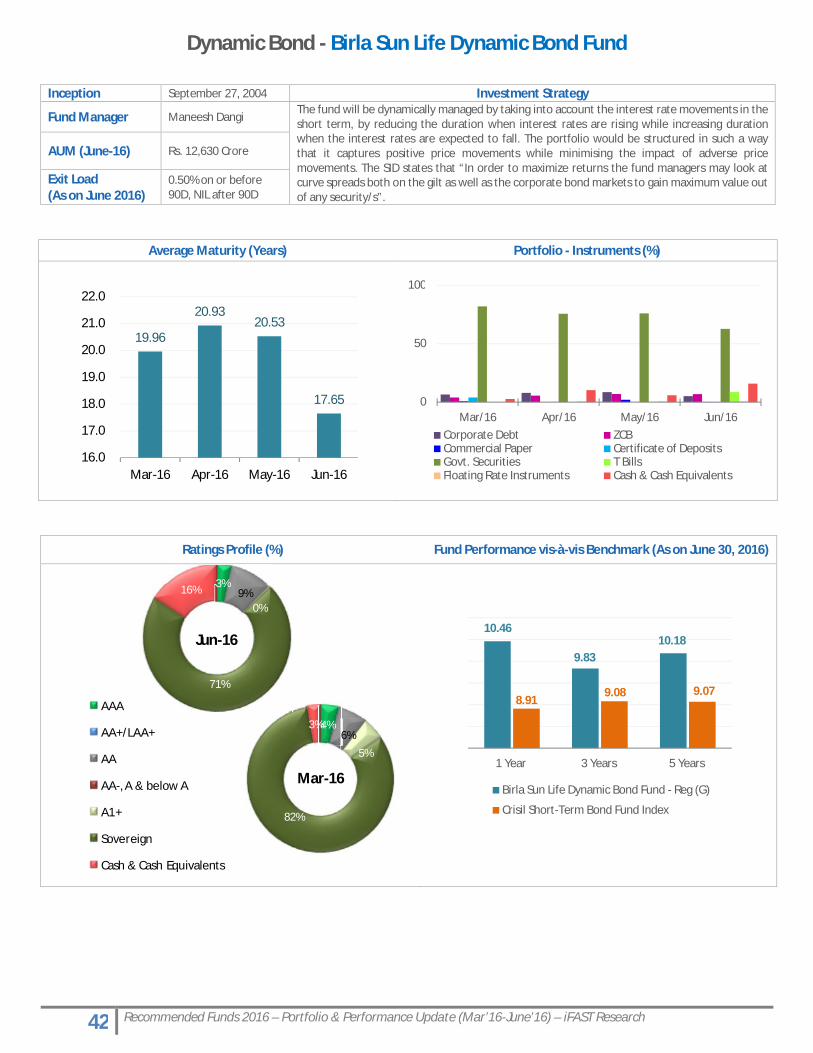
42 Recommended Funds 2016 – Portfolio & Performance Update (Mar’16-June’16) – iFAST Research
Dynamic Bond - Birla Sun Life Dynamic Bond Fund
Average Maturity (Years) Portfolio - Instruments (%)
Ratings Profile (%) Fund Performance vis-à-vis Benchmark (As on June 30, 2016)
19.96
20.9320.53
17.65
16.0
17.0
18.0
19.0
20.0
21.0
22.0
Mar-16 Apr-16 May-16 Jun-16
0
50
100
Mar/16 Apr/16 May/16 Jun/16Corporate Debt ZCBCommercial Paper Certificate of DepositsGovt. Securities T BillsFloating Rate Instruments Cash & Cash Equivalents
3%9%
0%
71%
16%
Jun-16
4%6%
5%
82%
3%
Mar-16
AAA
AA+/LAA+
AA
AA-, A & below A
A1+
Sovereign
Cash & Cash Equivalents
10.46
9.8310.18
8.919.08 9.07
1 Year 3 Years 5 Years
Birla Sun Life Dynamic Bond Fund - Reg (G)
Crisil Short-Term Bond Fund Index
Inception September 27, 2004 Investment Strategy
Fund Manager Maneesh DangiThe fund will be dynamically managed by taking into account the interest rate movements in the short term, by reducing the duration when interest rates are rising while increasing duration when the interest rates are expected to fall. The portfolio would be structured in such a way that it captures positive price movements while minimising the impact of adverse price movements. The SID states that “In order to maximize returns the fund managers may look at curve spreads both on the gilt as well as the corporate bond markets to gain maximum value out of any security/s”.
AUM (June-16) Rs. 12,630 Crore
Exit Load(As on June 2016)
0.50% on or before 90D, NIL after 90D
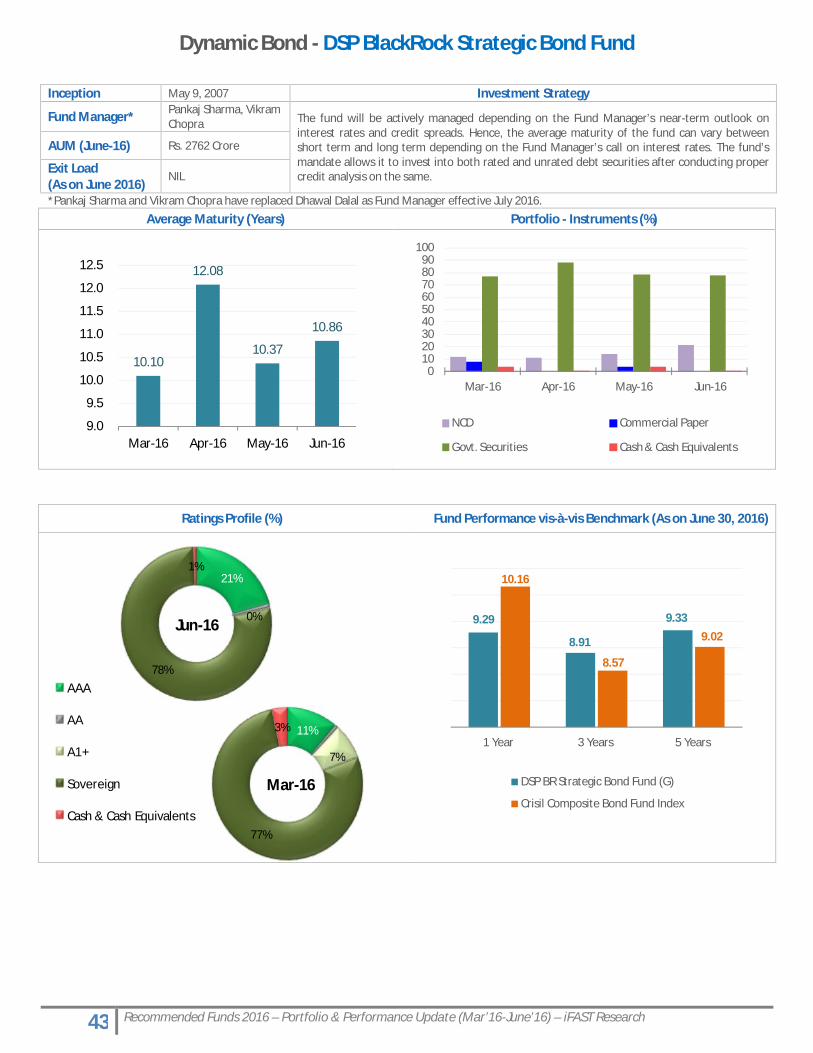
43 Recommended Funds 2016 – Portfolio & Performance Update (Mar’16-June’16) – iFAST Research
Dynamic Bond - DSP BlackRock Strategic Bond Fund
*Pankaj Sharma and Vikram Chopra have replaced Dhawal Dalal as Fund Manager effective July 2016.
Average Maturity (Years) Portfolio - Instruments (%)
Ratings Profile (%) Fund Performance vis-à-vis Benchmark (As on June 30, 2016)
10.10
12.08
10.37
10.86
9.0
9.5
10.0
10.5
11.0
11.5
12.0
12.5
Mar-16 Apr-16 May-16 Jun-16
0102030405060708090
100
Mar-16 Apr-16 May-16 Jun-16
NCD Commercial Paper
Govt. Securities Cash & Cash Equivalents
21%
0%
78%
1%
Jun-16
11%
7%
77%
3%
Mar-16
AAA
AA
A1+
Sovereign
Cash & Cash Equivalents
9.29
8.91
9.33
10.16
8.57
9.02
1 Year 3 Years 5 Years
DSP BR Strategic Bond Fund (G)
Crisil Composite Bond Fund Index
Inception May 9, 2007 Investment Strategy
Fund Manager* Pankaj Sharma, Vikram Chopra The fund will be actively managed depending on the Fund Manager’s near-term outlook on
interest rates and credit spreads. Hence, the average maturity of the fund can vary between short term and long term depending on the Fund Manager’s call on interest rates. The fund’s mandate allows it to invest into both rated and unrated debt securities after conducting proper credit analysis on the same.
AUM (June-16) Rs. 2762 Crore
Exit Load(As on June 2016)
NIL
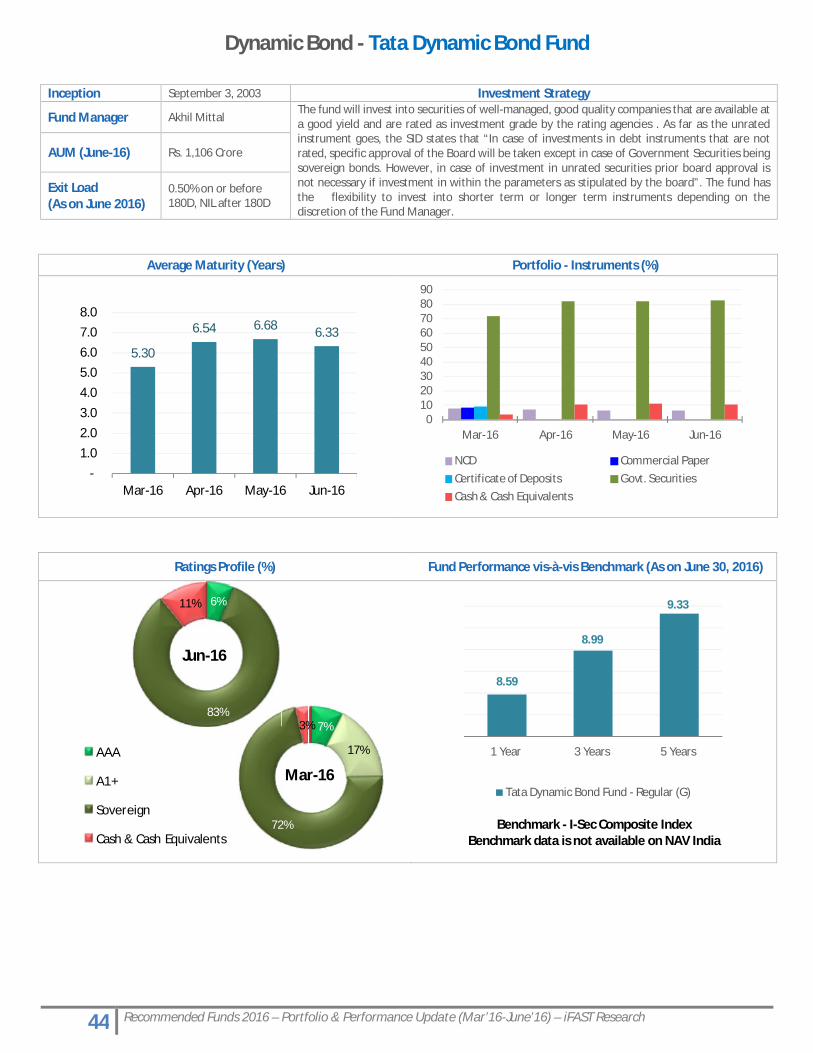
44 Recommended Funds 2016 – Portfolio & Performance Update (Mar’16-June’16) – iFAST Research
Dynamic Bond - Tata Dynamic Bond Fund
Average Maturity (Years) Portfolio - Instruments (%)
Ratings Profile (%) Fund Performance vis-à-vis Benchmark (As on June 30, 2016)
Benchmark - I-Sec Composite Index Benchmark data is not available on NAV India
5.30
6.54 6.68 6.33
- 1.0 2.0 3.0
4.0 5.0 6.0 7.0 8.0
Mar-16 Apr-16 May-16 Jun-16
0102030405060708090
Mar-16 Apr-16 May-16 Jun-16
NCD Commercial PaperCertificate of Deposits Govt. SecuritiesCash & Cash Equivalents
6%
83%
11%
Jun-16
7%
17%
72%
3%
Mar-16AAA
A1+
Sovereign
Cash & Cash Equivalents
8.59
8.99
9.33
1 Year 3 Years 5 Years
Tata Dynamic Bond Fund - Regular (G)
Inception September 3, 2003 Investment Strategy
Fund Manager Akhil MittalThe fund will invest into securities of well-managed, good quality companies that are available at a good yield and are rated as investment grade by the rating agencies . As far as the unrated instrument goes, the SID states that “In case of investments in debt instruments that are not rated, specific approval of the Board will be taken except in case of Government Securities being sovereign bonds. However, in case of investment in unrated securities prior board approval is not necessary if investment in within the parameters as stipulated by the board”. The fund has the flexibility to invest into shorter term or longer term instruments depending on the discretion of the Fund Manager.
AUM (June-16) Rs. 1,106 Crore
Exit Load(As on June 2016)
0.50% on or before 180D, NIL after 180D
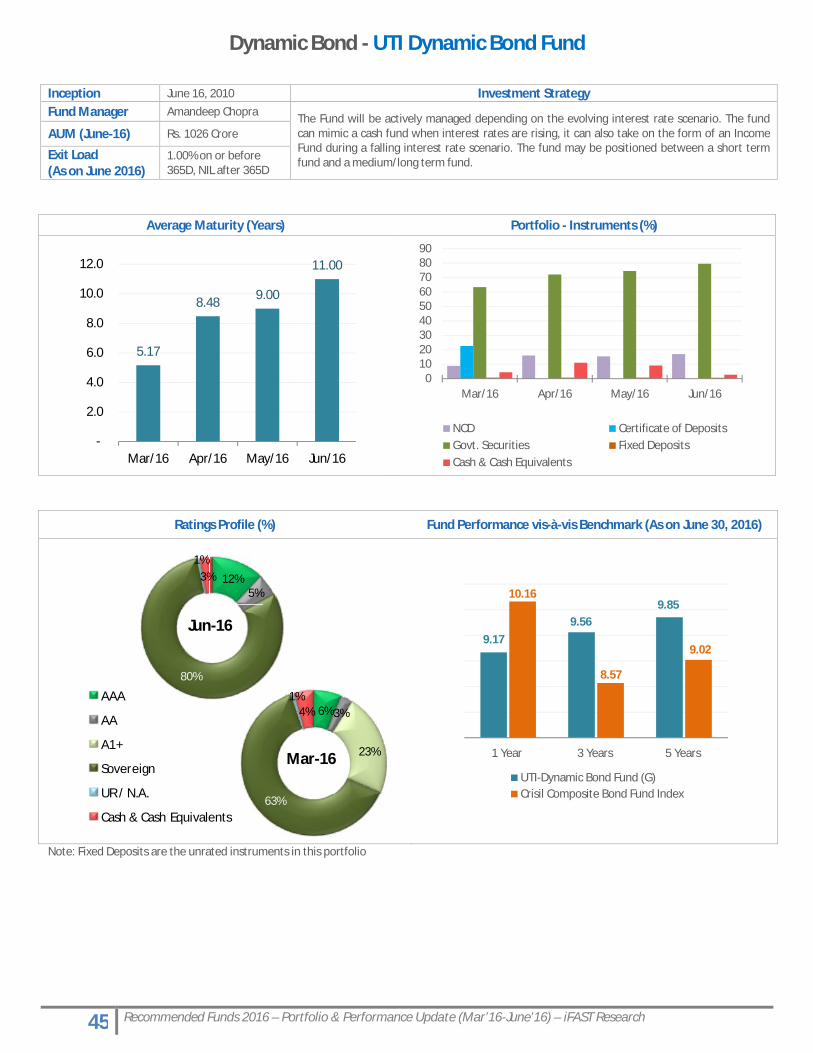
45 Recommended Funds 2016 – Portfolio & Performance Update (Mar’16-June’16) – iFAST Research
Dynamic Bond - UTI Dynamic Bond Fund
Average Maturity (Years) Portfolio - Instruments (%)
Ratings Profile (%) Fund Performance vis-à-vis Benchmark (As on June 30, 2016)
Note: Fixed Deposits are the unrated instruments in this portfolio
5.17
8.48 9.00
11.00
-
2.0
4.0
6.0
8.0
10.0
12.0
Mar/16 Apr/16 May/16 Jun/16
0102030405060708090
Mar/16 Apr/16 May/16 Jun/16
NCD Certificate of DepositsGovt. Securities Fixed DepositsCash & Cash Equivalents
12%5%
80%
1%3%
Jun-16
6%3%
23%
63%
1%4%
Mar-16
AAA
AA
A1+
Sovereign
UR / N.A.
Cash & Cash Equivalents
9.179.56
9.8510.16
8.57
9.02
1 Year 3 Years 5 Years
UTI-Dynamic Bond Fund (G)Crisil Composite Bond Fund Index
Inception June 16, 2010 Investment StrategyFund Manager Amandeep Chopra The Fund will be actively managed depending on the evolving interest rate scenario. The fund
can mimic a cash fund when interest rates are rising, it can also take on the form of an Income Fund during a falling interest rate scenario. The fund may be positioned between a short term fund and a medium/long term fund.
AUM (June-16) Rs. 1026 Crore
Exit Load(As on June 2016)
1.00% on or before365D, NIL after 365D
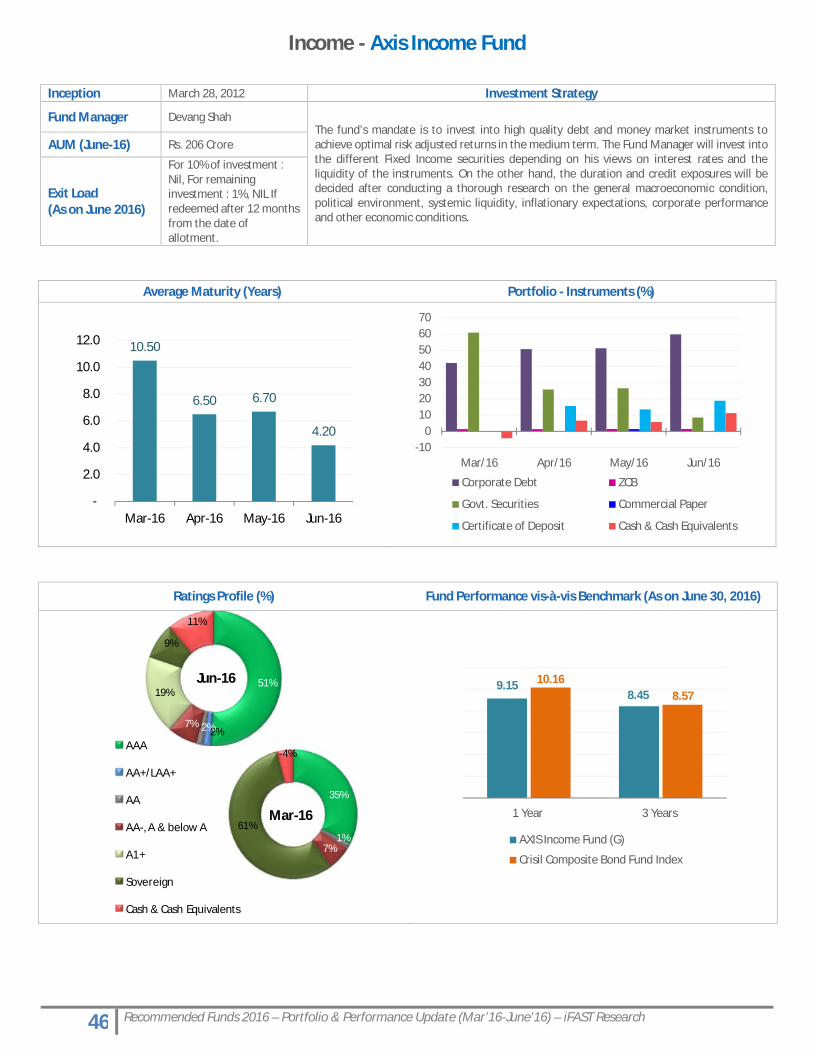
46 Recommended Funds 2016 – Portfolio & Performance Update (Mar’16-June’16) – iFAST Research
Income - Axis Income Fund
Average Maturity (Years) Portfolio - Instruments (%)
Ratings Profile (%) Fund Performance vis-à-vis Benchmark (As on June 30, 2016)
10.50
6.50 6.70
4.20
-
2.0
4.0
6.0
8.0
10.0
12.0
Mar-16 Apr-16 May-16 Jun-16
-100
10203040506070
Mar/16 Apr/16 May/16 Jun/16
Corporate Debt ZCB
Govt. Securities Commercial Paper
Certificate of Deposit Cash & Cash Equivalents
51%
2%2%7%
19%
9%
11%
Jun-16
35%
1%7%
61%
-4%
Mar-16
AAA
AA+/LAA+
AA
AA-, A & below A
A1+
Sovereign
Cash & Cash Equivalents
9.158.45
10.168.57
1 Year 3 Years
AXIS Income Fund (G)
Crisil Composite Bond Fund Index
Inception March 28, 2012 Investment Strategy
Fund Manager Devang ShahThe fund’s mandate is to invest into high quality debt and money market instruments to achieve optimal risk adjusted returns in the medium term. The Fund Manager will invest into the different Fixed Income securities depending on his views on interest rates and the liquidity of the instruments. On the other hand, the duration and credit exposures will be decided after conducting a thorough research on the general macroeconomic condition, political environment, systemic liquidity, inflationary expectations, corporate performance and other economic conditions.
AUM (June-16) Rs. 206 Crore
Exit Load(As on June 2016)
For 10% of investment : Nil, For remaining investment : 1%, NIL If redeemed after 12 months from the date of allotment.
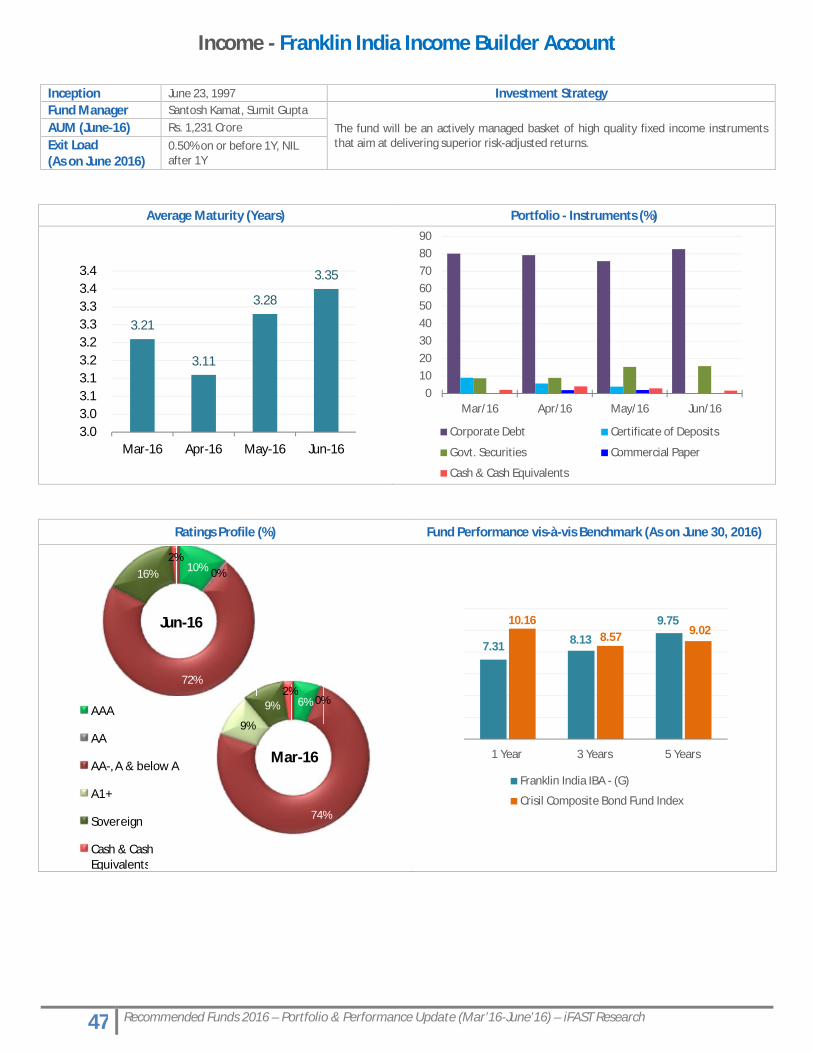
47 Recommended Funds 2016 – Portfolio & Performance Update (Mar’16-June’16) – iFAST Research
Income - Franklin India Income Builder Account
Average Maturity (Years) Portfolio - Instruments (%)
Ratings Profile (%) Fund Performance vis-à-vis Benchmark (As on June 30, 2016)
3.21
3.11
3.28
3.35
3.0 3.0 3.1 3.1 3.2 3.2 3.3 3.3 3.4 3.4
Mar-16 Apr-16 May-16 Jun-16
0102030405060708090
Mar/16 Apr/16 May/16 Jun/16
Corporate Debt Certificate of Deposits
Govt. Securities Commercial Paper
Cash & Cash Equivalents
10% 0%
72%
16%2%
Jun-16
6% 0%
74%
9%
9%2%
Mar-16
AAA
AA
AA-, A & below A
A1+
Sovereign
Cash & Cash Equivalents
7.31 8.13
9.7510.168.57 9.02
1 Year 3 Years 5 Years
Franklin India IBA - (G)
Crisil Composite Bond Fund Index
Inception June 23, 1997 Investment StrategyFund Manager Santosh Kamat, Sumit Gupta
The fund will be an actively managed basket of high quality fixed income instruments that aim at delivering superior risk-adjusted returns.
AUM (June-16) Rs. 1,231 CroreExit Load(As on June 2016)
0.50% on or before 1Y, NIL after 1Y
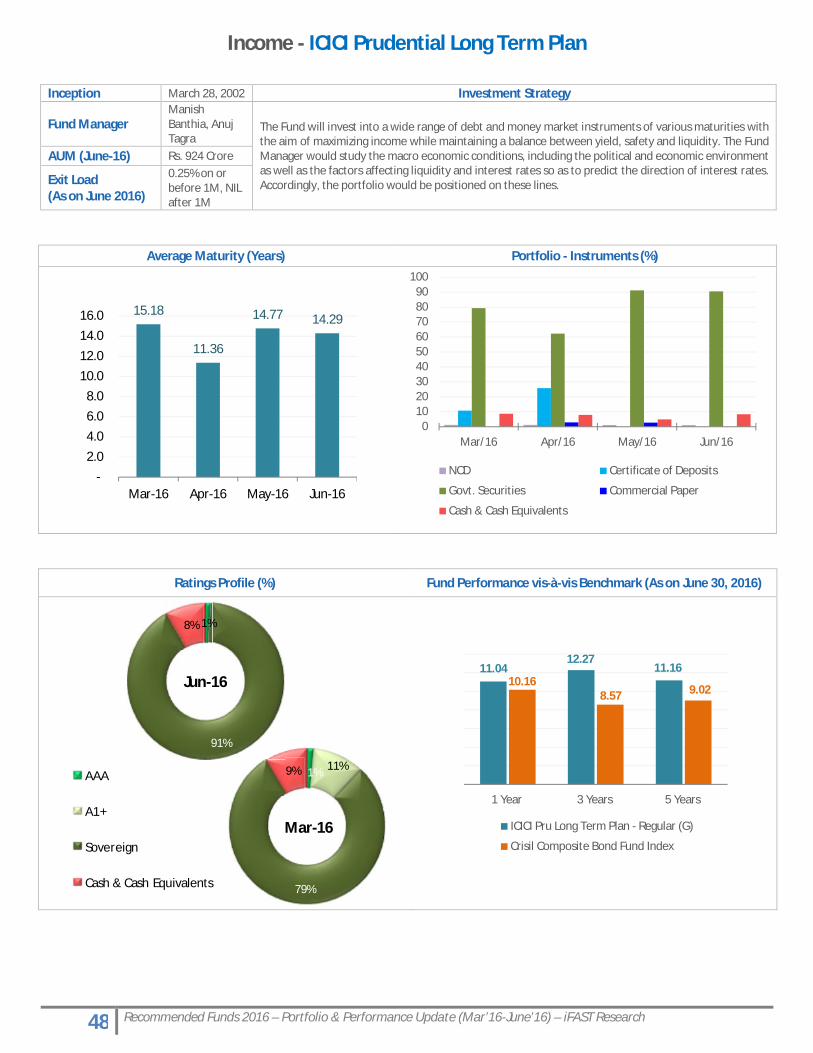
48 Recommended Funds 2016 – Portfolio & Performance Update (Mar’16-June’16) – iFAST Research
Income - ICICI Prudential Long Term Plan
Average Maturity (Years) Portfolio - Instruments (%)
Ratings Profile (%) Fund Performance vis-à-vis Benchmark (As on June 30, 2016)
15.18
11.36
14.77 14.29
- 2.0
4.0 6.0 8.0
10.0 12.0
14.0 16.0
Mar-16 Apr-16 May-16 Jun-16
0102030405060708090
100
Mar/16 Apr/16 May/16 Jun/16
NCD Certificate of Deposits
Govt. Securities Commercial Paper
Cash & Cash Equivalents
1%
91%
8%
Jun-16
1% 11%
79%
9%
Mar-16
AAA
A1+
Sovereign
Cash & Cash Equivalents
11.0412.27
11.1610.16
8.57 9.02
1 Year 3 Years 5 Years
ICICI Pru Long Term Plan - Regular (G)
Crisil Composite Bond Fund Index
Inception March 28, 2002 Investment Strategy
Fund ManagerManish Banthia, Anuj Tagra
The Fund will invest into a wide range of debt and money market instruments of various maturities with the aim of maximizing income while maintaining a balance between yield, safety and liquidity. The Fund Manager would study the macro economic conditions, including the political and economic environment as well as the factors affecting liquidity and interest rates so as to predict the direction of interest rates. Accordingly, the portfolio would be positioned on these lines.
AUM (June-16) Rs. 924 Crore
Exit Load(As on June 2016)
0.25% on or before 1M, NIL after 1M
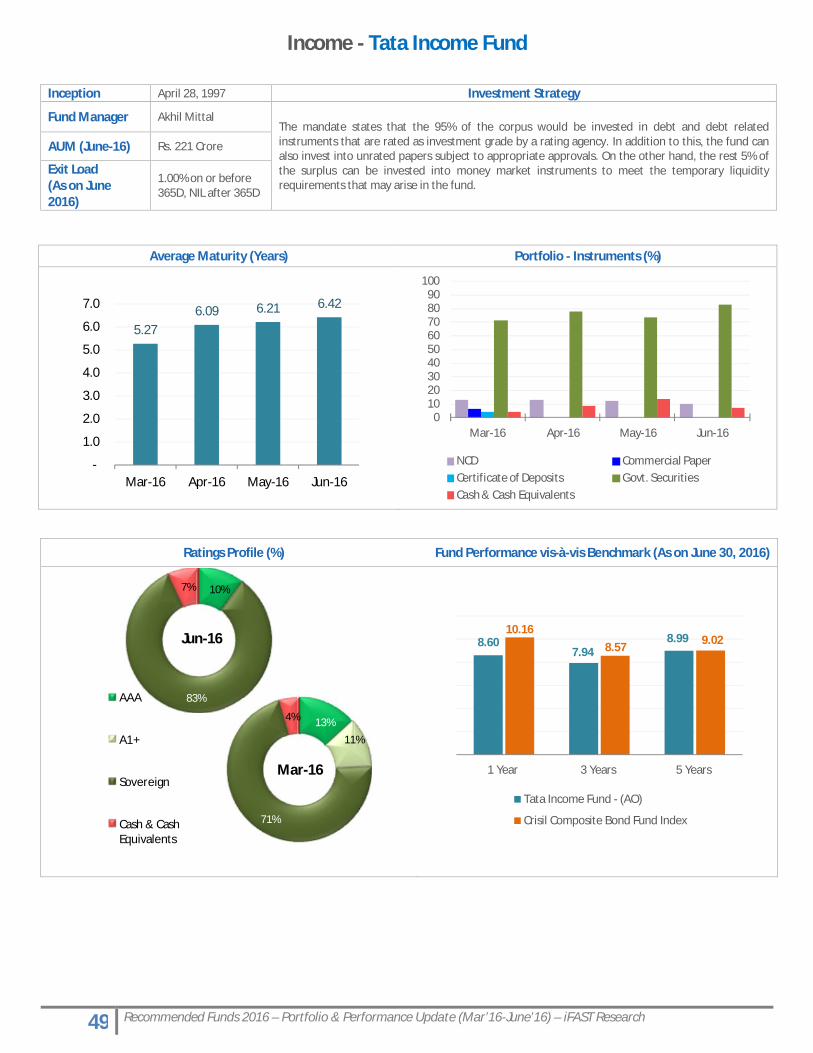
49 Recommended Funds 2016 – Portfolio & Performance Update (Mar’16-June’16) – iFAST Research
Income - Tata Income Fund
Average Maturity (Years) Portfolio - Instruments (%)
5.276.09 6.21 6.42
-
1.0
2.0
3.0
4.0
5.0
6.0
7.0
Mar-16 Apr-16 May-16 Jun-16
0102030405060708090
100
Mar-16 Apr-16 May-16 Jun-16
NCD Commercial PaperCertificate of Deposits Govt. SecuritiesCash & Cash Equivalents
Inception April 28, 1997 Investment Strategy
Fund Manager Akhil MittalThe mandate states that the 95% of the corpus would be invested in debt and debt related instruments that are rated as investment grade by a rating agency. In addition to this, the fund can also invest into unrated papers subject to appropriate approvals. On the other hand, the rest 5% of the surplus can be invested into money market instruments to meet the temporary liquidity requirements that may arise in the fund.
AUM (June-16) Rs. 221 Crore
Exit Load(As on June 2016)
1.00% on or before 365D, NIL after 365D
Ratings Profile (%) Fund Performance vis-à-vis Benchmark (As on June 30, 2016)
10%
83%
7%
Jun-16
13%
11%
71%
4%
Mar-16
AAA
A1+
Sovereign
Cash & Cash Equivalents
8.607.94
8.9910.16
8.57 9.02
1 Year 3 Years 5 Years
Tata Income Fund - (AO)
Crisil Composite Bond Fund Index
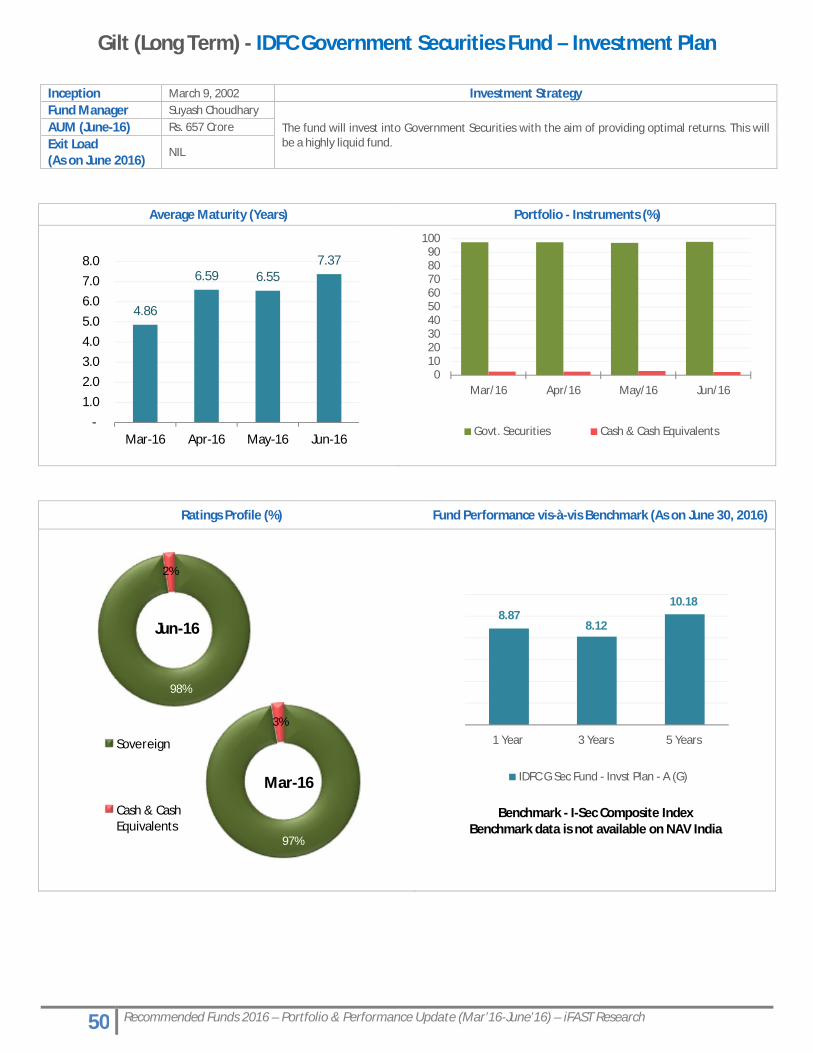
50 Recommended Funds 2016 – Portfolio & Performance Update (Mar’16-June’16) – iFAST Research
Gilt (Long Term) - IDFC Government Securities Fund – Investment Plan
Average Maturity (Years) Portfolio - Instruments (%)
Ratings Profile (%) Fund Performance vis-à-vis Benchmark (As on June 30, 2016)
Benchmark - I-Sec Composite Index Benchmark data is not available on NAV India
4.86
6.59 6.557.37
-
1.0 2.0 3.0 4.0 5.0
6.0 7.0 8.0
Mar-16 Apr-16 May-16 Jun-16
0102030405060708090
100
Mar/16 Apr/16 May/16 Jun/16
Govt. Securities Cash & Cash Equivalents
98%
2%
Jun-16
97%
3%
Mar-16
Sovereign
Cash & Cash Equivalents
8.878.12
10.18
1 Year 3 Years 5 Years
IDFC G Sec Fund - Invst Plan - A (G)
Inception March 9, 2002 Investment StrategyFund Manager Suyash Choudhary
The fund will invest into Government Securities with the aim of providing optimal returns. This will be a highly liquid fund.
AUM (June-16) Rs. 657 CroreExit Load(As on June 2016)
NIL
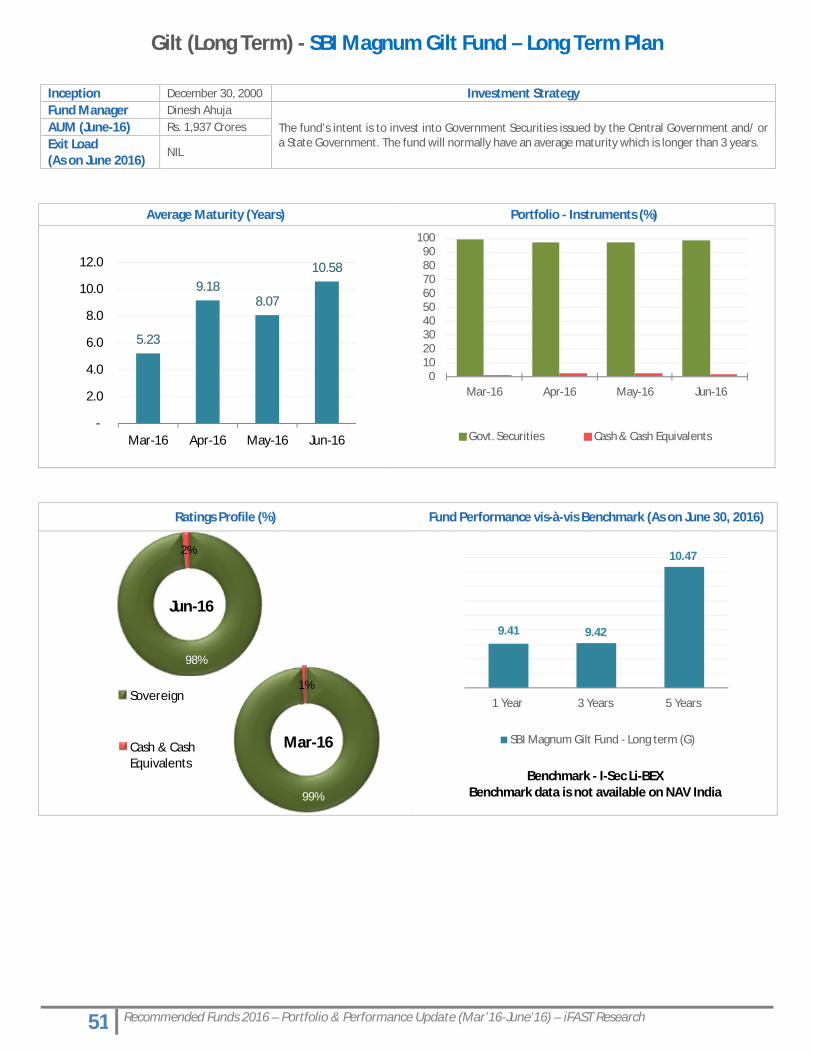
51 Recommended Funds 2016 – Portfolio & Performance Update (Mar’16-June’16) – iFAST Research
Gilt (Long Term) - SBI Magnum Gilt Fund – Long Term Plan
Average Maturity (Years) Portfolio - Instruments (%)
Ratings Profile (%) Fund Performance vis-à-vis Benchmark (As on June 30, 2016)
Benchmark - I-Sec Li-BEXBenchmark data is not available on NAV India
5.23
9.188.07
10.58
-
2.0
4.0
6.0
8.0
10.0
12.0
Mar-16 Apr-16 May-16 Jun-16
0102030405060708090
100
Mar-16 Apr-16 May-16 Jun-16
Govt. Securities Cash & Cash Equivalents
98%
2%
Jun-16
99%
1%
Mar-16
Sovereign
Cash & Cash Equivalents
9.41 9.42
10.47
1 Year 3 Years 5 Years
SBI Magnum Gilt Fund - Long term (G)
Inception December 30, 2000 Investment StrategyFund Manager Dinesh Ahuja
The fund’s intent is to invest into Government Securities issued by the Central Government and/ or a State Government. The fund will normally have an average maturity which is longer than 3 years.
AUM (June-16) Rs. 1,937 CroresExit Load(As on June 2016)
NIL
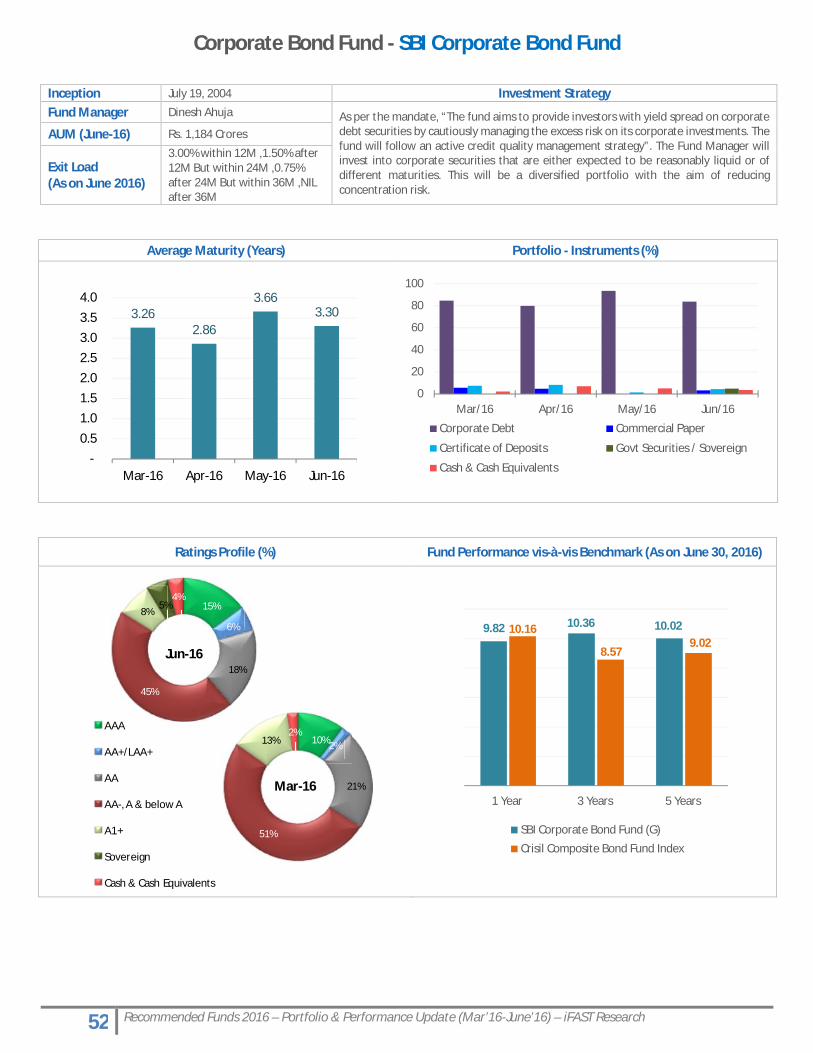
52 Recommended Funds 2016 – Portfolio & Performance Update (Mar’16-June’16) – iFAST Research
Corporate Bond Fund - SBI Corporate Bond Fund
Average Maturity (Years) Portfolio - Instruments (%)
Ratings Profile (%) Fund Performance vis-à-vis Benchmark (As on June 30, 2016)
3.262.86
3.663.30
- 0.5
1.0 1.5 2.0 2.5 3.0 3.5
4.0
Mar-16 Apr-16 May-16 Jun-16
0
20
40
60
80
100
Mar/16 Apr/16 May/16 Jun/16
Corporate Debt Commercial Paper
Certificate of Deposits Govt Securities / Sovereign
Cash & Cash Equivalents
15%
6%
18%
45%
8%5%
4%
Jun-16
10%2%
21%
51%
13%2%
Mar-16
AAA
AA+/LAA+
AA
AA-, A & below A
A1+
Sovereign
Cash & Cash Equivalents
9.82 10.36 10.0210.16
8.579.02
1 Year 3 Years 5 Years
SBI Corporate Bond Fund (G)
Crisil Composite Bond Fund Index
Inception July 19, 2004 Investment StrategyFund Manager Dinesh Ahuja As per the mandate, “The fund aims to provide investors with yield spread on corporate
debt securities by cautiously managing the excess risk on its corporate investments. The fund will follow an active credit quality management strategy”. The Fund Manager will invest into corporate securities that are either expected to be reasonably liquid or of different maturities. This will be a diversified portfolio with the aim of reducing concentration risk.
AUM (June-16) Rs. 1,184 Crores
Exit Load(As on June 2016)
3.00% within 12M ,1.50% after 12M But within 24M ,0.75% after 24M But within 36M ,NIL after 36M
53 Recommended Funds 2016 – Portfolio & Performance Update (Mar’16-June’16) – iFAST Research
Recommended Hybrid Mutual Funds
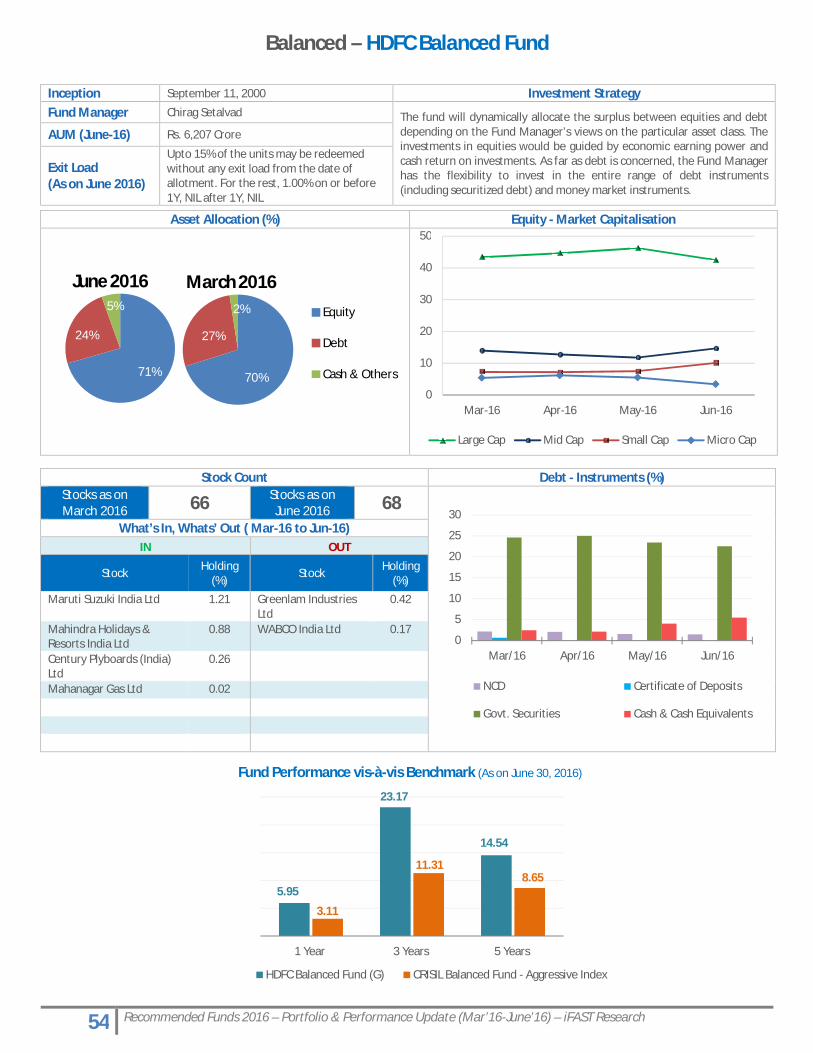
54 Recommended Funds 2016 – Portfolio & Performance Update (Mar’16-June’16) – iFAST Research
Balanced – HDFC Balanced Fund
Stock Count Debt - Instruments (%)Stocks as on March 2016 66 Stocks as on
June 2016 68What’s In, Whats’ Out ( Mar-16 to Jun-16)
IN OUT
Stock Holding (%)
Stock Holding (%)
Maruti Suzuki India Ltd 1.21 Greenlam Industries Ltd
0.42
Mahindra Holidays & Resorts India Ltd
0.88 WABCO India Ltd 0.17
Century Plyboards (India) Ltd
0.26
Mahanagar Gas Ltd 0.02
0
5
10
15
20
25
30
Mar/16 Apr/16 May/16 Jun/16
NCD Certificate of Deposits
Govt. Securities Cash & Cash Equivalents
5.95
23.17
14.54
3.11
11.318.65
1 Year 3 Years 5 Years
Fund Performance vis-à-vis Benchmark (As on June 30, 2016)
HDFC Balanced Fund (G) CRISIL Balanced Fund - Aggressive Index
Inception September 11, 2000 Investment StrategyFund Manager Chirag Setalvad The fund will dynamically allocate the surplus between equities and debt
depending on the Fund Manager’s views on the particular asset class. The investments in equities would be guided by economic earning power and cash return on investments. As far as debt is concerned, the Fund Manager has the flexibility to invest in the entire range of debt instruments (including securitized debt) and money market instruments.
AUM (June-16) Rs. 6,207 Crore
Exit Load(As on June 2016)
Upto 15% of the units may be redeemed without any exit load from the date of allotment. For the rest, 1.00% on or before 1Y, NIL after 1Y, NIL
Asset Allocation (%) Equity - Market Capitalisation
71%
24%
5%
June 2016
70%
27%
2%
March 2016
Equity
Debt
Cash & Others
0
10
20
30
40
50
Mar-16 Apr-16 May-16 Jun-16
Large Cap Mid Cap Small Cap Micro Cap
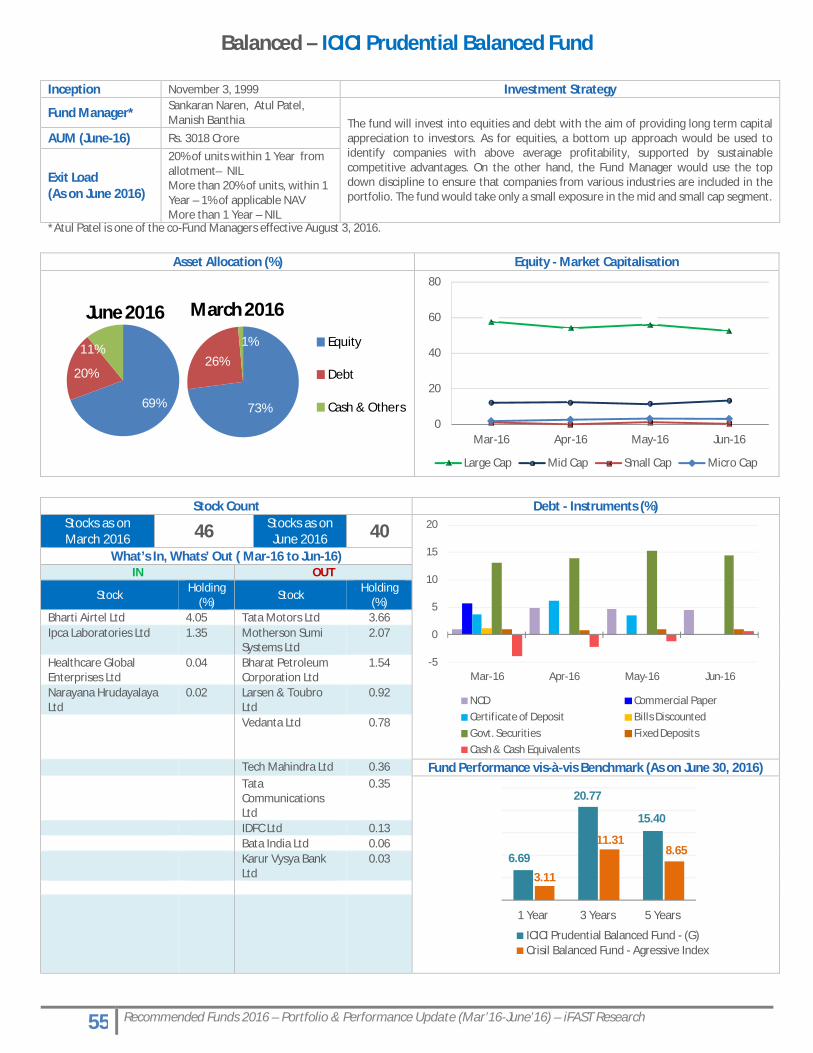
55 Recommended Funds 2016 – Portfolio & Performance Update (Mar’16-June’16) – iFAST Research
Balanced – ICICI Prudential Balanced Fund
*Atul Patel is one of the co-Fund Managers effective August 3, 2016.
Stock Count Debt - Instruments (%)Stocks as on March 2016 46 Stocks as on
June 2016 40What’s In, Whats’ Out ( Mar-16 to Jun-16)
IN OUT
StockHolding
(%) StockHolding
(%)Bharti Airtel Ltd 4.05 Tata Motors Ltd 3.66Ipca Laboratories Ltd 1.35 Motherson Sumi
Systems Ltd2.07
Healthcare Global Enterprises Ltd
0.04 Bharat Petroleum Corporation Ltd
1.54
Narayana Hrudayalaya Ltd
0.02 Larsen & Toubro Ltd
0.92
Vedanta Ltd 0.78
Tech Mahindra Ltd 0.36 Fund Performance vis-à-vis Benchmark (As on June 30, 2016)Tata Communications Ltd
0.35
IDFC Ltd 0.13Bata India Ltd 0.06Karur Vysya Bank Ltd
0.03
-5
0
5
10
15
20
Mar-16 Apr-16 May-16 Jun-16
NCD Commercial PaperCertificate of Deposit Bills DiscountedGovt. Securities Fixed DepositsCash & Cash Equivalents
6.69
20.77
15.40
3.11
11.318.65
1 Year 3 Years 5 Years
ICICI Prudential Balanced Fund - (G)Crisil Balanced Fund - Agressive Index
Inception November 3, 1999 Investment Strategy
Fund Manager* Sankaran Naren, Atul Patel, Manish Banthia The fund will invest into equities and debt with the aim of providing long term capital
appreciation to investors. As for equities, a bottom up approach would be used to identify companies with above average profitability, supported by sustainable competitive advantages. On the other hand, the Fund Manager would use the top down discipline to ensure that companies from various industries are included in the portfolio. The fund would take only a small exposure in the mid and small cap segment.
AUM (June-16) Rs. 3018 Crore
Exit Load(As on June 2016)
20% of units within 1 Year from allotment– NILMore than 20% of units, within 1 Year – 1% of applicable NAV More than 1 Year – NIL
Asset Allocation (%) Equity - Market Capitalisation
69%
20%
11%
June 2016
73%
26%
1%
March 2016
Equity
Debt
Cash & Others0
20
40
60
80
Mar-16 Apr-16 May-16 Jun-16
Large Cap Mid Cap Small Cap Micro Cap
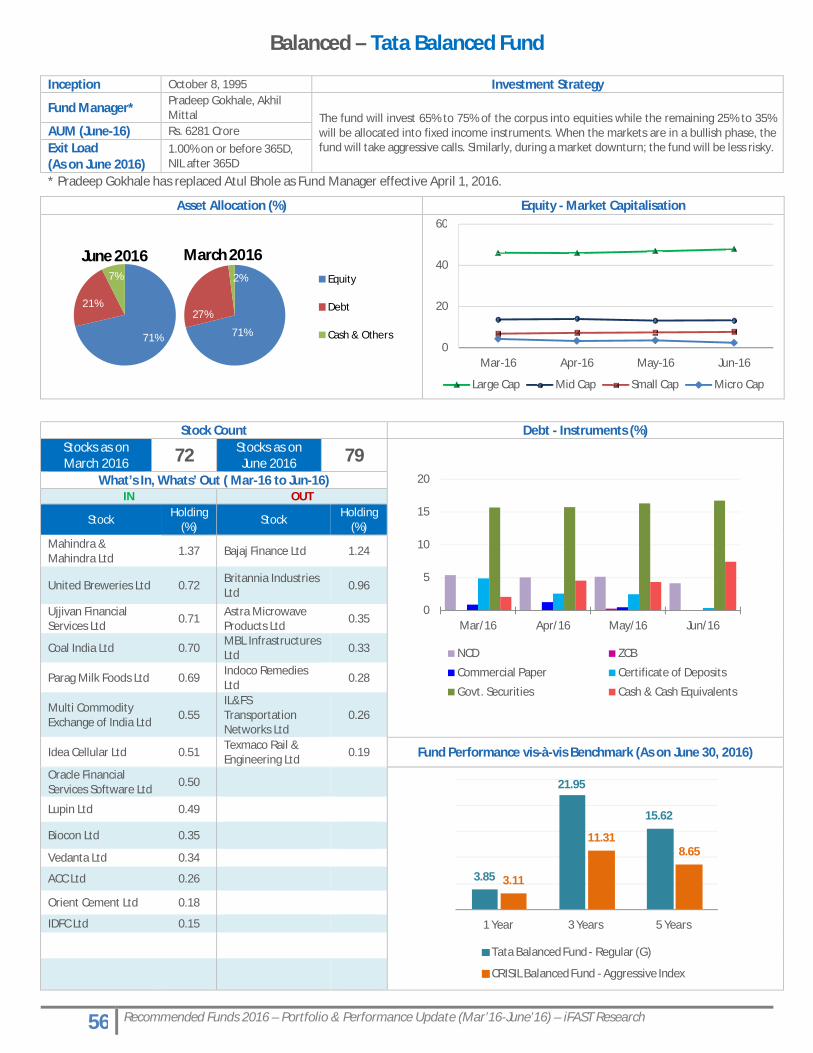
56 Recommended Funds 2016 – Portfolio & Performance Update (Mar’16-June’16) – iFAST Research
Balanced – Tata Balanced Fund
* Pradeep Gokhale has replaced Atul Bhole as Fund Manager effective April 1, 2016.
Stock Count Debt - Instruments (%)Stocks as on March 2016 72 Stocks as on
June 2016 79What’s In, Whats’ Out ( Mar-16 to Jun-16)
IN OUT
StockHolding
(%) StockHolding
(%)Mahindra & Mahindra Ltd
1.37 Bajaj Finance Ltd 1.24
United Breweries Ltd 0.72Britannia Industries Ltd
0.96
Ujjivan Financial Services Ltd
0.71 Astra Microwave Products Ltd
0.35
Coal India Ltd 0.70MBL Infrastructures Ltd 0.33
Parag Milk Foods Ltd 0.69Indoco Remedies Ltd
0.28
Multi Commodity Exchange of India Ltd
0.55IL&FS Transportation Networks Ltd
0.26
Idea Cellular Ltd 0.51Texmaco Rail & Engineering Ltd
0.19 Fund Performance vis-à-vis Benchmark (As on June 30, 2016)
Oracle Financial Services Software Ltd
0.50
Lupin Ltd 0.49
Biocon Ltd 0.35
Vedanta Ltd 0.34
ACC Ltd 0.26
Orient Cement Ltd 0.18
IDFC Ltd 0.15
0
5
10
15
20
Mar/16 Apr/16 May/16 Jun/16
NCD ZCB
Commercial Paper Certificate of Deposits
Govt. Securities Cash & Cash Equivalents
3.85
21.95
15.62
3.11
11.318.65
1 Year 3 Years 5 Years
Tata Balanced Fund - Regular (G)
CRISIL Balanced Fund - Aggressive Index
Asset Allocation (%) Equity - Market Capitalisation
Inception October 8, 1995 Investment Strategy
Fund Manager* Pradeep Gokhale, Akhil Mittal The fund will invest 65% to 75% of the corpus into equities while the remaining 25% to 35%
will be allocated into fixed income instruments. When the markets are in a bullish phase, the fund will take aggressive calls. Similarly, during a market downturn; the fund will be less risky.
AUM (June-16) Rs. 6281 CroreExit Load(As on June 2016)
1.00% on or before 365D,NIL after 365D
71%
21%
7%
June 2016
71%
27%
2%
March 2016Equity
Debt
Cash & Others0
20
40
60
Mar-16 Apr-16 May-16 Jun-16
Large Cap Mid Cap Small Cap Micro Cap
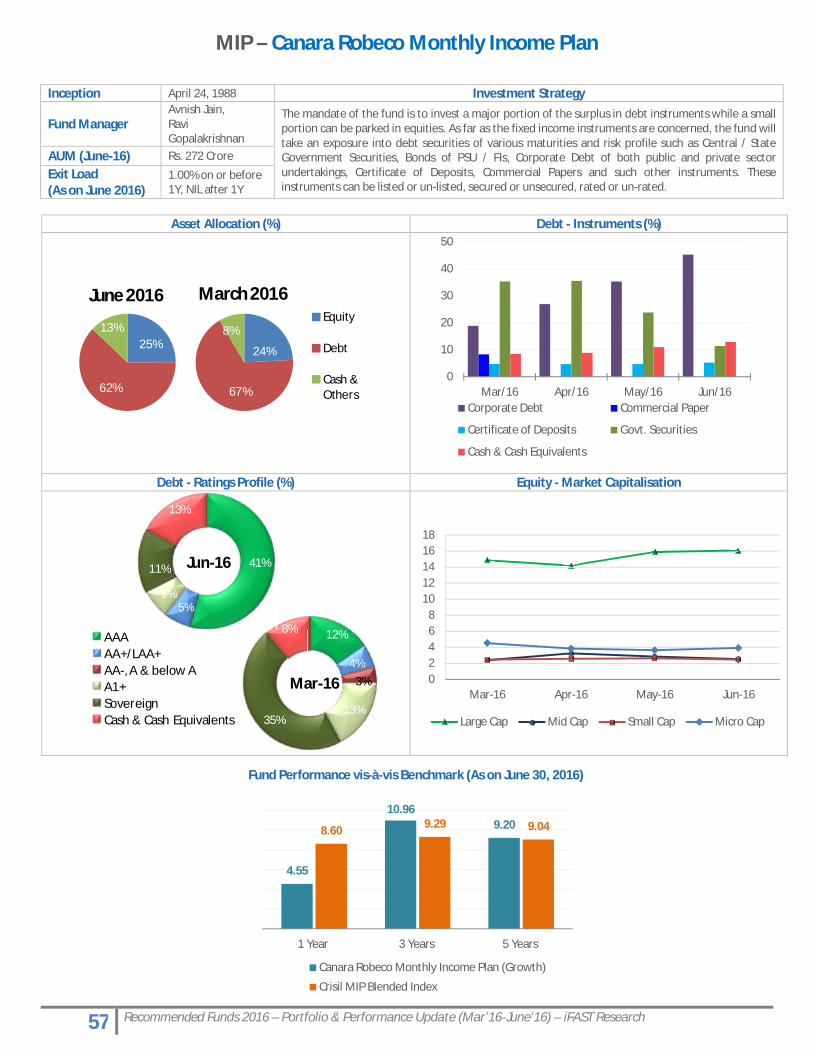
57 Recommended Funds 2016 – Portfolio & Performance Update (Mar’16-June’16) – iFAST Research
MIP – Canara Robeco Monthly Income Plan
Asset Allocation (%) Debt - Instruments (%)
Debt - Ratings Profile (%) Equity - Market Capitalisation
25%
62%
13%
June 2016
24%
67%
8%
March 2016Equity
Debt
Cash & Others
0
10
20
30
40
50
Mar/16 Apr/16 May/16 Jun/16Corporate Debt Commercial Paper
Certificate of Deposits Govt. Securities
Cash & Cash Equivalents
41%
5%5%
11%
13%
Jun-16
12%
4%3%
13%35%
8%
Mar-16
AAAAA+/LAA+AA-, A & below AA1+SovereignCash & Cash Equivalents
02468
1012141618
Mar-16 Apr-16 May-16 Jun-16
Large Cap Mid Cap Small Cap Micro Cap
Inception April 24, 1988 Investment Strategy
Fund ManagerAvnish Jain,Ravi Gopalakrishnan
The mandate of the fund is to invest a major portion of the surplus in debt instruments while a small portion can be parked in equities. As far as the fixed income instruments are concerned, the fund will take an exposure into debt securities of various maturities and risk profile such as Central / State Government Securities, Bonds of PSU / FIs, Corporate Debt of both public and private sector undertakings, Certificate of Deposits, Commercial Papers and such other instruments. These instruments can be listed or un-listed, secured or unsecured, rated or un-rated.
AUM (June-16) Rs. 272 Crore
Exit Load(As on June 2016)
1.00% on or before 1Y, NIL after 1Y
Fund Performance vis-à-vis Benchmark (As on June 30, 2016)
4.55
10.969.208.60 9.29 9.04
1 Year 3 Years 5 Years
Canara Robeco Monthly Income Plan (Growth)
Crisil MIP Blended Index
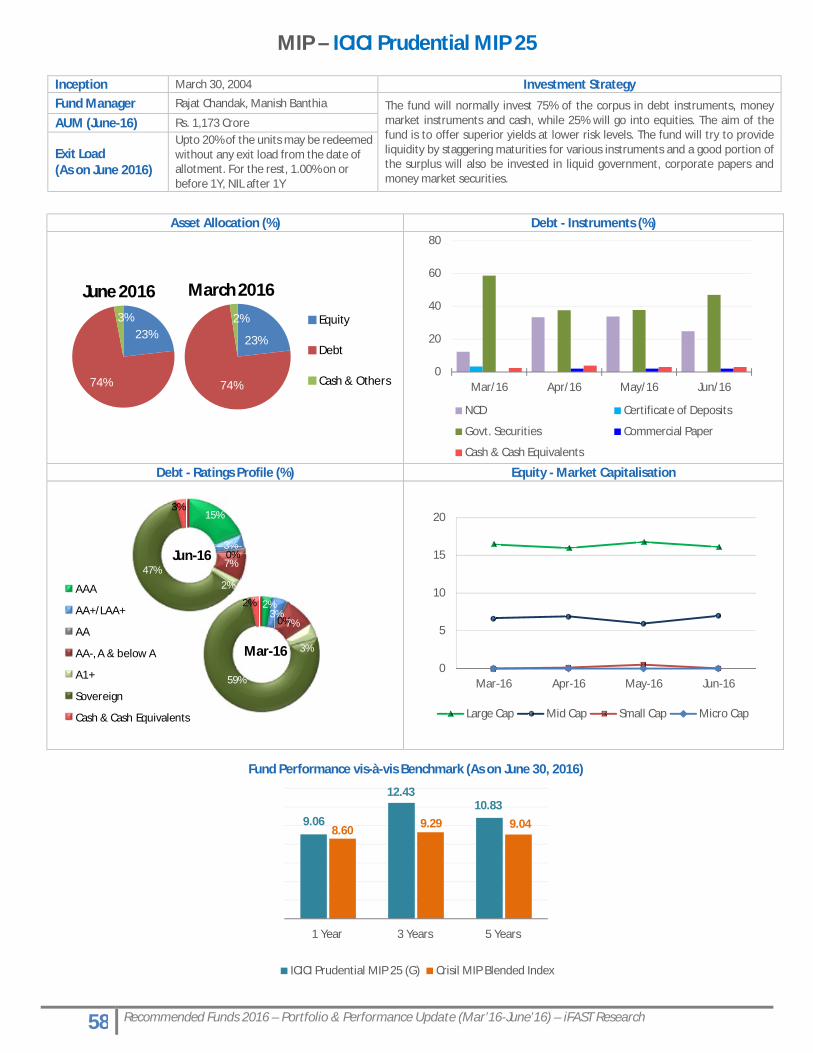
58 Recommended Funds 2016 – Portfolio & Performance Update (Mar’16-June’16) – iFAST Research
MIP – ICICI Prudential MIP 25
Asset Allocation (%) Debt - Instruments (%)
Debt - Ratings Profile (%) Equity - Market Capitalisation
23%
74%
3%
June 2016
23%
74%
2%
March 2016
Equity
Debt
Cash & Others0
20
40
60
80
Mar/16 Apr/16 May/16 Jun/16
NCD Certificate of Deposits
Govt. Securities Commercial Paper
Cash & Cash Equivalents
15%
3%0%7%
2%47%
3%
Jun-16
2%3%
0%7%
3%
59%
2%
Mar-16
AAA
AA+/LAA+
AA
AA-, A & below A
A1+
Sovereign
Cash & Cash Equivalents
0
5
10
15
20
Mar-16 Apr-16 May-16 Jun-16
Large Cap Mid Cap Small Cap Micro Cap
Inception March 30, 2004 Investment StrategyFund Manager Rajat Chandak, Manish Banthia The fund will normally invest 75% of the corpus in debt instruments, money
market instruments and cash, while 25% will go into equities. The aim of the fund is to offer superior yields at lower risk levels. The fund will try to provide liquidity by staggering maturities for various instruments and a good portion of the surplus will also be invested in liquid government, corporate papers and money market securities.
AUM (June-16) Rs. 1,173 Crore
Exit Load(As on June 2016)
Upto 20% of the units may be redeemed without any exit load from the date of allotment. For the rest, 1.00% on or before 1Y, NIL after 1Y
Fund Performance vis-à-vis Benchmark (As on June 30, 2016)
9.06
12.4310.83
8.60 9.29 9.04
1 Year 3 Years 5 Years
ICICI Prudential MIP 25 (G) Crisil MIP Blended Index
59 Recommended Funds 2016 – Portfolio & Performance Update (Mar’16-June’16) – iFAST Research
DisclaimeriFAST and/or its content and research team’s licensed representatives may own or have positions in the mutual funds of any of theAsset Management Company mentioned or referred to in the article, and may from time to time add or dispose of, or be materiallyinterested in any such. This article is not to be construed as an offer or solicitation for the subscription, purchase or sale of any mutual fund. No investment decision should be taken without first viewing a mutual fund's scheme information document including statement of additional information. Any advice herein is made on a general basis and does not take into account the specific investment objectives of the specific person or group of persons. Investors should seek for professional investment, tax, and legal advice before making an investment or any other decision. Past performance and any forecast is not necessarily indicative of the future or likely performance of the mutual fund. The value of mutual funds and the income from them may fall as well as rise. Opinions expressed herein are subject to change without notice. Please read our disclaimer on the website. Please read our disclaimer in the website. Risk Factors: Mutual funds, like securities investments, are subject to market risks and there is no guarantee against loss in the Scheme or that the Scheme’s objectives will be achieved. As with any investment in securities, the NAV of the Units issued under the Scheme can go up or down depending on various factors and forces affecting capital markets. Past performance of the Sponsor/the AMC/the Mutual Fund does not indicate the future performance of the Scheme. The name of the Scheme does not in any manner indicate the quality of the Scheme, its future prospects or returns. Please read the Statement of Additional Information and Scheme Information Document carefully before investing.