reclaimed asphalt pavement blended with waste engine oilsfi.mtu.edu/s-stem/research projects/reports...
TRANSCRIPT
ReclaimedAsphaltPavementBlendedwithWasteEngineOil
Submittedby:
ChristopherD.DeDene
April25,2011
NSFS‐STEMProgramMichiganTechnologicalUniversity
CivilandEnvironmentalEngineeringDepartment1400TownsendDriveHoughton,MI49931
0
TableofContentsINTRODUCTION:.................................................................................................................................................. 1
OBJECTIVES:......................................................................................................................................................... 2
METHODS: ........................................................................................................................................................... 2
AsphaltBinder:.................................................................................................................................................... 2
Table1.Wasteoiltestresults........................................................................................................................ 3
LCAMethodsandData:...................................................................................................................................... 4
Figure1:LifeCycleDiagram........................................................................................................................... 4
Figure2:SiteLocation .................................................................................................................................... 5
RESULTS: .............................................................................................................................................................. 5
BinderResults: .................................................................................................................................................... 5
Figure3.PlotofDSRpermanentdeformationtrendfortestedsamples................................................... 6
Figure4.Hightemperaturegradeoftestedsamples .................................................................................. 6
Figure5.PlotofDSRpermanentdeformationtrendfortestedsamples................................................... 7
Figure6.Hightemperaturegradeoftestedsamples .................................................................................. 7
Figure7.PlotofDSRpermanentdeformationtrendforRTFOagedsamples ........................................... 8
Figure8.HightemperaturegradeofRTFOagedsamples........................................................................... 8
Figure9.PlotofDSRtrendsforPAVagedsamples...................................................................................... 9
Figure10.LowtemperaturegradeofPAVagedsamples ........................................................................... 9
Figure11.Viscositiesofasphaltsamples.................................................................................................... 10
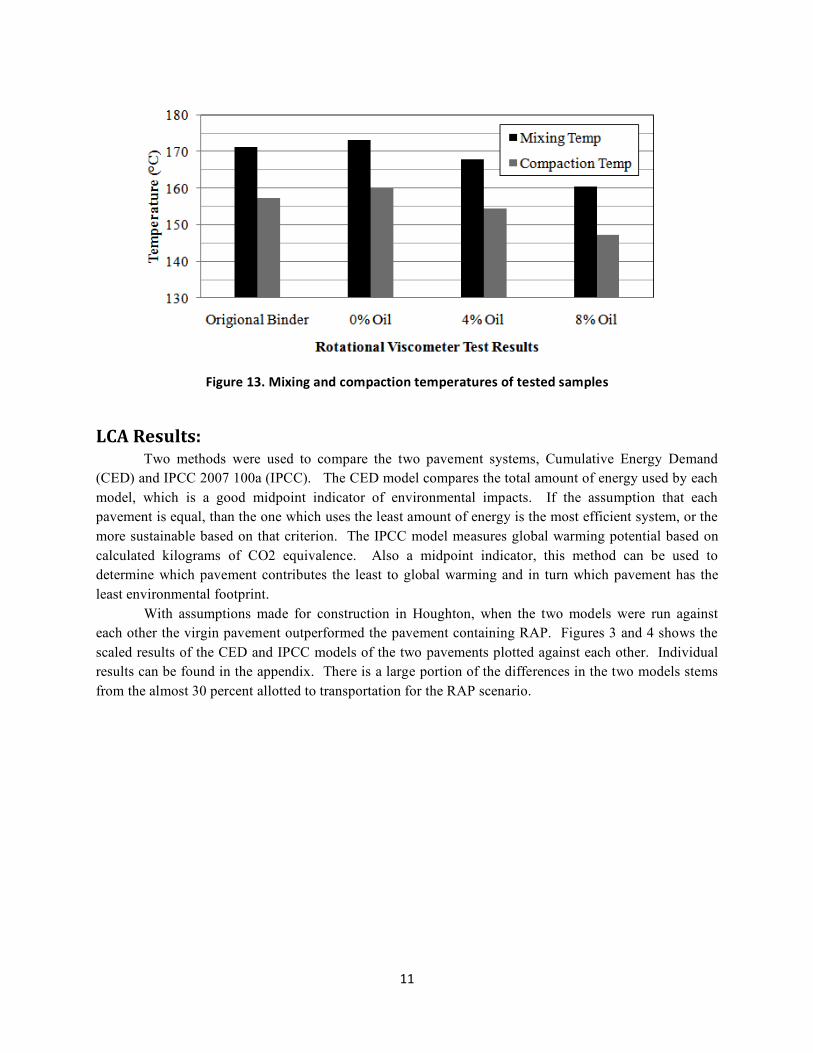
Figure13.Mixingandcompactiontemperaturesoftestedsamples ....................................................... 11
LCAResults: ....................................................................................................................................................... 11
Figure14:CEDResults.................................................................................................................................. 12
Figure15:IPCCResults ................................................................................................................................. 12
Figure16:ModifiedCEDResults ................................................................................................................. 13
Figure17:ModifiedIPCCResults................................................................................................................. 13
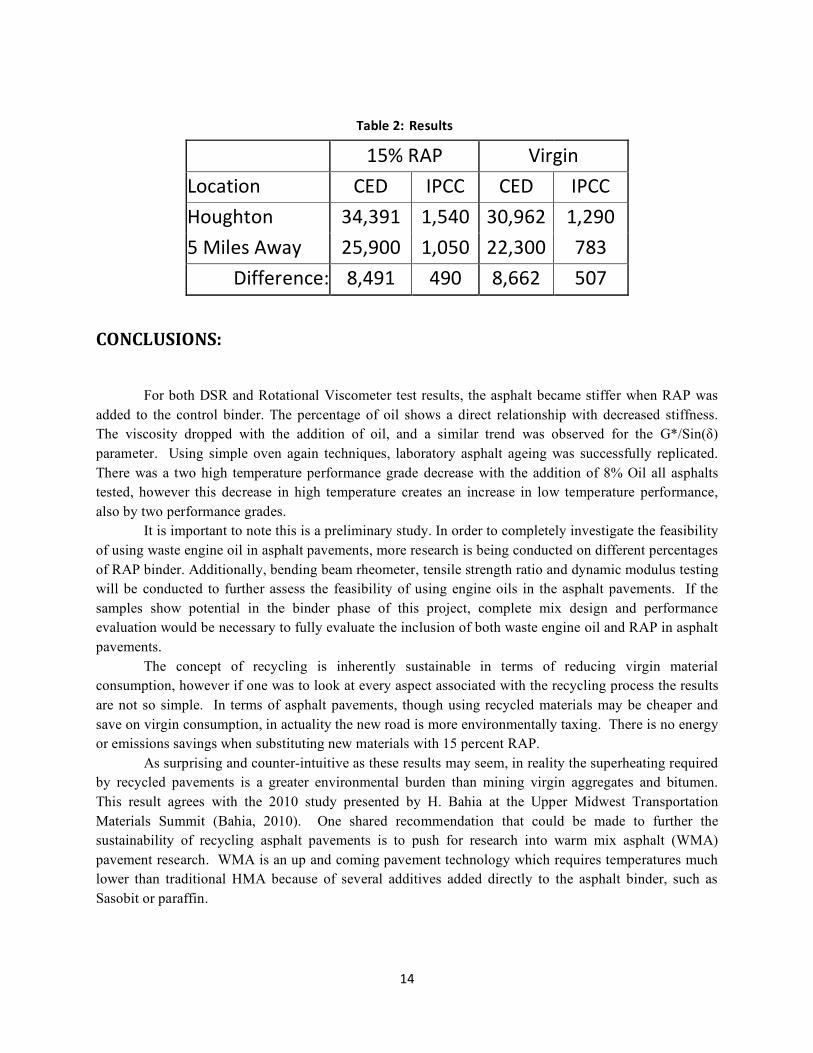
Table2:Results ............................................................................................................................................. 14
CONCLUSIONS: .................................................................................................................................................. 14
REFERENCES: ..................................................................................................................................................... 15
APPENDIX .......................................................................................................................................................... 17
1
A:VirginPavementInputs .......................................................................................................................... A
B:15%RAPPavementsInputs.................................................................................................................. B
C:SampleCalculations ............................................................................................................................... C
D:InitialResults ..........................................................................................................................................D
E:UpdatedInventory ..................................................................................................................................E
F:LoweredTransportationResults ...........................................................................................................G

1
INTRODUCTION:
In the United States, there are an estimated 250 million registered vehicles traveling on four million miles of public road (FHWA 2008). With such a large volume of traffic, two key waste products are generated: engine oil and asphalt pavement material. Asphalt roads last less than a decade before they are in need of maintenance or rehabilitation. Even with perpetual pavements, the wearing course must be replaced frequently. This material which is milled off when the wearing course needs to be replaced can be ground up and used as reclaimed asphalt pavement (RAP). However, the use of high percentages of RAP in pavements is limited by several factors, such as existing DOT standards, variability in long term performance, and feasibility of the recycling process.
Although the use of RAP is greatly documented, the use of RAP without modification is known to produce an overall stiffer blend (Kandhal, Rao et al. 1995; Chen, Chu et al. 2007). With the addition of waste engine oil, this increased stiffness can be offset in order to produce a pavement with consistent performance. Also documented is the use of recycling agents into pavements containing virgin materials in order to produce a softer pavement (Collins and Jones 2000; Chen, Huang et al. 2007). There are varied opinions on the feasibility of lubricating oil as an additive in asphalt cement (Villanueva, Ho et al. 2008; Soleimani, Walsh et al. 2009) as most of the research has focused on trying to improve the low temperature properties of asphalt. Although it is proven that the addition of engine oil can improve the low temperature properties of asphalt (Collins and Jones 2000), never before has waste engine oil been used as a recycling agent for increasing the amount of RAP accepted in pavements.
Lastly, an aspect of sustainability has been included in the form of a life cycle assessment. For this LCA performed, SimaPRO was used to determine if it is indeed environmentally beneficial to recycle asphalt pavements. A typical asphalt pavement is composed of 3 layers, a ten inch subbase, 8 inch granular base and 6 inches of hot mix asphalt (HMA). That is the standard model used for this analysis. Base and subbase materials are taken from the source quarry and added to the construction site. The aggregates for the HMA must be moved from the quarry, to the asphalt plant and back to the construction site.
Once the road is ready for rehabilitation, it can be excavated and transported to a disposal site. For RAP however, the spent road can be ground up and added back into new pavements. For large projects, in order to recycle the current road into the new one the existing road must be transported back to the plant from which it originated. The road undergoes an extensive crushing and is added to new pavements, which have been superheated in order to melt the original asphalt. Putting RAP through a kiln with asphalt on it would compromise the integrity of the recycled bitumen; therefore it is not advisable to kiln heat asphalt binder. Because there is some loss in binder, additional binder is often needed when recycling pavements, but less binder than if one was to begin with entirely virgin materials. Typically asphalt has an effective binder content of around 5 percent, but the ground RAP has only a 4 to 4.5 percent effective content. Effective binder content refers to the amount of asphalt contributed to the mastic and not absorbed by voids in the aggregates. Even though the recycled pavement is made of 15 percent used material, there is additional energy required to mill and transport the RAP and superheat the virgin aggregates.
2
OBJECTIVES:
The primary objective of this research is to combine two waste streams (RAP and waste engine oil) into one viable product. By characterizing the properties of aged asphalt binder that has been blended with waste engine oil, a proof of concept can be established as to the feasibility of waste engine oil as a recycling agent. A comprehensive experimental program is designed to achieve this objective.
Another goal of this report is to determine if the use of RAP reduces the environmental footprint of a pavement construction. The widespread use of RAP in the pavements industry is proof that it is cheaper to produce, but often the environment takes a backseat to the bottom line of cost savings. For the sake of this study, only emissions and energy demand will be accounted for in order to address the pillar of environmental sustainability.
METHODS:
AsphaltBinder:The virgin binder chosen for this study was a PG 70-22 neat binder sampled from a pavement
project in Grand Rapids, Michigan. This binder was combined with RAP-recovered binder at the ratio of 75% neat binder to 25% RAP-recovered binder. The RAP-recovered binder was extracted from a RAP stockpile in Hancock, Michigan. In extracting the RAP binder, the ASTM D 2172 procedure was followed (ASTM 2005). Once extracted, the binder was recovered using the rotary evaporation process as described in ASTM D 1856 (ASTM 2005). The extraction process yielded 88 grams of binder from 2800 grams of the sample of RAP. A second source of aged asphalt was created in the laboratory by open air aging a PG 58-28 in a 100°C oven for several weeks.
The used engine oil was supplied by the Michigan Tech motor pool. The oil was a Chevron Delo 400 LE SAE 15W30 Diesel type oil with 144 machine hours. Due to perceived environmental concerns, there is some stigma over the idea of mixing used engine oil into asphalt pavements. To counter this opposition, Summit Environmental Technologies, INC. tested the oil waste stream for potentially hazardous contents. Both EPA and ASTM test methods were utilized for the testing of the oil. The results of the test show the contaminants Arsenic, Cadmium, and Polychlorinated biphenyls (PCBs) at concentrations of less than 1 part per billion and chromium at less than 4 ppb, is below the restrictions placed on hazardous waste by the EPA (e-CFR 2006). A complete table of the hazard content test results can be found in Table 1.

3
Table1.Wasteoiltestresults
Parameter Waste Oil Test Results Allowable Level Arsenic < 1.0 ppm 5 mg/l Ash 0.66% -- BTU/Gal 138795 / gal -- Cadmium 0.28 ppm 1 mg/l Chromium < 4.0 ppm 5 mg/l Flash Point >200° F 140 ° F Lead 14.0 ppm 5 mg/l PCB < 1.0 ppm 1 mg/l pH 6.69 @ 22.7 °C 2-12 Sulfer, Wt% 0.19% -- Total Halogen, PPM 396 ppm --
The oil was blended with the asphalt blends in two concentrations; 4 and 8% by weight of total
mix. With the aid of a glass rod and under continuous stirring action, the binders were mixed homogenously in a standard specimen can over a hot plate at temperatures around 150 °C. The percentages were chosen based on a review of literature on recycling agents (Villanueva, Ho et al. 2008; Widyatmoko 2008). With the blends, in all seven types of binder were tested: original binder (Original Binder), 25% RAP blended with original binder at three percentages of oil, 0, 4, and 8 percent (0% Oil, 4% Oil, 8% Oil respectively), oven aged asphalt blended with 0, 4 and 8% Oil (0% In House, 4% In House, 8% In House, respectively) and traditionally aged PG 58-28 asphalt blended with 8% waste engine oil(Control RTFO, Control PAV, 8% RTFO, 8% PAV, respectively). The traditionally aged asphalt binder was aged in both the rolling thin film oven (RTFO) and pressure aging vessel (PAV) according to Superpave specifications.
After the samples had been prepared, Rotational Viscometer testing was performed according to ASTM D 4402. The tests were performed on a Brookfield model DV-II Viscometer. The viscosity readings were taken at four temperatures: 100°C, 125°C, 140°C and 160°C. From the results of the test, mixing and compaction temperatures of the blends could be calculated.
The binder was tested on a Bolhin CVO 120 Dynamic Shear Rheometer (DSR). Using 25mm plates, SHRP Pass/Fail testing was conducted at various temperatures. The DSR measured the Complex Modulus (G*) and phase angle (δ) of each sample. The Superpave system uses the parameter G*/Sin (δ) as an indication of the rutting or permanent deformation standard performance criterion. When this parameter is greater than 1.00 kPa at a given temperature, the binder meets that the rutting criterion for performance and is then progressively tested at the next grade temperature until it fails.
On two types of binder, rolling thin film oven (RTFO) and pressure aging vessel (PAV) ageing were carried out. After the binders were RTFO aged, they were tested by SHRP Pass/Fail criteria with the DSR to determine their high temperature grade. The fail parameter on RTFO binder again uses the G*/Sin(δ) parameter and has a 2.2 kPa minimum specification. Lastly, the PAV aged residue was tested with 8mm parallel plates in the same fashion. The binder G*•Sin(δ) parameter was analyzed for this set of tests and compared to the SHRP recommended ceiling of 5000 kPa.
4
LCAMethodsandData:This project will use the functional unit of one lane mile as a reference which can then be
extrapolated for larger projects simply by multiplication. It will account for the material acquisition, transportation and disposal for two different pavement scenarios, 100 percent virgin pavements and pavements blended with 15 percent RAP. It is assumed the pavements will perform the same given the different compositions; however the model will take into account the additional energy needed to reheat the RAP and transport the spent, crushed road back to the plant. The energy required to construct the pavement will be ignored since both pavements are constructed identically.
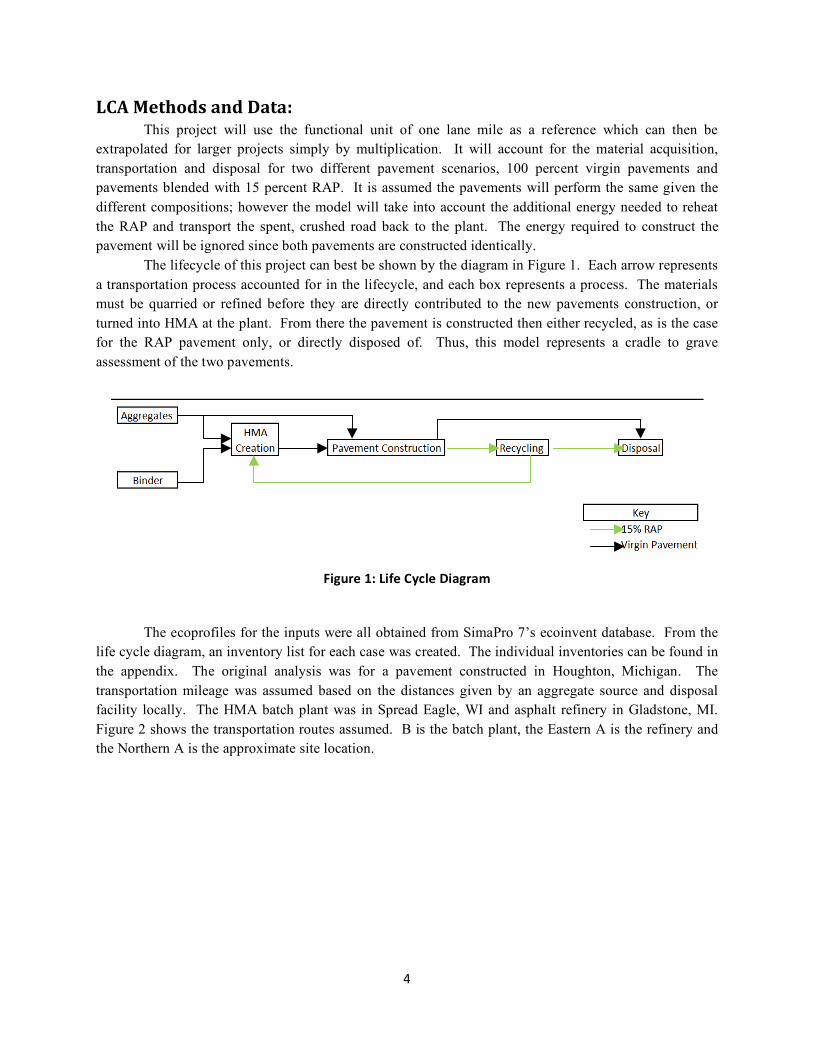
The lifecycle of this project can best be shown by the diagram in Figure 1. Each arrow represents a transportation process accounted for in the lifecycle, and each box represents a process. The materials must be quarried or refined before they are directly contributed to the new pavements construction, or turned into HMA at the plant. From there the pavement is constructed then either recycled, as is the case for the RAP pavement only, or directly disposed of. Thus, this model represents a cradle to grave assessment of the two pavements.
Figure1:LifeCycleDiagram
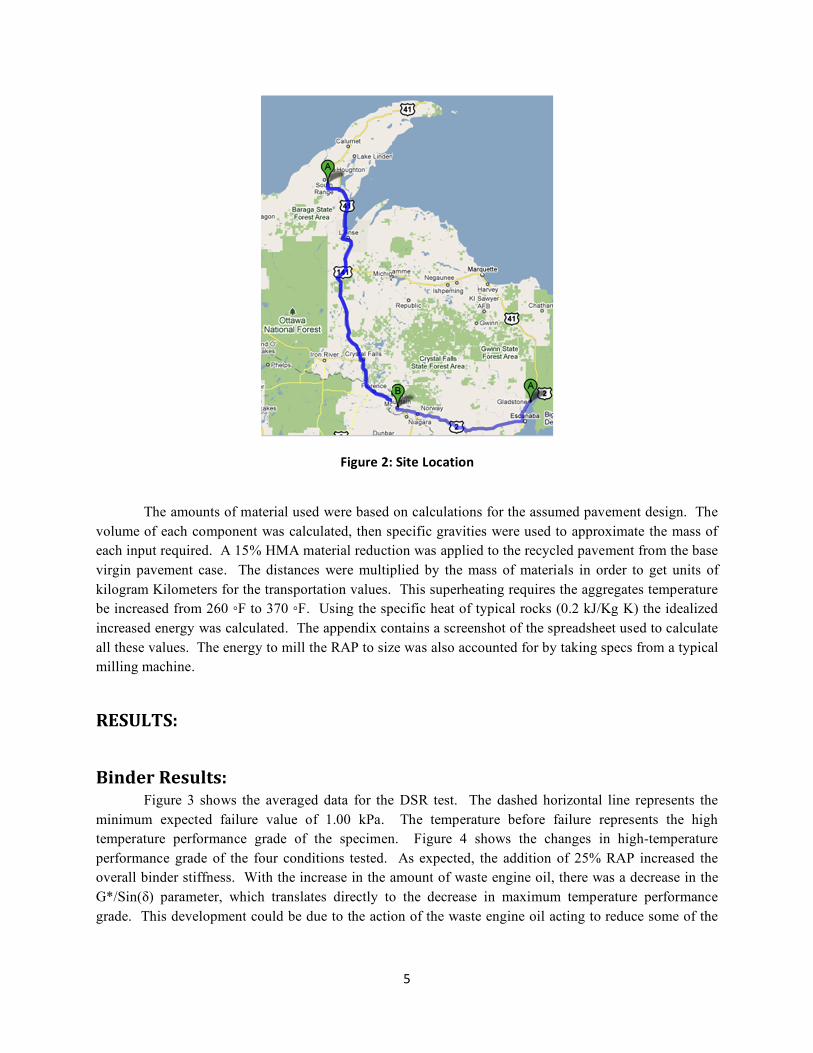
The ecoprofiles for the inputs were all obtained from SimaPro 7’s ecoinvent database. From the life cycle diagram, an inventory list for each case was created. The individual inventories can be found in the appendix. The original analysis was for a pavement constructed in Houghton, Michigan. The transportation mileage was assumed based on the distances given by an aggregate source and disposal facility locally. The HMA batch plant was in Spread Eagle, WI and asphalt refinery in Gladstone, MI. Figure 2 shows the transportation routes assumed. B is the batch plant, the Eastern A is the refinery and the Northern A is the approximate site location.
5
Figure2:SiteLocation
The amounts of material used were based on calculations for the assumed pavement design. The volume of each component was calculated, then specific gravities were used to approximate the mass of each input required. A 15% HMA material reduction was applied to the recycled pavement from the base virgin pavement case. The distances were multiplied by the mass of materials in order to get units of kilogram Kilometers for the transportation values. This superheating requires the aggregates temperature be increased from 260 ◦F to 370 ◦F. Using the specific heat of typical rocks (0.2 kJ/Kg K) the idealized increased energy was calculated. The appendix contains a screenshot of the spreadsheet used to calculate all these values. The energy to mill the RAP to size was also accounted for by taking specs from a typical milling machine.
RESULTS:
BinderResults:Figure 3 shows the averaged data for the DSR test. The dashed horizontal line represents the
minimum expected failure value of 1.00 kPa. The temperature before failure represents the high temperature performance grade of the specimen. Figure 4 shows the changes in high-temperature performance grade of the four conditions tested. As expected, the addition of 25% RAP increased the overall binder stiffness. With the increase in the amount of waste engine oil, there was a decrease in the G*/Sin(δ) parameter, which translates directly to the decrease in maximum temperature performance grade. This development could be due to the action of the waste engine oil acting to reduce some of the

6
higher molecular mass chains in the asphalt binder. It could therefore be stated as creating a “lubricating effect”.
It is worth noting there were a limited number of samples tested in this study. Depending on the site at which the RAP is recovered or the grade of the virgin binder, the properties of the mixture could vary greatly.
Figure3.PlotofDSRpermanentdeformationtrendfortestedsamples
Figure4.Hightemperaturegradeoftestedsamples
7
The oven aged asphalt results can be seen in Figure 5. Again the temperature before the dashed failure line represents the high temperature performance grade. Figure 6 shows a plot of the results of high temperature performance grade for the In House ages asphalt binders. After the innitial PG increase from oven aging, the addition of waste engine oil was able to reduce the performance grade of the asphalt.
Figure5.PlotofDSRpermanentdeformationtrendfortestedsamples
Figure6.Hightemperaturegradeoftestedsamples
Only two binders were tested for traditional asphalt ageing with waste engine oil. Figure 7 shows the results of neat binder RTFO aged compared to binder blended with waste engine oil that has also been

8
RTFO aged. The dashed line represents the failure criterion of 2.2 kPa. Figure 8 shows a graphical representation of the DSR results. Based on the RTFO residue testing, there was a two grade decrease in high temperature PG with the addition of 8% Oil.
Figure7.PlotofDSRpermanentdeformationtrendforRTFOagedsamples
Figure8.HightemperaturegradeofRTFOagedsamples
The same two binders underwent PAV aging to determine their low temperature performance grade. Figure 9 shows the results of neat binder PAV aged compared to binder blended with waste engine oil that has also been PAVaged. The dashed line represents the failure criterion of 5000 kPa. Figure 10 shows a graphical representation of the DSR results. Based on the PAV results, there was a two grade increase in low temperature performance grade.

9
Figure9.PlotofDSRtrendsforPAVagedsamples
Figure10.LowtemperaturegradeofPAVagedsamples
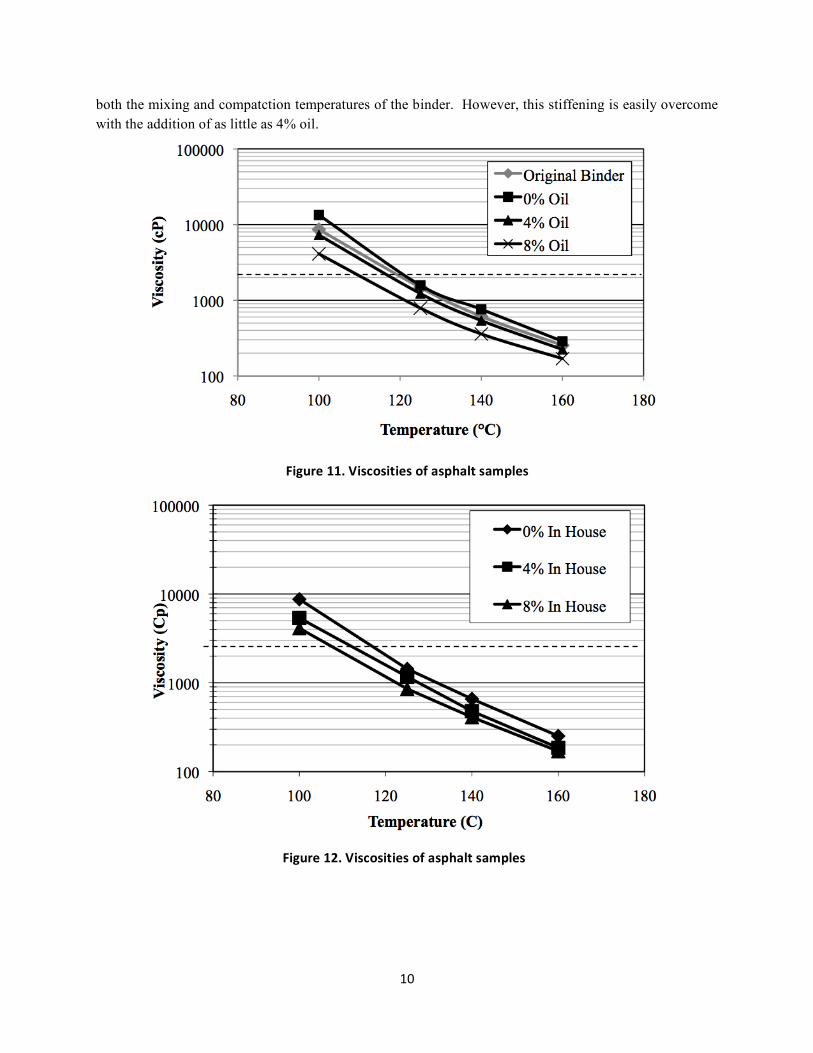
Averaged data from the viscometer experiments can be found in figures 11 and 12. Once again as expected, the addition of RAP made the asphalt binder stiffer than the original binder. Despite the added stiffness, all of the binders remained below the Superpave specification maximum limit of 3000 cP at 135°C, shown by the dashed line on the figure. When additional oil was added to the mixture, the binder became softer, which showed the characteristic nature of the waste engine oil as a softening agent. Thus, there was a progressive decrease in viscosity with increased amounts of the oil.
Using the viscosity data, the estimated mixing and compaction temperatures were calculated for the origional binder and found to be around 170°C and 158°C, respectively. The changes in mixing and compaction temperatures have been included in figure 5. From the data, the addition of RAP increases
10
both the mixing and compatction temperatures of the binder. However, this stiffening is easily overcome with the addition of as little as 4% oil.
Figure11.Viscositiesofasphaltsamples
Figure12.Viscositiesofasphaltsamples
11
Figure13.Mixingandcompactiontemperaturesoftestedsamples
LCAResults:Two methods were used to compare the two pavement systems, Cumulative Energy Demand
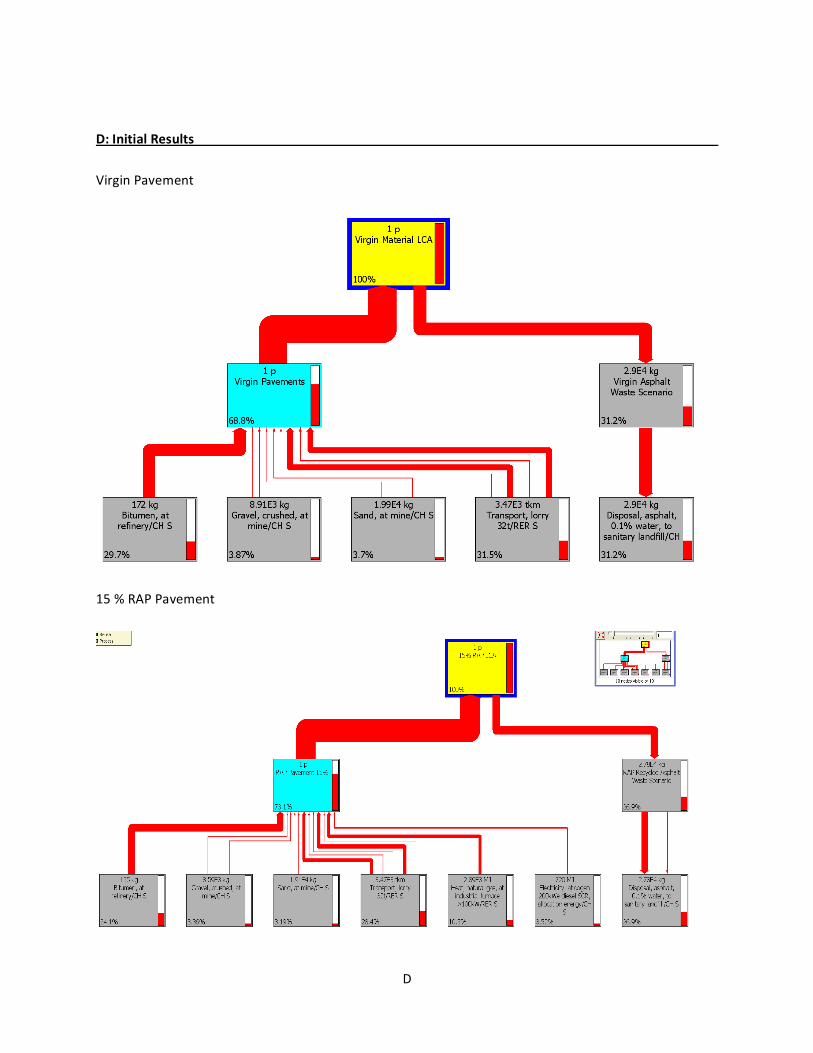
(CED) and IPCC 2007 100a (IPCC). The CED model compares the total amount of energy used by each model, which is a good midpoint indicator of environmental impacts. If the assumption that each pavement is equal, than the one which uses the least amount of energy is the most efficient system, or the more sustainable based on that criterion. The IPCC model measures global warming potential based on calculated kilograms of CO2 equivalence. Also a midpoint indicator, this method can be used to determine which pavement contributes the least to global warming and in turn which pavement has the least environmental footprint.
With assumptions made for construction in Houghton, when the two models were run against each other the virgin pavement outperformed the pavement containing RAP. Figures 3 and 4 shows the scaled results of the CED and IPCC models of the two pavements plotted against each other. Individual results can be found in the appendix. There is a large portion of the differences in the two models stems from the almost 30 percent allotted to transportation for the RAP scenario.

12
Figure14:CEDResults
Figure15:IPCCResults
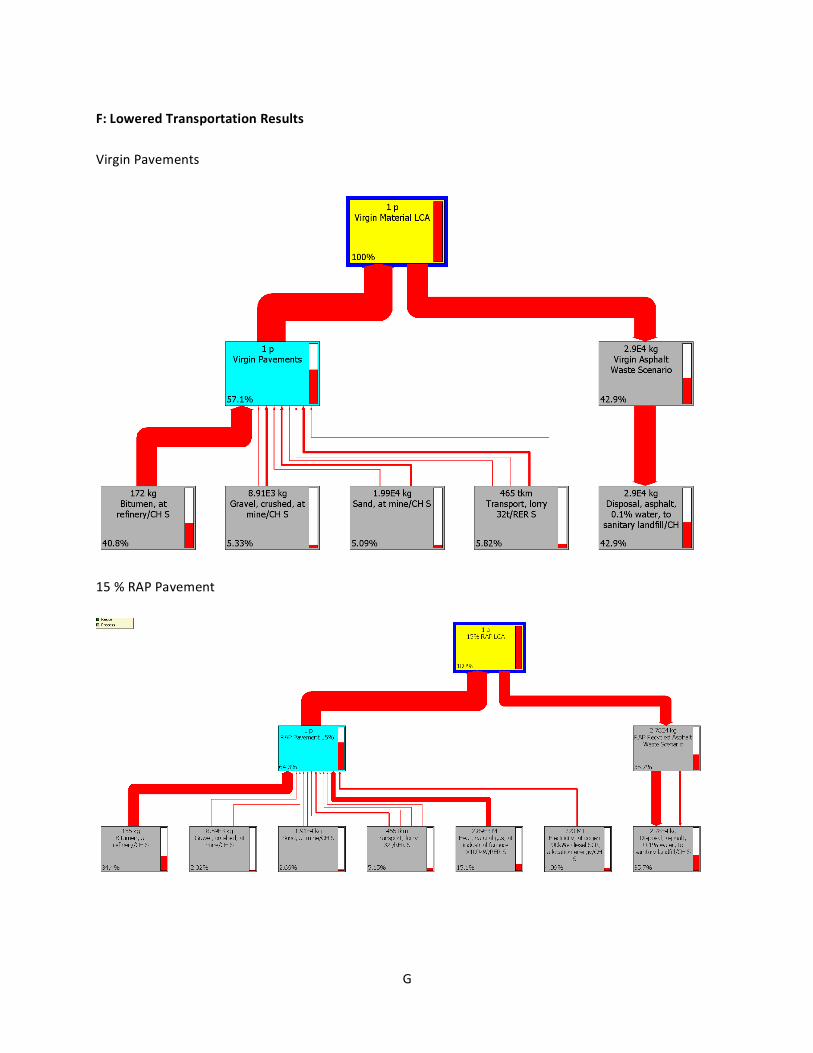
With such a large contribution from the additional transportation required to move the asphalt to and from Houghton, the model assumptions were changed to locate the asphalt batch plant closer to the point of use. For the next case, the assumption was changed to have a batch plant located close to the refinery and both 5 miles from the construction site. The updated inventory can be found in the appendix.
The results of side-by-side comparisons with the new transportation distances can be seen in Figures 5 and 6. Once again, the 15 % RAP pavement requires more energy to produce and emits more kilograms of CO2 equivalent than the completely virgin control. It is worth noting a decrease in both CO2 and total energy compared to the models with a significant amount of transportation. The changes in

13
results can best be seen in Table 1. CED is measured in mega joules of equivalent power and IPCC measures kilograms of equivalent CO2 generated.
Figure16:ModifiedCEDResults
Figure17:ModifiedIPCCResults
14
Table2:Results
15%RAP Virgin
Location CED IPCC CED IPCC
Houghton 34,391 1,540 30,962 1,290
5MilesAway 25,900 1,050 22,300 783
Difference: 8,491 490 8,662 507
CONCLUSIONS:
For both DSR and Rotational Viscometer test results, the asphalt became stiffer when RAP was added to the control binder. The percentage of oil shows a direct relationship with decreased stiffness. The viscosity dropped with the addition of oil, and a similar trend was observed for the G*/Sin(δ) parameter. Using simple oven again techniques, laboratory asphalt ageing was successfully replicated. There was a two high temperature performance grade decrease with the addition of 8% Oil all asphalts tested, however this decrease in high temperature creates an increase in low temperature performance, also by two performance grades.
It is important to note this is a preliminary study. In order to completely investigate the feasibility of using waste engine oil in asphalt pavements, more research is being conducted on different percentages of RAP binder. Additionally, bending beam rheometer, tensile strength ratio and dynamic modulus testing will be conducted to further assess the feasibility of using engine oils in the asphalt pavements. If the samples show potential in the binder phase of this project, complete mix design and performance evaluation would be necessary to fully evaluate the inclusion of both waste engine oil and RAP in asphalt pavements.
The concept of recycling is inherently sustainable in terms of reducing virgin material consumption, however if one was to look at every aspect associated with the recycling process the results are not so simple. In terms of asphalt pavements, though using recycled materials may be cheaper and save on virgin consumption, in actuality the new road is more environmentally taxing. There is no energy or emissions savings when substituting new materials with 15 percent RAP.
As surprising and counter-intuitive as these results may seem, in reality the superheating required by recycled pavements is a greater environmental burden than mining virgin aggregates and bitumen. This result agrees with the 2010 study presented by H. Bahia at the Upper Midwest Transportation Materials Summit (Bahia, 2010). One shared recommendation that could be made to further the sustainability of recycling asphalt pavements is to push for research into warm mix asphalt (WMA) pavement research. WMA is an up and coming pavement technology which requires temperatures much lower than traditional HMA because of several additives added directly to the asphalt binder, such as Sasobit or paraffin.
15
REFERENCES:
ASTM (2005). ASTM D 1856 - 95a: Standard Test Method for Recovery of Asphalt from Solution by Abson Method. 2008 Annual Book of ASTM Standards. West Conshohocken, PA, ASTM International. 04.03: 166-167.
ASTM (2005). ASTM D 2172 - 05: Standard Test Methods for Quantities Extraction of Bitumen from
Bituminous Paving Mixtures (Method A). 2008 Annual Book of ASTM Standards. West Conshohocken, PA, ASTM International. 04.03: 203-214.
Bahia, H. (2010). “Energy, Emissions, and Recycling: Opportunities for Making Asphalt Greener.” Upper Midwest Transportation Materials Summit. Houghton MI, USA. Brock, J. D. and Richmond Sr. J. L. “T-127 MILLING AND RECYCLING” ASTEC. http://www.astecinc.com/images/file/literature/T-127_Milling_Recycling.pdf Chen, J. S., P. Y. Chu, et al. (2007). "Characterization of binder and mix properties to detect reclaimed
asphalt pavement content in bituminous mixtures." Canadian Journal of Civil Engineering 34(5): 581-588.
Chen, J. S., C. C. Huang, et al. (2007). Engineering characterization of recycled asphalt concrete and aged
bitumen mixed recycling agent, Van Godewijckstraat 30, Dordrecht, 3311 GZ, Netherlands, Kluwer Academic Publishers.
Collins, J. H. and G. R. Jones (2000). Asphalt Composition and Method. U. S. Patent. USA. 6074469. CPM, Chalmers University of Technology. (2008). “SPINELCIdataset:Productionofhotmixforasphalt
pavement.”http://www.cpm.chalmers.se/CPMDatabase/Scripts/sheet.asp?ActId=ade25jan744
e-CFR (2006). PART 261—IDENTIFICATION AND LISTING OF HAZARDOUS WASTE. O. o. t. F. R. (OFR). Washington, DC.
FHWA (2008). Highway Statistics 2008, U.S. Department of Transportation. Hand, A. J. T. (2009). “Green Pavement Construction.” Nevada T2 Center. Reno, Nevada, USA.
http://www.t2.unr.edu/T2%20WMA%20&%20RAP%20042309.pdf
Kandhal, P. S., S. S. Rao, et al. (1995). "Performance of recycled hot-mix asphalt mixtures in Georgia." Transportation Research Record(1507): 67-77.
O’Sullivan, K. “100 Percent Recycling – Sustainability in Pavement Construction” International Road
Federation. http://irfnews.pmhclients.com/

16
Recycled Materials Resource Center. (2010) “RECLAIMED ASPHALT PAVEMENT.” University of New hampsure. http://www.rmrc.unh.edu/tools/uguidelines/rap131.asp
Soleimani, A., S. Walsh, et al. (2009). "Asphalt cement loss tangent as surrogate performance indicator for control of thermal cracking." Transportation Research Record(2126): 39-46.
Summers, J. C. (2000). “RECYCLING IN HIGHWAY MAINTENANCE.” The Idiot’s guide to
highways maintenance. http://www.highwaysmaintenance.com/cycinsit.htm
Villanueva, A., S. Ho, et al. (2008). "Asphalt modification with used lubricating oil." Canadian Journal of Civil Engineering 35(2): 148-157.
Widyatmoko, I. (2008). "Mechanistic-empirical mixture design for hot mix asphalt pavement recycling."
Construction and Building Materials 22(2): 77-87.

17
APPENDIX
A
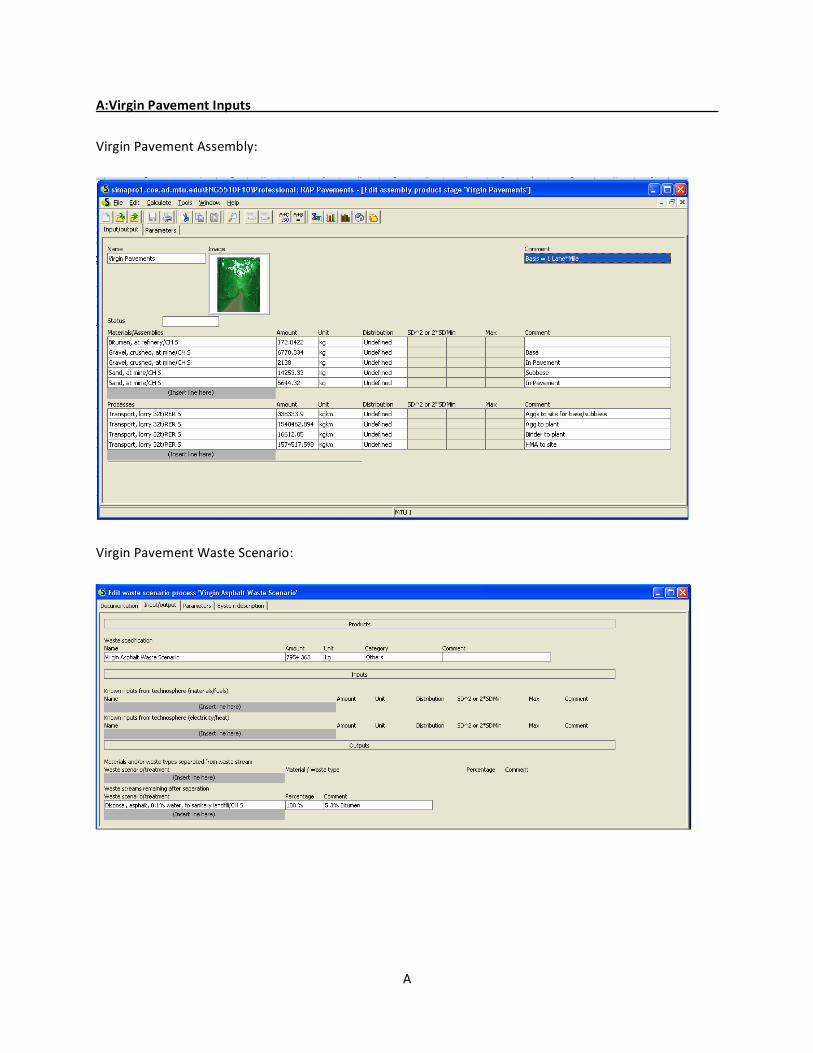
A:VirginPavementInputs
VirginPavementAssembly:
VirginPavementWasteScenario:
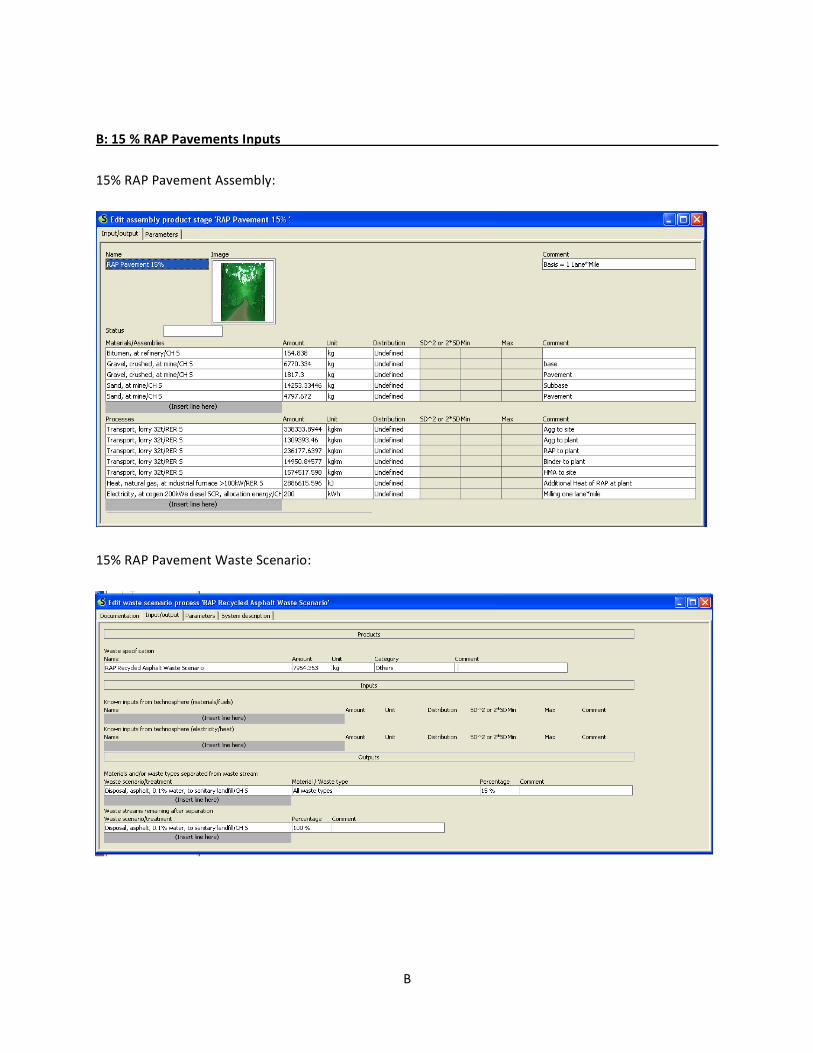
B
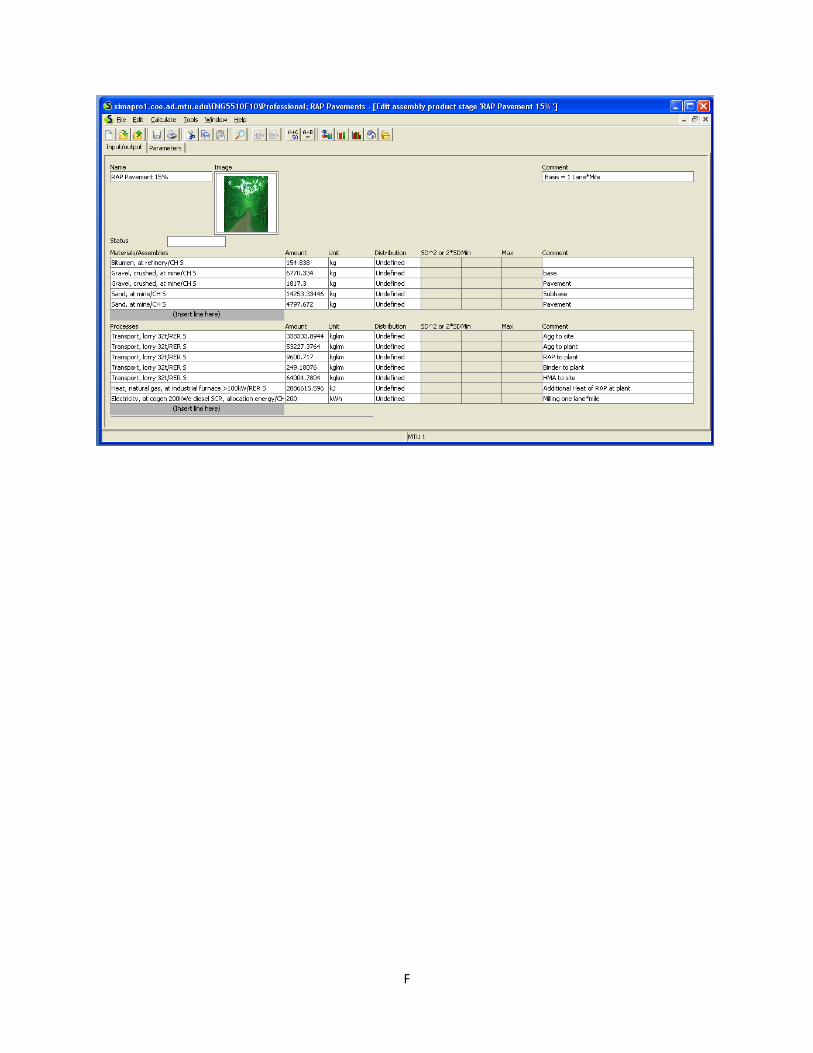
B:15%RAPPavementsInputs
15%RAPPavementAssembly:
15%RAPPavementWasteScenario:

C
C:SampleCalculations
Volumes:
Transportation:
HeatCalculations:
AcompletespreadsheetofcalculationsisavailableuponrequestfromAuthor.
D
D:InitialResults
VirginPavement
15%RAPPavement

E
E:UpdatedInventory
VirginPavementAssembly:
15%RAPPavementAssembly:
F
G
F:LoweredTransportationResults VirginPavements
15%RAPPavement