recent trends in securities class action litigation: 2016 ...€¦ · recent trends in securities...
TRANSCRIPT
Recent Trends in Securities Class Action Litigation: 2016 Full-Year Review Record Number of Cases Filed, Led By Growth in Merger Objections Highest Number of Dismissals in the Shortest Amount of Time
By Stefan Boettrich and Svetlana Starykh
January 2017

“I am excited to share NERA’s Recent Trends in Securities Class Action Litigation:
2016 Full-Year Review with you. This year’s edition continues work from past years
by members of NERA’s Securities and Finance Practice. In the 2016 edition, we
document a sharp increase in filings, led by a doubling of merger-objection filings.
While a discussion of that change features prominently in this edition, there are
also interesting developments in filings against foreign-domiciled firms and in the
magnitude of NERA-defined Investor Losses involved in cases filed in 2016. While
space limitations prevent us from showing all of the analyses that the authors have
undertaken to create this new edition of our series, we hope that you will contact
us if you want to learn more or just want to discuss our findings and analyses. On
behalf of NERA’s Securities and Finance Practice, I thank you for taking the time to
review our work and hope that you will find it informative.”
Dr. David Tabak, Managing Director
www.nera.com 1
Recent Trends in Securities Class Action Litigation: 2016 Full-Year Review Record Number of Cases Filed, Led By Growth in Merger Objections Highest Number of Dismissals in the Shortest Amount of Time
By Stefan Boettrich and Svetlana Starykh1
23 January 2017
Introduction and Summary2
The pace of securities class action filings was the highest since the aftermath of the 2000 dot-com
crash. Growth in filings was dominated by federal merger objections, which reached a record
high, and followed various state court decisions restricting “disclosure-only” settlements, the
most prominent being the 2016 Trulia decision in the Delaware Court of Chancery. Filings alleging
violations of Rule 10b-5, Section 11, or Section 12 grew for a record fourth straight year and
reached levels not seen since 2008.
NERA-defined Investor Losses, a proxy for filed case size, reached a record $468 billion in 2016,
44% of which arose from securities cases claiming damages due to regulatory violations. Of those,
several large securities cases stemmed from a US Department of Justice (DOJ) probe into alleged
price collusion in generic pharmaceuticals. Those cases contributed to a high concentration of
filings in the Health Technology and Services sector.
In 2016, a total of 262 securities class actions were resolved, but for the first time since passage
of the Private Securities Litigation Reform Act (PSLRA), more cases were dismissed than settled.
This is due to a record number of dismissals, at an especially fast pace post-filing, coupled with a
settlement rate that remains close to an all-time low. The average settlement amount grew 36%
in 2016, marking the second consecutive year of strong growth, partially driven by settlements in
two longstanding large cases: Household International and Merck.
2 www.nera.com
Trends in Filings
Number of Cases Filed
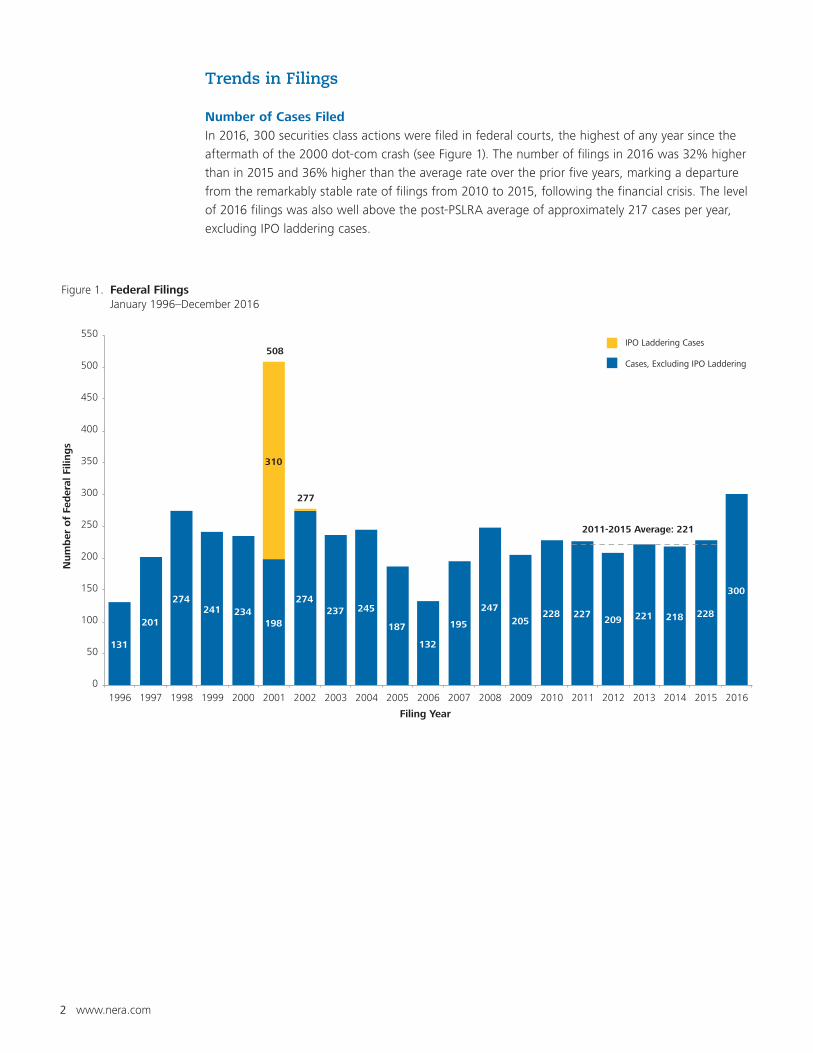
In 2016, 300 securities class actions were filed in federal courts, the highest of any year since the
aftermath of the 2000 dot-com crash (see Figure 1). The number of filings in 2016 was 32% higher
than in 2015 and 36% higher than the average rate over the prior five years, marking a departure
from the remarkably stable rate of filings from 2010 to 2015, following the financial crisis. The level
of 2016 filings was also well above the post-PSLRA average of approximately 217 cases per year,
excluding IPO laddering cases.
Figure 1. Federal Filings January 1996–December 2016
IPO Laddering Cases
Cases, Excluding IPO Laddering
131
201
274241 234
198
274237 245
187
132
195
247205
228 227209 221 218 228
300
310
508
277
0
50
100
150
200
250
300
350
400
450
500
550
1996 1997 1998 1999 2000 2001 2002 2003 2004 2005 2006 2007 2008 2009 2010 2011 2012 2013 2014 2015 2016
Num
ber
of
Fed
eral
Fili
ng
s
Filing Year
2011-2015 Average: 221
www.nera.com 3
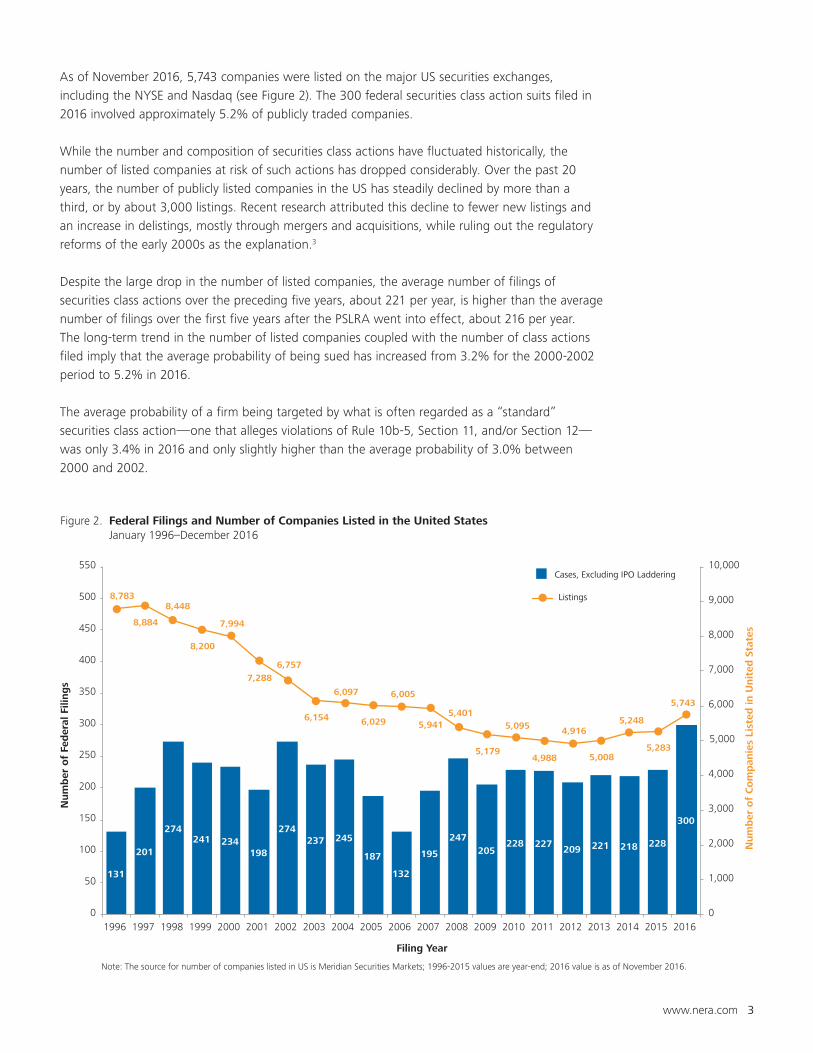
As of November 2016, 5,743 companies were listed on the major US securities exchanges,
including the NYSE and Nasdaq (see Figure 2). The 300 federal securities class action suits filed in
2016 involved approximately 5.2% of publicly traded companies.
While the number and composition of securities class actions have fluctuated historically, the
number of listed companies at risk of such actions has dropped considerably. Over the past 20
years, the number of publicly listed companies in the US has steadily declined by more than a
third, or by about 3,000 listings. Recent research attributed this decline to fewer new listings and
an increase in delistings, mostly through mergers and acquisitions, while ruling out the regulatory
reforms of the early 2000s as the explanation.3
Despite the large drop in the number of listed companies, the average number of filings of
securities class actions over the preceding five years, about 221 per year, is higher than the average
number of filings over the first five years after the PSLRA went into effect, about 216 per year.
The long-term trend in the number of listed companies coupled with the number of class actions
filed imply that the average probability of being sued has increased from 3.2% for the 2000-2002
period to 5.2% in 2016.
The average probability of a firm being targeted by what is often regarded as a “standard”
securities class action—one that alleges violations of Rule 10b-5, Section 11, and/or Section 12—
was only 3.4% in 2016 and only slightly higher than the average probability of 3.0% between
2000 and 2002.
Figure 2. Federal Filings and Number of Companies Listed in the United States January 1996–December 2016
Cases, Excluding IPO Laddering
Listings
131
201
274241 234
198
274237 245
187
132
195
247205
228 227209 221 218 228
300
8,783
8,884
8,448
8,200
7,994
7,288
6,757
6,154
6,097
6,029
6,005
5,9415,401
5,179
5,095
4,988
4,916
5,008
5,248
5,283
5,743
0
1,000
2,000
3,000
4,000
5,000
6,000
7,000
8,000
9,000
10,000
0
50
100
150
200
250
300
350
400
450
500
550
1996 1997 1998 1999 2000 2001 2002 2003 2004 2005 2006 2007 2008 2009 2010 2011 2012 2013 2014 2015 2016
Num
ber
of
Co
mp
anie
s Li
sted
in U
nit
ed S
tate
s
Num
ber
of
Fed
eral
Fili
ng
s
Filing Year
Note: The source for number of companies listed in US is Meridian Securities Markets; 1996-2015 values are year-end; 2016 value is as of November 2016.
4 www.nera.com
Filings by Type
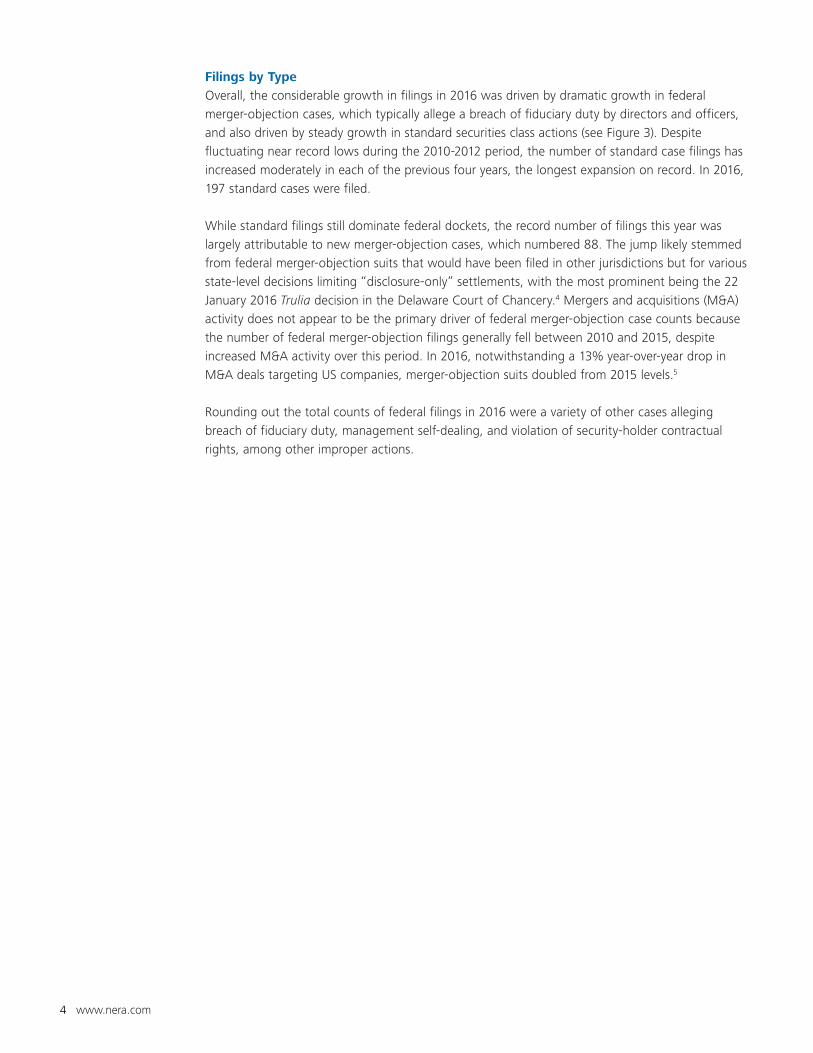
Overall, the considerable growth in filings in 2016 was driven by dramatic growth in federal
merger-objection cases, which typically allege a breach of fiduciary duty by directors and officers,
and also driven by steady growth in standard securities class actions (see Figure 3). Despite
fluctuating near record lows during the 2010-2012 period, the number of standard case filings has
increased moderately in each of the previous four years, the longest expansion on record. In 2016,
197 standard cases were filed.
While standard filings still dominate federal dockets, the record number of filings this year was
largely attributable to new merger-objection cases, which numbered 88. The jump likely stemmed
from federal merger-objection suits that would have been filed in other jurisdictions but for various
state-level decisions limiting “disclosure-only” settlements, with the most prominent being the 22
January 2016 Trulia decision in the Delaware Court of Chancery.4 Mergers and acquisitions (M&A)
activity does not appear to be the primary driver of federal merger-objection case counts because
the number of federal merger-objection filings generally fell between 2010 and 2015, despite
increased M&A activity over this period. In 2016, notwithstanding a 13% year-over-year drop in
M&A deals targeting US companies, merger-objection suits doubled from 2015 levels.5
Rounding out the total counts of federal filings in 2016 were a variety of other cases alleging
breach of fiduciary duty, management self-dealing, and violation of security-holder contractual
rights, among other improper actions.
www.nera.com 5
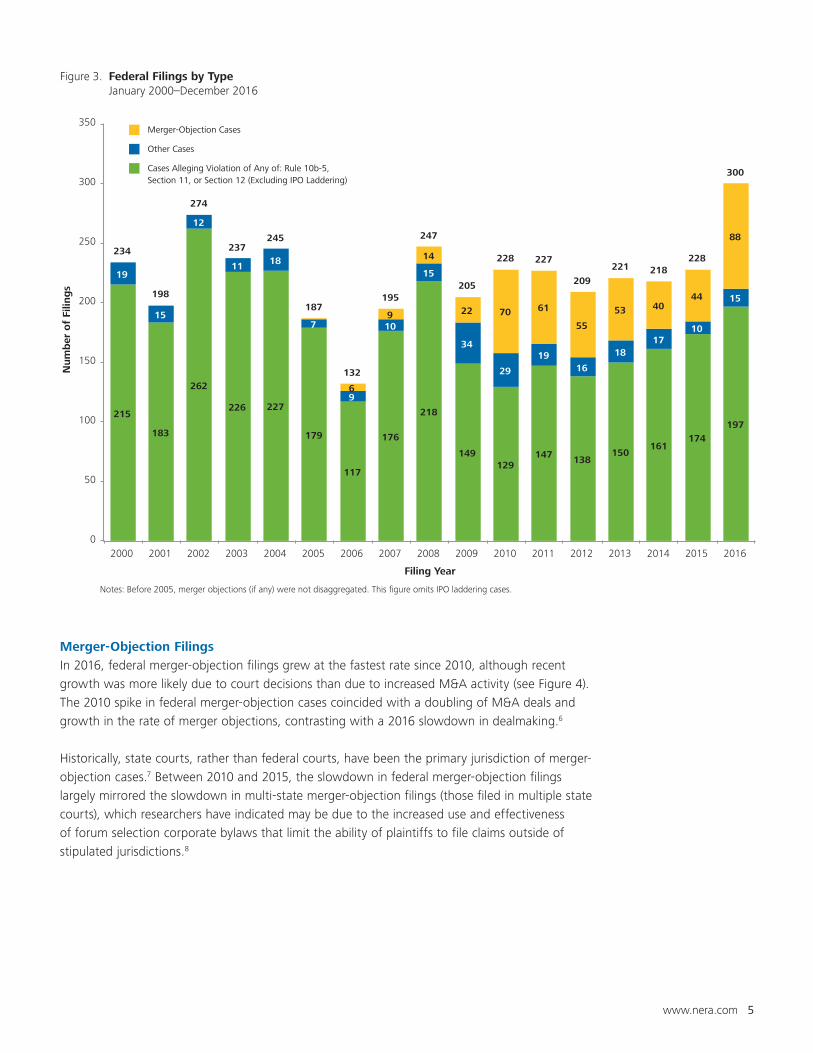
Merger-Objection Filings
In 2016, federal merger-objection filings grew at the fastest rate since 2010, although recent
growth was more likely due to court decisions than due to increased M&A activity (see Figure 4).
The 2010 spike in federal merger-objection cases coincided with a doubling of M&A deals and
growth in the rate of merger objections, contrasting with a 2016 slowdown in dealmaking.6
Historically, state courts, rather than federal courts, have been the primary jurisdiction of merger-
objection cases.7 Between 2010 and 2015, the slowdown in federal merger-objection filings
largely mirrored the slowdown in multi-state merger-objection filings (those filed in multiple state
courts), which researchers have indicated may be due to the increased use and effectiveness
of forum selection corporate bylaws that limit the ability of plaintiffs to file claims outside of
stipulated jurisdictions.8
Figure 3. Federal Filings by Type January 2000–December 2016
Merger-Objection Cases
Other Cases
Cases Alleging Violation of Any of: Rule 10b-5,Section 11, or Section 12 (Excluding IPO Laddering)
215
183
262
226 227
179
117
176
218
149129
147 138150
161174
197
19
15
12
11 18
7
9
10
15
34
29
1916
1817
10
15
6
9
14
22 70 61
55
53 4044
88
234
198
274
237245
187
132
195
247
205
228 227
209
221 218228
300
0
50
100
150
200
250
300
350
2000 2001 2002 2003 2004 2005 2006 2007 2008 2009 2010 2011 2012 2013 2014 2015 2016
Num
ber
of
Filin
gs
Filing Year
Notes: Before 2005, merger objections (if any) were not disaggregated. This figure omits IPO laddering cases.
6 www.nera.com
The increased adoption of forum selection bylaws coincided with various state court decisions in
2015 and 2016, particularly those against “disclosure-only” settlements, the most prominent being
the 22 January 2016 Trulia decision in the Delaware Court of Chancery.9 Delaware attracted about
half of eligible merger-objection cases prior to the Trulia decision, and researchers have suggested
that, as a result of the decision, there may be a trend toward litigating merger objections in courts
outside of Delaware.10 While the full extent of such a shift remains to be seen, early signs of a
contemporaneous slowdown in merger-objection filings in Delaware and a spike in federal merger-
objection filings support such a conjecture.11
Whether any apparent shift in merger-objection suits out of Delaware continues will likely
depend on the extent to which other jurisdictions adopt the Delaware Court of Chancery’s lead
on disclosure-only settlement disapproval, as well as on the rate of corporate adoption of forum
selection bylaws.12 In 2015, multiple opinions in New York Superior Court rejected disclosure-only
settlements, and in 2016, the Seventh Circuit also ruled against a disclosure-only settlement in the
case, In re: Walgreen Co. Stockholder Litigation.13
Figure 4. Federal Merger-Objection Cases and Merger-Objection Cases with Multi-State Claims January 2009–December 2016
Federal Merger-Objection Cases
Merger-Objection Cases with Multi-State Claims
22
7061
55 53
40
44
88
26
61 6260
46 47
15
0
10
20
30
40
50
60
70
80
90
100
2009 2010 2011 2012 2013 2014 2015 2016
Num
ber
of
Filin
gs
Filing Year
Note: Counts of merger-objection cases with multi-state claims are calculated based on data obtained from M. D. Cain and S. D. Solomon, "Takeover Litigation in 2015," Berkeley Center for Law Business and the Economy, 14 January 2016.
www.nera.com 7
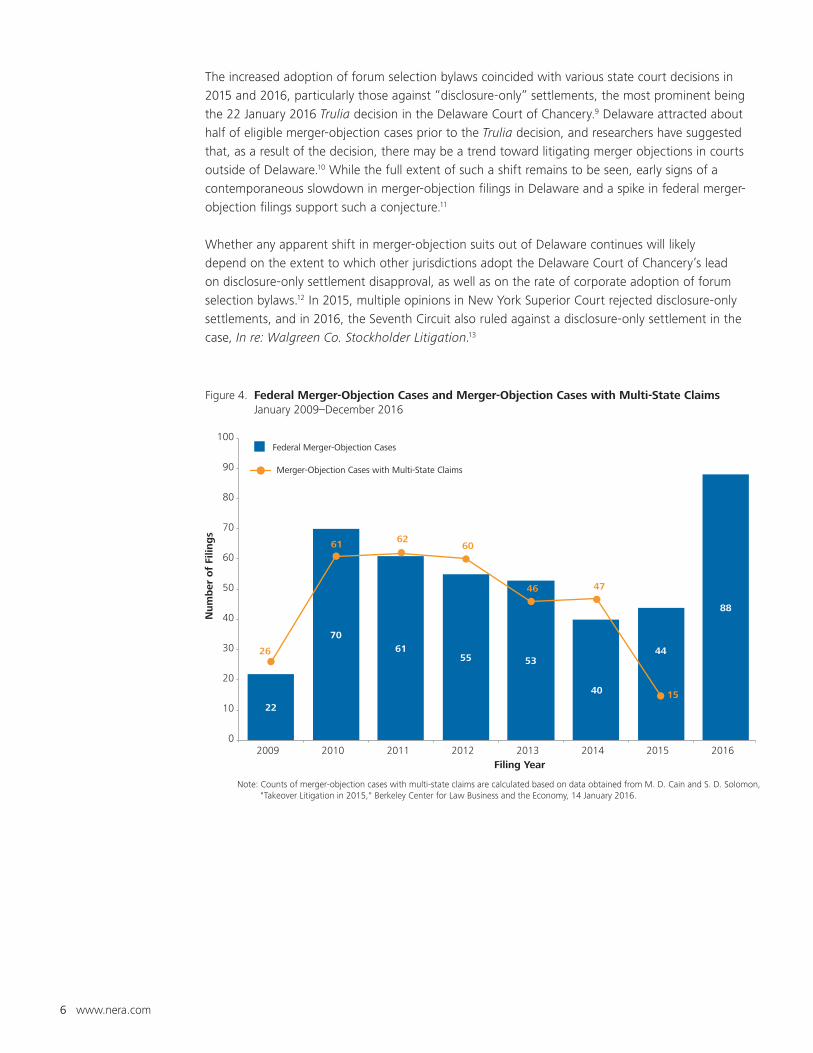
Filings by Issuers’ Country of Domicile
In 2011, mostly due to a surge in filings against companies domiciled (or with principal offices) in
China, a record 23.9% of cases were filed against foreign issuers (see Figure 5). That year marked
the only recent period in which foreign domiciled companies were disproportionally targeted by
securities class actions; in other years, the proportion of class actions against foreign-domiciled
companies was less than the proportion of foreign listings.
While the proportion of filings against foreign issuers remained above historic levels for a few years
following the wave of Chinese cases, the foreign issuer filing rate in 2016 dropped well below
levels seen since at least before 2008. This is partially explained by a decline in the percent of
overall US listings represented by foreign-domiciled companies. The decline also coincides with a
50% increase in the proportion of filings involving merger-objection claims, which less frequently
target non-US companies.14
The drop in filings against Chinese-domiciled companies in 2016 was especially pronounced,
with the fewest filings against such companies since 2009. This may be due to a record number
of Chinese companies delisting in the United States and relisting their shares in Chinese markets,
“hoping to benefit from higher valuations” there.15 In addition to reducing the overall count of
listed Chinese companies in the United States, the relisting mechanism is more likely to be taken
advantage of by firms with relatively weaker accounting or disclosure practices.
Figure 5. Foreign-Domiciled Companies: Share of Filings and Share of All Companies Listed in United States January 2008–December 2016
12.1%10.7%
12.3%
23.9%
13.6% 13.9% 13.6%
14.4%
8.5%
15.7% 15.0%15.9% 16.4% 16.6% 16.5% 16.7% 17.1%
13.4%
0%
5%
10%
15%
20%
25%
30%
2008 2009 2010 2011 2012 2013 2014 2015 2016
Per
centa
ge
Filing Year
% of US Filings against Foreign Companies
% of US Listings Represented by Foreign-Domiciled Companies
8 www.nera.com
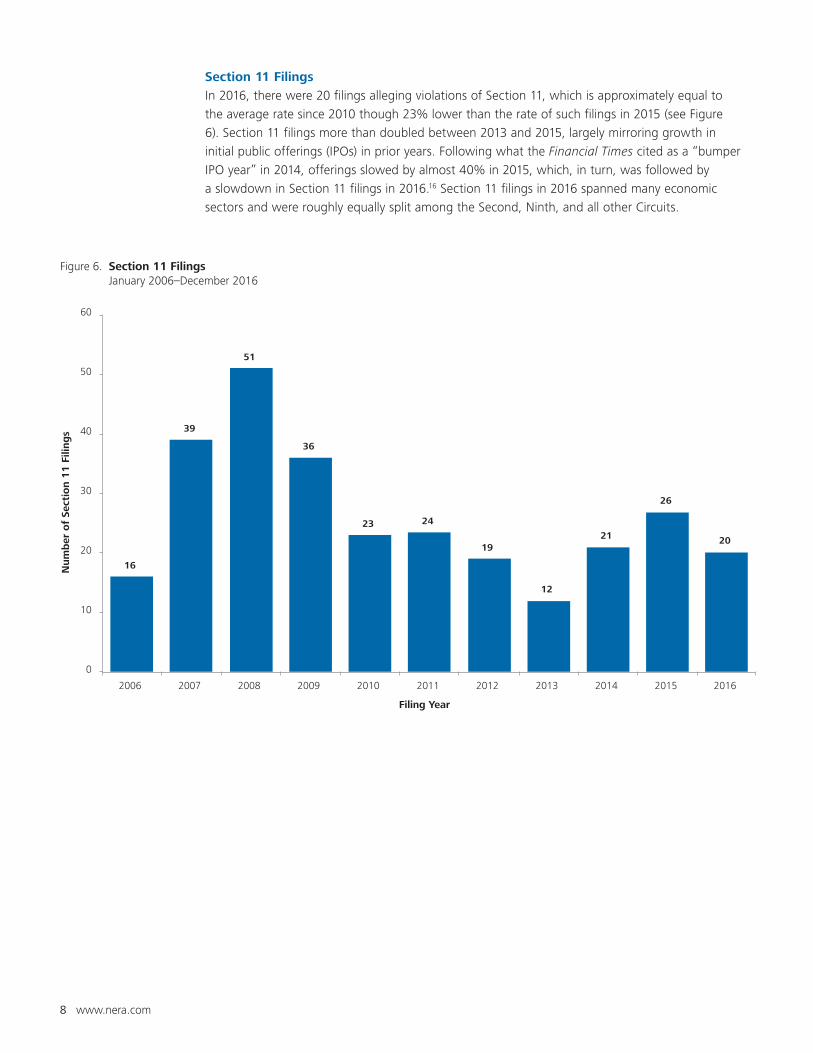
Section 11 Filings
In 2016, there were 20 filings alleging violations of Section 11, which is approximately equal to
the average rate since 2010 though 23% lower than the rate of such filings in 2015 (see Figure
6). Section 11 filings more than doubled between 2013 and 2015, largely mirroring growth in
initial public offerings (IPOs) in prior years. Following what the Financial Times cited as a “bumper
IPO year” in 2014, offerings slowed by almost 40% in 2015, which, in turn, was followed by
a slowdown in Section 11 filings in 2016.16 Section 11 filings in 2016 spanned many economic
sectors and were roughly equally split among the Second, Ninth, and all other Circuits.
Figure 6. Section 11 Filings January 2006–December 2016
16
39
51
36
23 24
19
12
21
26
0
10
20
30
40
50
60
2006 2007 2008 2009 2010 2011 2012 2013 2014 2015
20
2016
Num
ber
of
Sect
ion 1
1 F
iling
s
Filing Year
www.nera.com 9
Aggregate NERA-Defined Investor Losses
In addition to the number of cases filed, we also consider the total potential size of these cases
using a metric we label “NERA-defined Investor Losses.”
NERA’s Investor Losses variable is a proxy for the aggregate amount that investors lost
from buying the defendant’s stock, rather than investing in the broader market during the
alleged class period. Note that the NERA-defined Investor Losses variable is not a measure
of damages because any stock that underperforms the S&P 500 would have Investor
Losses over the period of underperformance; rather, it is a rough proxy for the relative size
of investors’ potential claims. Historically, Investor Losses have been a powerful predictor
of settlement size. Investor Losses can explain more than half of the variance in the
settlement values in our database.
We do not compute NERA-defined Investor Losses for all cases included in this
publication. For instance, class actions in which only bonds and not common stock are
alleged to have been damaged are not included. The largest excluded groups are IPO
laddering cases and merger-objection cases. Some previous NERA reports on securities
class actions did not include Investor Losses for cases with only Section 11 allegations, but
such cases are included here.17
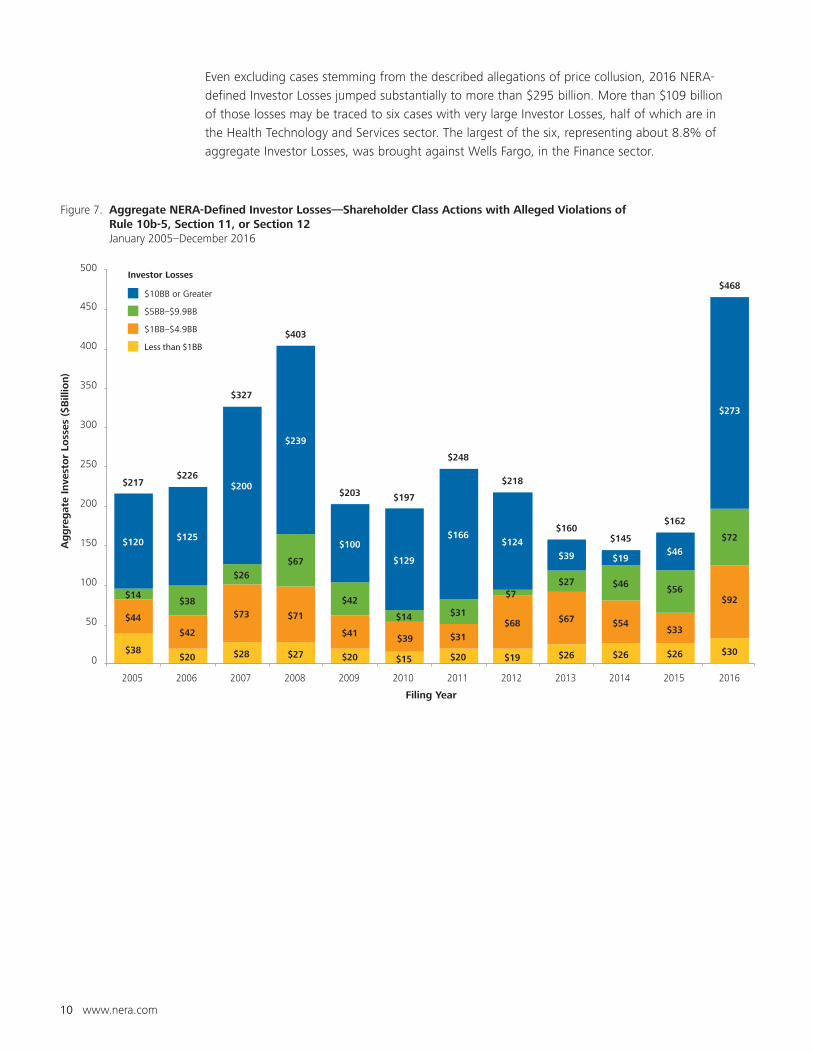
For each year since 2005, we calculate NERA-defined Investor Losses at the time of filing for each
case for which losses can be computed. Yearly Investor Losses are grouped by magnitude and
aggregated, as shown in Figure 7.
In 2016, aggregate NERA-defined Investor Losses jumped to a record $468 billion, more than 2.75
times the 2015 rate and exceeded the level of losses in 2008, at the height on the financial crisis.
While Investor Losses in each stratum increased from 2015, the 2016 level of losses was driven to
a record due to a dramatic increase in (and record amount of) losses attributable to cases with
very large Investor Losses (over $10 billion, shown in dark green in Figure 7).18 This year marked the
first time since 2012 during which Investor Losses stemming from large cases made up most of the
total loss for the year.
Claims related to regulatory violations (i.e., those alleging a failure to disclose a regulatory issue)
made up a record 44% of NERA-defined Investor Losses in 2016, totaling about $220 billion.
Much of this loss stemmed from price collusion cases spanning the pharmaceutical and poultry
industries. Several pharmaceutical companies were caught up in a long-running DOJ probe into
alleged generic drug price collusion.19 In September 2016, a leading poultry distributor sued several
poultry producers, alleging price fixing of broiler chickens.20 Our data includes nine securities
class actions related to such investigations in the pharmaceutical industry and four securities class
actions related to such investigations in the poultry industry. These account for more than $173
billion in Investor Losses, or about 57% of the growth from 2015 levels. Securities class actions
stemming from these investigations also make up more than a third of 2016 aggregate Investor
Losses and 60% of losses in the high Investor Losses category.
10 www.nera.com
Even excluding cases stemming from the described allegations of price collusion, 2016 NERA-
defined Investor Losses jumped substantially to more than $295 billion. More than $109 billion
of those losses may be traced to six cases with very large Investor Losses, half of which are in
the Health Technology and Services sector. The largest of the six, representing about 8.8% of
aggregate Investor Losses, was brought against Wells Fargo, in the Finance sector.
Figure 7. Aggregate NERA-Defined Investor Losses—Shareholder Class Actions with Alleged Violations of Rule 10b-5, Section 11, or Section 12 January 2005–December 2016
Investor Losses
$10BB or Greater
$5BB–$9.9BB
$1BB–$4.9BB
Less than $1BB
$38$20 $28 $27 $20 $15 $20 $19 $26 $26 $26
$44
$42
$73 $71
$41 $39 $31
$68
$7
$67 $54$33
$14$38
$26
$67
$42
$14 $31
$27 $46$56
$120 $125
$200
$239
$100
$129
$166$124
$39 $19$46
$217$226
$327
$403
$30
$92
$72
$273
$468
$203 $197
$248
$218
$160$145
$162
50
0
100
150
200
250
300
350
400
450
500
2005 2006 2007 2008 2009 2010 2011 2012 2013 2014 2015 2016
Ag
gre
gat
e In
vest
or
Loss
es (
$B
illio
n)
Filing Year
www.nera.com 11
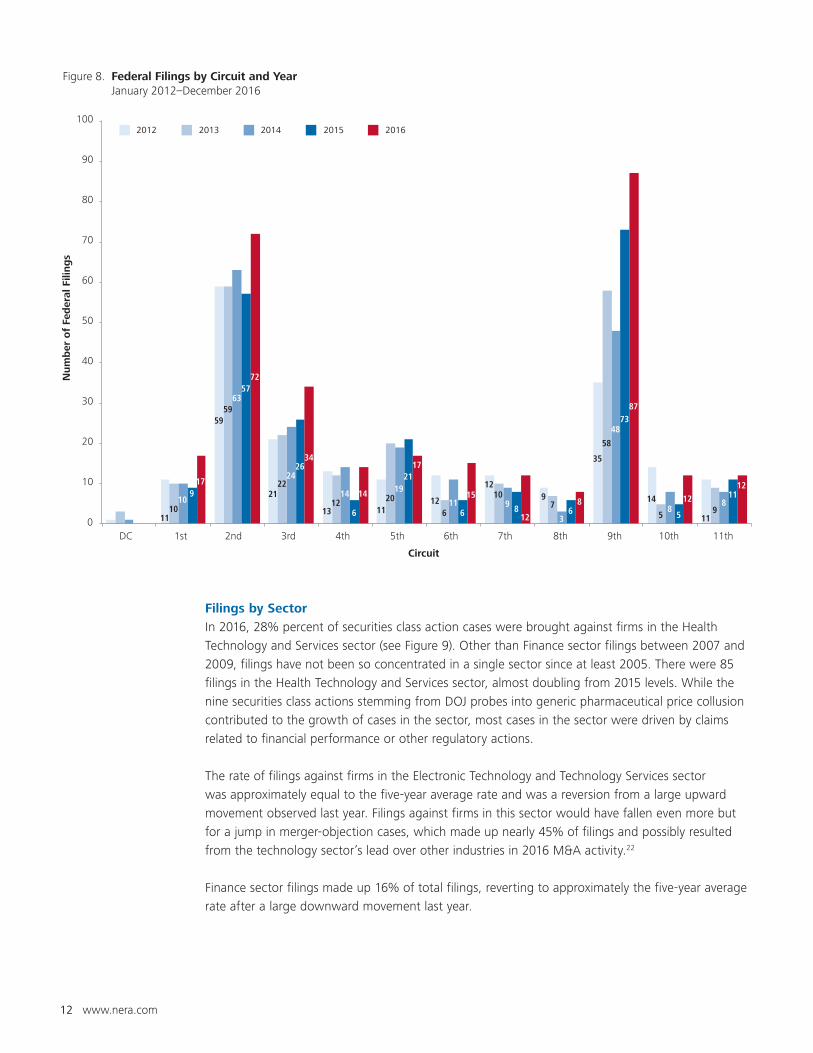
Filings by Circuit
Filings continued to be concentrated in the Second and Ninth Circuits, where more cases were
filed than in all other circuits combined (see Figure 8).
In the Ninth Circuit, the number of filings grew nearly 20%, to 87. Filings of merger-objection
cases were a major growth factor, tripling to 27. Filings alleging violations of Rule 10b-5, Section
11, and/or Section 12, fell 11% to 55. Of these, seven cases alleged violations of Section 11, down
marginally from 2015 but remaining near a five-year high and constituting about a third of all
Section 11 cases.
Filings in the Second Circuit have grown over the past five years and reached an all-time high of
72 in 2016. As in 2015, the Second Circuit accepted disproportionately fewer merger-objection
cases in 2016—while about a quarter of all securities class actions were filed in that Circuit, only
about nine percent of merger-objection cases were filed there. Merger-objection suits may be less
common in the Second Circuit, as multiple 2015 opinions in New York Superior Court rejected
disclosure-only settlements either as “relatively worthless settlements” or discounted them as
“merger tax suits.”21
Filings of “standard” securities class actions in the Second Circuit made up the difference; despite
lagging behind the overall filing load of Ninth Circuit, six more standard cases were filed in the
Second Circuit than in the Ninth Circuit.
Recent steady growth in filings in the Third Circuit, which includes Delaware, continued in 2016.
Third Circuit filings reached 34, up from 21 in 2012. As in the Ninth Circuit, growth of merger-
objection cases was a factor. The number of such cases increased by nearly 43% in 2016,
representing a bit less than a third of all filings in the Circuit. In the Fifth Circuit, 17 securities class
actions were filed, the fewest in four years, and standard cases outnumbered merger objections
by two-thirds.
12 www.nera.com
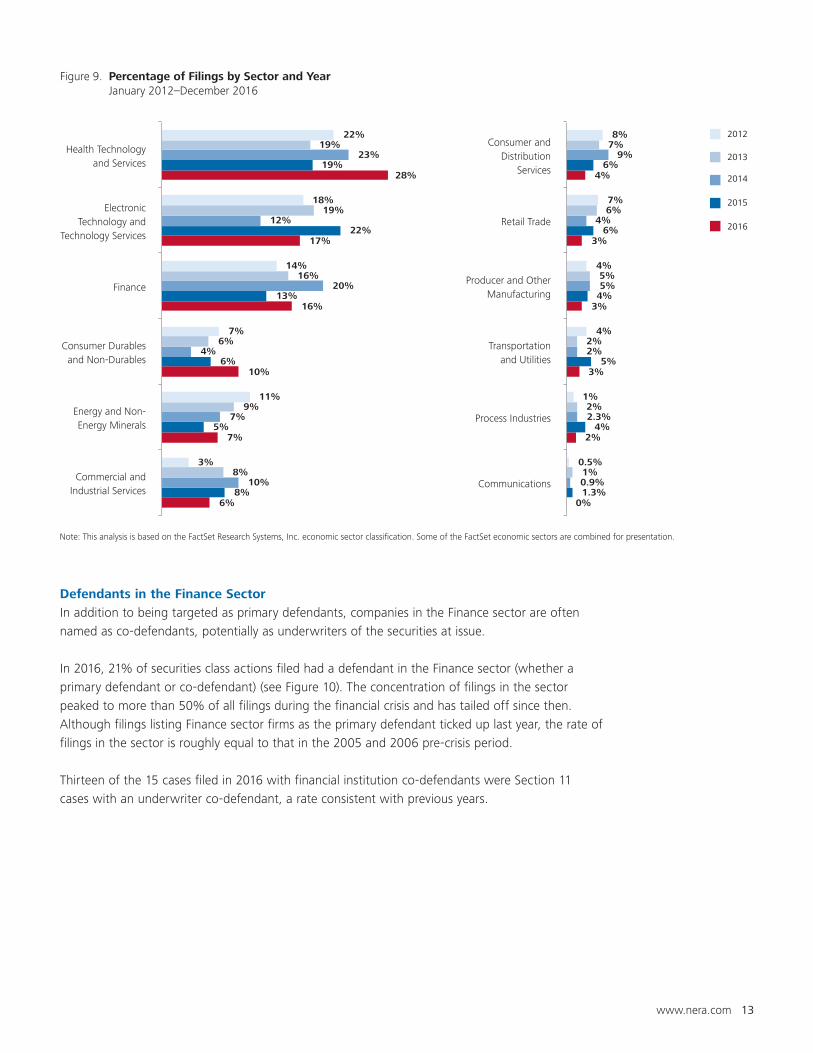
Filings by Sector
In 2016, 28% percent of securities class action cases were brought against firms in the Health
Technology and Services sector (see Figure 9). Other than Finance sector filings between 2007 and
2009, filings have not been so concentrated in a single sector since at least 2005. There were 85
filings in the Health Technology and Services sector, almost doubling from 2015 levels. While the
nine securities class actions stemming from DOJ probes into generic pharmaceutical price collusion
contributed to the growth of cases in the sector, most cases in the sector were driven by claims
related to financial performance or other regulatory actions.
The rate of filings against firms in the Electronic Technology and Technology Services sector
was approximately equal to the five-year average rate and was a reversion from a large upward
movement observed last year. Filings against firms in this sector would have fallen even more but
for a jump in merger-objection cases, which made up nearly 45% of filings and possibly resulted
from the technology sector’s lead over other industries in 2016 M&A activity.22
Finance sector filings made up 16% of total filings, reverting to approximately the five-year average
rate after a large downward movement last year.
Figure 8. Federal Filings by Circuit and Year January 2012–December 2016
20162015201420132012
11
59
21
13 1112
129
35
14
1110
59
22
12 20
6
107
58
5 910
63
24
14 19
11 9
3
48
88
9
57
26
6
21
6 8 6
73
5
11
17
72
34
14
17
15
12
8
87
12
12
DC 1st 2nd 3rd 4th 5th 6th 7th 8th 9th 10th 11th0
10
20
30
40
50
60
70
80
90
100
Num
ber
of
Fed
eral
Fili
ng
s
Circuit
www.nera.com 13
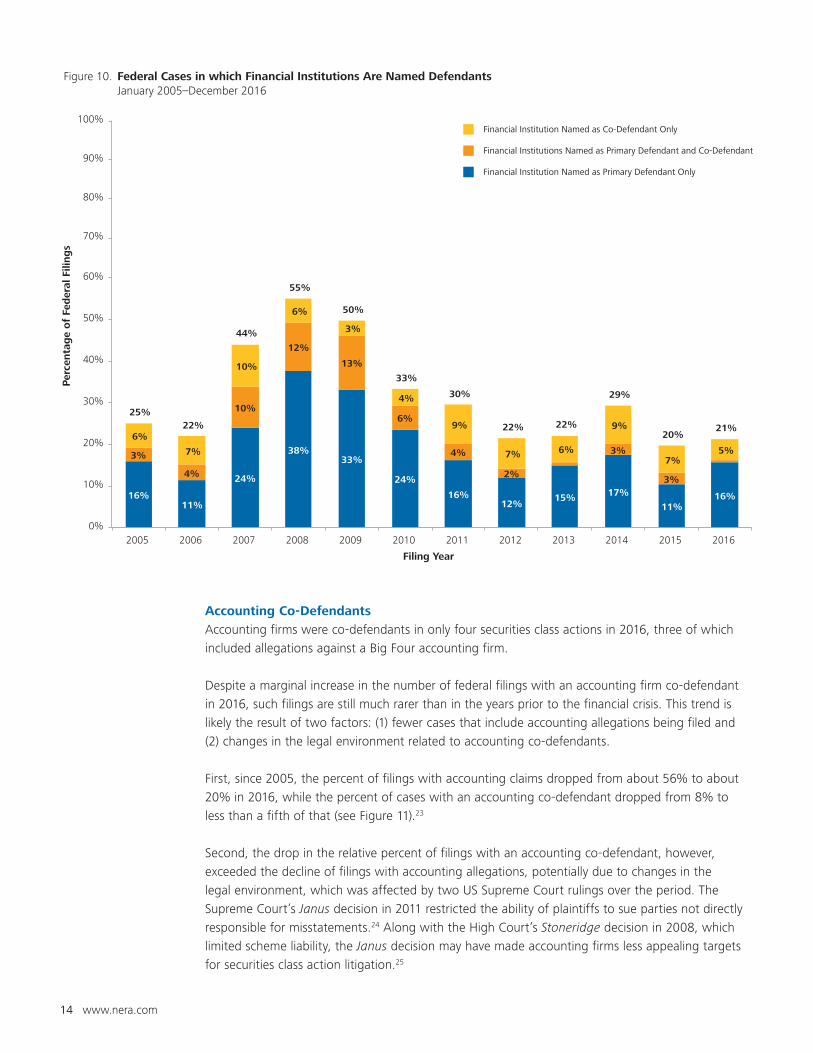
Defendants in the Finance Sector
In addition to being targeted as primary defendants, companies in the Finance sector are often
named as co-defendants, potentially as underwriters of the securities at issue.
In 2016, 21% of securities class actions filed had a defendant in the Finance sector (whether a
primary defendant or co-defendant) (see Figure 10). The concentration of filings in the sector
peaked to more than 50% of all filings during the financial crisis and has tailed off since then.
Although filings listing Finance sector firms as the primary defendant ticked up last year, the rate of
filings in the sector is roughly equal to that in the 2005 and 2006 pre-crisis period.
Thirteen of the 15 cases filed in 2016 with financial institution co-defendants were Section 11
cases with an underwriter co-defendant, a rate consistent with previous years.
Figure 9. Percentage of Filings by Sector and Year January 2012–December 2016
2016
2015
2014
2013
2012
0%
2%
3%
3%
3%
4%
1.3%
4%
5%
4%
6%
6%
0.9%
2.3%
2%
5%
4%
9%
1%
2%
2%
5%
6%
7%
0.5%
1%
4%
4%
7%
8%
Communications
Process Industries
Transportationand Utilities
Producer and OtherManufacturing
Retail Trade
Consumer andDistribution
Services
6%
7%
10%
16%
17%
28%
8%
5%
6%
13%
22%
19%
10%
7%
4%
20%
12%
23%
8%
9%
6%
16%
19%
19%
3%
11%
7%
14%
18%
22%
Commercial andIndustrial Services
Energy and Non-Energy Minerals
Consumer Durablesand Non-Durables
Finance
ElectronicTechnology and
Technology Services
Health Technologyand Services
Note: This analysis is based on the FactSet Research Systems, Inc. economic sector classification. Some of the FactSet economic sectors are combined for presentation.
14 www.nera.com
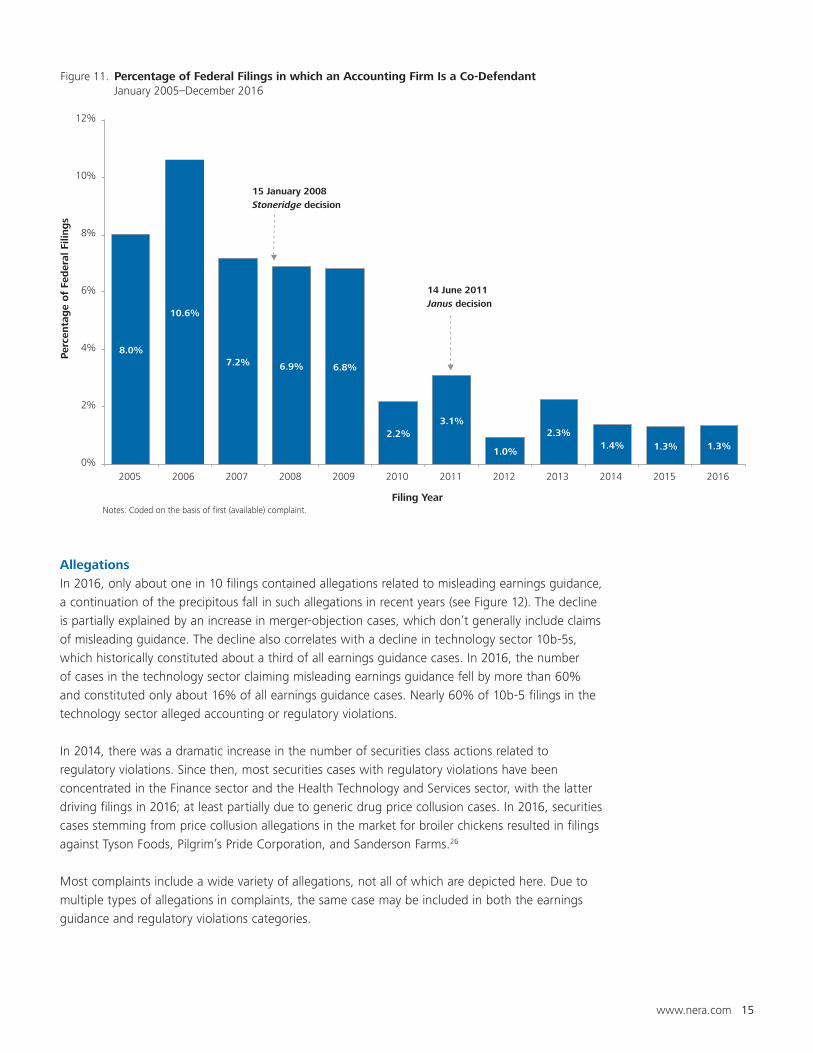
Accounting Co-Defendants
Accounting firms were co-defendants in only four securities class actions in 2016, three of which
included allegations against a Big Four accounting firm.
Despite a marginal increase in the number of federal filings with an accounting firm co-defendant
in 2016, such filings are still much rarer than in the years prior to the financial crisis. This trend is
likely the result of two factors: (1) fewer cases that include accounting allegations being filed and
(2) changes in the legal environment related to accounting co-defendants.
First, since 2005, the percent of filings with accounting claims dropped from about 56% to about
20% in 2016, while the percent of cases with an accounting co-defendant dropped from 8% to
less than a fifth of that (see Figure 11).23
Second, the drop in the relative percent of filings with an accounting co-defendant, however,
exceeded the decline of filings with accounting allegations, potentially due to changes in the
legal environment, which was affected by two US Supreme Court rulings over the period. The
Supreme Court’s Janus decision in 2011 restricted the ability of plaintiffs to sue parties not directly
responsible for misstatements.24 Along with the High Court’s Stoneridge decision in 2008, which
limited scheme liability, the Janus decision may have made accounting firms less appealing targets
for securities class action litigation.25
Figure 10. Federal Cases in which Financial Institutions Are Named Defendants January 2005–December 2016
Financial Institution Named as Co-Defendant Only
Financial Institutions Named as Primary Defendant and Co-Defendant
Financial Institution Named as Primary Defendant Only
16%11%
24%
38%33%
24%
16%12%
15% 17%
11%16%
3%
4%
10%
12%
13%
6%
4%
2%
3%
3%
6%
7%
10%
6%
3%
4%
9%
7% 6%
9%
7%5%
25%22%
44%
55%
50%
33%
30%
22% 22%
29%
20%21%
0%
10%
20%
30%
40%
50%
60%
70%
80%
90%
100%
2005 2006 2007 2008 2009 2010 2011 2012 2013 2014 2015 2016
Per
centa
ge
of
Fed
eral
Fili
ng
s
Filing Year
www.nera.com 15
Allegations
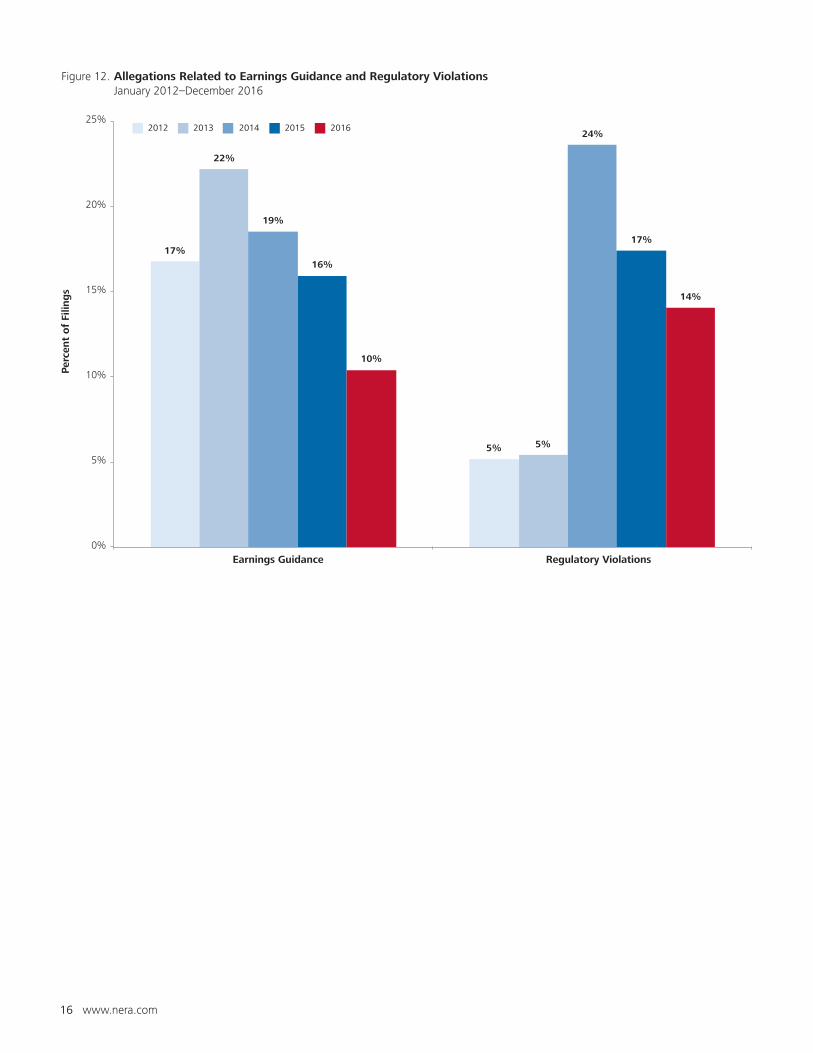
In 2016, only about one in 10 filings contained allegations related to misleading earnings guidance,
a continuation of the precipitous fall in such allegations in recent years (see Figure 12). The decline
is partially explained by an increase in merger-objection cases, which don’t generally include claims
of misleading guidance. The decline also correlates with a decline in technology sector 10b-5s,
which historically constituted about a third of all earnings guidance cases. In 2016, the number
of cases in the technology sector claiming misleading earnings guidance fell by more than 60%
and constituted only about 16% of all earnings guidance cases. Nearly 60% of 10b-5 filings in the
technology sector alleged accounting or regulatory violations.
In 2014, there was a dramatic increase in the number of securities class actions related to
regulatory violations. Since then, most securities cases with regulatory violations have been
concentrated in the Finance sector and the Health Technology and Services sector, with the latter
driving filings in 2016; at least partially due to generic drug price collusion cases. In 2016, securities
cases stemming from price collusion allegations in the market for broiler chickens resulted in filings
against Tyson Foods, Pilgrim’s Pride Corporation, and Sanderson Farms.26
Most complaints include a wide variety of allegations, not all of which are depicted here. Due to
multiple types of allegations in complaints, the same case may be included in both the earnings
guidance and regulatory violations categories.
Figure 11. Percentage of Federal Filings in which an Accounting Firm Is a Co-Defendant January 2005–December 2016
14 June 2011 Janus decision
15 January 2008 Stoneridge decision
8.0%
10.6%
7.2% 6.9% 6.8%
2.2%3.1%
1.0%
2.3%1.4% 1.3% 1.3%
0%
2%
4%
6%
8%
10%
12%
2005 2006 2007 2008 2009 2010 2011 2012 2013 2014 2015 2016
Per
centa
ge
of
Fed
eral
Fili
ng
s
Filing Year Notes: Coded on the basis of first (available) complaint.
16 www.nera.com
Figure 12. Allegations Related to Earnings Guidance and Regulatory Violations January 2012–December 2016
2012 2013 2014 2015 2016
17%
5%
22%
5%
19%
24%
16%
17%
10%
14%
0%
5%
10%
15%
20%
25%
Earnings Guidance Regulatory Violations
Per
cent
of
Filin
gs
www.nera.com 17
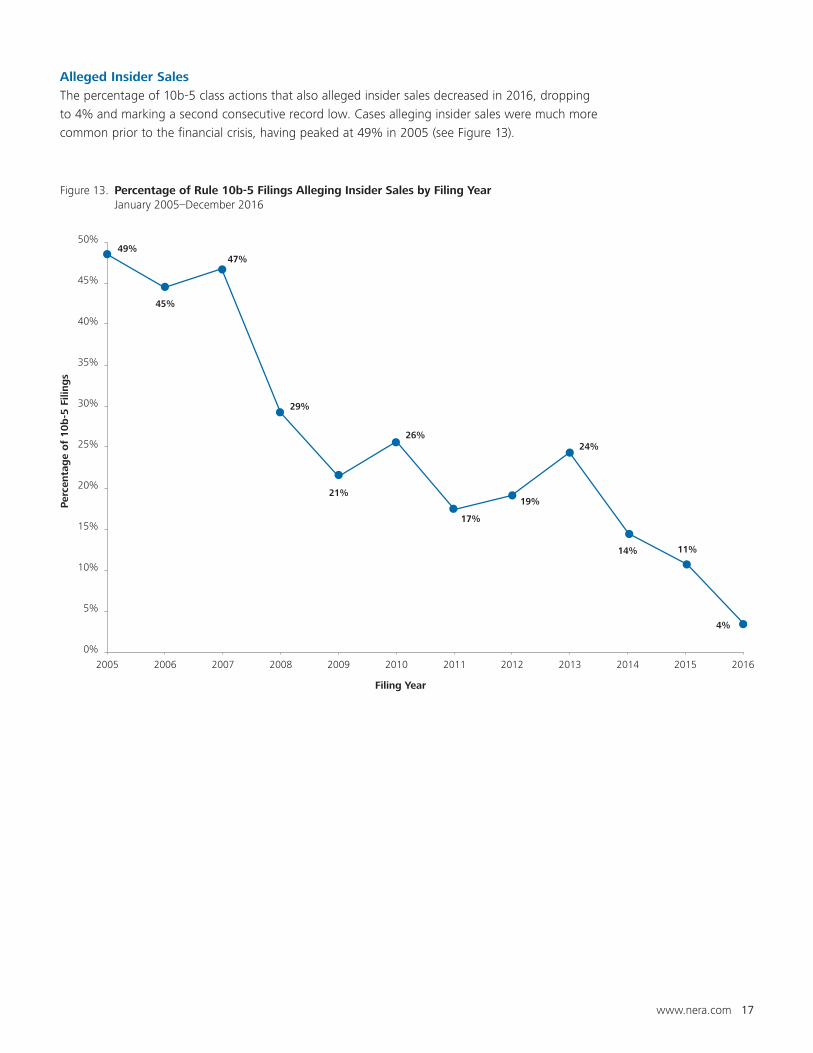
Alleged Insider Sales
The percentage of 10b-5 class actions that also alleged insider sales decreased in 2016, dropping
to 4% and marking a second consecutive record low. Cases alleging insider sales were much more
common prior to the financial crisis, having peaked at 49% in 2005 (see Figure 13).
Figure 13. Percentage of Rule 10b-5 Filings Alleging Insider Sales by Filing Year January 2005–December 2016
49%
45%
47%
29%
21%
26%
17%
19%
24%
14% 11%
4%
0%
5%
10%
15%
20%
25%
30%
35%
40%
45%
50%
2005 2006 2007 2008 2009 2010 2011 2012 2013 2014 2015 2016
Per
centa
ge
of
10
b-5
Fili
ng
s
Filing Year
18 www.nera.com
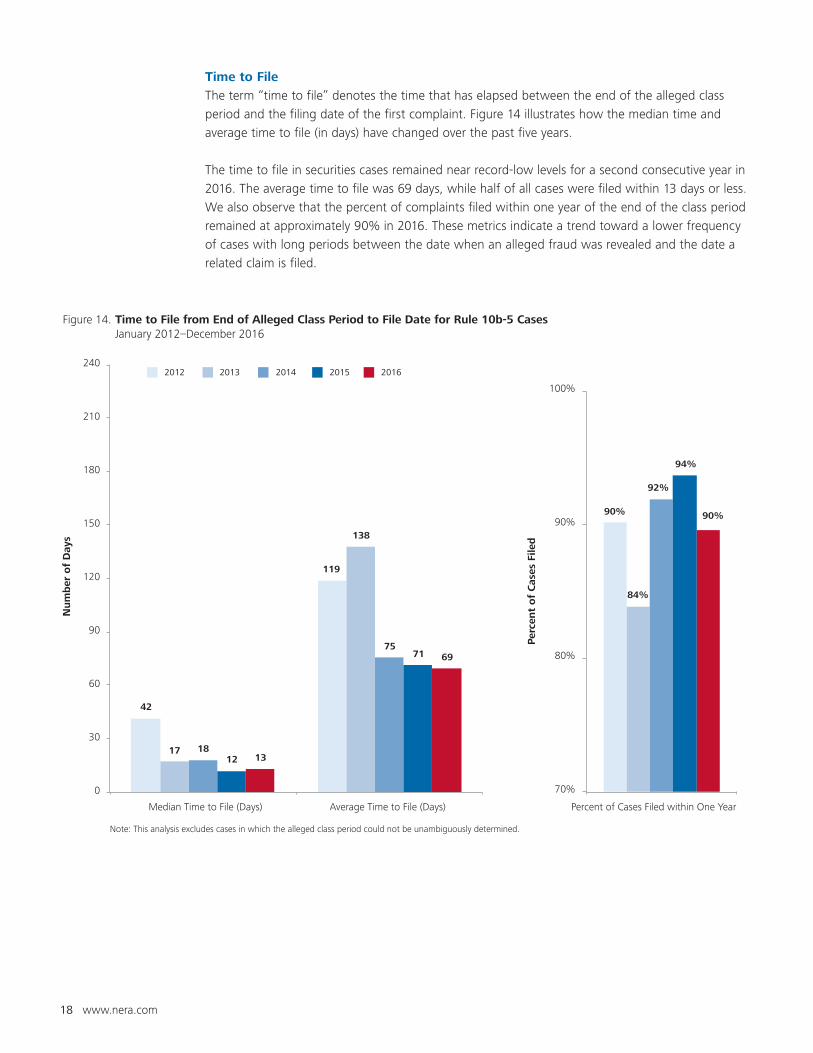
Time to File
The term “time to file” denotes the time that has elapsed between the end of the alleged class
period and the filing date of the first complaint. Figure 14 illustrates how the median time and
average time to file (in days) have changed over the past five years.
The time to file in securities cases remained near record-low levels for a second consecutive year in
2016. The average time to file was 69 days, while half of all cases were filed within 13 days or less.
We also observe that the percent of complaints filed within one year of the end of the class period
remained at approximately 90% in 2016. These metrics indicate a trend toward a lower frequency
of cases with long periods between the date when an alleged fraud was revealed and the date a
related claim is filed.
Figure 14. Time to File from End of Alleged Class Period to File Date for Rule 10b-5 Cases January 2012–December 2016
2015 2016201420132012
Median Time to File (Days) Average Time to File (Days) Percent of Cases Filed within One Year
42
119
17
138
18
75
12
71
13
69
0
30
60
90
120
150
180
210
240
Num
ber
of
Day
s
Note: This analysis excludes cases in which the alleged class period could not be unambiguously determined.
90%
84%
92%
94%
90%
70%
80%
90%
100%
Per
cent
of
Cas
es F
iled
www.nera.com 19
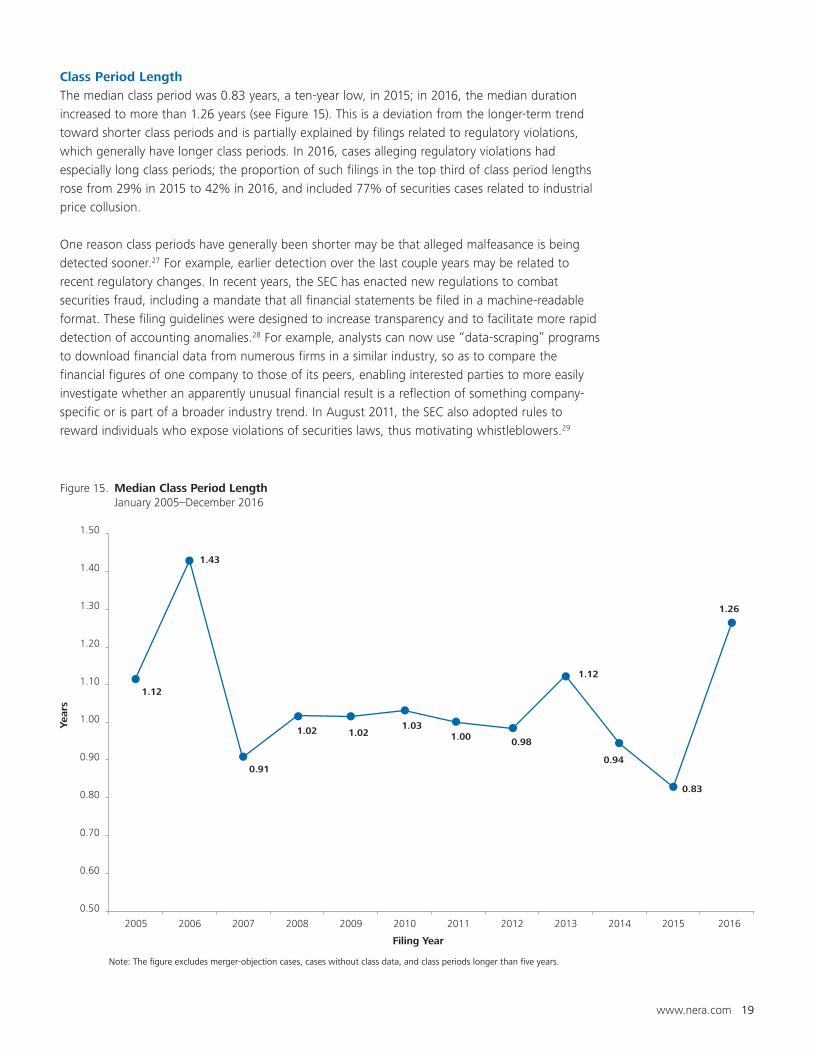
Class Period Length
The median class period was 0.83 years, a ten-year low, in 2015; in 2016, the median duration
increased to more than 1.26 years (see Figure 15). This is a deviation from the longer-term trend
toward shorter class periods and is partially explained by filings related to regulatory violations,
which generally have longer class periods. In 2016, cases alleging regulatory violations had
especially long class periods; the proportion of such filings in the top third of class period lengths
rose from 29% in 2015 to 42% in 2016, and included 77% of securities cases related to industrial
price collusion.
One reason class periods have generally been shorter may be that alleged malfeasance is being
detected sooner.27 For example, earlier detection over the last couple years may be related to
recent regulatory changes. In recent years, the SEC has enacted new regulations to combat
securities fraud, including a mandate that all financial statements be filed in a machine-readable
format. These filing guidelines were designed to increase transparency and to facilitate more rapid
detection of accounting anomalies.28 For example, analysts can now use “data-scraping” programs
to download financial data from numerous firms in a similar industry, so as to compare the
financial figures of one company to those of its peers, enabling interested parties to more easily
investigate whether an apparently unusual financial result is a reflection of something company-
specific or is part of a broader industry trend. In August 2011, the SEC also adopted rules to
reward individuals who expose violations of securities laws, thus motivating whistleblowers.29
Figure 15. Median Class Period Length January 2005–December 2016
1.12
1.43
1.26
0.91
1.02 1.021.03
1.00 0.98
1.12
0.94
0.83
0.50
0.60
0.70
0.80
0.90
1.00
1.10
1.20
1.30
1.40
1.50
2005 2006 2007 2008 2009 2010 2011 2012 2013 2014 2015 2016
Year
s
Filing Year
Note: The figure excludes merger-objection cases, cases without class data, and class periods longer than five years.
20 www.nera.com
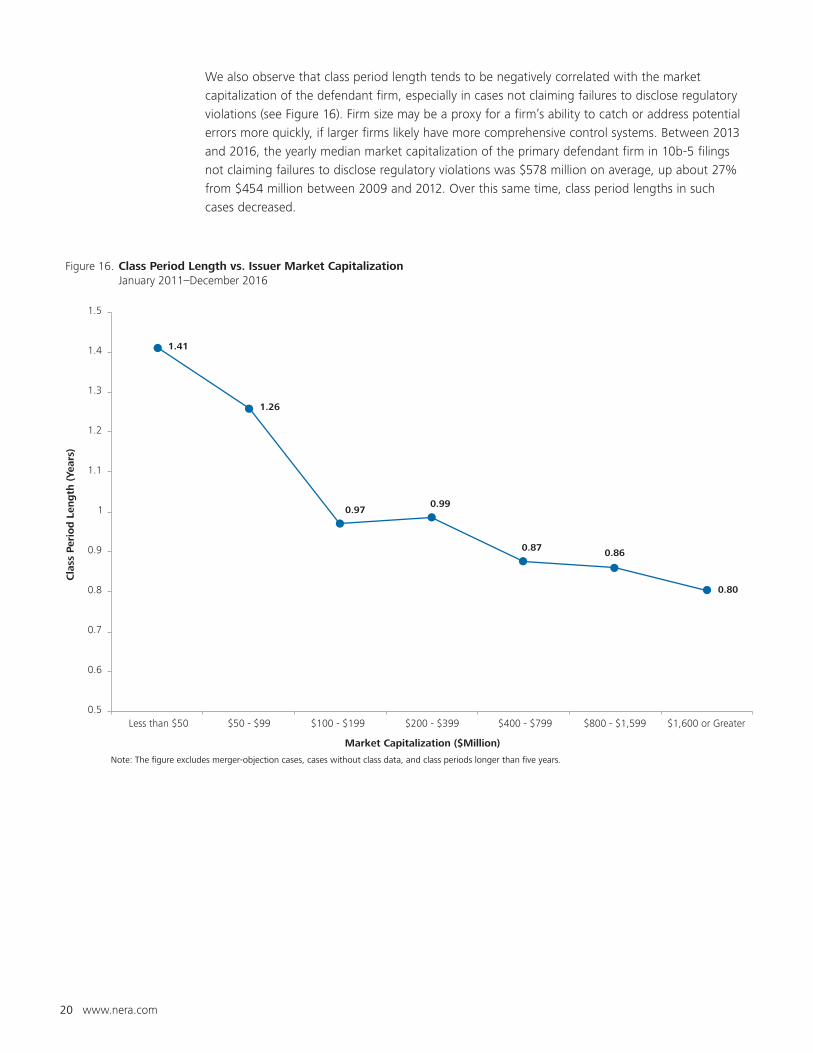
We also observe that class period length tends to be negatively correlated with the market
capitalization of the defendant firm, especially in cases not claiming failures to disclose regulatory
violations (see Figure 16). Firm size may be a proxy for a firm’s ability to catch or address potential
errors more quickly, if larger firms likely have more comprehensive control systems. Between 2013
and 2016, the yearly median market capitalization of the primary defendant firm in 10b-5 filings
not claiming failures to disclose regulatory violations was $578 million on average, up about 27%
from $454 million between 2009 and 2012. Over this same time, class period lengths in such
cases decreased.
Figure 16. Class Period Length vs. Issuer Market Capitalization January 2011–December 2016
1.41
1.26
0.970.99
0.87 0.86
0.80
0.5
0.6
0.7
0.8
0.9
1
1.1
1.2
1.3
1.4
1.5
Less than $50 $50 - $99 $100 - $199 $200 - $399 $400 - $799 $800 - $1,599 $1,600 or Greater
Cla
ss P
erio
d L
eng
th (
Year
s)
Market Capitalization ($Million)
Note: The figure excludes merger-objection cases, cases without class data, and class periods longer than five years.
www.nera.com 21
Analysis of Motions
NERA’s statistical analysis has found robust relationships between settlement amounts and the
litigation stage at which settlements occur. We track three types of motions: motion to dismiss,
motion for class certification, and motion for summary judgment. For this analysis, we track
securities class actions in which holders of common stock are part of the class and in which a
violation of Rule 10b-5 or Section 11 is alleged.
As shown in the below figures, we record the status of any motion as of the resolution of the
case. For example, a motion to dismiss which had been granted but was later denied on appeal is
recorded as denied, even if the case settles without the motion being filed again.
Motions for summary judgment were filed by defendants in 7.5%, and by plaintiffs in only 2.1%, of
the securities class actions filed and resolved over the 2000-2016 period, among those we tracked.30
Outcomes of motions to dismiss and motions for class certification are discussed below.
Motion to Dismiss
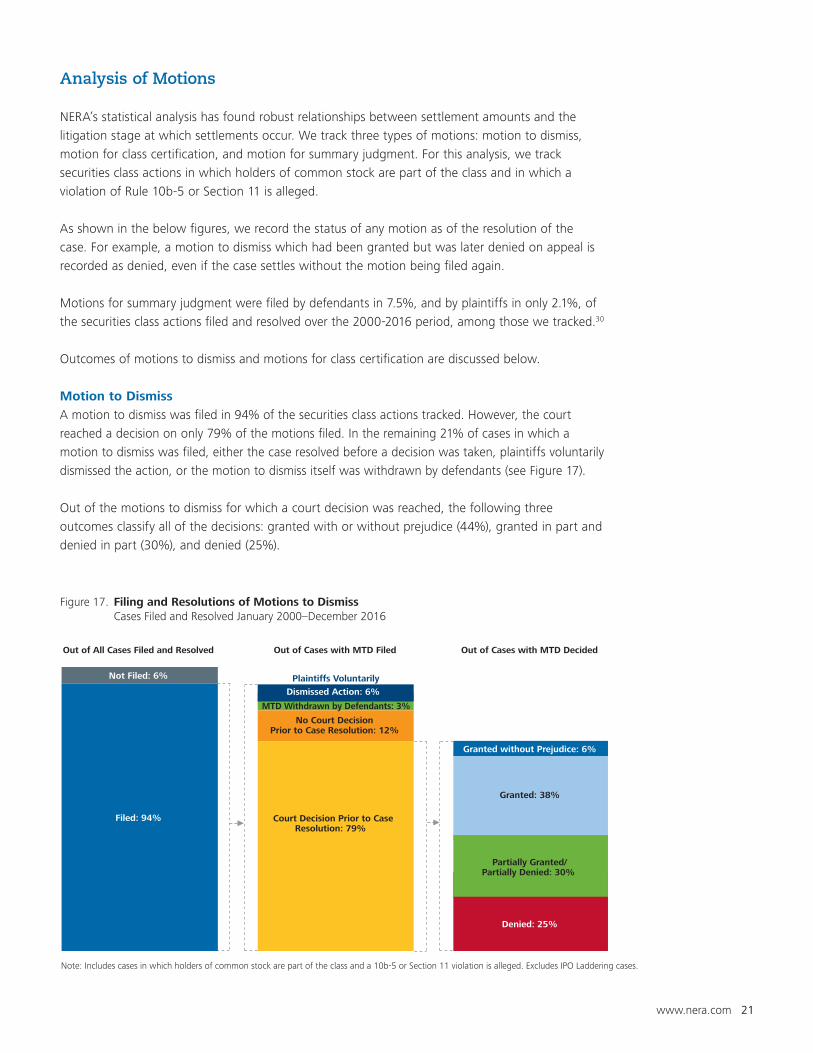
A motion to dismiss was filed in 94% of the securities class actions tracked. However, the court
reached a decision on only 79% of the motions filed. In the remaining 21% of cases in which a
motion to dismiss was filed, either the case resolved before a decision was taken, plaintiffs voluntarily
dismissed the action, or the motion to dismiss itself was withdrawn by defendants (see Figure 17).
Out of the motions to dismiss for which a court decision was reached, the following three
outcomes classify all of the decisions: granted with or without prejudice (44%), granted in part and
denied in part (30%), and denied (25%).
Out of All Cases Filed and Resolved
Figure 17. Filing and Resolutions of Motions to Dismiss Cases Filed and Resolved January 2000–December 2016
Denied: 25%
Granted: 38%
Granted without Prejudice: 6%
Filed: 94%
Not Filed: 6%
Court Decision Prior to CaseResolution: 79%
No Court Decision Prior to Case Resolution: 12%
MTD Withdrawn by Defendants: 3%
Plaintiffs Voluntarily
Dismissed Action: 6%
Out of Cases with MTD Filed Out of Cases with MTD Decided
Note: Includes cases in which holders of common stock are part of the class and a 10b-5 or Section 11 violation is alleged. Excludes IPO Laddering cases.
Partially Granted/ Partially Denied: 30%
22 www.nera.com
Motion for Class Certification
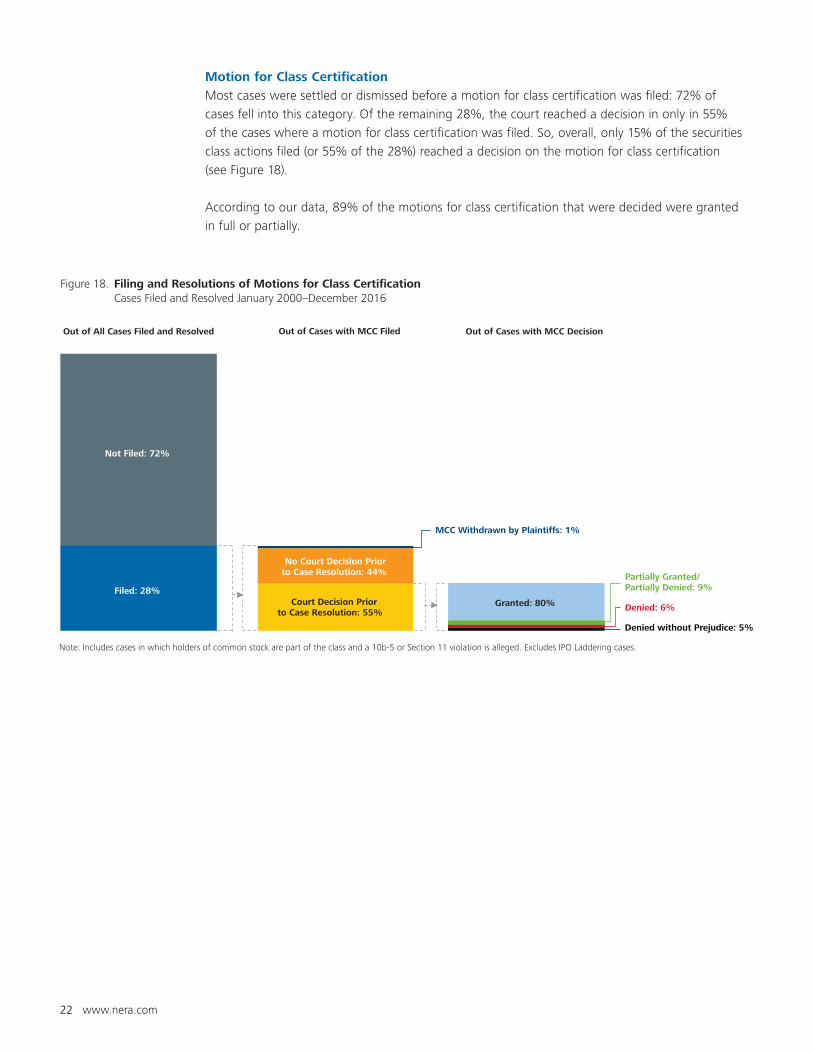
Most cases were settled or dismissed before a motion for class certification was filed: 72% of
cases fell into this category. Of the remaining 28%, the court reached a decision in only in 55%
of the cases where a motion for class certification was filed. So, overall, only 15% of the securities
class actions filed (or 55% of the 28%) reached a decision on the motion for class certification
(see Figure 18).
According to our data, 89% of the motions for class certification that were decided were granted
in full or partially.
Figure 18. Filing and Resolutions of Motions for Class Certification Cases Filed and Resolved January 2000–December 2016
Denied without Prejudice: 5%
Denied: 6%
Partially Granted/Partially Denied: 9%
Granted: 80% Filed: 28%
Not Filed: 72%
Court Decision Prior to Case Resolution: 55%
No Court Decision Priorto Case Resolution: 44%
Out of All Cases Filed and Resolved
MCC Withdrawn by Plaintiffs: 1%
Out of Cases with MCC Filed Out of Cases with MCC Decision
Note: Includes cases in which holders of common stock are part of the class and a 10b-5 or Section 11 violation is alleged. Excludes IPO Laddering cases.
www.nera.com 23
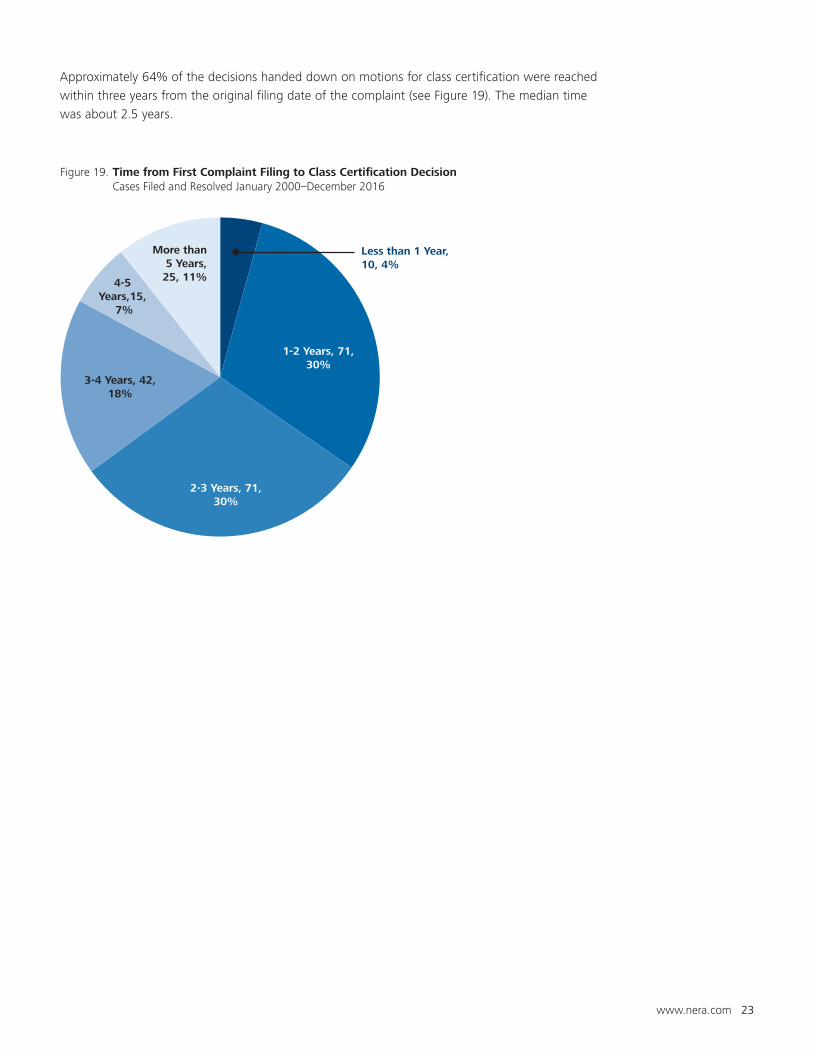
Approximately 64% of the decisions handed down on motions for class certification were reached
within three years from the original filing date of the complaint (see Figure 19). The median time
was about 2.5 years.
Figure 19. Time from First Complaint Filing to Class Certification Decision Cases Filed and Resolved January 2000–December 2016
Less than 1 Year,10, 4%
1-2 Years, 71,30%
2-3 Years, 71,30%
3-4 Years, 42,18%
4-5 Years,15,
7%
More than5 Years,25, 11%
24 www.nera.com
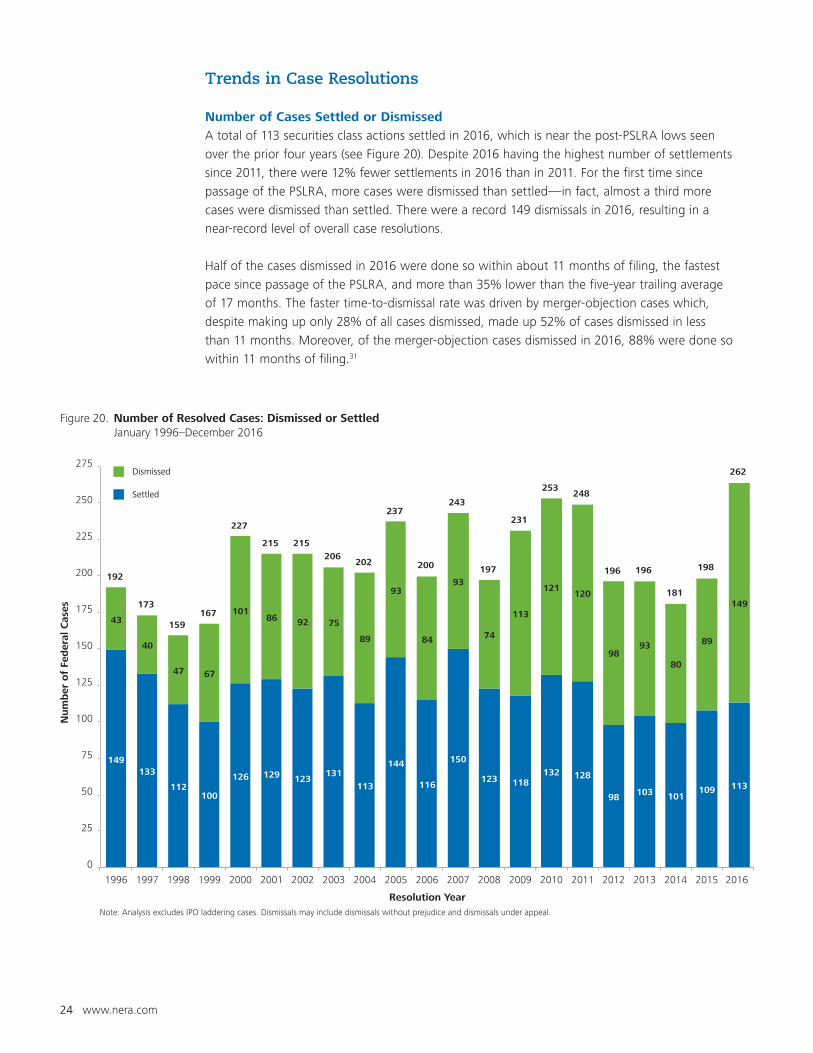
Trends in Case Resolutions
Number of Cases Settled or Dismissed
A total of 113 securities class actions settled in 2016, which is near the post-PSLRA lows seen
over the prior four years (see Figure 20). Despite 2016 having the highest number of settlements
since 2011, there were 12% fewer settlements in 2016 than in 2011. For the first time since
passage of the PSLRA, more cases were dismissed than settled—in fact, almost a third more
cases were dismissed than settled. There were a record 149 dismissals in 2016, resulting in a
near-record level of overall case resolutions.
Half of the cases dismissed in 2016 were done so within about 11 months of filing, the fastest
pace since passage of the PSLRA, and more than 35% lower than the five-year trailing average
of 17 months. The faster time-to-dismissal rate was driven by merger-objection cases which,
despite making up only 28% of all cases dismissed, made up 52% of cases dismissed in less
than 11 months. Moreover, of the merger-objection cases dismissed in 2016, 88% were done so
within 11 months of filing.31
Figure 20. Number of Resolved Cases: Dismissed or Settled January 1996–December 2016
Dismissed
Settled
149133
112100
126 129 123131
113
144
116
150
123 118132 128
98 103 101109
43
40
47 67
10186 92 75
89
93
84
93
74
113
121120
9893
80
89
192
173
159167
227
215 215
206202
237
200
243
197
231
253248
196 196
181
198
113
149
262
0
25
50
75
100
125
150
175
200
225
250
275
1996 1997 1998 1999 2000 2001 2002 2003 2004 2005 2006 2007 2008 2009 2010 2011 2012 2013 2014 2015 2016
Num
ber
of
Fed
eral
Cas
es
Resolution YearNote: Analysis excludes IPO laddering cases. Dismissals may include dismissals without prejudice and dismissals under appeal.
www.nera.com 25
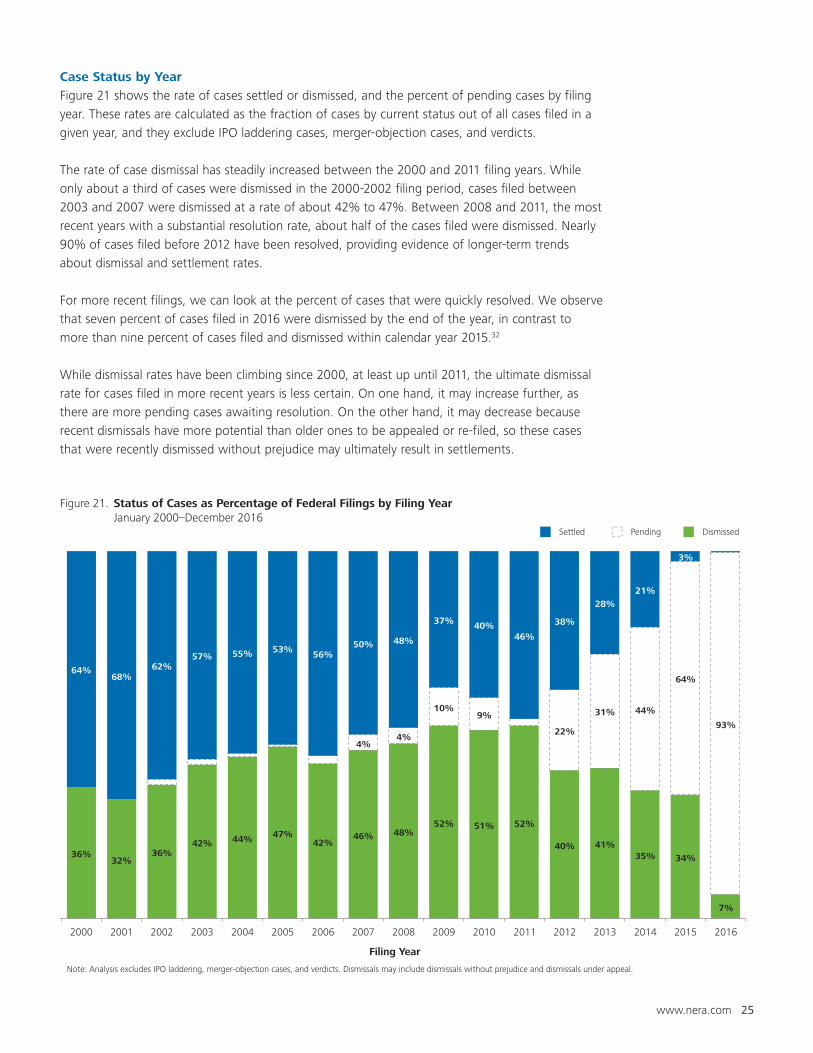
Case Status by Year
Figure 21 shows the rate of cases settled or dismissed, and the percent of pending cases by filing
year. These rates are calculated as the fraction of cases by current status out of all cases filed in a
given year, and they exclude IPO laddering cases, merger-objection cases, and verdicts.
The rate of case dismissal has steadily increased between the 2000 and 2011 filing years. While
only about a third of cases were dismissed in the 2000-2002 filing period, cases filed between
2003 and 2007 were dismissed at a rate of about 42% to 47%. Between 2008 and 2011, the most
recent years with a substantial resolution rate, about half of the cases filed were dismissed. Nearly
90% of cases filed before 2012 have been resolved, providing evidence of longer-term trends
about dismissal and settlement rates.
For more recent filings, we can look at the percent of cases that were quickly resolved. We observe
that seven percent of cases filed in 2016 were dismissed by the end of the year, in contrast to
more than nine percent of cases filed and dismissed within calendar year 2015.32
While dismissal rates have been climbing since 2000, at least up until 2011, the ultimate dismissal
rate for cases filed in more recent years is less certain. On one hand, it may increase further, as
there are more pending cases awaiting resolution. On the other hand, it may decrease because
recent dismissals have more potential than older ones to be appealed or re-filed, so these cases
that were recently dismissed without prejudice may ultimately result in settlements.
Figure 21. Status of Cases as Percentage of Federal Filings by Filing Year January 2000–December 2016
DismissedSettled Pending
36%32%
36%42% 44% 47%
42%46% 48%
52% 51% 52%
40% 41%35% 34%
7%
4%4%
10%9%
22%
31% 44%
64%
93%
64%68%
62%57% 55% 53%
56%50% 48%
37% 40%46%
38%
28%
21%
3%
2000 2001 2002 2003 2004 2005 2006 2007 2008 2009 2010 2011 2012 2013 2014 2015 2016
Filing Year
Note: Analysis excludes IPO laddering, merger-objection cases, and verdicts. Dismissals may include dismissals without prejudice and dismissals under appeal.
26 www.nera.com
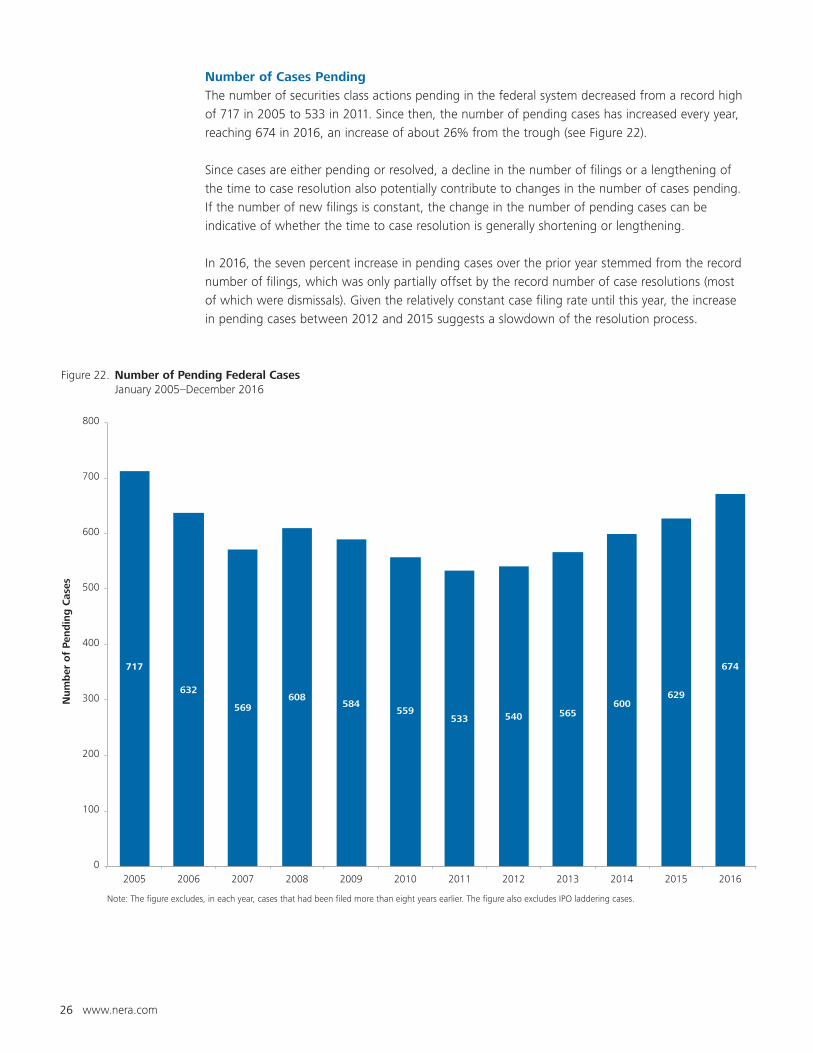
Number of Cases Pending
The number of securities class actions pending in the federal system decreased from a record high
of 717 in 2005 to 533 in 2011. Since then, the number of pending cases has increased every year,
reaching 674 in 2016, an increase of about 26% from the trough (see Figure 22).
Since cases are either pending or resolved, a decline in the number of filings or a lengthening of
the time to case resolution also potentially contribute to changes in the number of cases pending.
If the number of new filings is constant, the change in the number of pending cases can be
indicative of whether the time to case resolution is generally shortening or lengthening.
In 2016, the seven percent increase in pending cases over the prior year stemmed from the record
number of filings, which was only partially offset by the record number of case resolutions (most
of which were dismissals). Given the relatively constant case filing rate until this year, the increase
in pending cases between 2012 and 2015 suggests a slowdown of the resolution process.
Figure 22. Number of Pending Federal Cases January 2005–December 2016
Note: The figure excludes, in each year, cases that had been filed more than eight years earlier. The figure also excludes IPO laddering cases.
717
632
569608
584559
533 540 565600
629
674
0
100
200
300
400
500
600
700
800
2005 2006 2007 2008 2009 2010 2011 2012 2013 2014 2015 2016
Num
ber
of
Pen
din
g C
ases
www.nera.com 27
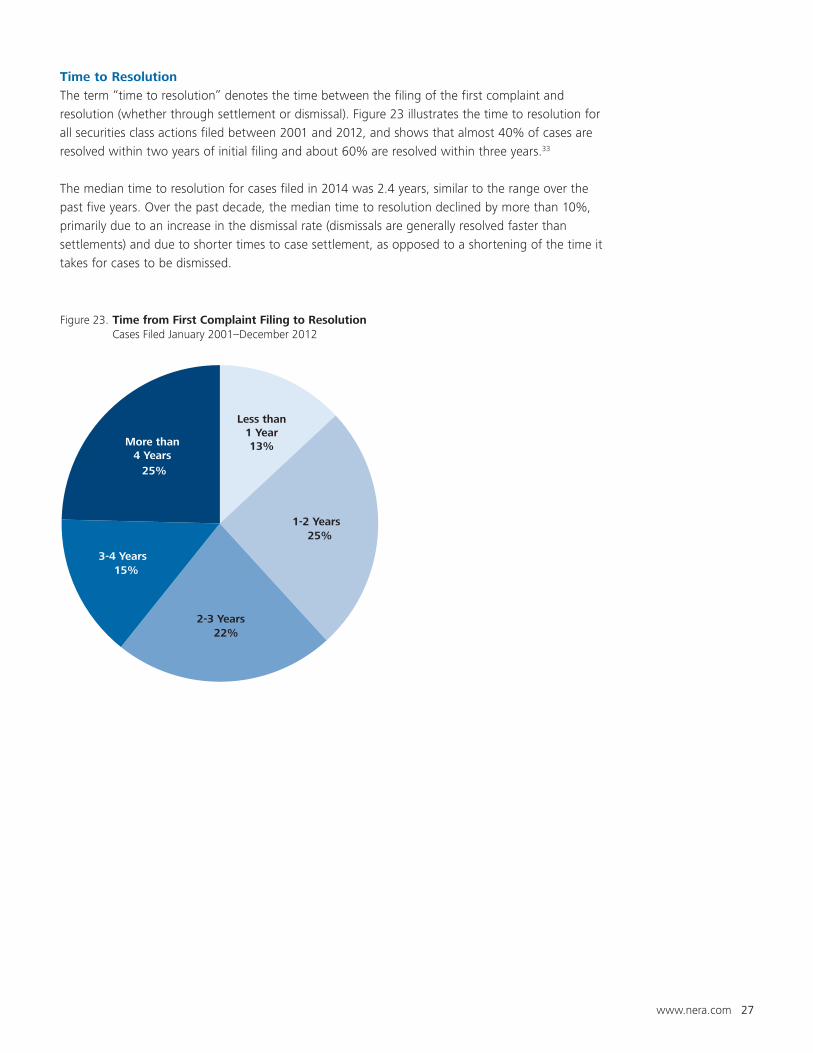
Time to Resolution
The term “time to resolution” denotes the time between the filing of the first complaint and
resolution (whether through settlement or dismissal). Figure 23 illustrates the time to resolution for
all securities class actions filed between 2001 and 2012, and shows that almost 40% of cases are
resolved within two years of initial filing and about 60% are resolved within three years.33
The median time to resolution for cases filed in 2014 was 2.4 years, similar to the range over the
past five years. Over the past decade, the median time to resolution declined by more than 10%,
primarily due to an increase in the dismissal rate (dismissals are generally resolved faster than
settlements) and due to shorter times to case settlement, as opposed to a shortening of the time it
takes for cases to be dismissed.
Figure 23. Time from First Complaint Filing to Resolution Cases Filed January 2001–December 2012
Less than1 Year13%
1-2 Years25%
2-3 Years22%
3-4 Years15%
More than4 Years
25%
28 www.nera.com
Trends in Settlements
We present several settlement metrics to highlight attributes of cases that settled in 2016 and
to compare them with cases settled in past years. We discuss two ways of measuring average
settlement amounts and calculate the median settlement amount. Each calculation excludes IPO
laddering cases, merger-objection cases, and cases that settle with no cash payment to the class,
as settlements of such cases may obscure trends in what have historically been more typical cases.
The average settlement amount increased substantially for a second straight year, reaching $72
million in 2016, up by more than 35% compared to the 2015 figure. Excluding cases that settled
for more than $1 billion dollars, the average settlement amount for 2016 fell to $43 million from
last year’s near-record $53 million. The median 2016 settlement amount, which is more robust to
extreme values, increased by more than a fifth from the 2015 median of $9.1 million.
The settlement of two longstanding large cases in 2016 affected the average settlement statistics.
To illustrate how many cases settled over various ranges in 2016 compared to prior years, we
provide a distribution of settlements over the past five years. To supplement this, we tabulate the
10 largest settlements of the year.
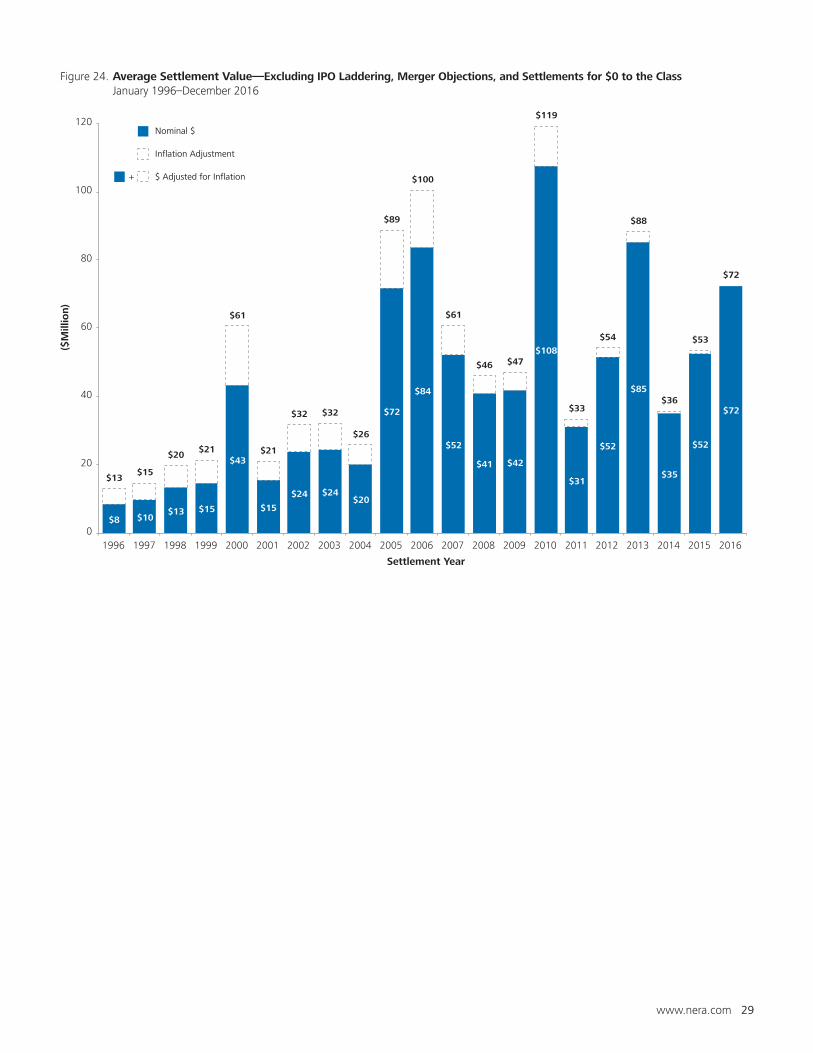
Average and Median Settlement Amounts
The average settlement amount exceeded $72 million in 2016, an increase of more than 35% over
the average of $53 million in 2015, adjusted for inflation (see Figure 24). This follows a steep 47%
increase in 2015 from a near ten-year low of $36 million in 2014. Infrequent large settlements are
generally responsible for the wide variability in average settlement amounts over the past decade.
For example, without the settlements of WorldCom, Inc. in 2005 and Enron Corp. in 2010, the
average settlement amounts in those years would have been more than 60% lower.
www.nera.com 29
Figure 24. Average Settlement Value—Excluding IPO Laddering, Merger Objections, and Settlements for $0 to the Class January 1996–December 2016
Nominal $
Inflation Adjustment
$ Adjusted for Inflation +
$8 $10$13 $15
$43
$15
$24 $24$20
$72
$84
$52
$41 $42
$108
$31
$52
$85
$35
$52
$72
$13$15
$20$21
$61
$21
$32 $32
$26
$89
$100
$61
$46 $47
$119
$33
$54
$88
$36
$53
$72
0
20
40
60
80
100
120
1996 1997 1998 1999 2000 2001 2002 2003 2004 2005 2006 2007 2008 2009 2010 2011 2012 2013 2014 2015 2016
($M
illio
n)
Settlement Year
30 www.nera.com
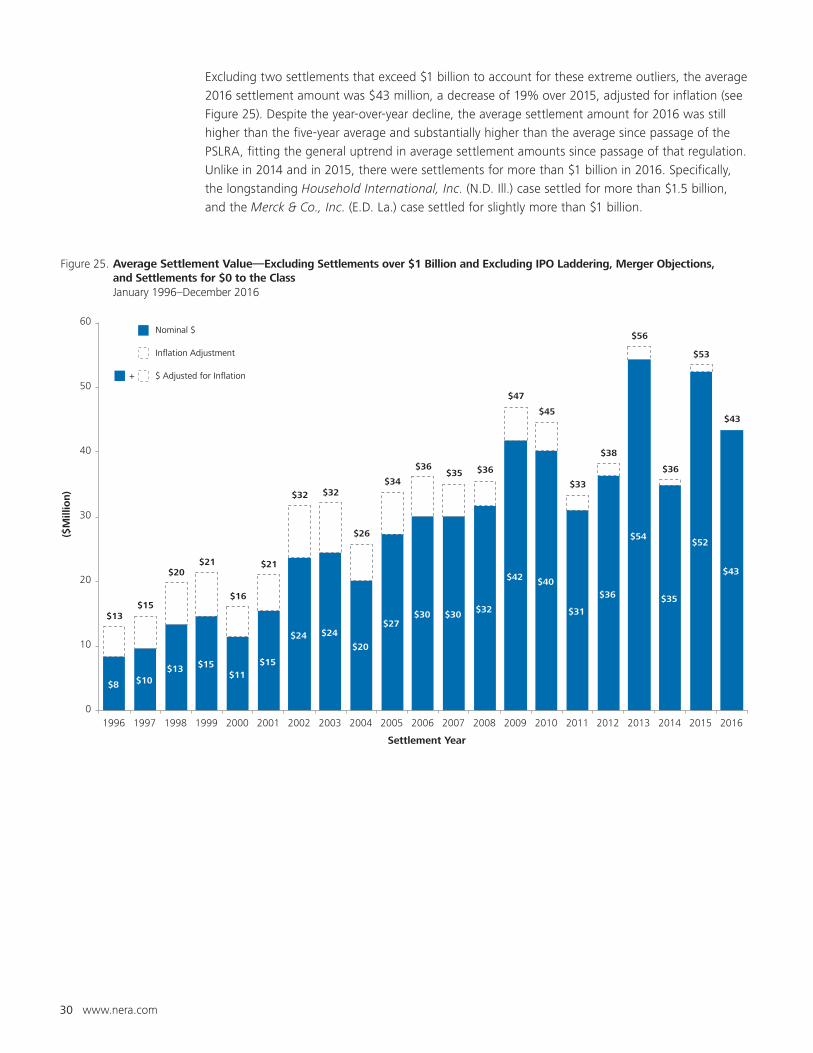
Excluding two settlements that exceed $1 billion to account for these extreme outliers, the average
2016 settlement amount was $43 million, a decrease of 19% over 2015, adjusted for inflation (see
Figure 25). Despite the year-over-year decline, the average settlement amount for 2016 was still
higher than the five-year average and substantially higher than the average since passage of the
PSLRA, fitting the general uptrend in average settlement amounts since passage of that regulation.
Unlike in 2014 and in 2015, there were settlements for more than $1 billion in 2016. Specifically,
the longstanding Household International, Inc. (N.D. Ill.) case settled for more than $1.5 billion,
and the Merck & Co., Inc. (E.D. La.) case settled for slightly more than $1 billion.
Figure 25. Average Settlement Value—Excluding Settlements over $1 Billion and Excluding IPO Laddering, Merger Objections, and Settlements for $0 to the Class January 1996–December 2016
Nominal $
Inflation Adjustment
$ Adjusted for Inflation +
$8 $10$13 $15
$11$15
$24 $24
$20
$27$30 $30 $32
$42 $40
$31
$36
$54
$35
$52
$43
$13$15
$20$21
$16
$21
$32 $32
$26
$34
$36$35 $36
$47
$45
$33
$38
$56
$36
$53
$43
0
10
20
30
40
50
60
1996 1997 1998 1999 2000 2001 2002 2003 2004 2005 2006 2007 2008 2009 2010 2011 2012 2013 2014 2015 2016
($M
illio
n)
Settlement Year
www.nera.com 31
Inclusion of these two very large settlements pushed the overall 2016 average settlement amount
up by more than 67%.
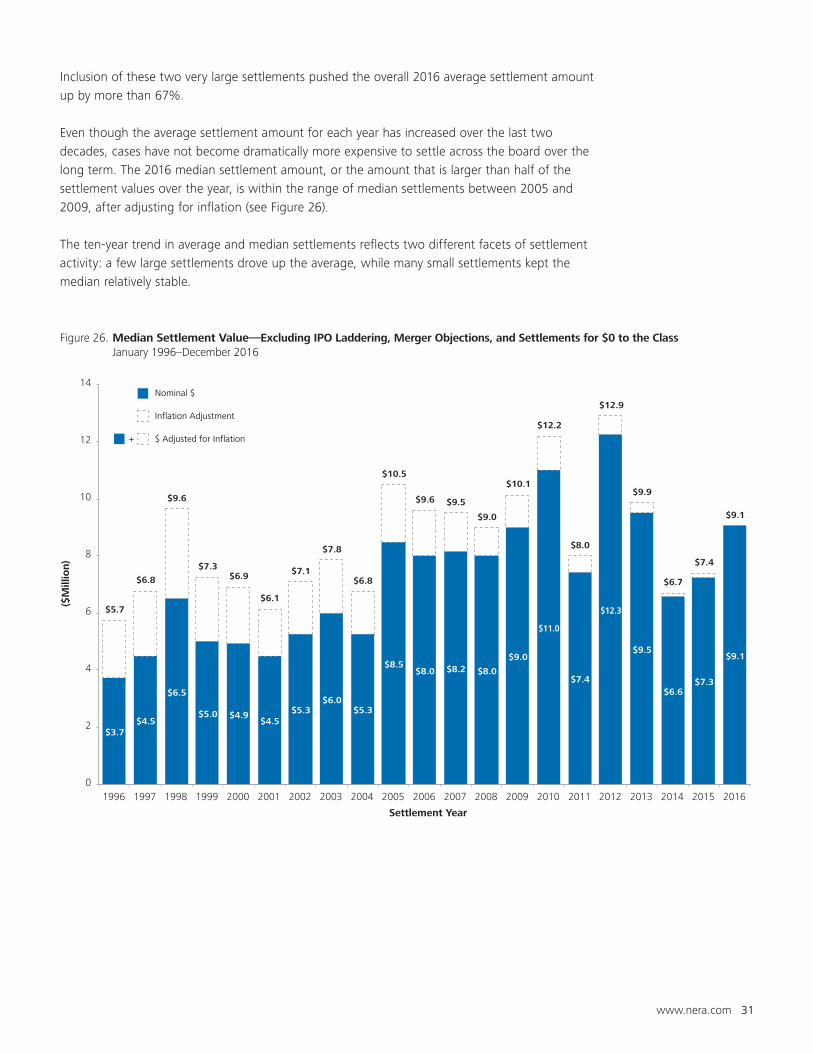
Even though the average settlement amount for each year has increased over the last two
decades, cases have not become dramatically more expensive to settle across the board over the
long term. The 2016 median settlement amount, or the amount that is larger than half of the
settlement values over the year, is within the range of median settlements between 2005 and
2009, after adjusting for inflation (see Figure 26).
The ten-year trend in average and median settlements reflects two different facets of settlement
activity: a few large settlements drove up the average, while many small settlements kept the
median relatively stable.
Figure 26. Median Settlement Value—Excluding IPO Laddering, Merger Objections, and Settlements for $0 to the Class January 1996–December 2016
Nominal $
Inflation Adjustment
$ Adjusted for Inflation +
$3.7$4.5
$6.5
$5.0 $4.9$4.5
$5.3$6.0
$5.3
$8.5$8.0 $8.2 $8.0
$9.0
$11.0
$7.4
$12.3
$9.5
$6.6$7.3
$9.1
$5.7
$6.8
$9.6
$7.3$6.9
$6.1
$7.1
$7.8
$6.8
$10.5
$9.6 $9.5
$9.0
$10.1
$12.2
$8.0
$12.9
$9.9
$6.7
$7.4
$9.1
0
2
4
6
8
10
12
14
1996 1997 1998 1999 2000 2001 2002 2003 2004 2005 2006 2007 2008 2009 2010 2011 2012 2013 2014 2015 2016
($M
illio
n)
Settlement Year
32 www.nera.com
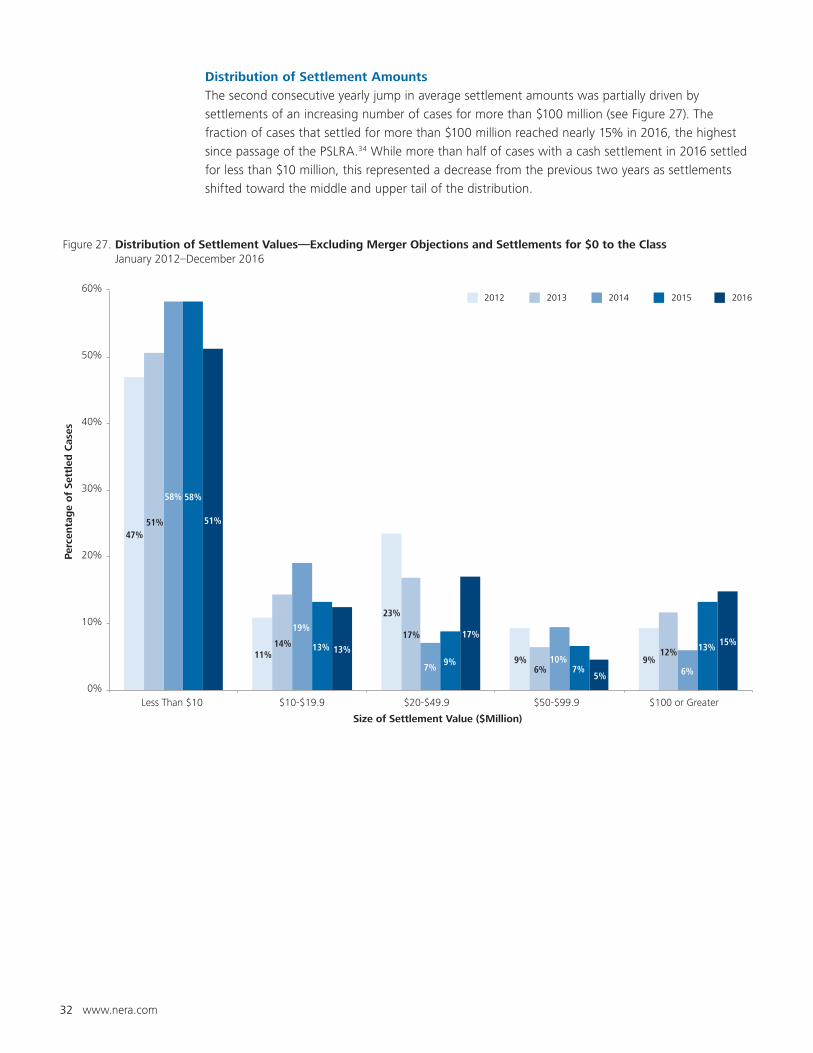
Distribution of Settlement Amounts
The second consecutive yearly jump in average settlement amounts was partially driven by
settlements of an increasing number of cases for more than $100 million (see Figure 27). The
fraction of cases that settled for more than $100 million reached nearly 15% in 2016, the highest
since passage of the PSLRA.34 While more than half of cases with a cash settlement in 2016 settled
for less than $10 million, this represented a decrease from the previous two years as settlements
shifted toward the middle and upper tail of the distribution.
Figure 27. Distribution of Settlement Values—Excluding Merger Objections and Settlements for $0 to the Class January 2012–December 2016
20162015201420132012
47%
11%
23%
9% 9%
51%
14%17%
6%
12%
58%
19%
7%10%
6%
58%
13%
9%7%
13%
51%
13%
17%
5%
15%
0%
10%
20%
30%
40%
50%
60%
Less Than $10 $10-$19.9 $20-$49.9 $50-$99.9 $100 or Greater
Per
centa
ge
of
Sett
led
Cas
es
Size of Settlement Value ($Million)
www.nera.com 33
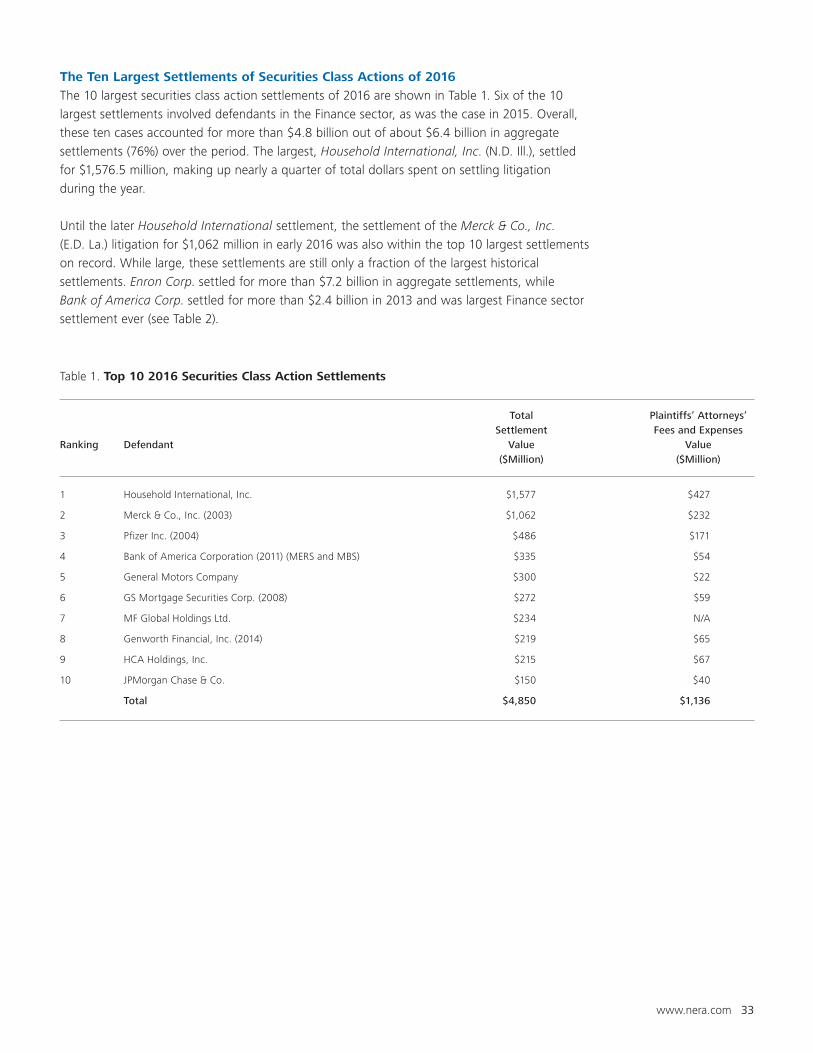
The Ten Largest Settlements of Securities Class Actions of 2016
The 10 largest securities class action settlements of 2016 are shown in Table 1. Six of the 10
largest settlements involved defendants in the Finance sector, as was the case in 2015. Overall,
these ten cases accounted for more than $4.8 billion out of about $6.4 billion in aggregate
settlements (76%) over the period. The largest, Household International, Inc. (N.D. Ill.), settled
for $1,576.5 million, making up nearly a quarter of total dollars spent on settling litigation
during the year.
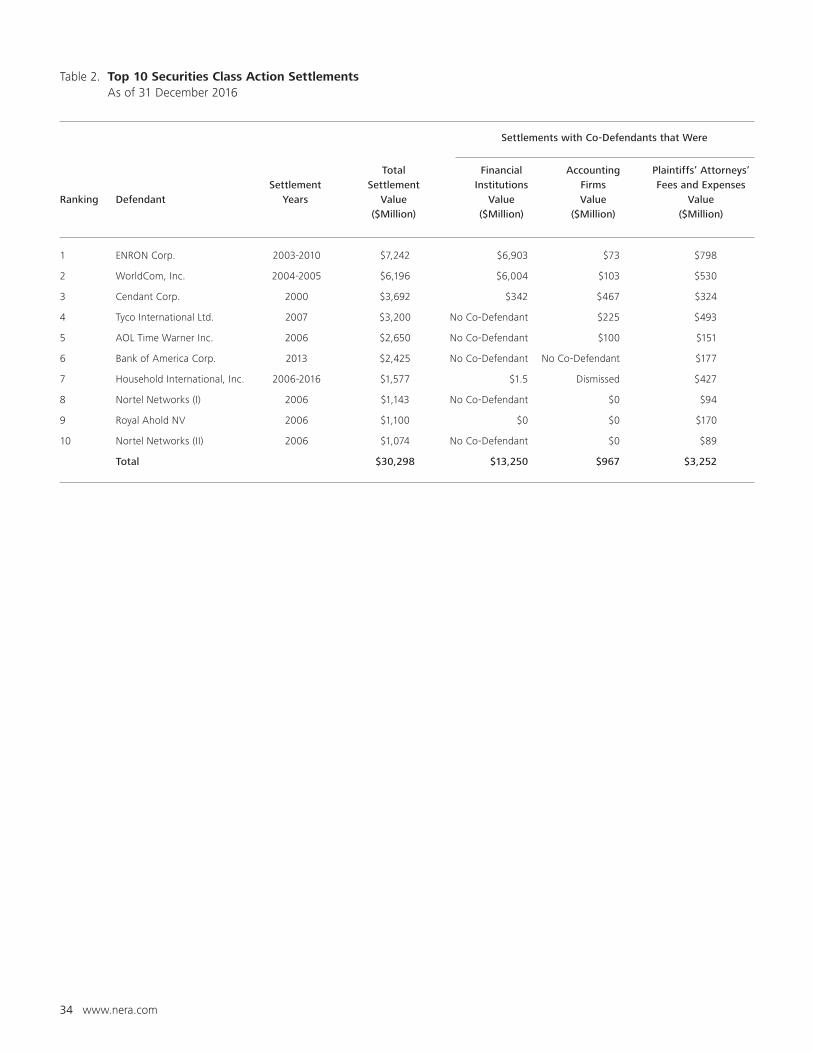
Until the later Household International settlement, the settlement of the Merck & Co., Inc.
(E.D. La.) litigation for $1,062 million in early 2016 was also within the top 10 largest settlements
on record. While large, these settlements are still only a fraction of the largest historical
settlements. Enron Corp. settled for more than $7.2 billion in aggregate settlements, while
Bank of America Corp. settled for more than $2.4 billion in 2013 and was largest Finance sector
settlement ever (see Table 2).
Table 1. Top 10 2016 Securities Class Action Settlements
Total Plaintiffs’ Attorneys’ Settlement Fees and ExpensesRanking Defendant Value Value ($Million) ($Million)
1 Household International, Inc. $1,577 $427
2 Merck & Co., Inc. (2003) $1,062 $232
3 Pfizer Inc. (2004) $486 $171
4 Bank of America Corporation (2011) (MERS and MBS) $335 $54
5 General Motors Company $300 $22
6 GS Mortgage Securities Corp. (2008) $272 $59
7 MF Global Holdings Ltd. $234 N/A
8 Genworth Financial, Inc. (2014) $219 $65
9 HCA Holdings, Inc. $215 $67
10 JPMorgan Chase & Co. $150 $40
Total $4,850 $1,136
34 www.nera.com
Table 2. Top 10 Securities Class Action Settlements As of 31 December 2016
Settlements with Co-Defendants that Were
Total Financial Accounting Plaintiffs’ Attorneys’ Settlement Settlement Institutions Firms Fees and ExpensesRanking Defendant Years Value Value Value Value ($Million) ($Million) ($Million) ($Million)
1 ENRON Corp. 2003-2010 $7,242 $6,903 $73 $798
2 WorldCom, Inc. 2004-2005 $6,196 $6,004 $103 $530
3 Cendant Corp. 2000 $3,692 $342 $467 $324
4 Tyco International Ltd. 2007 $3,200 No Co-Defendant $225 $493
5 AOL Time Warner Inc. 2006 $2,650 No Co-Defendant $100 $151
6 Bank of America Corp. 2013 $2,425 No Co-Defendant No Co-Defendant $177
7 Household International, Inc. 2006-2016 $1,577 $1.5 Dismissed $427
8 Nortel Networks (I) 2006 $1,143 No Co-Defendant $0 $94
9 Royal Ahold NV 2006 $1,100 $0 $0 $170
10 Nortel Networks (II) 2006 $1,074 No Co-Defendant $0 $89
Total $30,298 $13,250 $967 $3,252
www.nera.com 35
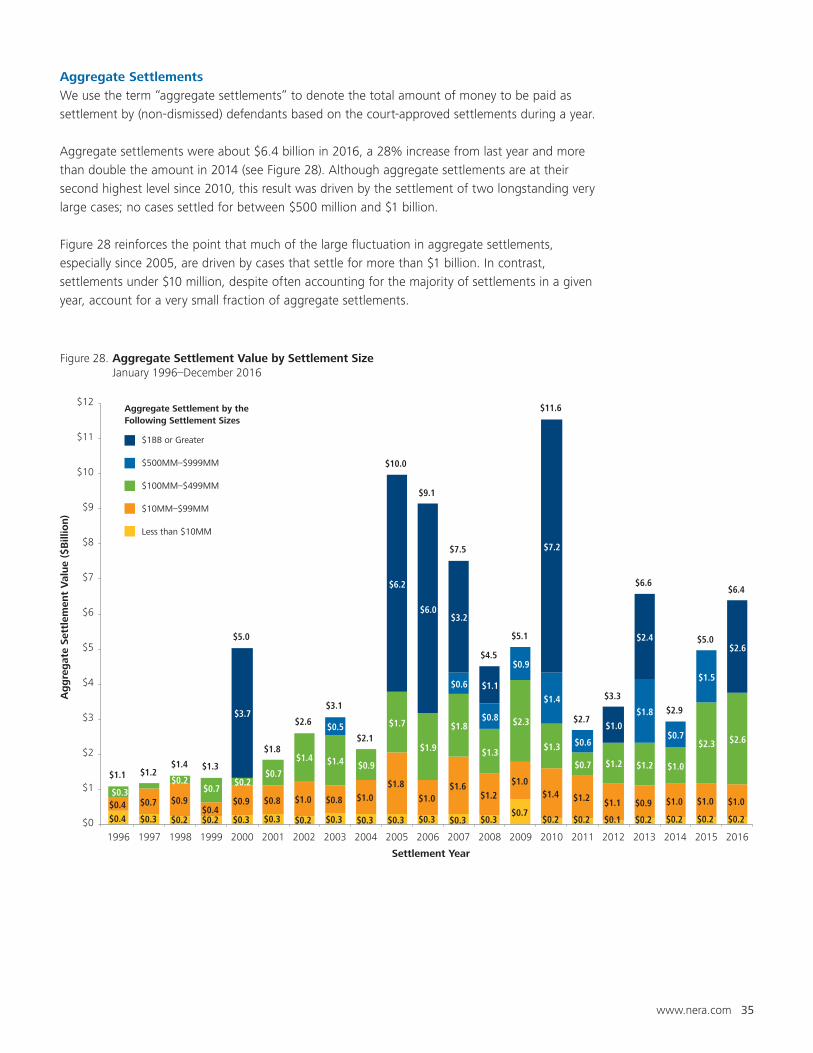
Aggregate Settlements
We use the term “aggregate settlements” to denote the total amount of money to be paid as
settlement by (non-dismissed) defendants based on the court-approved settlements during a year.
Aggregate settlements were about $6.4 billion in 2016, a 28% increase from last year and more
than double the amount in 2014 (see Figure 28). Although aggregate settlements are at their
second highest level since 2010, this result was driven by the settlement of two longstanding very
large cases; no cases settled for between $500 million and $1 billion.
Figure 28 reinforces the point that much of the large fluctuation in aggregate settlements,
especially since 2005, are driven by cases that settle for more than $1 billion. In contrast,
settlements under $10 million, despite often accounting for the majority of settlements in a given
year, account for a very small fraction of aggregate settlements.
Figure 28. Aggregate Settlement Value by Settlement Size January 1996–December 2016
$1BB or Greater
$500MM–$999MM
$100MM–$499MM
$10MM–$99MM
Less than $10MM
Aggregate Settlement by the Following Settlement Sizes
$0.4 $0.3 $0.2 $0.2 $0.3 $0.3 $0.2 $0.3 $0.3 $0.3 $0.3 $0.3 $0.3$0.7
$0.2 $0.2 $0.1 $0.2 $0.2 $0.2 $0.2
$0.4 $0.7 $0.9$0.4
$0.9 $0.8 $1.0 $0.8 $1.0
$1.8
$1.0$1.6
$1.2
$1.0$1.4 $1.2 $1.1 $0.9 $1.0 $1.0 $1.0
$0.3$0.2
$0.7$0.2
$0.7
$1.4 $1.4 $0.9
$1.7
$1.9
$1.8
$1.3
$2.3
$1.3
$0.7 $1.2 $1.2 $1.0
$2.3 $2.6$0.5
$0.6
$0.8
$0.9
$1.4
$0.6
$1.8
$0.7
$1.5
$3.7
$6.2
$6.0$3.2
$1.1
$7.2
$1.0
$2.4$2.6
$1.1 $1.2$1.4 $1.3
$5.0
$1.8
$2.6
$3.1
$2.1
$10.0
$9.1
$7.5
$4.5
$5.1
$11.6
$2.7
$3.3
$6.6
$2.9
$5.0
$6.4
$0
$1
$2
$3
$4
$5
$6
$7
$8
$9
$10
$11
$12
1996 1997 1998 1999 2000 2001 2002 2003 2004 2005 2006 2007 2008 2009 2010 2011 2012 2013 2014 2015 2016
Ag
gre
gat
e Se
ttle
men
t V
alue
($B
illio
n)
Settlement Year
36 www.nera.com
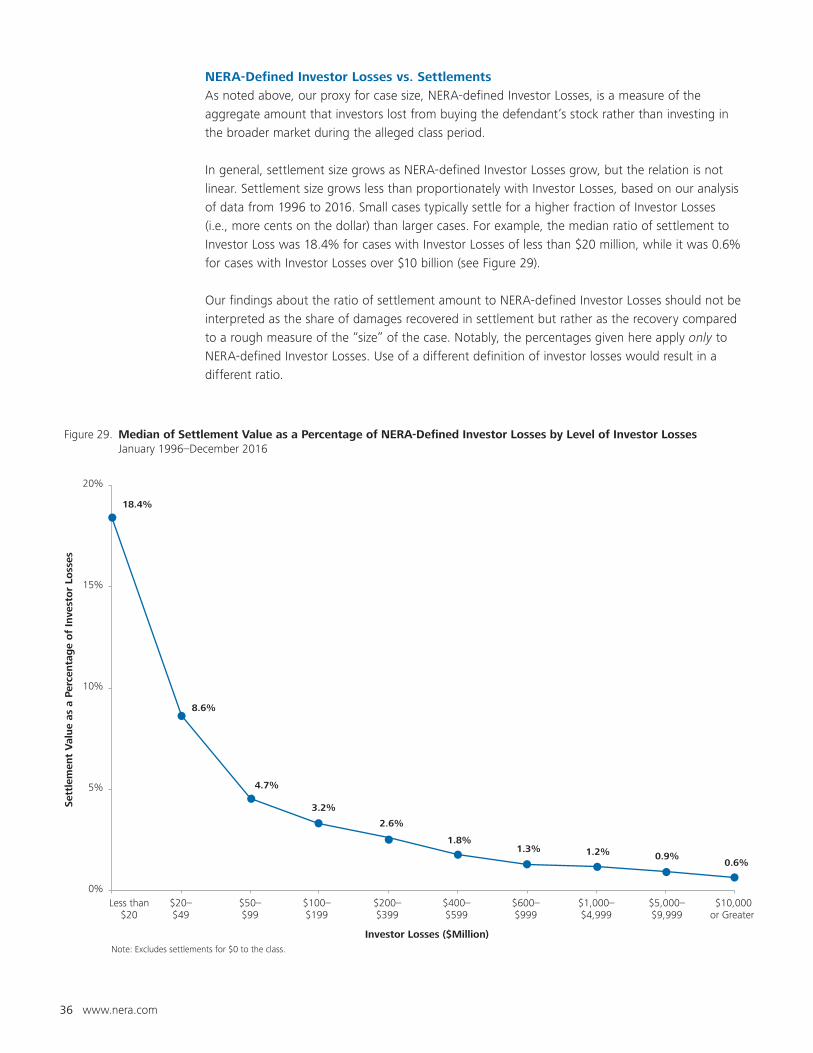
Figure 29. Median of Settlement Value as a Percentage of NERA-Defined Investor Losses by Level of Investor Losses January 1996–December 2016
18.4%
8.6%
4.7%
3.2%
2.6%
1.8%1.3% 1.2% 0.9%
0.6%
0%
5%
10%
15%
20%
Less than$20
$20–$49
$50–$99
$100–$199
$200–$399
$400–$599
$600–$999
$1,000–$4,999
$5,000–$9,999
$10,000or Greater
Sett
lem
ent
Val
ue
as a
Per
centa
ge
of
Inve
sto
r Lo
sses
Investor Losses ($Million)Note: Excludes settlements for $0 to the class.
NERA-Defined Investor Losses vs. Settlements
As noted above, our proxy for case size, NERA-defined Investor Losses, is a measure of the
aggregate amount that investors lost from buying the defendant’s stock rather than investing in
the broader market during the alleged class period.
In general, settlement size grows as NERA-defined Investor Losses grow, but the relation is not
linear. Settlement size grows less than proportionately with Investor Losses, based on our analysis
of data from 1996 to 2016. Small cases typically settle for a higher fraction of Investor Losses
(i.e., more cents on the dollar) than larger cases. For example, the median ratio of settlement to
Investor Loss was 18.4% for cases with Investor Losses of less than $20 million, while it was 0.6%
for cases with Investor Losses over $10 billion (see Figure 29).
Our findings about the ratio of settlement amount to NERA-defined Investor Losses should not be
interpreted as the share of damages recovered in settlement but rather as the recovery compared
to a rough measure of the “size” of the case. Notably, the percentages given here apply only to
NERA-defined Investor Losses. Use of a different definition of investor losses would result in a
different ratio.
www.nera.com 37
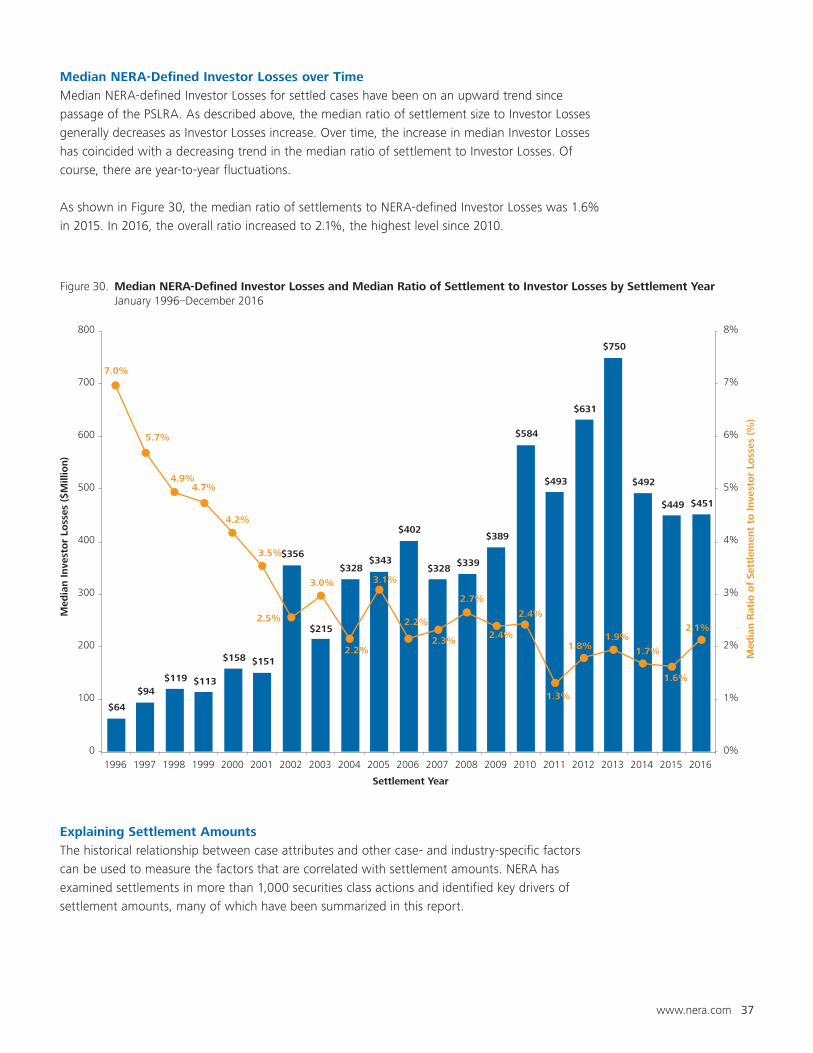
Median NERA-Defined Investor Losses over Time
Median NERA-defined Investor Losses for settled cases have been on an upward trend since
passage of the PSLRA. As described above, the median ratio of settlement size to Investor Losses
generally decreases as Investor Losses increase. Over time, the increase in median Investor Losses
has coincided with a decreasing trend in the median ratio of settlement to Investor Losses. Of
course, there are year-to-year fluctuations.
As shown in Figure 30, the median ratio of settlements to NERA-defined Investor Losses was 1.6%
in 2015. In 2016, the overall ratio increased to 2.1%, the highest level since 2010.
Explaining Settlement Amounts
The historical relationship between case attributes and other case- and industry-specific factors
can be used to measure the factors that are correlated with settlement amounts. NERA has
examined settlements in more than 1,000 securities class actions and identified key drivers of
settlement amounts, many of which have been summarized in this report.
Figure 30. Median NERA-Defined Investor Losses and Median Ratio of Settlement to Investor Losses by Settlement Year January 1996–December 2016
$64
$94$119 $113
$158 $151
$356
$215
$328$343
$402
$328$339
$389
$584
$493
$631
$750
$492
$449 $451
7.0%
5.7%
4.9%4.7%
4.2%
3.5%
2.5%
3.0%
2.2%
3.1%
2.2%
2.3%
2.7%
2.4%
2.4%
1.3%
1.8%1.9%
1.7%
1.6%
2.1%
0%
1%
2%
3%
4%
5%
6%
7%
8%
0
100
200
300
400
500
600
700
800
1996 1997 1998 1999 2000 2001 2002 2003 2004 2005 2006 2007 2008 2009 2010 2011 2012 2013 2014 2015 2016M
edia
n R
atio
of
Sett
lem
ent
to Inve
sto
r Lo
sses
(%
)
Med
ian Inve
sto
r Lo
sses
($
Mill
ion)
Settlement Year
38 www.nera.com
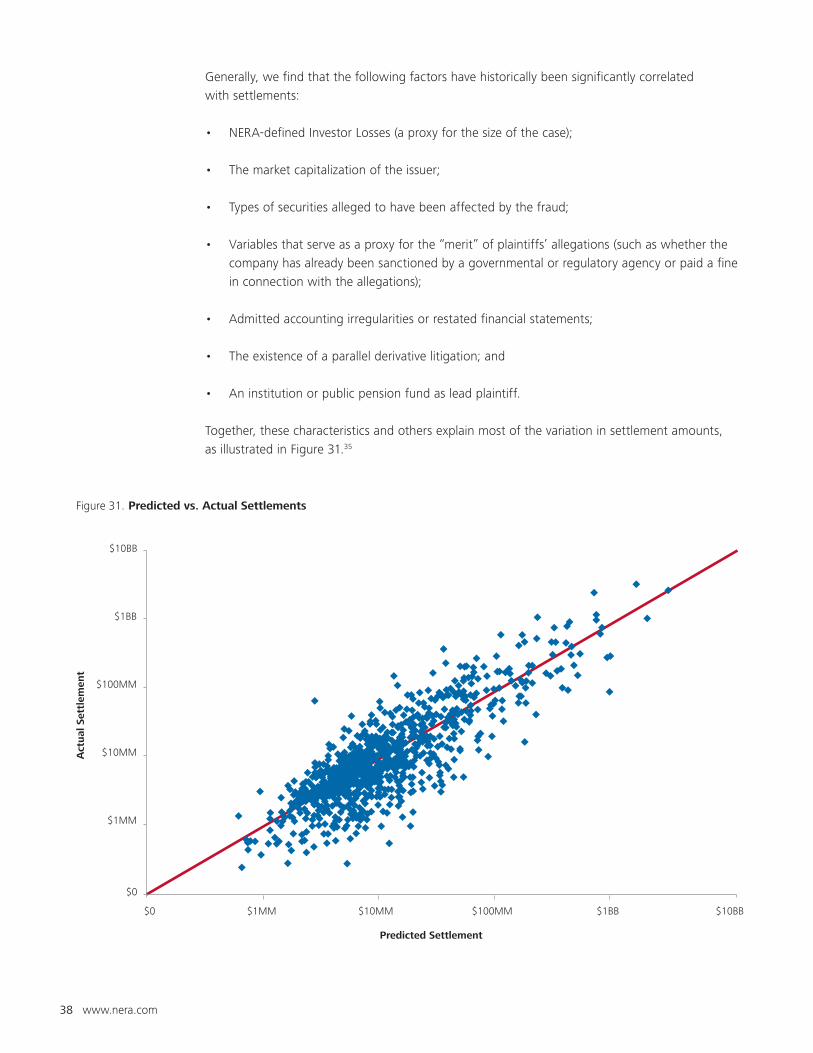
Generally, we find that the following factors have historically been significantly correlated
with settlements:
• NERA-defined Investor Losses (a proxy for the size of the case);
• The market capitalization of the issuer;
• Types of securities alleged to have been affected by the fraud;
• Variables that serve as a proxy for the “merit” of plaintiffs’ allegations (such as whether the
company has already been sanctioned by a governmental or regulatory agency or paid a fine
in connection with the allegations);
• Admitted accounting irregularities or restated financial statements;
• The existence of a parallel derivative litigation; and
• An institution or public pension fund as lead plaintiff.
Together, these characteristics and others explain most of the variation in settlement amounts,
as illustrated in Figure 31.35
Figure 31. Predicted vs. Actual Settlements
$0
$10BB
Act
ual
Set
tlem
ent
Predicted Settlement
$1MM
$10MM
$100MM
$1BB
$0 $1MM $10MM $100MM $1BB $10BB
www.nera.com 39
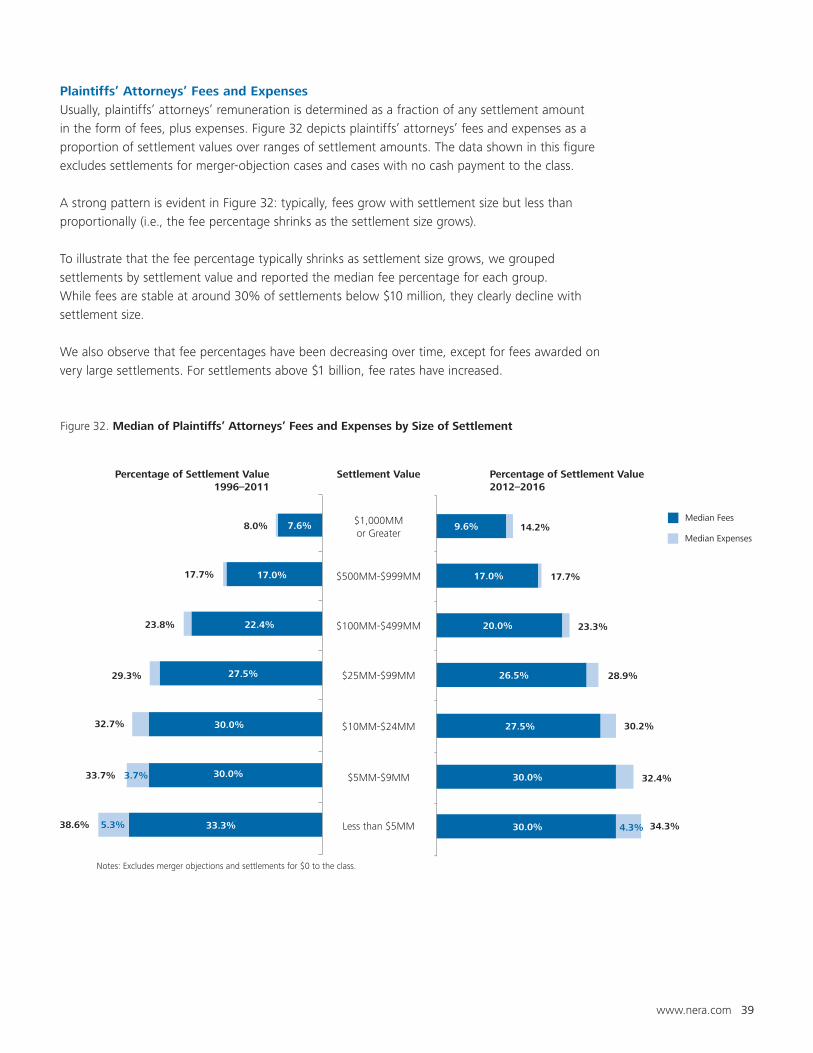
Plaintiffs’ Attorneys’ Fees and Expenses
Usually, plaintiffs’ attorneys’ remuneration is determined as a fraction of any settlement amount
in the form of fees, plus expenses. Figure 32 depicts plaintiffs’ attorneys’ fees and expenses as a
proportion of settlement values over ranges of settlement amounts. The data shown in this figure
excludes settlements for merger-objection cases and cases with no cash payment to the class.
A strong pattern is evident in Figure 32: typically, fees grow with settlement size but less than
proportionally (i.e., the fee percentage shrinks as the settlement size grows).
To illustrate that the fee percentage typically shrinks as settlement size grows, we grouped
settlements by settlement value and reported the median fee percentage for each group.
While fees are stable at around 30% of settlements below $10 million, they clearly decline with
settlement size.
We also observe that fee percentages have been decreasing over time, except for fees awarded on
very large settlements. For settlements above $1 billion, fee rates have increased.
Figure 32. Median of Plaintiffs’ Attorneys’ Fees and Expenses by Size of Settlement
Median Fees
Median Expenses
30.0%
30.0%
27.5%
26.5%
20.0%
17.0%
9.6%
4.3%
$5MM-$9MM
$10MM-$24MM
$25MM-$99MM
$100MM-$499MM
$500MM-$999MM
7.6%
17.0%
22.4%
27.5%
30.0%
30.0%
33.3%
8.0%
17.7%
23.8%
29.3%
32.7%
33.7% 3.7%
38.6% 5.3%
14.2%
17.7%
23.3%
28.9%
30.2%
32.4%
34.3%
Settlement Value Percentage of Settlement Value2012–2016
Percentage of Settlement Value1996–2011
$1,000MMor Greater
Less than $5MM
Notes: Excludes merger objections and settlements for $0 to the class.
40 www.nera.com
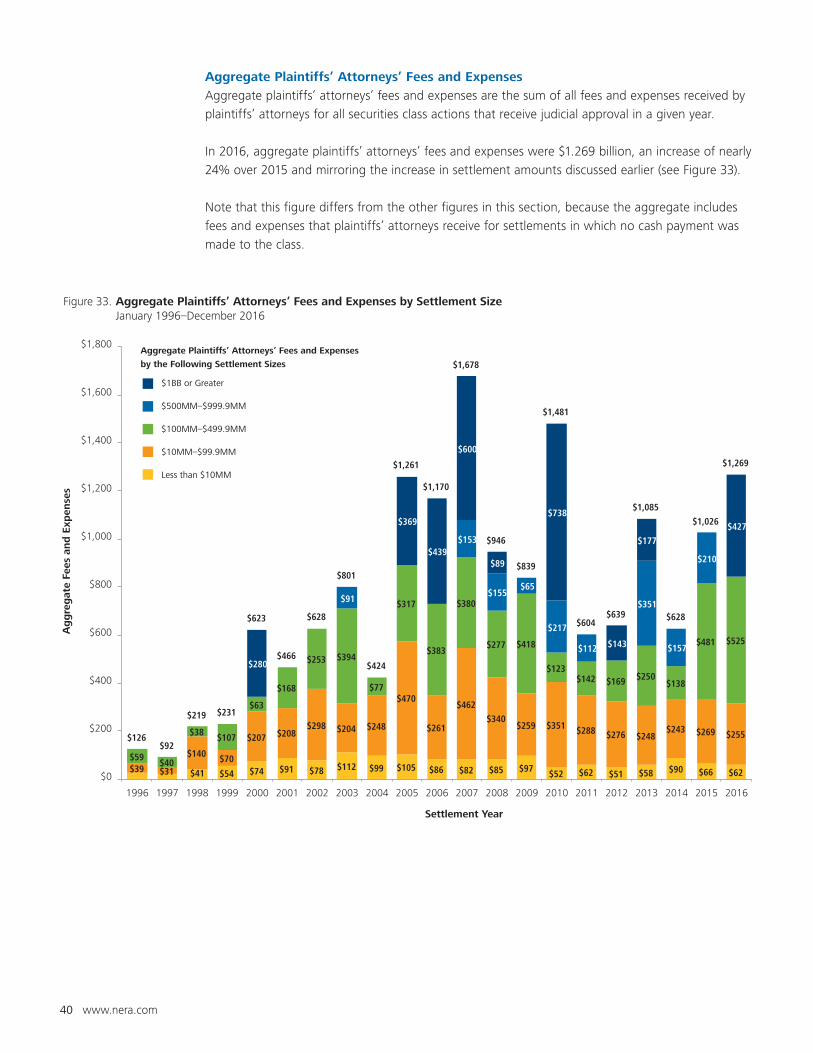
Aggregate Plaintiffs’ Attorneys’ Fees and Expenses
Aggregate plaintiffs’ attorneys’ fees and expenses are the sum of all fees and expenses received by
plaintiffs’ attorneys for all securities class actions that receive judicial approval in a given year.
In 2016, aggregate plaintiffs’ attorneys’ fees and expenses were $1.269 billion, an increase of nearly
24% over 2015 and mirroring the increase in settlement amounts discussed earlier (see Figure 33).
Note that this figure differs from the other figures in this section, because the aggregate includes
fees and expenses that plaintiffs’ attorneys receive for settlements in which no cash payment was
made to the class.
Figure 33. Aggregate Plaintiffs’ Attorneys’ Fees and Expenses by Settlement Size January 1996–December 2016
$1BB or Greater
$500MM–$999.9MM
$100MM–$499.9MM
$10MM–$99.9MM
Less than $10MM
Aggregate Plaintiffs’ Attorneys’ Fees and Expenses
by the Following Settlement Sizes
$54 $74 $91 $78 $112 $99 $105 $86 $82 $85 $97 $52 $62 $51 $58 $90 $66 $62$39 $31
$140
$41
$70
$207 $208$298 $204 $248
$470
$261
$462
$340$259 $351 $288 $276 $248
$243 $269 $255
$59$40
$38 $107
$63
$168
$253 $394
$77
$317
$383
$380
$277 $418
$123$142 $169 $250
$138
$481 $525
$91
$153
$155$65
$217
$112
$351
$157
$210
$280
$369
$439
$600
$89
$738
$143
$177
$427
$126$92
$219 $231
$623
$466
$628
$801
$424
$1,261
$1,170
$1,678
$946
$839
$1,481
$604$639
$1,085
$628
$1,026
$1,269
$0
$200
$400
$600
$800
$1,000
$1,200
$1,400
$1,600
$1,800
1996 1997 1998 1999 2000 2001 2002 2003 2004 2005 2006 2007 2008 2009 2010 2011 2012 2013 2014 2015 2016
Ag
gre
gat
e Fe
es a
nd
Exp
ense
s
Settlement Year
www.nera.com 41
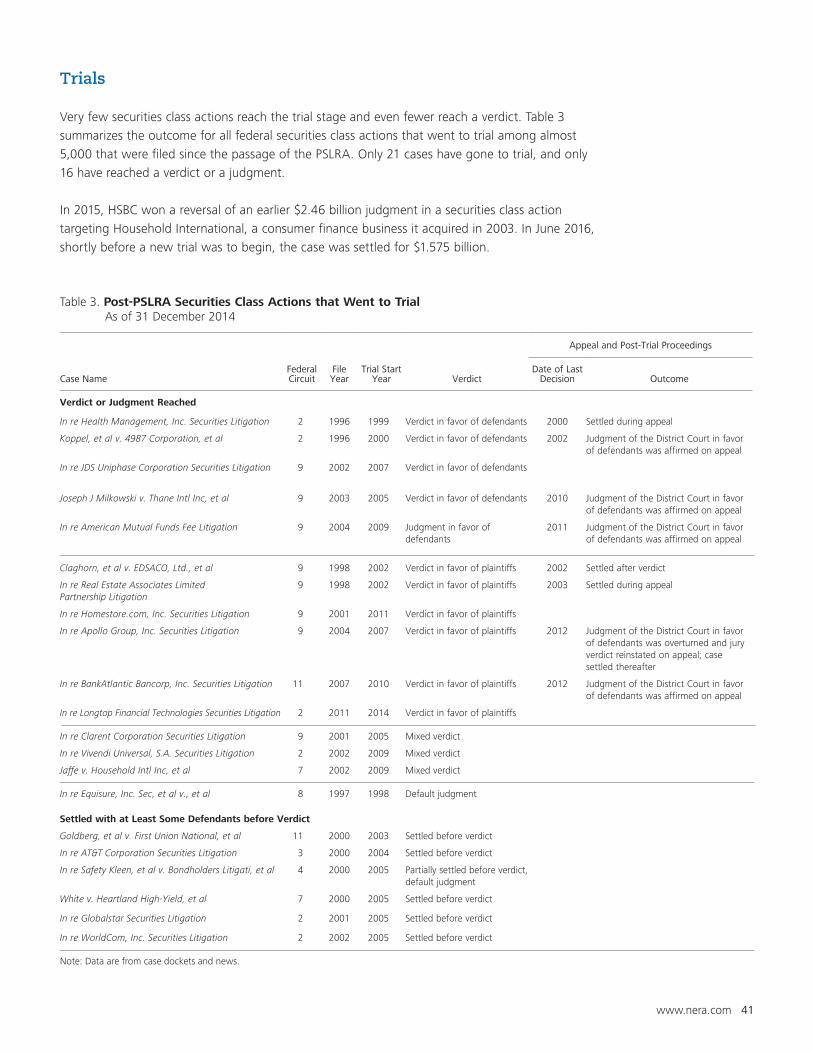
Trials
Very few securities class actions reach the trial stage and even fewer reach a verdict. Table 3
summarizes the outcome for all federal securities class actions that went to trial among almost
5,000 that were filed since the passage of the PSLRA. Only 21 cases have gone to trial, and only
16 have reached a verdict or a judgment.
In 2015, HSBC won a reversal of an earlier $2.46 billion judgment in a securities class action
targeting Household International, a consumer finance business it acquired in 2003. In June 2016,
shortly before a new trial was to begin, the case was settled for $1.575 billion.
Table 3. Post-PSLRA Securities Class Actions that Went to Trial As of 31 December 2014
Case NameFederal Circuit
FileYear
Trial Start Year Verdict
Appeal and Post-Trial Proceedings
Date of Last Decision Outcome
Verdict or Judgment Reached
In re Health Management, Inc. Securities Litigation 2 1996 1999 Verdict in favor of defendants 2000 Settled during appeal
Koppel, et al v. 4987 Corporation, et al 2 1996 2000 Verdict in favor of defendants 2002 Judgment of the District Court in favor of defendants was affirmed on appeal
In re JDS Uniphase Corporation Securities Litigation 9 2002 2007 Verdict in favor of defendants
Joseph J Milkowski v. Thane Intl Inc, et al 9 2003 2005 Verdict in favor of defendants 2010 Judgment of the District Court in favor of defendants was affirmed on appeal
In re American Mutual Funds Fee Litigation 9 2004 2009 Judgment in favor of defendants
2011 Judgment of the District Court in favor of defendants was affirmed on appeal
Claghorn, et al v. EDSACO, Ltd., et al 9 1998 2002 Verdict in favor of plaintiffs 2002 Settled after verdict
In re Real Estate Associates Limited Partnership Litigation
9 1998 2002 Verdict in favor of plaintiffs 2003 Settled during appeal
In re Homestore.com, Inc. Securities Litigation 9 2001 2011 Verdict in favor of plaintiffs
In re Apollo Group, Inc. Securities Litigation 9 2004 2007 Verdict in favor of plaintiffs 2012 Judgment of the District Court in favor of defendants was overturned and jury verdict reinstated on appeal; case settled thereafter
In re BankAtlantic Bancorp, Inc. Securities Litigation 11 2007 2010 Verdict in favor of plaintiffs 2012 Judgment of the District Court in favor of defendants was affirmed on appeal
In re Longtop Financial Technologies Securities Litigation 2 2011 2014 Verdict in favor of plaintiffs
In re Clarent Corporation Securities Litigation 9 2001 2005 Mixed verdict
In re Vivendi Universal, S.A. Securities Litigation 2 2002 2009 Mixed verdict
Jaffe v. Household Intl Inc, et al 7 2002 2009 Mixed verdict
In re Equisure, Inc. Sec, et al v., et al 8 1997 1998 Default judgment
Settled with at Least Some Defendants before Verdict
Goldberg, et al v. First Union National, et al 11 2000 2003 Settled before verdict
In re AT&T Corporation Securities Litigation 3 2000 2004 Settled before verdict
In re Safety Kleen, et al v. Bondholders Litigati, et al 4 2000 2005 Partially settled before verdict, default judgment
White v. Heartland High-Yield, et al 7 2000 2005 Settled before verdict
In re Globalstar Securities Litigation 2 2001 2005 Settled before verdict
In re WorldCom, Inc. Securities Litigation 2 2002 2005 Settled before verdict
Note: Data are from case dockets and news.
42 www.nera.com
Notes
1 This edition of NERA’s report on recent trends in
securities class action litigation expands on previous
work by our colleagues Lucy Allen, Dr. Renzo Comolli,
the late Dr. Frederick C. Dunbar, Dr. Vinita M. Juneja,
Sukaina Klein, Dr. Denise Neumann Martin,
Dr. Jordan Milev, Dr. John Montgomery,
Robert Patton, Dr. Stephanie Plancich, and others.
The authors also thank Dr. Stephanie Plancich for
helpful comments on this edition. In addition, we
thank Edward Flores and other researchers in NERA’s
Securities and Finance Practice for their valuable
assistance. These individuals receive credit for
improving this paper; all errors and omissions are ours.
2 Data for this report are collected from multiple
sources, including Institutional Shareholder Services
Inc., complaints, case dockets, Dow Jones Factiva,
Bloomberg Finance L.P., FactSet Research Systems, Inc.,
US Securities and Exchange Commission (SEC) filings,
and public press reports.
3 Craig Doidge, G. Andrew Karolyi, and René M. Stulz,
“The U.S. Listing Gap,” National Bureau of Economic
Research Working Paper No. 21181, May 2015.
4 In re Trulia, Inc. Stockholder Litigation, C.A. No.
10020-CB (Del. Ch. Jan. 22, 2016).
5 “Global M&A Review: Full Year 2016 Final Results,”
Dealogic, January 2007.
6 2010 deal growth and litigation rates obtained from
M. D. Cain and S. D. Solomon, “A Great Game: The
Dynamics of State Competition and Litigation,”
Iowa Law Review, Vol. 100, No. 165, 2015, Table 1.
2016 M&A activity growth obtained from “Global
M&A Review: Full Year 2016 Final Results,” Dealogic,
January 2007.
7 M. D. Cain and S. D. Solomon, “A Great Game: The
Dynamics of State Competition and Litigation,” Iowa
Law Review, Vol. 100, No. 165, 2015.
8 M. D. Cain and S. D. Solomon, “Takeover Litigation
in 2015,” Berkeley Center for Law Business and the
Economy, 14 January 2016.
Alison Frankel, “Forum Selection Clauses Are Killing
Multiforum M&A litigation,” Reuters, 24 June 2014.
9 In re Trulia, Inc. Stockholder Litigation, C.A. No.
10020-CB (Del. Ch. Jan. 22, 2016), n. 36. The Seventh
Circuit decision is In re Walgreen Co. Stockholder
Litigation, No. 15-3799 (7th Cir. Aug. 10, 2016).
10 M. D. Cain and S. D. Solomon, “Takeover Litigation
in 2015,” Berkeley Center for Law Business and the
Economy, 14 January 2016.
11 Daniel Wolf, “Whack-a-Mole: The Evolving Landscape
in M&A Litigation Following Trulia,” Harvard Law
School Forum on Corporate Governance and Financial
Regulation, 25 August 2016.
Donald H. Tucker Jr. and Clifton L. Brinson, “The Death
of Merger Litigation?” Commercial & Business Litigation
Committee, Section of Litigation, American Bar
Association, 8 August 2016.
12 Warren S. de Wied, “Delaware Forum Selection
Bylaws After Trulia,” Harvard Law School Forum on
Corporate Governance and Financial Regulation,
25 February 2016.
13 New York Superior Court decisions include: In re
Allied Healthcare Shareholder Litigation, 2015 WL
6499467, (N.Y. Sup. Ct. Oct. 23, 2015) and City
Trading Fund v. Nye, 2015 WL 93894 (N.Y. Sup.
Ct. Jan. 7, 2015). As referenced in In re Trulia, Inc.
Stockholder Litigation, C.A. No. 10020-CB (Del.
Ch. Jan. 22, 2016), footnote 36. The Seventh Circuit
decision is In re Walgreen Co. Stockholder Litigation,
No. 15-3799 (7th Cir. Aug. 10, 2016).
14 Robert Patton, “Recent Trends in US Securities Class
Actions against Non-US Companies,” NERA Working
Paper, 24 October 2012, available at http://www.nera.
com/publications/archive/2012/recent-trends-in-us-
securities-class-actions-against-nonus-comp.html.
15 Kane Wu, “U.S.-Listed China Firms Hurry Homeward,”
The Wall Street Journal, 17 November 2015.
16 Andrew Bolger, “Warning signs appear after bumper
IPO year,” Financial Times, 26 December 2014.
17 The calculation for these cases is somewhat different
than for cases with 10b-5 claims.
18 In 2016, 13 cases constituted the largest category of
Investor Losses.
19 Andrew Bolger, “U.S. Charges in Generic-Drug Probe
to Be Filed by Year-End,” Bloomberg Markets,
3 November 2016.
20 Eric Kroh, “Poultry Producers Hit With Chicken Price
Antitrust Suit,” Law360, 3 September 2016.
21 See In re Allied Healthcare Shareholder Litigation.,
2015 WL 6499467 (N.Y. Sup. Ct. Oct. 23, 2015) and
City Trading Fund v. Nye , 2015 WL 93894 (N.Y. Sup.
Ct. Jan. 7, 2015). As referenced in footnote 36 of In re
Trulia, Inc. Stockholder Litigation, C.A. No. 10020-CB
(Del. Ch. Jan. 22, 2016).
22 Fraser Tennant, “Global M&A activity down 18 percent
in 2016 says new review,” Financier Worldwide,
5 January 2017.
23 For the purposes of this figure, we considered
only co-defendants listed in the first identified
complaint. Based on past experience, accounting
co-defendants are sometimes added to or excluded
from later complaints.
www.nera.com 43
24 Janus Capital Group, Inc., et al. v. First Derivative
Traders (Docket No. 09-525)
25 Stoneridge Investment Partners v. Scientific-Atlanta,
Inc. (Docket No. 06-43)
26 Deena Shanker, “Why America Pays 50% More for
Chicken,” Bloomberg, 28 September 2016.
27 An alternative possibility is that once detected, full
disclosure is made earlier, turning what would have
been a “partial disclosure” into a complete disclosure.
28 Douglas M. Boyle, James F. Boyle, and Brian W.
Carpenter, “The SEC’s Renewed Focus on Accounting
Fraud, Insights and Implications for Auditors and Public
Companies,” The CPA Journal, February 2014.
29 “SEC’s New Whistleblower Program Takes Effect
Today,” US Securities and Exchange Commission,
12 August 2011.
30 Outcomes of the motions for summary judgment are
available from NERA but not shown in this report.
31 Historically, merger-objection cases tend to be
dismissed within 221 days, compared to an average
of 638 days for other cases. Half of merger-objection
cases have historically been dismissed within 125 days,
versus 524 days for other cases.
32 Svetlana Starykh and Stefan Boettrich, “Recent Trends
in Securities Class Action Litigation: 2015 Full-Year
Review,” NERA Working Paper, 25 January 2016,
available at http://www.nera.com/publications/
archive/2016/2015-Securites-Trends-Report.html.
33 Each of these analyses excludes IPO laddering cases and
merger-objection cases because the former usually take
much longer to resolve and the latter are usually much
shorter to resolve.
34 These settlements exclude those of merger-objection
cases and in cases that settled with no cash payment to
the class.
35 The axes are in logarithmic scale, and the two largest
settlements are excluded from this figure.
About NERA
NERA Economic Consulting (www.nera.com) is a global firm of experts dedicated to applying economic, finance, and quantitative principles to complex business and legal challenges. For over half a century, NERA’s economists have been creating strategies, studies, reports, expert testimony, and policy recommendations for government authorities and the world’s leading law firms and corporations. We bring academic rigor, objectivity, and real world industry experience to bear on issues arising from competition, regulation, public policy, strategy, finance, and litigation.
NERA’s clients value our ability to apply and communicate state-of-the-art approaches clearly and convincingly, our commitment to deliver unbiased findings, and our reputation for quality and independence. Our clients rely on the integrity and skills of our unparalleled team of economists and other experts backed by the resources and reliability of one of the world’s largest economic consultancies. With its main office in New York City, NERA serves clients from more than 25 offices across North America, Europe, and Asia Pacific.
Contacts For further information, please contact:
Dr. David TabakManaging Director
New York: +1 212 345 2176
Stefan Boettrich Senior Consultant
New York: +1 212 345 1968
Svetlana StarykhSenior Consultant
New York: +1 212 345 8931
White Plains: +1 914 448 4123
The opinions expressed herein do not necessarily represent the views of NERA Economic Consulting
or any other NERA consultant.

Visit www.nera.com to learn
more about our practice areas
and global offices.
© Copyright 2017
National Economic Research
Associates, Inc.
All rights reserved.
Printed in the USA.