real estate competition - campus finalist
TRANSCRIPT

111
AN ACQUISTION OF THE PORTFOLIO
1

2
Table of Contents2 2
Strategic Overview3
5
6
7
9
10
11
National Market Overview
Portfolio Summary
West Loop Summary
Cutler Centre
San Diego Summary
Rivers Tower
Los Angeles Summary12
13
14
15
16
17
18
Bryant Plaza
Portfolio Recap
Valuation
Valuation of Debt
Valuation of Property
Assumptions
Recommendations19
20
21
22
23
24
25
Strategic Summary
Due Diligence
Acquisition of the Loans
Debt - Equity
Refinancing
Renovations
Cutler Centre - Upgrades26
27
28
29
30
31
32
Rivers Towers - Upgrade
Bryant Plaza - Upgrade
Exit & Sale
Risk
Recap
Overview & Summary
Expected Returns33
35
36
57
83
93
Appendix
Division 1 – Market Research
Division 2 – Strategic Research
Division 3 - Risk
Division 4 - Valuation
Summary34

33
After conducting appropriate
negotiations and due diligence, we
should move to purchase the
portfolio at a 75% discount to it’s
face value.
We should leverage our lein against
the borrowers equity and our
capacity to limit investor losses to
convert out mezzanine loans to a
proprietary interest in the properties
We should renovate all three
properties to maintain the Class A
classification of the properties.
We are pursuing a minimum multiple
on equity of 2.5x.
Our model indicates that the portfolio
will return a levered IRR of 22.28% and
a levered equity multiple of 4.11x
This exceeds the needs of Sun Rock
Capital’s fund.
Expected Returns
Strategic Overview
SWAPACQUIRE RENNOVATE
3
We believe that we will be in the
end of a strong bull real estate
market in 2018. Thus, we should
sell them
SELL
The current downturn in global real
estate market conditions creates the
opportunity for us to purchase quality
Real Estate assets at a substantial
objective discount.
Investment Thesis
3
We recommend pursuing loan-to-own strategy consistent with the funds targeted returns and overall strategy

444
PORTFOLIO & MARKET OVERVIEW – BUILDING AN ECONOMIC
NARRATIVE
4

5
• GFC-driven Yield spikes appear to have ended
• Research into the principles of mean reversion suggest yield will
compress slowly over the coming decade
Expected Growth Rates Yield Trends
US Property Market
Overview
• The recent decline in global market conditions
has caused a substantial shift in the
commercial real estate industry
• Interest rates are at all an time low – 0.25%
• Commercial prices are currently sitting at 2002-
2003 prices.
• The current interest rate environment is
expected to cause a gradual decrease in yields
over the coming 5-10 years
0.0
20.0
40.0
60.0
80.0
100.0
120.0
1997-12-01 1999-12-01 2001-12-01 2003-12-01 2005-12-01 2007-12-01 2009-12-01
Green Streets - Commercial Property Price Index
• Investors expect rent to grow at an increasing pace
• In the short term, it appears that rent growth will be
outstripped by expense growth and inflation
0.00
2.00
4.00
6.00
8.00
10.00
12.00
14.00
US Delinquency Rates
• Loan Delinquency rates appear to have peaked mid-
2009
• We expect rates to decrease slowly in line with current
interest rate conditions
Our analysis indicates that equity offers better
long-term risk adjusted returns than debt
5

6 A portfolio in context…
• The fund has diversified its
holdings well across major
American cities
• This limits our exposure to
localised disaster and regional
economic volatility
Geographic Diversity
The global financial crisis has forced us to target a minimum MOI of 2.5x
• 67% of used capital has been
deployed to purchase equity
• Current market conditions imply
that a weighting towards equity is
best practice
Investment Vehicle
Office52%
Industrial13%
Hotel16%
Retail19%
• Office buildings are less sensitive
to macroeconomic conditions
than retail or hotels
• This allows them to act as a
relative hedge to current financial
volatility
Building Kind
• 4 properties are expected to
make a loss
• This means that, in order to meet
the portfolio target MOI of 2x, the
remaining capital must be
invested at at least 2.5x
Projected MOI
67%Capital In Equity
1
3
1
3
1
2
1
<0.5 <1 <1.5 <2 <2.5 <3 <3.5

7
• West Loop is a former industrial
center that has experienced a
significant degree of urban
gentrification
• It’s central geographic position
creates an opportunity for high
reach retail businesses such as
bars and restaurants
• The decline of many of Chicago’s
outer suburbs creates substantive
demand for high-wealth,
developed inner-city property
West Loop
West Loop – A growth centre…The West Loop submarket is a substantial growth pocket that persists despite Chicago’s poor economic performance
4000000
4100000
4200000
4300000
4400000
4500000
4600000
4700000
4800000
Chicago Historical and Projected Unemployment Data - 2007-2011
Consumer17%
Services28%
Manufacturing
14%
Construction41%
Chicago
Industry
1641
935
855
730
622
520
494
487
New York
LA
Chicago
DC
Dallas
Atlanta
Houston
San…
Business Service Employers (‘000)

8
Copernicus Landsat 1984
West Loop - Growth and Development Trends
Copernicus Landsat 2010
We believe the fundamental geographic characteristics of the West Loop submarket will drive intrinsic demand growth. A comparison of
satellite imagery shows that the developmental boundaries of Chicago have expanded 200-300% over the past 25 years. This city growth is a
strong driver of demand for centralised real estate assets.

9
5400000
5600000
5800000
6000000
6200000
6400000
6600000
6800000
7000000
7200000
2011 2012 2013 2014 2015 2016 2017 2018
W Location: West Loop
Cutler Centre
• Cutler Centre is a 15-storey Class A office tower located in the West Loop submarket of Chicago.
• 240,000 square feet of office space consisting of well-diversified mix of tenants.
– 82% occupancy rate in office
– Currently in line with market, but was below-market last year
• 10,000 square feet of street-level retail space consisting of the Bank of America, convenience store, and clothing boutique.
– 100% occupancy rate
– Entire rental contract rolls over in 2018
• Rent roll unknown
• Loan structure consists of a senior loan and two mezzanines
Property Overview
SUMMARY
Cutler Towers can act as a lever to access growth in the growing West Loop submarket
NOI Projections

10
• San Diego has been considered a leading
area to launch a company
• San Diego is enclosed by the Laguna
Mountain Range. This creates a premium
for downtown real estate.
• San Diego has been designated a Foreign
Trade Zone. This creates opportunities to
leverage global trade trends
• Property sales reached an all time low of
2,142 in January 2008
• Currently, sales sit at around 3000 –
substantially lower than the historical
mean of 4,000-4,500
• Auction success rates are at an all time
low
Downtown San Diego
Downtown San Diego – Dense development
San Diego Property Sales 2000-10
0%
20%
40%
60%
80%
100%
120%
2001 2002 2003 2004 2005 2006 2007 2008 2009 2010
Auction Success Rates 2000-10
We can capitalize on poor market conditions to ride San Diego’s growing technology and trade industries

11
6400000
6600000
6800000
7000000
7200000
7400000
7600000
7800000
8000000
2011 2012 2013 2014 2015 2016 2017 2018
W Location: Downtown San Diego
Rivers Tower
• Rivers tower is a 20-storey Class A office
tower located in the San Diego CBD.
• 500,000 square foot of office space
consisting of a diversified tenant mix
– 75% occupancy rate
– Below-market
• No major capex has been invested and
no major renovations have been made
• Rent roll unknown
• Loan structure consists of a senior loan
and two mezzanines
Property Overview
SUMMARY
Rivers Tower will give us access to the Downtown San Diego submarket
NOI Projections

12
• The Los Angeles Property
Market appears to have
bottomed out
• Trade volumes, a major driver of
LA economic activity, are at
2003 levels
• Commercial yields have fallen by
over 2% over the past two years
• There has been a substantial
drop in the volume of Real
Estate transactions across the
city
• This indicates that liquidity has
dried up substantially over the
past 1-2 years
• We can leverage this in our debt-
equity swap
• This will also allow us to ride the
inevitable economic recovery
Downtown Los Angeles
Los Angeles – Leveraging a global trade fulcrum
0
2
4
6
8
10
12
19
90
19
91
19
92
19
93
19
94
19
95
19
96
19
97
19
98
19
99
20
00
20
01
20
02
20
03
20
04
20
05
20
06
20
07
20
08
20
09
20
10
20
11
20
12
20
13
20
14
20
15
20
16
20
17
20
18
20
19
20
20
Volu
me (
Mill
ion T
EU
)
Port of Los Angeles Trade Volumes - 1990-2020
Poor Real Estate performance creates an opportunity to capture recovery-linked growth
Los Angeles Commercial Yields
Sales Volume

13
3700000
3800000
3900000
4000000
4100000
4200000
4300000
4400000
4500000
4600000
4700000
2011 2012 2013 2014 2015 2016 2017 2018
W Location: Downtown San Diego
Bryant Plaza
• Bryant Plaza is a 15-storey Class A office
tower located in downtown Los Angeles.
The building enjoys excellent visibility
and contains 300 on-site parking spaces.
• 275,000 square foot of office space
occupied by varied tenant groups
– 75% occupancy rate
– Below-market
• Building has undergone a significant
renovation in 2000.
• Loan structure consists of a senior loan
and a mezzanine loan
Property Overview
SUMMARY
Bryant Plaza will give us access to the Downtown Los Angeles submarket
NOI Projections

14
• Real Estate market cycles typical cycle over
between 7-11 years
• The last cycle ended in 2008-2009
• The portfolio could act as a vehicle to leverage
this trend
Fitting the portfolio together…
Economic
Recovery
Market Cycles
MARKETS
West Loop
Increasing
Rent & Yields
If purchase at the right price, the Portfolio may allow us to ride and profit from a global economic recovery
San Diego
Increasing
Rent & Yields
Los Angeles
Increasing
Rent & Yields
US Property Market Cycles

151515
VALUATION – QUANTIFYING VALUE
15

16
W
Valuation of the portfolio: Debt InstrumentsWe should purchase the debt instruments at a 75% discount to their implied value
Rivers Tower $30,851,197
Discount: 70.00%
Purchase Price: $9,255,359
Cutler Centre $20,776,748
Discount: 70.00%
Purchase Price: $6,233,024
Bryant Plaza $55,334,228
Discount: 90.00%
Purchase Price: $5,533,423

17
W
Valuation of the portfolio: Underlying PropertiesPerforming a debt to equity swap would allow us to access the underlying value of these properties

18
CAPITALISATION RATESGROWTH RATESDiscount Rate
9 9 9We have calculated a 9.85%
discount rate
Our rental growth rates are
predicted to grow 2-3% p.a.
We predict a 0.4% decline in
cap rates per year, leading to
an exit cap rate of 5.55%
Assumptions
Discount Rate Assumptions:
Loan Start Date: 01-June-2007
Loan End Date 01-June-2012
Discount Rate: 9.85%
10 Year US Treasury Rate: 3.85%
Real Estate Risk Premium: 6.00%
Rental Growth Rates Assumptions:
Cutler Center 1.2%
Post-Capex 3%
Rivers Tower 2%
Rivers Tower Post Capex 3.85%
Bryant Plaza 2%
Bryant Plaza Post Capex 3%
FRBSF Economic Letter 2011-29 September 19, 2011
2
Cap rates as an indicator of future price returns
The cap rate measures the ratio of net operating income to the price of a property. It can be interpreted
as the CRE equivalent of the price/earnings ratio in the stock market (see Campbell and Shiller 1988 for
the pricing implications of these valuation measures). According to theory, this rent/price ratio is largely
a function of interest rates and expected increases in the property’s price. Consider someone who wants
to use a real estate property for one year. This person can get the space in two ways. He or she could rent
the property for the year, which would cost a year of rent. The rent would appear as part of the property
owner’s net operating income. Alternatively, the person who wants to use the property could borrow
money, buy it, and hold it for a year. The cost of this ownership option, referred to as the user cost,
consists of interest payments on the purchase loan plus the expected change in the property’s price over
the holding period. In a well-functioning market with zero transactions costs, the price of these two
alternatives should be the same. If they were not—if rents were higher than the user cost, for example—
then all market participants would want to buy, bidding up prices until the rental option cost the same.
The important point here is the direct link between the net operating income of the rental option and
prices, ownership costs, and expected capital gains of the ownership option. When purchasing CRE,
market participants often link cap rates to expected future rental rates and vacancies. Expected increases
in rent or lower vacancies tend to lower the cap rate. If rents are expected to increase, then the property
has become more valuable and the owner will expect a higher capital gain, which will lead to a lower cap
rate. A similar argument can be made for falling vacancies.
Thus, expected price appreciation is ultimately a reflection of the outlook for fundamentals such as rents
and vacancies. However, there could also be unidentified nonfundamental reasons for changes in
expected price appreciation. For example, investor sentiment may improve and the discount rate applied
to cash flows from a property may fall, thereby lowering the cap rate. Indeed, investor sentiment could
become so exuberant that a bubble could form, in which expected appreciation soared and the cap rate
dropped sharply.
This link between cap rates, interest
rates, and expected price appreciation
is not merely theoretical. Using a
slightly different representation of the
cap rate, Ghysels, Plazzi, and Valkanov
(2007) show that it predicts CRE
returns. In our data we can see these
linkages in Figure 2, which compares
CRE cap rates with the interest paid on
loans to finance CRE transactions. We
focus here on the office market, but
other CRE asset classes have behaved
similarly. Ideally, the interest measure
should be the rate on new CRE loans,
but those are not readily obtainable.
Instead, we use as a proxy for CRE
purchase loans the yield on AAA-rated five-year commercial mortgage-backed securities (CMBS), which
finance a large share of CRE transactions.
Figure 2
Office building cap rates and CRE mortgage rates
Sources: CB Richard Ellis (CBRE) and Commercial Real Estate Direct.
0
1
2
3
4
5
6
7
8
9
10
0
2
4
6
8
10
12
14
16
18
20
2004 2005 2006 2007 2008 2009 2010 2011
Percent Percent
CMBS yield (left axis)
Office cap rate (right axis)
Summer2010
Our valuation is driven by a 9.85% discount rate, a 2-3% rent growth rate and a 0.4% Cap Rate compression each year

191919
OUR RECOMMENDATIONS AND ADVICE
19

20 Strategic SummaryWe propose purchasing the debt, swapping it to equity, renovating the properties and exiting at the peak of the market in 2018
• Conduct due diligence:
Property Condition
Owner’s Equity
Any binding
agreements
between HRC
Capital, senior debt
holders and owner
• Negotiate an interparty
agreement between owner
Debt to Equity
swap for the
ownership interest
in the property is
viable
Due Diligence
Interparty agreementPrior to Acquisition
• Purchase all Mezzanine
offered at a 75-90%
discount to its value
• Conduct a Debt to Equity
swap
Purchase Mezzanine Debt
• Owner will most likely
default in payments
Senior debt will
be compensated,
but mezzanine
debt may not be
We will not get
our money back
• Do not pursue investment
any further
Do not Purchase Mezzanine
Debt
SWAP
• Refinance the senior debts at a
lower interest rate
• Renovate the office buildings to -
Suit changing
contemporary economic
conditions
Appreciate underlying
value
Occupy Ownership Interest of the
Properties
Owner DefaultsBuy or Pass Exit Strategy
Contingencies
SE
LL
• Exit each office
building in year for a
total of $311M
• Offering a levered IRR
of 22.8%
Exit the Office Buildings
2010-2018

21
Borrowe
r
Senior
Debt
Mezz
Debt
Senior
Debt
Mezz
Debt
Senior
Debt
Bryant Plaza
Cutler Centre
Rivers TowerIs the purchase of the mezzanine loans UCC (Uniform Commercial Code) approved?
Negotiations and Due Diligence Questions
Will inter-creditor agreements interfere with either the purchase of the loan or the Debt-Equity Swap?
What upper-level debt agreements are the properties subject to?
What senior mortgage covenants and restrictions is the property subject to?
Is the borrower willing to swap the mezzanine loans for an equal proprietary interest in the building?
Do the terms of the current capital structure allow for us to refinance immediately?
Due Diligence & NegotiationsWe need to run a number of meetings and operate several due diligence checks before we proceed further…
2010
Due Diligence Checklist
Property & Markets
Borrower Position
Legal Structure & Documents
Other Creditors
Servicing History

22 Acquiring the loans…The debt on the portfolio matures after the next interest payment, thus there is a clear need to refinance
2010
CUTLER CENTRE
ACQUISITION
• Targeting a 70% discount to the
implied, risk free value of the loan.
• Reflective of the fact that the loan will
default as the property and capital
structure are distressed
• The fulcrum position of the loan with
respect to the capital stack as a whole
should allow us to pursue this discount
PURCHASE PRICE: $6.2M
RIVERS TOWER
ACQUISITION
• Target an identical 70% discount to the
implied risk free value of the loan
• Reflective of similar conditions to the
Cutler Centre
PURCHASE PRICE: $9.3M
BRYANT PLAZA
ACQUISITION
• Bryant Plaza’s NOI is two times lower
than their debt service requirements
• Therefore it is the most distressed out
of all three properties
• Thus, we are targeting a 90% discount
to the implied, risk free value of the
loan.
PURCHASE PRICE: $5.5<
THE PORTFOLIO
ACQUISITION
• Overall, we are targeting a weighted
discount of 75.26%
• This is the minimum discount required
to meet the 20% IRR requirement set
out by Sun Rock Capital
PURCHASE PRICE: $21M

23 Performing a debt to equity swapBy nature, mezzanine debt is a more effective vehicle for pursuing loan-to-own strategies
• Mezzanine are more flexible than senior debt
• A debt-equity swap would avoid the borrower public embarrassment
• Mezzanine debt cause a great deal of anxiety among borrowers for the following reasons
• Mezzanine Debt commands a higher interest rate than senior debt, therefore it has a higher chance of default
• If a borrower defaults on a mezzanine loan, the lender foreclose on the equity of the borrower rather than the property
• Estimates of cash flows indicate the borrower will default on their next interest payment
• This will allow the holder of the mezzanine to foreclose on the equity of the borrower
• As a result, a default would be catastrophic for the borrower
• A debt to equity swap would allow the borrower to avoid this issue
PERSUASIVE FACTORS
LEVERAGE
TERMS OF SWAP
TERMS
• We will swap our mezzanine debt at 1:1 ratio, i.e. 1% debt is converted into 1% equity
• We will take on the current obligations subject to the property and owed to senior and other mezzanine debt holders
• We will take management of the property in all areas, such to indicate that we are the sole equity partner and owner of the properties
Borrower
Senior
Debt
Mezzanine
Loan1
Mezzanine Loan
2
Senior
Debt
Mezzanine
Loan1
Owner (Sunrock
Capital)
2010

24 Refinancing the loansThe debt on the portfolio matures after the next interest payment, thus there is a clear need to refinance
2010
CURRENT CAPITAL STRUCTURE
CONDITIONS
Capital Structure Of Properties:
Cutler Center - Chicago
Senior Loan: $35,000,000
First Mezzanine: $30,000,000
Second Mezzanine: $20,000,000
Rivers Tower - San Diego
Senior Loan: $57,000,000
First Mezzanine: $25,000,000
Second Mezzanine: $30,000,000
Bryant Plaza - Los Angeles
Senior Loan: $45,000,000
Mezzanine: $51,000,000
Cutler Centre – Refinanced Capital Structure &
Conditions
Senior Loan:
Principal: $35,000,000
Loan Term (Years): 10
Rate: 4.50%
Amortisation (Years): 30.00
Payment: $2,148,704
First Mezzanine:
Principal: $30,000,000
Loan Term (Years): 7
Rate: 12.00%
Amortisation (Years): IO 7
Payment: $3,600,000
Rivers Tower – Refinanced Capital Structure
& Conditions
Senior Loan:
Principal: $57,000,000
Loan Term (Years): 10
Rate: 4.50%
Amortisation (Years): 30.00
Payment: $3,499,318
First Mezzanine:
Principal: $25,000,000
Loan Term (Years): 7
Rate: 12.00%
Amortisation (Years): IO 7
Payment: $3,000,000
Bryant Plaza – Refinanced Capital Structure &
Conditions
Senior Loan:
Principal: $45,000,000
Loan Term (Years): 10
Rate: 4.50%
Amortisation (Years): 30.00
Payment: $2,762,619
Loan
Structure
TARGETED CAPITAL STRUCTURE
STRUCTURE
We are targeting a 4.5% fixed interest rate
for senior debt. This is derived from similar
loans at the time, and the competing impact
of low interest rates and poor
macroeconomics
We target a 12% fully amortized structure
for mezzanine loans. This will compensate
investors for the risk they are taking.

25 Renovation as a defensive strategy…Renovation is necessary as a defensive move to lock in the Portfolio’s value in the heat of a strong bull market
2018
Renovation
Rationale
MARKET TRENDS
STRUCTURE
• As value and liquidity returns to the
market, competition will follow
• There will be strong growth in the
number and value of new property
projects
• In order to be competitive in this
environment, we need to keep our
property up to date
CONSUMER TRENDS
STRUCTURE
• At the peak of the market, there will be
a set of consumer demands which will
become standard for Class A
properties
• We must ensure that our properties are
sufficiently equipped to meet the
demands of both tenants in purchasers
in 2018
BUILDING CLASSIFICATION
STRUCTURE
• If we do not ensure sufficient Capex, it
is possible several properties may be
downgraded to Class B

26 Cutler Centre – Creating a luxury entertainment space…The retail space in the Cutler Centre can be renovated and upgraded to leverage market cycles
We propose upgrading and reconfiguring the
10,000sqft of retail space, with the following
proportions of rental space in mind;
• 40% of rental space dedicated towards
formal luxury dining
– This establishes a convenient platform for
office tenants to use as a meeting and
entertaining space
• 40% of rental space dedicated towards
casual dining
– This leverages the catering needs of office
space tenants
• 20% of rental space dedicated towards a
bar or other licensed facility
– This helps meet the entertainment and
social needs of tenants
Luxury Entertaining
UPGRADE
An analysis of large scale retail space
renovations indicates an average cost of
between $340-1200 sq ft. We believe our
renovations will cost roughly $5M
Costings
EVALUATION
Measuring Return
RESULTS
2013-2014
26
3%Post Value Add Growth Rate
1-1.5%Decrease in exit Cap Rate

27 Rivers Tower – Stronger communities…Updating shared spaces within the River Tower will drive down exit yields while increasing NOI
We propose renovating the
estimated 24,000 square feet of
lobby and shared space in Rivers
Tower. This will be critical to
decreasing the vacancy rates,
increasing rates and compressing
exit yields
• As we are aiming to sell at the
peak of the market in 2018 , we
believe it is critical to ensure the
building is designed well
– As such, we have allocated
capital towards graphic
design and architecture
Lobby & Shared Space Upgrades
UPGRADE
An analysis of large scale office space
renovations indicates an average cost of
between $200-300 sq. ft. We believe our
renovations will cost roughly $6M.
Costings
EVALUATION
Measuring Return
RESULTS
2013-2014
27
Post Value Add Growth Rate
1-1.5%Decrease in exit Cap Rate
2%
4.9-7M Value Add

28 Bryant Plaza – Changing the platformWe can elevate Bryant Plaza’s value by changing the way space is utilized and leveraging it’s geographic position
We are proposing two major changes to
Bryant Plaza
Rooftop Bar
• The excellent views offered by Bryant
Plaza create the opportunity for us to
build a rooftop bar
• This would drive up rent in 2018-19,
increasing the sale price
Underground Carpark
• Bryant Plaza’s access to motorways
creates an opportunity to generate
excess cash returns
• The Los Angeles population uses cars
heavily
Parking & Bars
UPGRADE
An analysis of large scale retail space
renovations indicates an average cost of
between $450 sqft. We believe our renovations
will cost roughly $6M
Costings
EVALUATION
Measuring Return
RESULTS
2013-2014
Generates 1.8 extra
revenue per annum
Present Value of
6.8M

29 Exiting the position - Selling and Profiting…The debt on the portfolio matures after the next interest payment, thus there is a clear need to refinance
2018
5.5%
Target Exit
Cap Rate
311.4
USD Exit
River
Tower
125.7M
USD
Bryant
Plaza
74.6M
USD
Cutler
Center
111M
USD
130M USD Levered
Free Cash Flow in Year
8
WHY SELL IN 2018?
Market Cycles
Our analysis indicates that the
market will peak between 2017 and
2020.
In order to be conservative and
avoid mistiming the market, we
believe 2018 is strong target sale
period
Capitalization Rates
We believe the current interest rate
environment will persist in general
terms for the next decade
This, along with the general
economic recovery, will compress
capitalisation rates and thus
increase our sale price

30
Increasing Likelihood
Incre
asin
g Im
pact
Strategic
Failure
Macroeconomic
Challenge
Tenant
Risk Matrix
Overview: Commercial properties are
sensitive to market conditions.
Due to the post-recession environment,
unemployment rates and US office market
vacancy rates has increased steadily across
the nation.
We believe these factors may impact our
ability to find quality tenants when rents
rollover in 2012.
Overview: Delinquency rates of commercial
real estate loans are rising rapidly and the
market currently holds record levels of
outstanding commercial debt mortgage.
Rent growth and net absorption has also
experienced declines. We believe these
factors proposes a risk of tenants’ default on
lease repayments or loans.
Overview: We believe we will be exposed to
interest rate risks when we refinance our
loans.
Additionally, the presence of Mezzanine
loans on two of the properties, which will lein
on SunRock, need to managed carefully.
Strategic Risks Overview:
Exposure to senior debt risk.
Construction and renovation risks
due to impacted construction
industry.
Macroeconomic Risk
Tenant Risk
Financing Risk
Strategic Risk
Financing
Failure
Analysing Risk…The debt on the portfolio matures after the next interest payment, thus there is a clear need to refinance

31 Recapping our strategyWe believe that performing a debt to equity conversion will allow us to deliver results in line with our portfolio’s needs
21M USD
Purchase
Equity Injection
17M USD
130M USD
Free Cash Flow
Exit
27M USD
After conducting appropriate
negotiations and due diligence, we
should move to purchase the
portfolio at a 75% discount to it’s
face value.
We should leverage our lein against
the borrowers equity and our
capacity to limit investor losses to
convert out mezzanine loans to a
proprietary interest in the properties
We should renovate all three
properties to maintain their class A
classification.
SWAPACQUIRE
RENNOVATE
We believe that we will be in the
end of a strong bull real estate
market in 2018. Thus, we should
sell them
SELL

323232
SUMMARY AND OVERVIEW
32

33 Valuing our returnsWe believe that performing a debt to equity conversion will allow us to deliver results in line with our portfolio’s needs
Cutler Centre – West Loop, CH
Bryant Plaza, Downtown, LA
Rivers Tower – Downtown, SD The PortfolioProperty Returns
Unlevered IRR: 63.20%
Unlevered Equity Multiple: 13.70 x
Levered IRR: 22.69%
Levered Equity Multiple: 4.55 x
Property Returns:
Unlevered IRR: 48.12%
Unlevered Equity Multiple: 9.28 x
Levered IRR: 25.94%
Levered Equity Multiple: 4.41 x
Return Metrics
Unlevered IRR: 55.96%
Unlevered Equity Multiple: 11.47 x
Levered IRR: 22.28%
Levered Equity Multiple: 4.11 x
130M
Levered
Sale
27M Free Cash
Flow Equity
(excluding sale)
48M
Levered
Sale
6M Free Cash
Flow Equity
(excluding sale)
47M
Levered
Sale
2.68M Free Cash
Flow Equity
(excluding sale)
35.6M
Levered
Sale
17M Free Cash
Flow Equity
(excluding sale)
Property Returns:
Unlevered IRR: 56.61%
Unlevered Equity Multiple: 11.53 x
Levered IRR: 19.06%
Levered Equity Multiple: 3.56 x

34 Recapping our presentationWe believe that performing a debt to equity conversion will allow us to deliver results in line with our portfolio’s needs
Acquisition
and Due
Diligence
Debt-
Equity
Swap
Holding &
Renovation
Sale & Exit
Due Diligence Checklist
Property & Markets
Borrower Position
Legal Structure & Documents
Other Creditors
Servicing History
21M Portfolio Purchase
LEVERAGE
We believe that our
claim against the
borrowers equity
and said borrowers
poor financial
position will
persuade the
borrower to accept
our DIL
Persuasive Factors
UPGRADES
Renovations are
necessary as a
defensive move to
ensure that the
property remains
Class A and can
fully capture the
economic recovery
Defensive Renovations
BEGINNINGS RETURNS
Expected Returns
Return Metrics
Unlevered IRR: 55.96%
Unlevered Equity
Multiple: 11.47 x
Levered IRR: 22.28%
Levered Equity Multiple: 4.11 x

353535
APPENDIX
35

363636
APPENDIX DIVISION 1 – MARKET RESEARCH
36

37
W
US Property Market Information
CRE Index
• Moodys/REAL commercial property price index
• (CPPI) is based on actual repeat sales of a
large sample of CRE properties
• Transaction-based index (TBI) also uses sales
prices, but employs a different index
methodology and a smaller property sample.
• Figure 1 shows the behaviour of the
aggregated all-properties CPPI and TBI
indexes from 2004 and 2011
FRBSF ECONOMIC LETTER 2011-29 September 19, 2011
Cap Rates and Commercial Property Prices BY BART HOBIJN, JOHN KRAINER, AND DAVID LANG
Commercial real estate capitalization rates have been found to be good indicators of expected
returns in commercial properties. Recent declines in these cap rates appear to be signaling a
commercial real estate rebound, indicating improved investor expectations of price growth in
the market. Movements in national cap rates are the predominant drivers of changes in cap
rates in local markets. Therefore, the anticipated commercial real estate rebound is likely to be
widespread across many metropolitan areas.
The total value of U.S. private nonresidential structures, including office, industrial, and retail
properties, is about $11 trillion, according to the U.S. Commerce Department’s Bureau of Economic
Analysis. That compares with an estimated $17 trillion in the total value of residential structures in the
United States. Given the size of the market for commercial real estate (CRE), it is important to
understand CRE price movements. The Massachusetts Institute of Technology Center for Real Estate
publishes two widely used CRE price measures. The Moodys/REAL commercial property price index
(CPPI) is based on actual repeat sales of a large sample of CRE properties. The transaction-based index
(TBI) also uses sales prices, but
employs a different index methodology
and a smaller property sample. Figure
1 shows the behavior of the aggregated
all-properties CPPI and TBI indexes
from 2004 to 2011.
From the second quarter of 2007
through the fourth quarter of 2009,
both indexes dropped sharply, with the
CPPI falling 41% and the TBI 39%.
However, since the beginning of 2010,
these indexes have been painting very
different pictures. The CPPI indicates
that, since the end of 2009, CRE prices
have slid 7%. But the TBI indicates that
CRE prices have actually risen 19%
over that period. This unusual
deviation in these two indexes raises
the questions of whether CRE prices are currently recovering and how prices are likely to behave going
forward. To explore what may happen to these prices, we consider the capitalization rate, or cap rate for
short, as an alternative indicator of CRE valuations.
Figure 1
Two measures of commercial real estate prices
Sources: Moodys/MIT Center for Real Estate. Both indexes are based on
“all properties.”
50
60
70
80
90
100
110
2004 2005 2006 2007 2008 2009 2010 2011
Index
CPPI
TBI

38
W
Situational Overview
Context
Current date and location: North America Jan 1 2010
Unemployment topped 10% at end of 2009
Central business district offices fell about 53% from 2007 levels – this class is closely related to unemployment and hiring trends
Market may bottom out in 2010 – office vacancies touching 19% -any recovery for offices dependent on jobs
Some areas weathered the downturn better than others – location is important – focus on locations with educated workforces, strong population growth, prevalence of desirable industries such as IT
Deal activity going forward to be focused on modern, well leased, stable cash flow, well positioned assets – outside these markets, recovery will lag for some time
Overall delinquency rate (number of loans with delinquency payments/total number of loans held) has more than doubled since Aug 2008
Loans on properties in secondary markets are delinquent at about 2x the rate of those loans on primary market properties
Investor profile
SunRock Capital – opportunistic, global real estate investment management company
Core (Core plus): least risky because often target stabilised, fully leased, secure investments in core markets; well kept and require no improvements by owner; usually warrants low leverage acquisitions
Value add: seek to increase cash flow over time by making improvements to or reposition property; medium to high leverage used to acquire
Opportunistic: require significant rehabilitation; usually fully vacant upon acquisition or need to be developed from the ground up; offer highest level of return if successful; bears most risk as property has no in-place cash flow; usually high leverage acquisitions
HQ in NYC
Past strategies: high yield superior risk adjusted returns; significant renovations of properties, foreclosures (loan to own scenarios –acquisition of secured debt position to influence control and ultimately acquire ownership of target); asset repositioning where relevant
Most recent fund – SRC Capital VI
Closed in Q1 2009 with $1.5b in equity from pension funds, endowments, sovereign wealth funds, HNW individuals
Target gross returns of 20% IRR and 2x equity multiple on investment
MOI – multiple on investment

39
W
Situational Overview
The opportunity
Off market opportunity with another real estate private equity fund (HRC Capital)
Opportunity: Buy a portfolio of 3 loans on class A office buildings in 3 different North American cities
Classes reflect different risk and return – graded on location, physical characteristics, tenant levels, rental income etc.
Class A = highest quality building in the area and market; generally newer properties built within the last 15 years with top amenities, high income earning tenants and low vacancy rates; well located in the market and typically professionally managed; typicallydemand highest rent with little or no deferred maintenance issues
While HRC waits for our response, the loans will move between 60-90c on the dollar
Each loan is at the fulcrum point in the capital stack of the corresponding property
Capital fulcrum point – measures the annual % growth rate required from the underlying instrument for you to do equally well in terms of capital appreciation from its associated warrant (security that entitles the holder to buy the underlying stock of the issuing company at a fixed price called exercise price until the expiry date); the indifference point between buying a warrant rather than the stock in a company
Warrants are derivative instruments, are dilutive (Receive new stock when exercised), do not pay dividends or come with voting rights; traditional warrants are issued with bonds
ALL LOANS MUST BE PURCHASED IF THE DECISION IS BUY
40
W
Situational Overview
Portfolio & asset history
Loans originated from part of a larger office portfolio acquisition at the peak of the market in 2007
Sponsor expected to find easy refinancing for the Class A, iconic assets when loans matured in mid-2012, given the properties’ (now aggressive) underwriting and assumed steady property market increases
Properties are geographically dispersed
Portfolio relatively uniform in quality
The 3 buildings backing the loans are of a representative quality
Loans organised in complex structure
Debt was split and syndicated to multiple parties, including CMBS and mezzanine debt holders
Commercial mortgage backed securities (CMBS) – type of MBS secured by mortgages on commercial properties. CMBSs are a group of commercial loans on properties such as apartment complexes, factories, office buildings etc. that are bucketed into various tranches (usually 3-4). Tranches are ranked from senior (highest quality) to lowest quality
Mezzanine debt - occurs when a hybrid debt issue is subordinated to another debt issue from the same issuer. Mezzanine debt has embedded equity instruments attached, often known as warrants, which increase the value of the subordinated debt and allow greater flexibility when dealing with bondholders; enables firm to gain capital without offering any collateral, if business defaults on the loan, the lender can convert its loan into an ownership stake using options or warrants built into the deal; charges higher interest rate (usually 15-18%) due to
lack of due diligence, higher risk and is subordinate to higher forms of debt; The value of the warrant is a floating number based on the future value of the company
Mezzanine debt v senior debt: Mezzanine debt is a hybrid form of capital that is part loan and part investment. Senior debt is a loan from a bank. There are many differences between the two. Banks lend off of asset values so most senior loans are collateralized with assets. The bank loan is always secured and in the first position. Mezzanine debt is not collateralized by assets and is usually in the second position with assets. Mezzanine loans are made against the cash flow, not the assets of the business. Because of this feature, mezzanine debt providers use different criteria than banks in qualifying borrowers. They look closely at their EBITDA, their EBITDA margins, and the strength of their historical cash flow.
When market declined and office portfolio didn’t perform to underwritten projections, delinquencies weighed on the 3 loans in the portfolio
Sponsor worked with lenders on several strategies to consolidate loans and get them out of delinquency
After successfully bringing the loans up to date, holder of mezzanine pieces (HRC Capital) decided to market the loans
HRC offered a potential off market deal to SunRock before bringing the opportunity to more investors
HRC (the borrower) is an established private equity fund – specialises on owning and operating office assets across US (bulk of portfolio in top quality assets in major urban markets such as NYC and WDC)

41
W
US Property Market Information
• The Federal Reserve left the target range for its
federal funds rate unchanged at 1 percent to
1.25 percent during its July 2017 meeting and
said it will start reducing its USD 4.5 trillion
portfolio relatively soon.
• The committee considered near-term risks to
the economic outlook as roughly balanced, but
said it will closely monitor inflation
• Interest Rate in the United States averaged
5.78 percent from 1971 until 2017, reaching an
all time high of 20 percent in March of 1980
and a record low of 0.25 percent in December
of 2008.

42
W
US Property Market Information
Capitalisation Rates
• If rents are expected to increase
property has become more valuable
owner will expect a higher capital gain
lead to a lower cap rate
• During GFC, CRE prices dropped about
40% and the market for financing CRE
transactions was severely disrupted,
resulting in very high CMBS yields.
• Since summer 2010, yields on highly
rates CMBS have increased about
0.30%. However, cap rates have come
down 0.50%.
– Decline in cap rates despite the slight
increase in interest rates suggest that
investor expectations for CRE price
appreciation have strengthened
FRBSF Economic Letter 2011-29 September 19, 2011
2
Cap rates as an indicator of future price returns
The cap rate measures the ratio of net operating income to the price of a property. It can be interpreted
as the CRE equivalent of the price/earnings ratio in the stock market (see Campbell and Shiller 1988 for
the pricing implications of these valuation measures). According to theory, this rent/price ratio is largely
a function of interest rates and expected increases in the property’s price. Consider someone who wants
to use a real estate property for one year. This person can get the space in two ways. He or she could rent
the property for the year, which would cost a year of rent. The rent would appear as part of the property
owner’s net operating income. Alternatively, the person who wants to use the property could borrow
money, buy it, and hold it for a year. The cost of this ownership option, referred to as the user cost,
consists of interest payments on the purchase loan plus the expected change in the property’s price over
the holding period. In a well-functioning market with zero transactions costs, the price of these two
alternatives should be the same. If they were not—if rents were higher than the user cost, for example—
then all market participants would want to buy, bidding up prices until the rental option cost the same.
The important point here is the direct link between the net operating income of the rental option and
prices, ownership costs, and expected capital gains of the ownership option. When purchasing CRE,
market participants often link cap rates to expected future rental rates and vacancies. Expected increases
in rent or lower vacancies tend to lower the cap rate. If rents are expected to increase, then the property
has become more valuable and the owner will expect a higher capital gain, which will lead to a lower cap
rate. A similar argument can be made for falling vacancies.
Thus, expected price appreciation is ultimately a reflection of the outlook for fundamentals such as rents
and vacancies. However, there could also be unidentified nonfundamental reasons for changes in
expected price appreciation. For example, investor sentiment may improve and the discount rate applied
to cash flows from a property may fall, thereby lowering the cap rate. Indeed, investor sentiment could
become so exuberant that a bubble could form, in which expected appreciation soared and the cap rate
dropped sharply.
This link between cap rates, interest
rates, and expected price appreciation
is not merely theoretical. Using a
slightly different representation of the
cap rate, Ghysels, Plazzi, and Valkanov
(2007) show that it predicts CRE
returns. In our data we can see these
linkages in Figure 2, which compares
CRE cap rates with the interest paid on
loans to finance CRE transactions. We
focus here on the office market, but
other CRE asset classes have behaved
similarly. Ideally, the interest measure
should be the rate on new CRE loans,
but those are not readily obtainable.
Instead, we use as a proxy for CRE
purchase loans the yield on AAA-rated five-year commercial mortgage-backed securities (CMBS), which
finance a large share of CRE transactions.
Figure 2
Office building cap rates and CRE mortgage rates
Sources: CB Richard Ellis (CBRE) and Commercial Real Estate Direct.
0
1
2
3
4
5
6
7
8
9
10
0
2
4
6
8
10
12
14
16
18
20
2004 2005 2006 2007 2008 2009 2010 2011
Percent Percent
CMBS yield (left axis)
Office cap rate (right axis)
Summer2010

43
W
US Property Market Information
Terminology:
Net Absorption: Absorption is the amount of space
or units leased within a market or submarket over a
given period of time (usually one year).
Absorption considers both construction of new
space and demolition or removal from the market of
existing space. It represents the demand over a
specified period, contrasted with supply.
When supply is less than demand, vacancy
decreases and absorption is positive.
When supply is greater than demand, vacancy
increases and absorption is negative.

44
W
Chicago Property Market Information
Overall, the CBD remains a landlord’s market as
rent continues to increase across all building
classes and fewer concessions are granted. Limited
availability of quality high-rise space coupled with
continued corporate migration into the CBD has
solidified an advantageous environment for
landlords; however, tenants in a position to open
negotiations with landlords in 2017 will be looking at
a more tenant favourable market as approximately
2.3 million square feet are delivered in early 2017.
As this space is delivered to the market, landlords
will seek to avoid losing tenants to the new
developments, which will likely increase
concessions granted to tenants.
Investors see value in Chicago’s assets as they
offer a significant discount in pricing relative to
comparative properties on the coasts and believe
Chicago’s diverse economy and talented workforce
make for strong investments.

45
W
Chicago Property Market Information
• From 2009 – 2015, the vacancy rates
have continually dropped
– Total decline of 3.8%
• Period 2009 had a net absorption of -
1,614,937
– Oversupply of office properties
• Can be explained by the effect of the GFC
that caused a loss of jobs, a decline in real
income, a slowdown in industrial production
and manufacturing and a slump in
consumer spending
• From 2010 – 2011, economy began to
recover as vacancy rates declined and
net absorption levels became positive
again.

46
W
Chicago Property Market Information
• From 2009 – 2015, the vacancy rates
have continually dropped
– Total decline of 3.8%
• Period 2009 had a net absorption of -
1,614,937
– Oversupply of office properties
• Can be explained by the effect of the GFC
that caused a loss of jobs, a decline in real
income, a slowdown in industrial production
and manufacturing and a slump in
consumer spending
• From 2010 – 2011, economy began to
recover as vacancy rates declined and
net absorption levels became positive
again.
• The CBD’s overall vacancy decreased by 70
basis points over the past year, falling from
12.3 percent to 11.5 percent. Vacancy
decreased by at least 50 basis points across all
assets classes, with Class A leading the way
with an 80 basis point decrease during the
fourth quarter.
47
W
Chicago Property Market Information
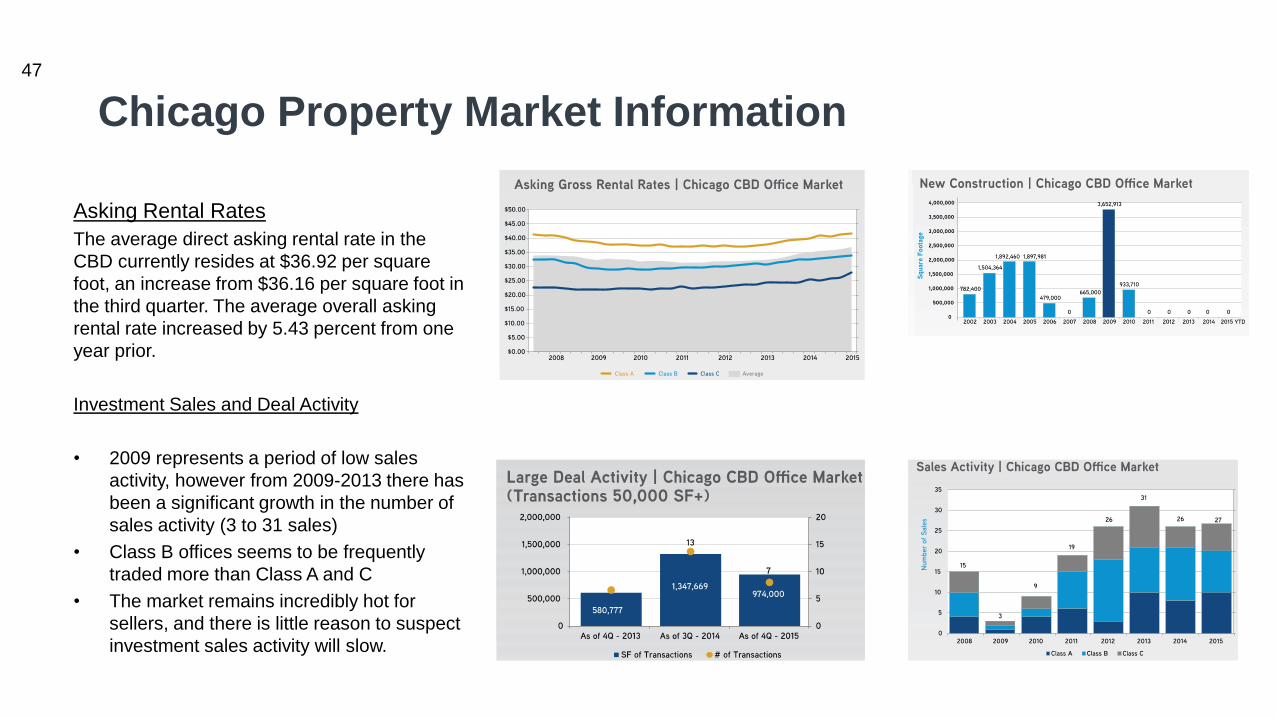
Asking Rental Rates
The average direct asking rental rate in the
CBD currently resides at $36.92 per square
foot, an increase from $36.16 per square foot in
the third quarter. The average overall asking
rental rate increased by 5.43 percent from one
year prior.
Investment Sales and Deal Activity
• 2009 represents a period of low sales
activity, however from 2009-2013 there has
been a significant growth in the number of
sales activity (3 to 31 sales)
• Class B offices seems to be frequently
traded more than Class A and C
• The market remains incredibly hot for
sellers, and there is little reason to suspect
investment sales activity will slow.

48
Chicago Property Market Information

49
W
Los Angeles Property Market Information
• Net Absorption: The absorption rate is the rate at
which available properties are sold in a
specific real estate market during a given time
period. It is calculated by dividing the total number
of available homes by the average number of
sales per month.
cushmanwakefield.com I 5
MARKETBEAT
About Cushman & WakefieldCushman & Wakefield is a leading global real estate services firm that helps clients transform the way people work, shop, and live.
Our 43,000 employees in more than 60 countries help investors and occupiers optimize the value of their real estate by combining
our global perspective and deep local knowledge with an impressive platform of real estate solutions. Cushman & Wakefield is
among the largest commercial real estate services firms with revenue of $5 billion across core services of agency leasing, asset
services, capital markets, facility services (C&W Services), global occupier services, investment & asset management (DTZ
Investors), project & development services, tenant representation, and valuation & advisory. To learn more, visit
www.cushmanwakefield.com or follow @CushWake on Twitter.
Copyright © 2017 Cushman & Wakefield. All rights reserved. The information contained within this report is gathered from multiple
sources considered to be reliable. The information may contain errors or omissions and is presented without any warranty or
representations as to its accuracy.
Greater Los AngelesOffice Q1 2017
OFFICE SUBMARKETS
Cushman & Wakefield
601 S. Figueroa Street
47th Floor
Los Angeles, CA 90017
For more information, contact:
Eric Kenas, Market Director, Research
Tel: +1 213 955 6446
Vincent Chang, Senior Analyst
Tel: +1 213 955 5125
cushmanwakefield.com I 1
MARKETBEAT
Greater Los AngelesOffice Q1 2017
Economic Indicators
Market Indicators (Overall, All Classes)
Overall Net Absorption / Overall Asking Rent
4Q TRAILING AVERAGE
Overall Vacancy
Q1 16 Q1 1712-Month
Forecast
Los Angeles Employment 4.36M 4.44M
Los Angeles Unemployment 5.6% 4.9%
U.S. Unemployment 4.9% 4.8%
Q1 16 Q1 1712-Month
Forecast
Vacancy 14.4% 14.4%
YTD Net Absorption (SF) 1.4M 232K
Under Construction (SF) 1.8M 2.4M
Average Asking Rent* $2.84 $3.13
*Rental rates reflect gross asking $PSF/MO
EconomyU.S. job growth trend remains firmly in place and nonfarm payroll
employment has now increased for 78 consecutive months. Employment
growth in the first quarter of 2017 was solid—averaging 178,000 jobs
per month. The unemployment rate in Los Angeles County reached its
lowest level in 10 years, declining to 4.8% in February. In the last year,
nonfarm employment grew by 70,800, or +1.6%. Education and health
services listed the largest employment gains, adding 31,300 jobs. The
only sector with a reduction in jobs was manufacturing, influenced
primarily by the increasing weakness in the apparel industry.
Unemployment is expected to decline slowly over the next two years as
the county reaches full employment in 2018.
Market OverviewFirst quarter leasing activity of 2.7 million square feet (MSF) fell short of
the 3.5 MSF quarterly average in 2016. Activity was largely concentrated
in LA West with over 1.0 MSF of new leasing and also making up more
than half of the top key transactions. Net absorption was positive for the
14th consecutive quarter, but due to major construction completions in
each of the past four quarters, overall vacancy remained relatively flat
year-over-year (YOY) at 14.4%. New high-end product catering to the
rapidly evolving tenant demands has helped push overall average asking
rental rates to $3.13 per square foot per month (PSF/MO), for an
increase of 10.2% from a year ago. This was the first time since 2008
that there has been such a vigorous YOY increase in average asking
rental rates. Most of this rent growth was attributed to submarkets
outside of the CBD. LA Metro (non-CBD) overall average asking rents
have increased by over +9% YOY, whereas in the CBD they’ve
increased by +4.6%. In a sign of increased demand within the CBD,
prominent tenants are moving into the market and some CBD landlords
are now asking as high as almost $5.00 PSF/MO for premium space.
Investment sales volume by SF outpaced first quarter 2016 by +14%,
reaching 4.1 MSF. With 1.4 MSF or 34% of the transactions occurring in
TriCities, specifically the highest volume in Glendale. There are 3.4 MSF
of office developments in the Greater LA construction pipeline, with
nearly 2.0 MSF delivering by the end of 2017.
OutlookThe office sector is evolving as the definition of creative space broadens
and new tech innovations shape up the modern day workplace. These
new requirements are impacting nearly every submarket in Greater LA.
Office demand is driven by the labor market, and as we approach full
employment leasing should remain robust and continued rent growth is
expected. In 2017, new office supply catering to these demands may
cause vacancy to decline at a more tepid pace. Los Angeles is at the top
of list as an investment target market nationally and sales volume is
anticipated to exceed 2016 levels and with higher per square foot prices.
LOS ANGELES COUNTY
$2.25
$2.50
$2.75
$3.00
$3.25
-500
0
500
1,000
1,500
2012 2013 2014 2015 2016 2017
Net Absorption, KSF Asking Rent, $ PSF
10%
12%
14%
16%
18%
20%
2012 2013 2014 2015 2016 2017
5-Year Historical Average = 16.6%
cushmanwakefield.com I 4
MARKETBEAT
Greater Los AngelesOffice Q1 2017
MARKETTOTAL
BUILDINGS
INVENTORY
(SF)
DIRECT
VACANCY
RATE
OVERALL
VACANCY
RATE
YTD
LEASING
ACTIVITY
(SF)
YTD
OVERALL NET
ABSORPTION
(SF)
UNDER
CONSTRUCTION
(SF)
OVERALL
AVERAGE
ASKING RENT
(ALL CLASSES)*
DIRECT
AVERAGE
ASKING RENT
(CLASS A)*
Los Angeles CBD 54 27,218,777 19.1% 19.9% 253,089 17,749 356,141 $3.42 $3.49
Los Angeles Central (Non-CBD) 140 20,315,970 14.3% 14.3% 128,374 378,046 334,201 $2.63 $2.75
Los Angeles West 416 52,797,801 11.3% 12.3% 1,011,384 (465,863) 1,171,175 $4.51 $4.64
Los Angeles North 407 31,332,528 10.6% 11.0% 506,752 36,897 355,000 $2.40 $2.50
Los Angeles South 249 30,182,254 15.5% 16.1% 447,561 349,126 159,087 $2.35 $2.68
TriCities 195 24,265,956 12.9% 13.8% 196,036 107,111 0 $2.96 $2.96
San Gabriel Valley 170 12,596,238 16.2% 16.5% 161,009 (190,860) 0 $2.15 $2.33
GREATER LOS ANGELES TOTALS 1,631 198,709,524 13.7% 14.4% 2,704,205 232,206 2,375,604 $3.13 $3.47
Key Lease Transactions Q1 2017
PROPERTY SF TENANT TRANSACTION TYPE SUBMARKET
222 W. Sixth Street / Topaz 99,343 Molina Healthcare New Lease Carson / San Pedro
5800 W. Sunset Boulevard / CUE 91,953 Netflix New Lease Hollywood
1299 Ocean Avenue / Wilshire Palisades 61,792 Wilshire & Associates Renewal Santa Monica
2425 Olympic Boulevard / Water Garden 60,772 Amazon New Lease Santa Monica
1000 S. Fremont Avenue / The Alhambra 50,525 Los Angeles Department of Health New Lease Alhambra / Monterey Park
12105 W. Waterfront Drive / The Brickyard 50,098 Loyola Marymount University New Lease Playa Vista
333 S. Grand Avenue / Wells Fargo – North 49,945 Convene New Lease Bunker Hill
2121 Avenue of the Stars / Fox Plaza 48,461 Fox New Lease Century City
8687 Melrose / Pacific Design Center 46,151 Cedars-Sinai New Lease West Hollywood
2000 Avenue of the Stars 44,898 Annenberg Foundation Renewal Century City
655 N. Central Avenue / Glendale Plaza 44,637 UNIM Renewal Glendale
Key Sales Transactions Q1 2017
PROPERTY OFFICE SF SELLER / BUYER PRICE / $PSF SUBMARKET
21271 & 21281 & 21301 Burbank Boulevard
5700 & 5820 Canoga Avenue898,044 Hines Securities / Oaktree Capital $235,500,000 / $262 Woodland Hills
655 N. Central Avenue 529,508 PGIM Real Estate / DivcoWest $179,000,000 / $338 Glendale
611 N. Brand Boulevard 381,841 LNR Partners / Onni Group $83,000,000 / $217 Glendale
100 N. Barranca Avenue / California State
Bank Tower225,920 LNR Partners / Sunny Hills Palladium $37,170,000 / $165 West Covina
10585 / 10635 Santa Monica Boulevard 171,450Alaska Permanent Fund Corporation /
Onni Group$40,700,000 / $237 West Los Angeles
2300 E. Imperial Highway 157,725 VCI Corp / Nant Health $52,000,000 / $330 El Segundo
200 S. Los Robles Avenue 131,807American Realty Advisors / Faring
Capital$46,000,000 / $349 Pasadena
2411 W. Olive Avenue / Buena Vista Plaza 115,130 TIER REIT / Menlo Equities $52,500,000 / $456 Burbank
3330 Cahuenga Boulevard / California Credit
Union Building103,710 Blackstone / 4M Investment Corp $36,000,000 / $347 Universal City / Studio City
520 N. Central Avenue / Central Building 93,644Prudential Investors / Lincoln Property
Company$19,600,000 / $290 Glendale
*Rental rates reflect gross asking $PSF/MO
cushmanwakefield.com I 2
MARKETBEAT
Greater Los AngelesOffice Q1 2017
Los Angeles CBDThe CBD office market improved moderately as overall vacancy rates
finished at 19.9%, representing a 10-basis point (BP) decrease YOY.
CBD overall asking rents are up +3.8% since this time last year,
reaching $3.42 PSF/MO ($41.04 PSF/YR). Class A direct asking rents
are up +1.7% over the quarter, increasing by $0.06 PSF/MO to $3.49
PSF/MO ($0.68 PSF/YR to $41.88 PSF/YR). First quarter leasing activity
of 253,089 SF fell short of the 2016 quarterly average. Increased
demand in Bunker Hill helped this submarket close four of the top five
largest CBD transactions. Convene, a conference and event hosting
firm, signed a lease for nearly 50,000 SF at Wells Fargo North Tower.
The Census Bureau and the State of California took space in Bunker Hill
for 36,000 SF and 24,000 SF, respectively. Overall net absorption was
minimal at 17,700 SF as the CBD mostly saw some intra-market
reshuffling and less in the way of expansions or new tenant migration.
Los Angeles WestThe Los Angeles West office market commands the highest asking
rental rates and continues to post the strongest rent growth. Over the
past year, asking rental rates have increased by +12.8% for all classes
and +13.3% for Class A. Most of this growth was in Playa Vista and
West Hollywood where asking rents are at $5.25 PSF/MO and $4.91
PSF/MO, respectively. This market has seen a growth in inventory as
major office developments delivered in the first quarter; with more to
come online throughout the year. Demand is strong as leasing volume
totaled over 1.0 MSF in the first quarter, over +7% higher than the
quarterly average in 2016. Construction completions in 2017 will bolster
asking rent growth even further, particularly for Class A product.
Although leasing remains healthy, it remains to be seen if the market will
be able to absorb 1.0 MSF of new office supply delivering in 2017.
TriCitiesOffice fundamentals remain solid in TriCities as direct vacancy rates
finished at 12.9%, making it the sixth consecutive quarter in which direct
vacancy rates stayed below 13%. With the addition of sublease space,
the overall vacancy rate finished at 13.8%, below the average vacancy
rate of 14% from the preceding five years. Overall asking rental rates in
TriCities increased by +2.3% over the quarter, finishing at $2.96
PSF/MO. Most of this growth was in Universal City/No. Hollywood where
asking rental rates increased by +6.7% over the quarter to $2.85
PSF/MO. Net absorption of 107,111 SF represented a +54.7% increase
over the strongest performing quarter in 2016. Burbank captured 76.4%
of TriCities’ first quarter net occupancy gains at 81,886 SF.
Direct Rental vs. Vacancy RateCENTRAL BUSINESS DISTRICT
Direct Rental vs. Vacancy RateTRICITIES
$2.9
2
$2.9
4
$3.1
9
$3.2
2
$3.3
7
$3.4
4
0.0%
5.0%
10.0%
15.0%
20.0%
25.0%
$0.00
$1.00
$2.00
$3.00
$4.00
2012 2013 2014 2015 2016 Q1 2017
PS
F/Y
R
DIRECT GROSS RENTAL RATE DIRECT VACANCY RATE
$2.6
7
$2.7
0
$2.6
6
$2.9
5
$2.8
9
$2.9
6
0.0%
5.0%
10.0%
15.0%
20.0%
$0.00
$1.00
$2.00
$3.00
$4.00
2012 2013 2014 2015 2016 Q1 2017
PS
F/M
O
DIRECT GROSS RENTAL RATE DIRECT VACANCY RATE
Direct Rental vs. Vacancy RateLOS ANGELES WEST
$3
.34
$3
.43
$3
.64
$4
.01
$4
.33
$4
.55
0.0%
5.0%
10.0%
15.0%
20.0%
$0.00
$1.00
$2.00
$3.00
$4.00
$5.00
2012 2013 2014 2015 2016 Q1 2017
PS
F/M
O
DIRECT GROSS RENTAL RATE DIRECT VACANCY RATE

50
W
Los Angeles Property Market Information
• Education and Unemployment
• The highest unemployment rates, in both the City of Los Angeles and Los Angeles County, exist for individuals with an educational attainment of high school or less (Exhibit E-6).
• Residents with a Bachelor’s degree or higher had an unemployment rate of 5.9 percent in the County (7.0 percent in the City) in 2013, roughly half the rate experienced by those at the opposite end of the spectrum—less than a high school education and high school diploma or equivalent reported unemployment rates of 10.1 percent
Executive Summary Los Angeles: People, Industry and Jobs 2014-2019
ii Institute for Applied Economics
Race and Ethnicity
The City of Los Angeles and Los Angeles County as a whole are racially and ethnically diverse. Approximately half of the resident population in both geographies identify as having Hispanic or Latino origins (Exhibit E-4).
Educational Attainment
Educational attainment is a key element in understanding challenges and opportunities present in the available workforce. For an individual, it is a factor in unemployment, earnings potential and poverty status, while from a business perspective, educational attainment of the resident population represents the quality of their labor pool. Areas with high rates of low educational attainment usually face challenges such as higher rates of unemployment and poverty and will therefore use higher levels of public services and resources. The city and county both have a large proportion of their resident population with low levels of educational attainment (Exhibit E-5). Almost 25 percent of the population has less than a high school education and high school graduates (or equivalent) account for an additional 20 percent. As an increased number of jobs require higher skill levels, a shortage of individuals with higher levels of education can result in fewer prospects for their employment, and consequently higher rates of unemployment.
Education and Unemployment
The highest unemployment rates, in both the City of Los Angeles and Los Angeles County, exist for individuals with an educational attainment of high school or less (Exhibit E-6). Residents with a Bachelor’s degree or higher had an unemployment rate of 5.9 percent in the County (7.0 percent in the City) in 2013, roughly half the rate experienced by those at the opposite end of the spectrum—less than a high school education and high school diploma or equivalent reported unemployment rates of 10.1 percent (9.6 percent) and 10.8 percent (11.6 percent) respectively.
48.3%
49.3%
27.0%
28.2%
13.9%
11.2%
8.0%
8.6%
2.2%
2.1%
0.3%
0.3%
0.2%
0.2%
0.2%
0.1%
LA County
City of LA
Exhibit E-4 Race and Ethnicity 2013
Hispanic White Asian
Black Two or More Other Race
Pacific Islander American Indian
Sources: 2013 ACS 1-year estimates
Less than HS
23.1%
Less than HS 25.4%
HS or equivalent
20.4%
HS or equivalent
19.4%
Some College 19.4%
Some College 17.9%
Associates 7.0%
Associates 6.0%
Bachelor's 19.7%
Bachelor's
20.9%
Masters
6.8%
Masters 6.6%
PhD or Prof'l 3.6%
PhD or Prof'l
3.9%
LA County
City of LA
Exhibit E-5 Educational Attainment Population 25 years and over
Population 25+ years: LA County: 6.6 million City of LA: 2.6 million
Source: 2013 ACS 1-year estimates
8.6% 9.2%
10.1% 9.6%
10.8% 11.6%
9.2% 10.0%
5.9%
7.0%
LA County City of LA
Exhibit E-6 Civilian Unemployment Rate by Educational Attainment 2013
Population 25 to 64 years Less than High School
High School or equiv Some college or Associate's Bachelor's or higher
Source: 2013 ACS 1-year estimates
Executive Summary Los Angeles: People, Industry and Jobs 2014-2019
iv Institute for Applied Economics
Exhibit E-12 Industry Employment Growth 2014-2019 in Los Angeles
Annual Average %
Growth
Δ Employment
(000s)
Total Nonfarm Payroll Employment 1.5% 322.0
Good Producing Industries: 0.5% 12.4
Natural Resources and Mining (1.4%) -0.3
Construction 1.8% 11.9
Manufacturing – Durable Goods 0.1% 2.1
Manufacturing – Nondurable Goods (0.0%) -1.2
Service Providing Industries 1.8% 287.6
Wholesale Trade 0.8% 8.6
Retail Trade 0.7% 14.7
Transportation, Warehousing, Utilities 0.7% 5.5
Information 1.4% 14.7
Financial Activities 1.2% 13.1
Professional and Business Services 2.1% 67.8
Educational and Health Services 2.7% 105.6
Leisure and Hospitality 2.3% 54.7
Other Services 0.5% 4.0
Government 0.8% 20.6
Sources: California Employment Development Department; LAEDC
Employment, Industries and Jobs Employment opportunities for residents of Los Angeles County will depend on the health of the regional economy. Los Angeles County was hard hit during the recession, and has experienced a slow and anemic recovery. From an employment base of 4.2 million at the pre-recession peak in December 2007 to a post-recession trough of 3.9 million, the county saw a loss of more than 330,000 jobs, and an unemployment rate reaching a high of 12.6 percent (Exhibit E-10). The City of Los Angeles fared somewhat worse, with an unemployment rate consistently 10 percent above the county average, standing currently at 8.7 percent—both are above the state rate of 7.5 percent, which is also above the national rate, which stood at 6.2 percent in 2014. Recovery of all jobs lost during the recession did not occur until 2015 (Exhibit E-11). Still, this does not take into account the job growth needed to accommodate labor force growth. Most industry sectors will follow this general contour of post-recession recovery followed by moderation. However, there are differences among industries. Recovery strength in many cases is determined by the magnitude of the industry’s decline during the recession. Industries where employment fell steeply are expected to experience stronger than average growth as they recover from these deep losses. The expected employment growth in individual sectors at the county level is shown in Exhibit E-12. While these growth rates are expected to apply at the city level as well, the projected job creation will differ given the different mix of industries in the two regions. Between 2014 and 2019, the economy is expected to add 322,000 new jobs in nonfarm industries across Los Angeles County, and 126,000 new jobs in the City of Los Angeles.
8.7%
7.5% 8.3%
6.2%
2000
2001
2002
2003
2004
2005
2006
2007
2008
2009
2010
2011
2012
2013
2014
Exhibit E-10 Unemployment Rate
City of LA California LA County United States
Sources: CA EDD, BLS
3.4
3.6
3.8
4.0
4.2
4.4
4.6
2007 2010 2013 2014 '15f '16f '17f '18f '19f
Exhibit E-11 Nonfarm Employment in Los Angeles County (millions of jobs)
Sources: CA EDD; Moody's Analytics; LAEDC
Lost jobs are recovered by 2015

51
W
Los Angeles Property Market Information
• Employment, Industries and Jobs
• Los Angeles County was hard hit during the recession, and has experienced a slow and anaemic recovery. From an employment base of 4.2 million at the pre- recession peak in December 2007 to a post-recession trough of 3.9 million, the county saw a loss of more than 330,000 jobs, and an unemployment
• an unemployment rate consistently 10 percent above the county average, standing currently at 8.7 percent—both are above the state rate of 7.5 percent, which is also above the national rate, which stood at 6.2 percent in 2014.
• Most industry sectors will follow this general contour of post-recession recovery followed by moderation. However, there are differences among industries. Recovery strength in many cases is determined by the magnitude of the industry’s decline during the recession. Industries where employment fell steeply are expected to experience stronger than average growth as they recover from these deep losses.
• Recovery of all jobs lost during the recession did not occur until 2015 (Exhibit E-11). Still, this does not take into account the job growth needed to accommodate labour force growth.
• The expected employment growth in individual sectors at the county level is shown in Exhibit E-12. While these growth rates are expected to apply at the city level as well, the projected job creation will differ given the different mix of industries in the two regions.
• Between 2014 and 2019, the economy is expected to add 322,000 new jobs in nonfarm industries across Los Angeles County, and 126,000 new jobs in the
Executive Summary Los Angeles: People, Industry and Jobs 2014-2019
iv Institute for Applied Economics
Exhibit E-12 Industry Employment Growth 2014-2019 in Los Angeles
Annual Average %
Growth
Δ Employment
(000s)
Total Nonfarm Payroll Employment 1.5% 322.0
Good Producing Industries: 0.5% 12.4
Natural Resources and Mining (1.4%) -0.3
Construction 1.8% 11.9
Manufacturing – Durable Goods 0.1% 2.1
Manufacturing – Nondurable Goods (0.0%) -1.2
Service Providing Industries 1.8% 287.6
Wholesale Trade 0.8% 8.6
Retail Trade 0.7% 14.7
Transportation, Warehousing, Utilities 0.7% 5.5
Information 1.4% 14.7
Financial Activities 1.2% 13.1
Professional and Business Services 2.1% 67.8
Educational and Health Services 2.7% 105.6
Leisure and Hospitality 2.3% 54.7
Other Services 0.5% 4.0
Government 0.8% 20.6
Sources: California Employment Development Department; LAEDC
Employment, Industries and Jobs Employment opportunities for residents of Los Angeles County will depend on the health of the regional economy. Los Angeles County was hard hit during the recession, and has experienced a slow and anemic recovery. From an employment base of 4.2 million at the pre-recession peak in December 2007 to a post-recession trough of 3.9 million, the county saw a loss of more than 330,000 jobs, and an unemployment rate reaching a high of 12.6 percent (Exhibit E-10). The City of Los Angeles fared somewhat worse, with an unemployment rate consistently 10 percent above the county average, standing currently at 8.7 percent—both are above the state rate of 7.5 percent, which is also above the national rate, which stood at 6.2 percent in 2014. Recovery of all jobs lost during the recession did not occur until 2015 (Exhibit E-11). Still, this does not take into account the job growth needed to accommodate labor force growth. Most industry sectors will follow this general contour of post-recession recovery followed by moderation. However, there are differences among industries. Recovery strength in many cases is determined by the magnitude of the industry’s decline during the recession. Industries where employment fell steeply are expected to experience stronger than average growth as they recover from these deep losses. The expected employment growth in individual sectors at the county level is shown in Exhibit E-12. While these growth rates are expected to apply at the city level as well, the projected job creation will differ given the different mix of industries in the two regions. Between 2014 and 2019, the economy is expected to add 322,000 new jobs in nonfarm industries across Los Angeles County, and 126,000 new jobs in the City of Los Angeles.
8.7%
7.5% 8.3%
6.2%
2000
2001
2002
2003
2004
2005
2006
2007
2008
2009
2010
2011
2012
2013
2014
Exhibit E-10 Unemployment Rate
City of LA California LA County United States
Sources: CA EDD, BLS
3.4
3.6
3.8
4.0
4.2
4.4
4.6
2007 2010 2013 2014 '15f '16f '17f '18f '19f
Exhibit E-11 Nonfarm Employment in Los Angeles County (millions of jobs)
Sources: CA EDD; Moody's Analytics; LAEDC
Lost jobs are recovered by 2015

52 Los Angeles Property Market Information
Executive Summary Los Angeles: People, Industry and Jobs 2014-2019
vi Institute for Applied Economics
Exhibit E-13
Occupational Growth in Los Angeles County 2014-2019 (Δ Employment)
SOC Occupational Group New Jobs
Replace-ment
Total *
11-0000 Management occupations 14,130 25,810 39,940
13-0000 Business and financial 13,440 23,520 36,960
15-0000 Computer and mathematical 8,100 7,740 15,840
17-0000 Architecture and engineering 2,790 7,790 10,580
19-0000 Life, physical, social science 2,130 5,210 7,330
21-0000 Community and social services 9,200 8,060 17,260
23-0000 Legal occupations 1,960 3,720 5,680
25-0000 Education, training and library 13,030 22,510 35,540
27-0000 Arts, entertainment, sports 6,110 18,850 24,960
29-0000 Healthcare practitioners 26,720 20,230 46,950
31-0000 Healthcare support 16,500 9,180 25,680
33-0000 Protective services 10,500 13,400 23,900
35-0000 Food preparation and serving 45,210 63,460 108,670
37-0000 Building/grounds maintenance 17,300 13,400 30,700
39-0000 Personal care and service 20,850 18,610 39,460
41-0000 Sales and related 20,480 62,990 83,470
43-0000 Office and administrative 50,090 74,190 124,280
45-0000 Farming, fishing and forestry 130 730 860
47-0000 Construction and extraction 9,920 8,830 18,750
49-0000 Installation, maint / repair 6,530 13,160 19,690
51-0000 Production 7,940 24,190 32,030
53-0000 Transportation/material moving 15,960 34,530 50,490
Total* 322,000 480,000 802,000 * May not sum due to rounding Source: Estimates by LAEDC
Less than HS 33.9%
HS, no exp 29.0%
HS, some exp 5.9%
Postsecondary non-degree
award 5.3%
Associate's 4.4%
Bachelor's, no exp 11.3%
Bachelor's, some exp
5.2%
Master's 1.6%
Doctoral or professional
degree 2.2%
Exhibit E-14 Entry Level Education and Experience Requirements
Source: Estimates by LAEDC

53
W
San Diego Property Market Information
• The effect of the GFC caused construction of office buildings to lessen, due to the fact that less offices were being demanded, and so the supply overweighed the demand.
• From 2006 – 2008, Net absorption trended downwards whilst vacancy rates increased. In addition, the number of offices constructed began to lessen from the onset of the GFC.
• From 2009 onwards, vacancy rates have decreased, whilst net absorption gradually increased.

54
W
San Diego Property Market Information
• Construction activity has exceeded 1.5 million SF and by year-end, will be at its highest level since 2008. With only 551,349 SF currently under construction, there is no concern for over- building as was the case prior to the recession that began in 2007. Additionally, demand since 2014 remains as strong – if not stronger – than most of the years prior to the recession.

55 San Diego Property Market Information
• California and San Diego economy showing signs of improvement
• Housing market strengthening • Unemployment declining
• But employment conditions still difficult for many
• Considerations for LMI workers
• Fewer mid‐wage jobs, more low‐wage jobs
• Most low‐wage jobs don’t pay living wages
• Increasing importance of educational attainment
U.S. GDP growth 0.4% for Q4 2012
‐10 ‐8 ‐6 ‐4 ‐2 0 2 4 6
20052006
20072008
20092010
20112012
Percent Change
Percent Change in Real GDP, 2005‐2012
Source: Bureau of Economic Analysis 4 thQ 2008: TARP
1 stQ 2009: ARRA
California mortgage delinquencies continue to fall
0
200,000
400,000
600,000
800,000
20052006
20072008
20092010
20112012
Number of Mortgages
Loans in ForeclosureAll M
ortgages Past Due
Source: Mortgage Bankers Association, National Delinquency Survey
California and Nevada have the highest
unemploym
ent among 12 thDistrict states
11.8
10.8
8.9
8.4
8.4
7.1
7.5
6.2
5.9
9.6
9.6
8.4
7.9
7.5
6.5
6.2
5.2
5.2
‐ 2 4 6 8
10
12
14
NVCA
ORAZ
WA
AKID
HIUT
Unemployment Rate (seasonally adjusted)
Unemploym
ent Rates in the 12th DistrictFeb. 2012
Feb. 2013
U.S. (Feb. 2013) ‐7.7%
Source: Bureau of Labor Statistics

56 San Diego Property Market Information
California labor force continues to grow,
employment recovering
14 15 16 17 18 1920032004
20052006
20072008
20092010
20112012
2013
Individual Workers (in millions)
Labor Force and Employm
ent in California, 2003‐2013
Labor Force
Employm
ent
Source: Bureau of Labor Statistics
California has added jobs for the last several
quarters , San Diego job growth on pace
‐8%
‐6%
‐4%
‐2% 0% 2% 4%
20012002
20032004
20052006
20072008
20092010
20112012
Employm
ent (Year‐over‐Year Growth)
CALA
SD
Source: Bureau of Labor Statistics (quarterly data through end of 2012)
San Diego employment continues to grow
1,140
1,160
1,180
1,200
1,220
1,240
1,260
1,280
1,300
1,320
1,34020032004
20052006
20072008
20092010
20112012
2013
Total Nonfarm Employment (in thousands)
Total Nonfarm Em
ployment (in thousands) 2003‐2013
San Diego‐Carlsbad‐San Marcos
Recession
Source: Bureau of Labor Statistics, not seasonally adjusted
Source: National Employment Law Project
‐21%
‐60%
‐19%
58%
22%
20%
‐80%‐60%
‐40%‐20%
0%20%
40%60%
80%
Lower Wage
Mid W
age
Higher Wage
Jobs Lost in the RecessionJobs Gained in the Recovery
Growth in lower wage workSource: National Employment Law Project
‐21%
‐60%
‐19%
58%
22%
20%
‐80%‐60%
‐40%‐20%
0%20%
40%60%
80%
Lower Wage
Mid W
age
Higher Wage
Jobs Lost in the RecessionJobs Gained in the Recovery
Growth in lower wage work

575757
APPENDIX DIVISION 2 – STRATEGIC RESEARCH
57

585858
SUBDIVISION 1 – LEGAL & GEOGRAPHIC RESEARCH
58

59
W
Due Diligence Checklist
Property and Local Market Conditions
1. Property type and physical condition / quality
2. Property location and competitive position
3. Property cash flows over the loan period
4. Property values (today, at maturity, at stabilization, in liquidation and recovery)
4. Rent rolls
5. Capital needs
6. Tenant defaults and payment delays, retention and renewals
8. Significance of personal property
9. Local market and sub market conditions
Borrower Capabilities and Motivation
1. Borrower/sponsor financial and managerial strength
2. Extent of distress on borrower’s other properties / businesses
3. Borrower’s exposure on guarantees (contingent, full repayment, completion, or
loss recovery)
4. Borrower’s tax position
5. Borrower’s reliance on management fee revenue (property, asset management, etc.)
6. The ownership entity’s control, capital structure, and approval processes
These factors are essential as they influence the borrower’s behaviour and negotiating strategy. It can vary from obtaining a release from personal guarantees (DIL), maintaining control of the property to protect or to participate in its potential upside recovery, preserving management fee revenues, contributing and getting credit for ‘new’ money, pursuing bankruptcy or lender liability actions, and / or managing tax consequences and timing.
Legal Structures and Documents
Loan documents and key terms such as interest rates, maturities, escrows, and lock boxes
Mortgages, assignments and other security
Guarantees
Additional collateral
Other credit support
Development and management agreements
Lender recognition of agreements including leases
Assignments of rents and receivables
Lender lock box arrangements for collection of rents
Default events, rights, and remedies
Lender rights, obligations, and exposure under documents
Other Creditors
Construction trade claims
Mechanics liens
Other mezzanine debts
Inter-creditor agreements
Other secured or unsecured debt
Servicing History
Review of the loan servicing history and files can be used to develop pricing assumptions. Servicing files can be used to help indicate whether the property or borrower has supported the debt.
Servicing and payment history and sources
Servicing and correspondence
Existence and status of any defaults
Correspondence to/from borrower
Financial analysis of borrower and guarantors
Availability of assets to satisfy guarantees

60
W
Legal Background
Mezzanine financing tends to be highly negotiated and customised for the particular situation.
Type of Instrument
MF typically consist of unsecured or second lien debt, or less frequently, preferred stock.
In practice, most mezzanine financing, particularly for larger financings, takes the form of subordinated, unsecured debt. Initial structuring discussions often focus on whether the debt should be in the form of loans or debt securities, with the investors' view of the likely resale market (bank or bond) driving the result.
MF in the form of debt often includes equity participation, in the form of warrants, options and/or conversion features or co-investment rights associated with the primary mezzanine investment.
Covenants
Key negative covenants in mezzanine debt may include limitations on:
Incurrence of debt.
Restricted payments (including dividends, repurchases of equity and junior debt, and certain types of investments).
Liens.
Change of control transactions.
Asset sales.
Affiliate transactions.
Affirmative covenants may include those relating to:
Financial reporting.
Maintenance of insurance.
ERISA compliance.
Equity Participation
Mazanine investors regularly seek to enhance their returns by negotiating for equity participation alongside debt investments. This can take various forms:
Warrants or options to purchase a specified percentage of equity (1-5% usually)
Right to co-invest in the issuer alongside the controlling stockholder or a PE sponsor. Purchased equity would usually be bound by the terms of any stockholders’ agreement or other arrangement among other stockholders.
Conversion feature that allows mezzanine investors to convert all or a portion of their principal investment into common equity of the issuer.

61
W
Legal Background
Inter-creditor Relationships
Senior debt holders have ability to suspend payments to mezzanine debtholders for up to 179 days in cases of default.
While precedents vary, in cases where mezzanine investors will receive only limited equity interests in the issuer, ordinarily they have limited leverage to negotiate for more than standard tag-along rights and registration rights, as well as customary anti-dilution protections. In cases where mezzanine investors are also taking larger equity stakes, however, they may also negotiate for veto rights for specified corporate actions including equity offerings, mergers, affiliate transactions or changes in senior management.
Mezzanine borrower typically only owns limited liability interests in a limited liability company
Addition of a mezzanine loan to the borrowing structure can bring the total loan-to-value ratio of a transaction to 90-95%.
Limitations on Rights and Remedies under Intercreditor Agreements
Mezz loans are typically contractually subordinated to the related senior mortgage loans pursuant to the terms of an Intercreditor agreement entered into between the senior mortgage lender and mezzanine lender. These agreements severely limit and restrict the ability of mezz lenders to enforce their rights and remedies under the mezz loan documents.
Commercial Mortgage Securities Association (CMSA) have developed model forms that have become the industry norm on the content and coverage of these Intercreditor agreements.
The agreements limit the mezz lender’s ability to control Equity Interest and to establish indirect control of the underlying real estate and to make certain decisions and take certain actions without the senior mortgage lender’s consent.
The Intercreditor agreement typically requires borrower to obtain a ‘no downgrade letter’, which provides confirmation from rating agencies that mezz lender’s enforcement actions will not cause a downgrade of the rating of the related CMBS issurance which is secured.
The Intercreditor agreements also place strict limitations on the identity of the mezzanine lender since it may succeed to the indirect ownership of the underlying mortgage borrower and therefore end up being the owner and operator of the land serving as collateral for the mortgage.
The only ability of the mezzanine lender to escape the confines of the senior morgtage is to buy out the senior lender. If there is a default under the senior mortgage loan, most Intercreditor agreements grant the mezzlender to purchase the senior mortgage loan.
Even if the mezzanine lender is able to obtain control of the mortgage borrower, its rights remain very limited not only because of the restrictions in the Intercreditor agreement, but also because the mezzanine lender (in its new capacity as mortgage borrower) is still subject to the senior mortgage covenants and restrictions.

62
W
Legal Background
Inter-creditor Relationships
The senior mortgage typically contains many limitations on the ability to sell the property, make major improvements to the property, change control of the property, or undertake other major decisions without the senior mortgage lender’s consent.
The only option available is to refinance the property or to buy out the senior lender at par. Mezz lenders are further restricted since they rarely succeed to the benefits from certain third-party agreements such as ground leases, subordination and non-disturbance agreements, etc.
The mezz lender is under time pressure and must realise upon its collateral and exercise its remedies prior to the senior mortgage lender completing a foreclosure on the underlying mortgage. Once the senior mortgage lender completes its foreclosure, the underlying mortgage borrower will no longer own the income producing property and the mezz borrower will own equity in an entity with no assets.
In the case the underlying mortgage borrower sells the property, the mezz lender’s only action against the mezz borrower is for a breach of the contractual promise not to sell.
Compared to the senior mortgage lender’s right to foreclose its senior mortgage, the mezz lender’s right to foreclose on the Equity Interests of the mezzanine borrower is riskier and of limited value. Upon default, the mezz lender’s remedies derive solely from its lien on personal property (i.e. the equity in the mezz borrower). This means the mezz lender has no rights to foreclose any other liens on the underlying real property, its rights are limited solely to foreclosing junior liens on the equity in the mezzanine borrower and not the real property.
What this means is that even after a successful foreclosure of a mezzanine loan, the underlying mortgage property remains subject to the lien of the senior mortgage as well as any other liabilities, liens, leases and other encumbrances of the underlying mortgage borrower and the underlying real property. Meaning the mezz owner will only indirectly own the underlying mortgaged property

63
W
Legal Background
Debt to Equity Swap
In the case of Nine Entertainment, they were able to avoid bankruptcy in 2012 after warring lenders agreed on a A$3.3bn debt-for-equity swap that hands control of Channel 9 to two investment groups. Apollo Global Management and Oaktree Capital, which owned about 40% of Nine’s 2.3bn senior debt, offered Goldman Sachs (second-tier lenders) a bigger equity stake in a recapitalised and debt-free Nine (7.5%). In return, Goldman Sachs dropped its demand for warrants in the restructured company. This was subsequent to Goldman Sachs’ original proposal of swapping the mezz debt for 30% equity in Nine.
Debt to equity swaps (restructure) from the junior (mezzanine) lender is subject to the senior lender’s approval. However, at the same time, if valuation provides that ‘the value of the company breaks into the mezzanine debt’, aka, the junior lender has an economic interest in the business, the restructure requires consent of the junior lender.
This effectively means the mezzanine debt holder also has a leverage against the senior debt owner by barring their ability to restructure their capital structure.
Debt to Equity Swap was done by Goldman Sachs and Park Square to take control of Northgate, from owner KKR. This was backed with a 320m leveraged loan financing.
Mezzanine Lender’s Leverage against Senior Debt Holder
It is arguable that if the senior lenders are able to convince a court that the junior lenders’ debt is out of the money.
High Court Justice of England and Wales’ judgment of Bluebrook Ltd in 2009
It was determined that if they had an economic interest, they must be consulted in a Scheme of Arrangements and they must give consent.

64Outlining population movement in Chicago – Phone Tracking
Analysis Overview
Using geographic data from twitter, we are able
to map out where people congregate in urban
centers.
• This provides important socio-economic
information - as iPhone users earn, on
average, 40% more than Android users
• This data shows that West Loop (as outlined
by the white box) is subject to more foot
traffic by higher net wealth individuals than
inland Chicago
• We can infer that this means that the
process of gentrification is nearly complete,
establishing long-term demand for real
estate and commerce
64

65Outlining population movement in San Diego– Phone Tracking
Overview
• From the data, it is clear that iPhone
users congregate in the Downtown
region
• This allows us to infer that there is a
high concentration of higher-wealth
individuals passing through this area
65

66Outlining population movement in Los Angeles– Phone Tracking
Overview
• This map indicates that while Android
users are distributed evenly across LA,
iPhone user tend to cluster in areas
such as the Downtown region
• This is indicative of the socio-economic
division in LA
• It also spotlights the defensibility of the
LA office market
66

676767
SUBDIVISION 2 – PRECEDENT & SUPPORTIVE TRANSACTIONS
68
W
Precedent & Supportive Transactions
2009: Blackstone- purchasing at discount
• Blackstone helped Hilton Worldwide restructure
substantially all its debt by the purchase and
retirement of $1.8 billion debt and the conversion of
$2.1 billion of junior mezzanine debt to preferred
equity
• Blackstone borrowed $13 billion and agreed to take
on $7 billion of Hilton’s existing debt.
• Blackstone offered to buy back some of the bank
debt at a discount
• Blackstone negotiated its equity stake in Hilton to
70%

69
W
Precedent & Supportive Transactions
2008: Apollo Real Estate Advisors (AREA) – Loan to
Own
• Africa-Israel Investments and Mann Realty were
owners to the Apthorp apartment.
• Condo conversion was unsuccessful
• Foreshadowing a default, their $135 million
mezzanine debt lender AREA and first mortgage
lender Anglo Irish Bank threatened to foreclose on
the deal.
• Owners forced to come up with $23 million in
additional equity which lead to the lenders
controlling the property and ultimately replacing
Mann’s manager

70
W
Precedent & Supportive Transactions
2007: Icahn Enterprises – purchasing at a discount
- Stratosphere resort was a hotel-casino in Las
Vegas facing bankruptcy in 1997
- Icahn purchased Stratosphere’s debt for under 10
cents on the dollar pennies on the dollar and
eventually also bought out the minority
shareholders for $82 million.
- In 2007 Icahn sold the Stratosphere along with
neighbouring properties for $1.3 billion.

71
W
Precedent & Supportive Transactions
2009: Apollo Management and Oaktree Capital – Loan
to Own
- Countrywide was UK’s largest estate agency.
- In 2007, weighed down by the housing market, it
was unable to support its debt load in the long-
term
- In 2008, Oaktree began purchasing Countrywide’s
bonds, up to 34% in the company’s secured
bonds.
- In 2009, Apollo negotiated with bondholders to
discuss a potential debt restructuring and
successfully recapitalised the company

72
W
Bryant Plaza Research
Renovation #1: Underground carparking
(WIP Leadership Board Member Michelle Wendler, AIA, is Principal of Watry Design. She has been creating parking solutions for the firm’s clients for more than 24 years. Wendler, a licensed architect in 12 states, is responsible for the design)
Assumptions:
(Assumptions made from Michelle Wendler, the lead parking designer and structure for Watry Design and a licensed architect in 12 states, is responsible for the design of more than 150 parking projects)
The property’s on-site parking of 300 spaces is on land and not part of the building
Soil condition of property is suitable and allows for underground car park construction
$5000 annum revenue/ stall
135 sf width and length
300-340 sf/ stall
$45/sf
Plan:
Additional 400 spaces as underground parking, this will bring additional $2M/annum
Construct 4 underground car parking levels to add 400 parking spots
Cost of construction:
Average size of car park: 320 sf
No. car parks: 400
Price per sf: $450-$550
320sf*400=12,800*45= $5.7M
NOI:
Car park rent flat rate: $10
No. days per year: 265
No. car parks: 400
$10*365*400= $1.5M
Things to consider:
Geography:
LA
Average costs of labor and resources needs to be noted. As well as condition of soil, seismic regions and availability of materials.

73
W
Bryant Plaza Research
• Number of parking levels:
• In general, a larger-footprint parking structure that is shorter will cost less per parking space than a taller structure with a smaller footprint. The cost per square foot of the first level that is on the ground is less than levels that are elevated above the ground. A lower-height, larger-footprint structure will have a higher proportion of the cost in the first level. The taller a structure is the heavier it is, and this affects the foundation cost. A taller structure generally has a less efficient parking layout, which translates into more square feet for each parking space.
•
• Cost of underground parking:
• If a parking structure is one level underground, the cost per square foot can increase by approximately 15%. If the structure is more than one level below the ground, the cost would be approximately 45% higher than the original cost per square foot as cost increases due to impacts of having to dig deeper.
• Cost of structural system:
• 60% to 70% of the cost of parking is in the structural system. Therefore, the selection of the framing system will have a significant effect on the cost of each parking space. There are two general types of framing layouts and there are different types of structural systems. The two types of framing layouts are short-span and long-span. Short span is where you have a column approximately every three parking spaces (27x30 feet square) to support the floor slab. Long-span is where you have columns spaced 60 feet apart, with beams spanning over the stalls and the drive aisle. Generally, short-span systems cost less per square foot, but the efficiency is not as good.Long-span systems cost more per square foot, but you are getting more stalls in the same square footage. The structural system of a parking structure can be either Cast-in-Place Concrete, Precast Concrete or Structural Steel. Which system is more cost effective depends on the location of the project and the preferred methods of construction in the
region. This is a case-by-case analysis. The selection of a system that is not common in the area will generally cause the structure to cost more.
•
• The foundation system of the car park has a huge impact on cost of structured car parks.
• Structures founded in poor soils’ conditions that require more expensive, deeper foundation systems will cost more. The difference between a shallow and deep foundation system can increase the price approximately 10% overall – taking the cost from, say, $50 to $55 per square foot.
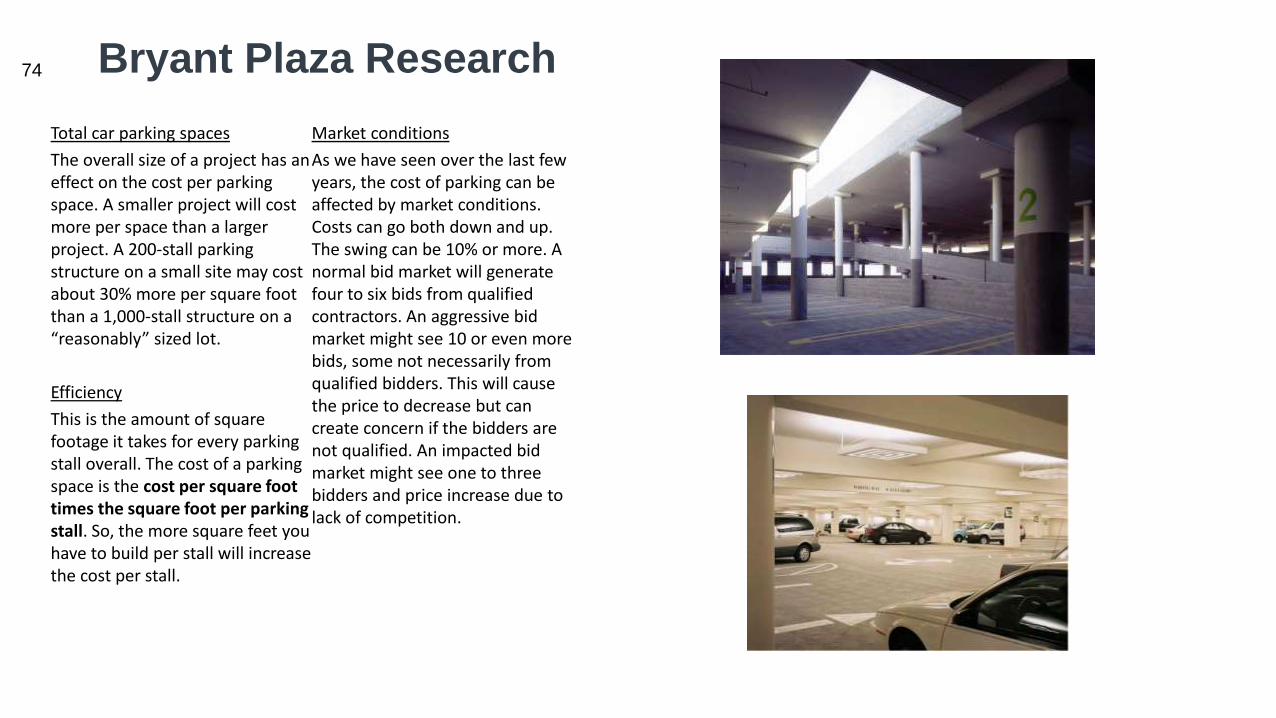
74
W
Bryant Plaza Research
Total car parking spaces
The overall size of a project has an effect on the cost per parking space. A smaller project will cost more per space than a larger project. A 200-stall parking structure on a small site may cost about 30% more per square foot than a 1,000-stall structure on a “reasonably” sized lot.
Efficiency
This is the amount of square footage it takes for every parking stall overall. The cost of a parking space is the cost per square foot times the square foot per parking stall. So, the more square feet you have to build per stall will increase the cost per stall.
Market conditions
As we have seen over the last few years, the cost of parking can be affected by market conditions. Costs can go both down and up. The swing can be 10% or more. A normal bid market will generate four to six bids from qualified contractors. An aggressive bid market might see 10 or even more bids, some not necessarily from qualified bidders. This will cause the price to decrease but can create concern if the bidders are not qualified. An impacted bid market might see one to three bidders and price increase due to lack of competition.

75
W
Bryant Plaza Research

76
W
Bryant Plaza Research
Assumptions:
(Data from U.S Department of Housing and Urban Development)
6 ft fire code safety setback
7% unusable area of roof due to safety setbacks – minus 1283 sf
15% rooftop obstructions- minus 2750 sf
Total usable rooftop area= 18333-1283-2750= 14,300 sf
(Quote from US-based professional design services firm ‘Cabaret Design Group’)
Average cost to build a bar is $200-$300 per sf
Average 18’ 6” bar equipment cost: $8,000
Cost of contstuction:
Construction cost per sf: $200-$300 per sf
Bar equipment cost: $8,000
Total Cost: ($250*14300)-8000= $360,000
Cost: $300,000-$400,000
NOI: $1.8M

77
Appendix – Cutler Center Renovation Comps
Overview - Costings
• $800M Costing
• 1.2M Sqft renovation
• Indicative of $667/sqft
Westfield Century Centre
Returns Analysis
• Occupancy expense proportions
imply an annualized increase in
rental revenue of 50-80m p.a
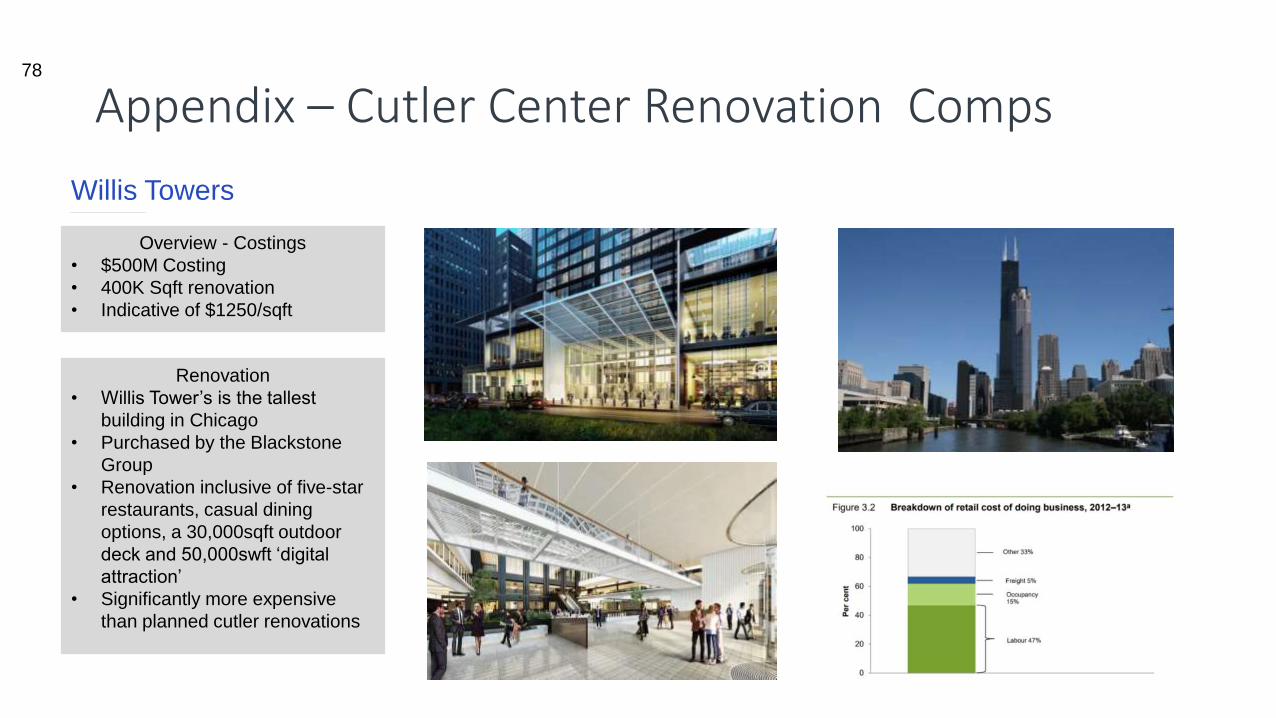
78
Appendix – Cutler Center Renovation Comps
Overview - Costings
• $500M Costing
• 400K Sqft renovation
• Indicative of $1250/sqft
Willis Towers
Renovation
• Willis Tower’s is the tallest
building in Chicago
• Purchased by the Blackstone
Group
• Renovation inclusive of five-star
restaurants, casual dining
options, a 30,000sqft outdoor
deck and 50,000swft ‘digital
attraction’
• Significantly more expensive
than planned cutler renovations

79
Appendix – Cutler Center Renovation Comps
Overview - Costings
• $1B overall costings
• 3M sqft of retail space
• Indicative of $340/sqft
Union Station
Renovation
• Union Station is a major inner-
city rail hub
• Renovation is inclusive of retail,
office and administrative space

80
Appendix – Rivers Towers Renovation Comps
Overview - Costings
• $7M renovation of facilities
• Roughly 24,000 square feet
renovated
• Implies a cost of $290/sqft
701 B St
Renovation
• 701 B St is a class A office and
entertainment space
• Renovation was focused on
upgrading the lobby, lifts and other shared spaces

81
Appendix – Rivers Towers Renovation Comps
Overview - Costings
• $500M costing
• 2.5M sqare feet
• Implies a cost of $200 per
square foor
Chicago Old Post Office
Renovation
• The Chicago Old Post office is a
major office space
• Renovations inclusive of a brand new lobby and rooftop gardens

82
Appendix – Rivers Towers Renovation Comps
Overview - Costings
• $500M costing
• 2M square feet
• Implies a cost of $250 per
square foot
Moscone Center
Renovation
• The Moscone Center is a major
hotel, office and office space
• Renovations inclusive of major
aesthetic and functional changes

838383
APPENDIX DIVISION 3 – RISK
83

84
W
Macroeconomic Risks
• Unemployment rate
• Risk: difficulty in finding suitable tenants
• Low unemployment rates may affect our occupancy rate and ability to find tenants when leases rollover
• We should find a well-diversified mix of tenants for our office buildings when leases end. Selected tenants should be from growing employment rate sectors such as health & education industry and the financial services industry
• However, unemployment rates forecasted to peak in 2010 and then fall steadily
• Occupancy and rents forecasted to begin sustainable growth in 2011
• 8.7M jobs were lost during the recession but 7.4M jobs were gained by 2014 during recovery. Six subsectors have accounted for 83.4% of recovered jobs. Professional and business services sector accounting for the most percentage of recovered jobs then Health care and Leisure & Hospitality inudstries
•
• Chicago:
• Metro Chicago economic results have proven unsteady. However, CH has recorded year-to-date growth of more than 31,000 jobs compared to losses of 92,000 from the same period of 2009. Unemployment rate forecasted to drop to 8.1% in coming 3 years (2013)
• Economy is expected to go into accelerated expansion especially office jobs sector
• Projected positive absorption duelled by drop in rate of sublease additions and increased occupancy rates
• Office buildings leased to young social media tech companies
• Chicago’s CBD leasing market experienced most activity from small to mid-sized users
• Many landlords improved and upgraded their properties to stay competitive by investing in lobby renovations or adding outdoor trances
• Chicago CBD has a trend of plug-and-play and on-demand suite availabilities
• River North tower a $1.3 m.s.f office building sold for $480 p.s.f (record setting p.s.f pricing in 2010)

85
W
Macroeconomic Risks
LA:
Moderate occupancy rate gains
Tenants dominated by law firms and financial services tenants
Trend of owners increasingly target a more diverse tenant base, including creative and entertainment companies
Westside an established home base for media, technology and mobile industries- these industries are expected to see continued growth and will drive new requirements
Increase in competition among tenants for “creative” space has led landlords to increase rental rates- interplay between entertainment and high-tech is significant trend
Growing demand for office buildings and sustained growth from existing tech tenants
Leisure and hospitality experienced a steep decline due to the recession, but added more than 15,700 LA-based jobs since Jan 2010, driven by an increase in discretionary and business spending
San Diego:
Leisure and hospitality sector posted the greatest employment recovery- adding 7,000 in 2013
Office-using industries such as professional and business services was one of 7 sectors that saw employment gains
Also measured growth in construction
Downtown submarket heightened activity- growing demand of tenants in tech sector and projected growth in professional services industries
Steady leasing market, transaction volume and sales value in 2010 is forecasted to outpace those seen in past years

86
W
Macroeconomic Risks

87
W
Tenant Risk
Rent Roll quality
Refer to credit worthiness, stability and number of tenants
Rollover risk
refers to remaining term left on leases at a property and it affects both single
Delinquency Rate
Delinquent loans rising- through 2009 9% of CRE loans in bank portfolios were delinquent, which is more than double of 2008
There has been a significant increase in non-performing commercial real estate in the US since 2008. This period also saw heightened levels of maturities and record levels of outstanding commercial mortgage debt.
The total value of distressed commercial real estate was $166.8 billion in 2010, including properties in distress, foreclosure, and lender REO, according to data from Real Capital Analytics
Starting June 2010- volume and value of distressed commercial real estate has dropped
Delinquency rates has risen steadily over the past two years from 5% in the 4Th quarter of 2007 to 19.0% in first quarter of 2010. Non-accrual rate increased rom 2.9% to 14.6%
The commercial mortgage sector’s total delinquency rate grew to 5.5% in the 1st Q of 2010, compared to 5.1% in 4th Q of 2009 and 3.6% one year ago
Non-accrual rate is the main factor contributing to coverall growth, accounting for 69% of the total delinquency
Bank-held commercial mortgage default rate rose to 4.2% in the 1st quarter 2010 compared to 2.3% the previous year
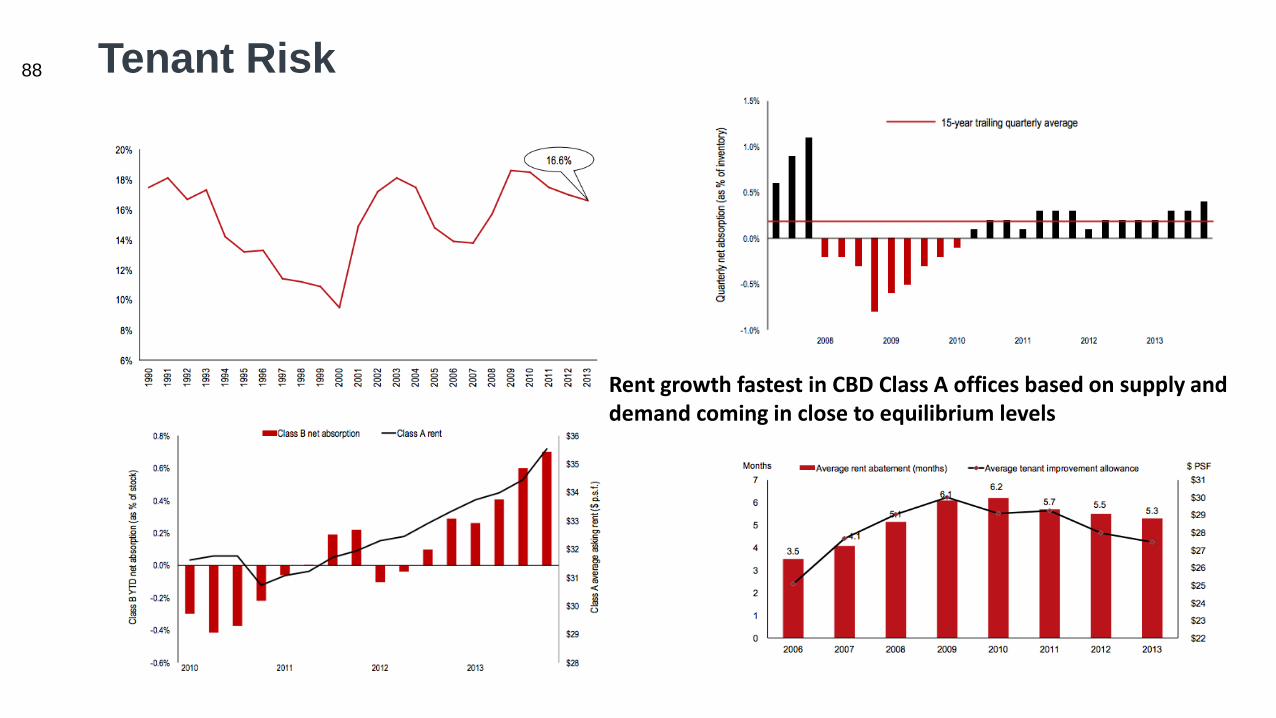
88
W
Tenant Risk
Rent growth fastest in CBD Class A offices based on supply and demand coming in close to equilibrium levels
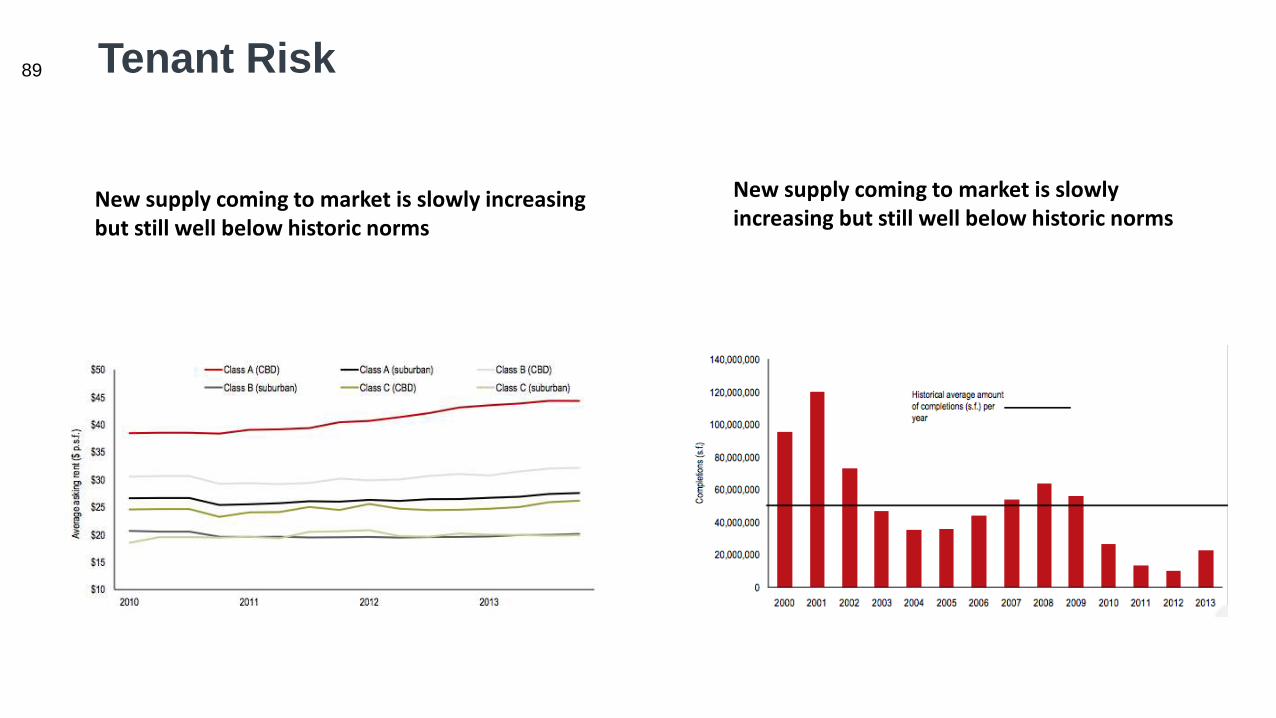
89
W
Tenant Risk
New supply coming to market is slowly increasing but still well below historic norms
New supply coming to market is slowly increasing but still well below historic norms

90
W
Tenant Risk

91
W
Financing Risk
Interest Rate RIsk Risk that interest rates will increase when we refinance and
get a loan from the bank I
Debt to Equity Swap
Risk of senior lender not giving approval of debt to equity swaps
Debt-for-equity swap significantly de-levers the distressed property’s balance sheet
Mezz lender faces the risk of a separate foreclosure on pledged equity interests of the borrowing entity.
Inter-creditor agreements creating rights and obligations between lenders can also impact the success of lender’s control of the borrowing entity.
A mezz lender in foreclosure can significantly change the loan resolution outcome if the mezz lender has a position that is partly in the money or has the ability to bring new money or expertise to the situation.
Inter-creditor agreement assumption- E.g. provide that all cash flow be paid on occurrence of a default, to senior note holders interest and principal until the senior debt is fully repaid before any interest can be paid to subordinate holders
Upon a borrower’s default, mezz lender’s only commercial alternative is to cure the default by refinancing the secured property or taking out the senior lender at par value.
Average mezzanine loans have a default rate of 16.10%

92
W
Competitive & Construction Risk
Construction Risk
Cost overruns
May take longer than anticipated to complete
Expose previously unknown defects in the physical asset
Default of construction company? During post-recession where manufacturing and construction industry suffered the most
Tenant improvements are currently averaging 18% of the first year’s least cost for ‘A’ properties

939393
APPENDIX DIVISION 4 – VALUATION
93

94
Property & Mezzanine Overview
94

95
Total Projected FCF
95

96Cutler Centre
96

97
97

98River Tower
98

99
99

100 Bryant Plaza
100

101
101