webcast 3q09 sep09 eng
TRANSCRIPT
1
Localiza Rent a Car S.A.
October, 2009
3Q09 and YTD results (R$ millions - USGAAP)
2
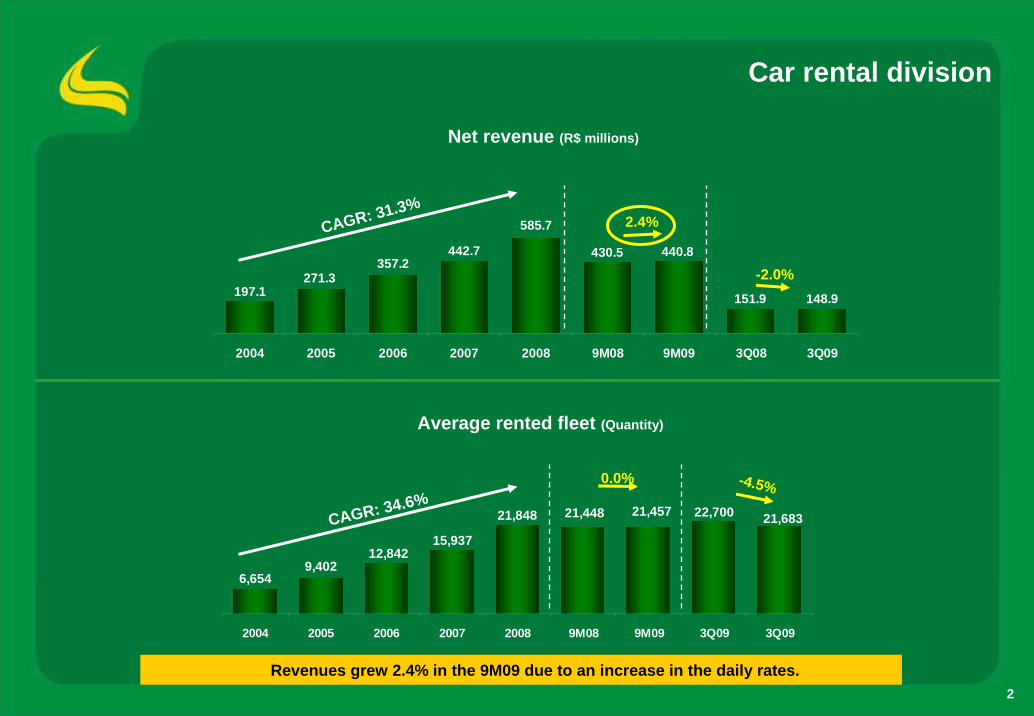
21,68322,70021,45721,44821,848
15,93712,842
9,4026,654
2004 2005 2006 2007 2008 9M08 9M09 3Q09 3Q09
148.9151.9
440.8430.5
585.7
442.7357.2
271.3197.1
2004 2005 2006 2007 2008 9M08 9M09 3Q08 3Q09
Car rental division
CAGR: 34.6%-4.5%
Average rented fleet (Quantity)
Net revenue (R$ millions)
CAGR: 31.3%2.4%
0.0%
Revenues grew 2.4% in the 9M09 due to an increase in the daily rates.
-2.0%
3
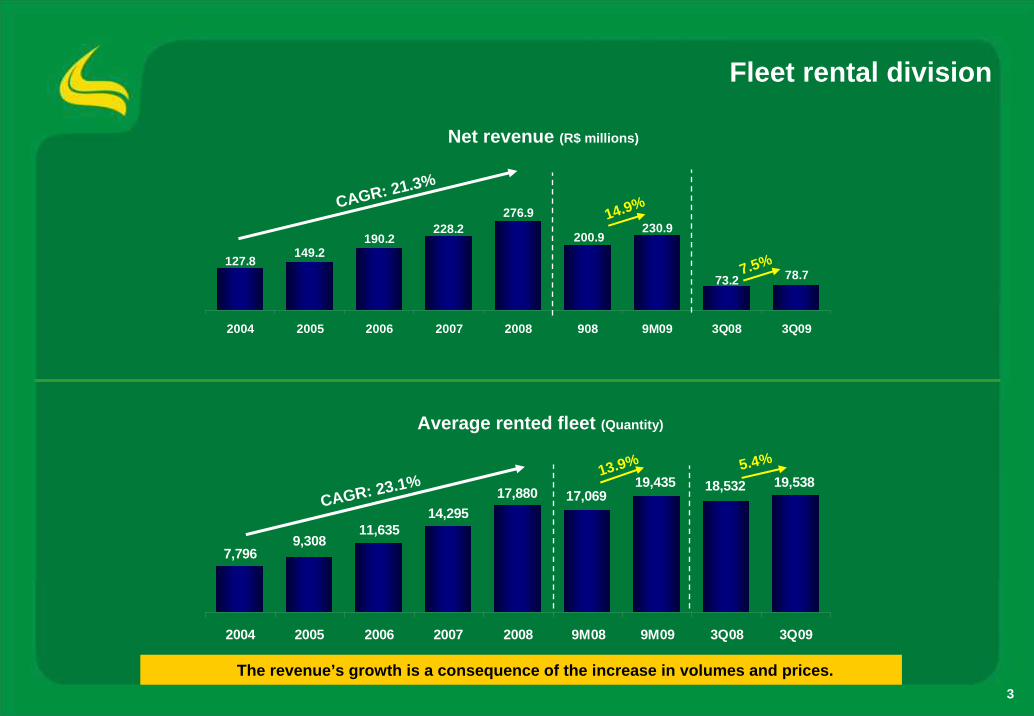
19,53818,53219,43517,06917,880
14,29511,635
9,3087,796
2004 2005 2006 2007 2008 9M08 9M09 3Q08 3Q09
127.8 149.2190.2
228.2276.9
200.9230.9
73.2 78.7
2004 2005 2006 2007 2008 908 9M09 3Q08 3Q09
CAGR: 23.1%5.4%
CAGR: 21.3%
7.5%
14.9%
13.9%
The revenue’s growth is a consequence of the increase in volumes and prices.
Average rented fleet (Quantity)
Fleet rental division
Net revenue (R$ millions)
4
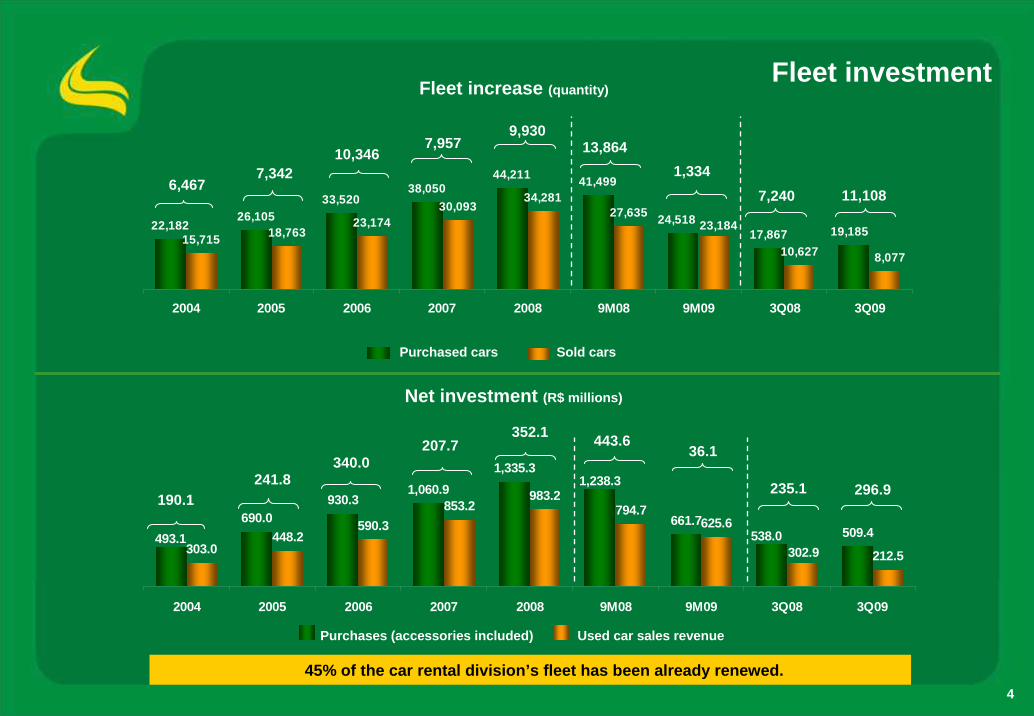
690.0930.3
1,060.91,335.3
661.7509.4
303.0448.2
590.3853.2
983.2794.7
625.6
212.5538.0
1,238.3
493.1302.9
2004 2005 2006 2007 2008 9M08 9M09 3Q08 3Q09
22,18226,105
33,52038,050
44,211 41,499
17,86715,715 18,76323,174
30,09334,281
27,635
10,627
24,51819,18523,184
8,077
2004 2005 2006 2007 2008 9M08 9M09 3Q08 3Q09
Fleet investment
45% of the car rental division’s fleet has been already renewed.
Purchases (accessories included) Used car sales revenue
Net investment (R$ millions)
Purchased cars Sold cars
Fleet increase (quantity)
7,34210,346
6,467
7,9579,930
13,8641,334
7,240 11,108
241.8340.0
190.1
207.7352.1 443.6
36.1
235.1 296.9
5
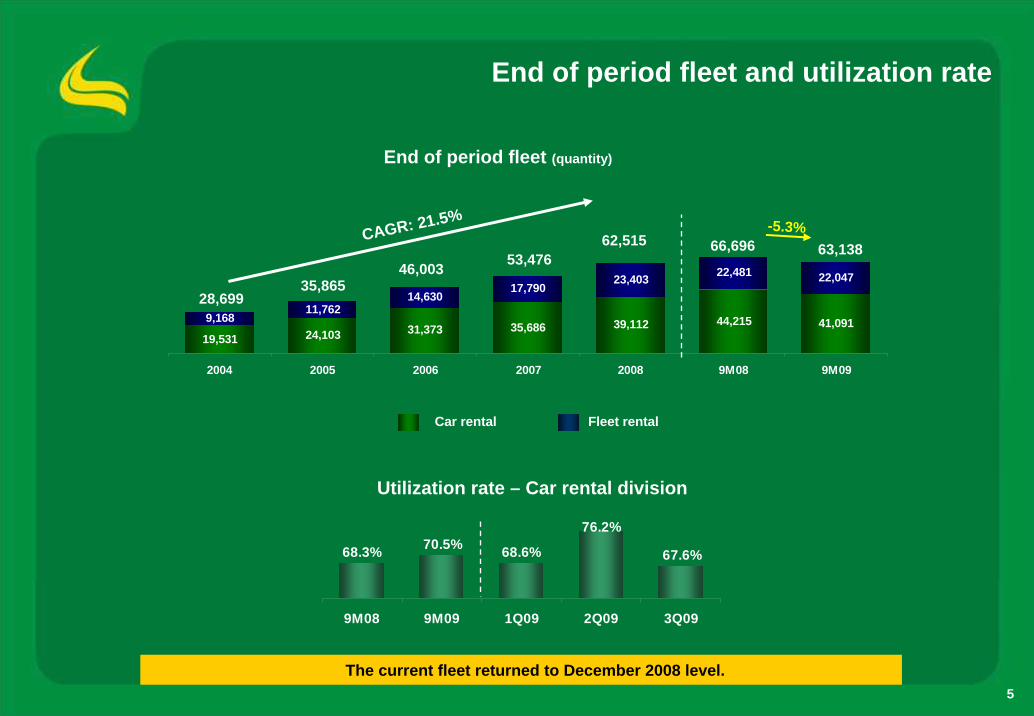
24,103 31,373 35,686 39,112 44,215 41,0919,16811,762
14,63017,790
23,403 22,481 22,047
19,531
2004 2005 2006 2007 2008 9M08 9M09
End of period fleet and utilization rate
Utilization rate – Car rental division
End of period fleet (quantity)
CAGR: 21.5%
Car rental Fleet rental
The current fleet returned to December 2008 level.
-5.3%
28,69935,865
46,003 53,47662,515 66,696 63,138
68.6%
76.2%
67.6%70.5%68.3%
9M08 9M09 1Q09 2Q09 3Q09
6
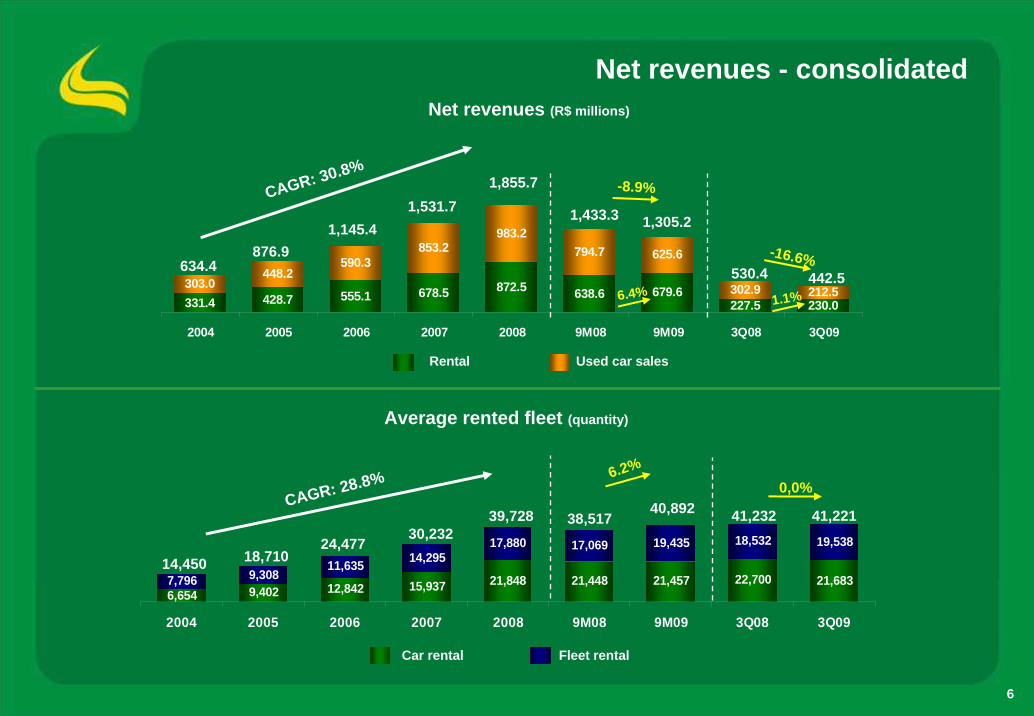
Net revenues - consolidated
872.5 638.6 679.6227.5 230.0
303.0448.2
590.3853.2
983.2794.7 625.6
302.9 212.5331.4 428.7 555.1 678.5
2004 2005 2006 2007 2008 9M08 9M09 3Q08 3Q09
-16.6%
Rental Used car sales
CAGR: 30.8%
634.4876.9
1,145.41,531.7
1,855.7
Net revenues (R$ millions)
530.4 442.5
-8.9%
1,433.3 1,305.2
1.1%6.4%
9,402 12,842 15,937 21,848 21,448 21,457 22,700 21,6837,796 9,30811,635 14,295
17,880 17,069 19,435 18,532 19,538
6,654
2004 2005 2006 2007 2008 9M08 9M09 3Q08 3Q09
0,0%CAGR: 28.8%
14,450 18,71024,477
30,23239,728
Average rented fleet (quantity)
Car rental Fleet rental
6.2%
41,232 41,22138,51740,892
7
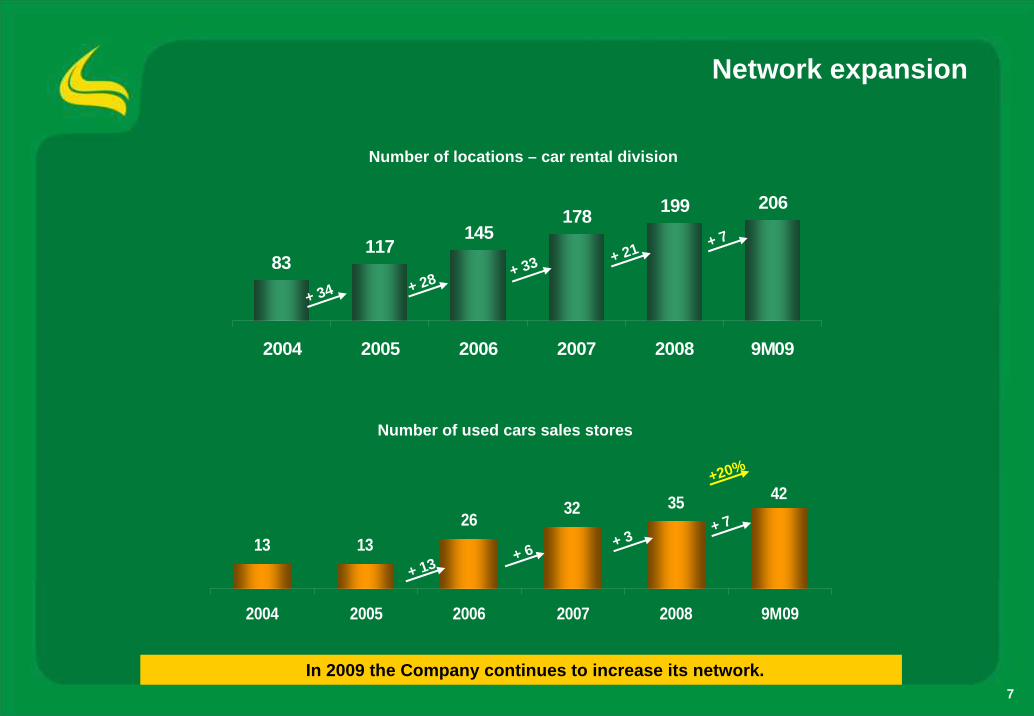
+20%
83117
145178 199 206
2004 2005 2006 2007 2008 9M09
+ 34
Number of locations – car rental division
13 1326 32 35 42
2004 2005 2006 2007 2008 9M09
Number of used cars sales stores
+ 28 + 33 + 21 + 7
+ 13 + 6+ 3
+ 7
Network expansion
In 2009 the Company continues to increase its network.
8
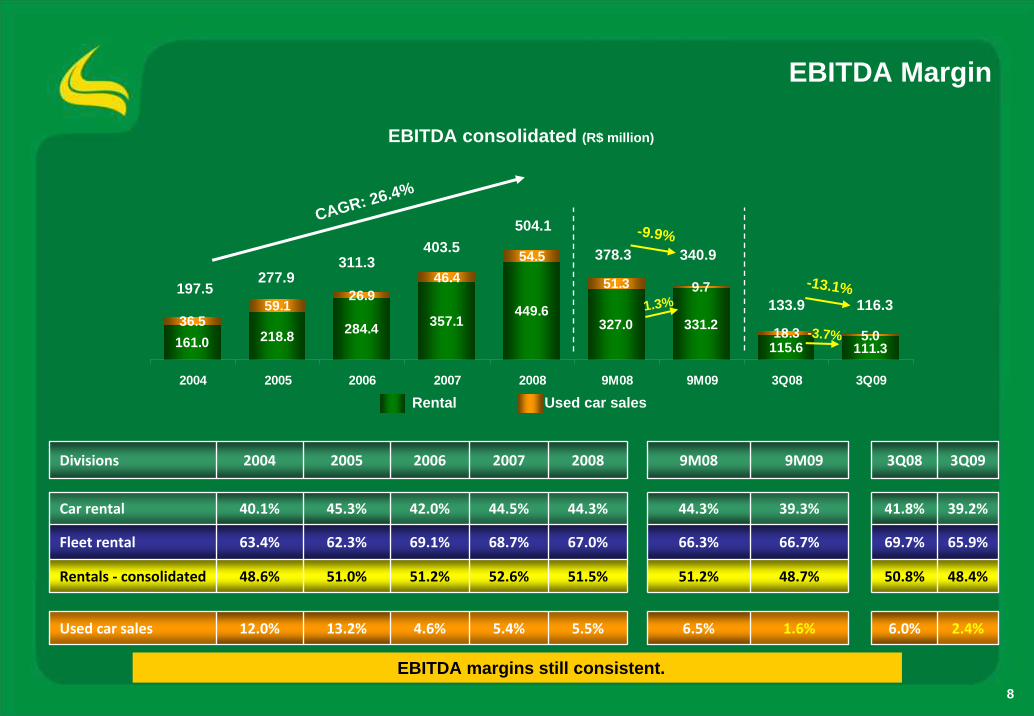
161.0 218.8 284.4 357.1449.6
327.0 331.2115.6 111.3
36.559.1
26.946.4
54.5
51.3 9.7
18.3 5.0
2004 2005 2006 2007 2008 9M08 9M09 3Q08 3Q09
EBITDA Margin
Divisions 2004 2005 2006 2007 2008 9M08 9M09
Rentals ‐ consolidated 48.6% 51.0% 51.2% 52.6% 51.5% 51.2% 48.7% 50.8% 48.4%
39.3%
66.7%
1.6%
44.3%
66.3%
6.5%
44.3%
67.0%
5.5%
42.0%
69.1%
4.6%
3Q08
44.5% 41.8%
69.7%
6.0%
68.7%
5.4%
3Q09
Car rental 40.1% 45.3% 39.2%
Fleet rental 63.4% 62.3% 65.9%
Used car sales 12.0% 13.2% 2.4%
EBITDA consolidated (R$ million)
Rental Used car sales
CAGR: 26.4%
277.9197.5
403.5504.1
311.3-13.1%
133.9 116.3
EBITDA margins still consistent.
-9.9%378.3 340.9
-3.7%
1.3%
9
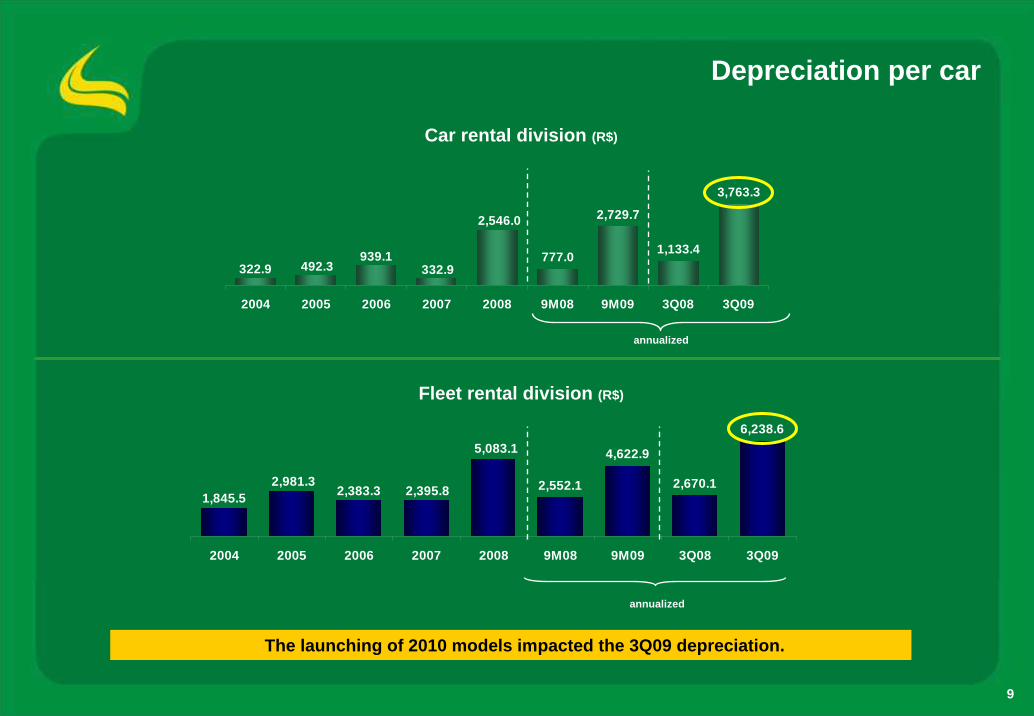
2,552.1
4,622.9
2,670.1
6,238.6
1,845.52,981.3
5,083.1
2,395.82,383.3
2004 2005 2006 2007 2008 9M08 9M09 3Q08 3Q09
777.0
2,729.7
1,133.4
3,763.3
939.1332.9
2,546.0
492.3322.9
2004 2005 2006 2007 2008 9M08 9M09 3Q08 3Q09
Car rental division (R$)
Depreciation per car
Fleet rental division (R$)
annualized
The launching of 2010 models impacted the 3Q09 depreciation.
annualized
10
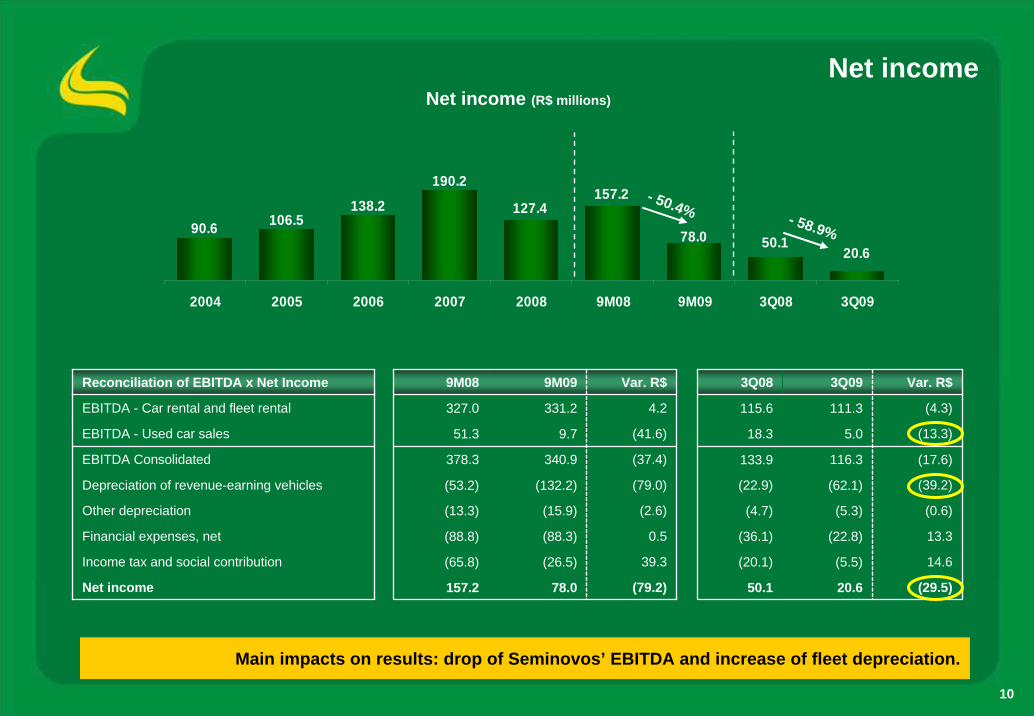
20.650.178.0
157.2
90.6 106.5138.2
190.2
127.4
2004 2005 2006 2007 2008 9M08 9M09 3Q08 3Q09
Net income
Reconciliation of EBITDA x Net Income 9M08 9M09 Var. R$
327.0
51.3
378.3
(53.2)
(13.3)
(88.8)
(65.8)
3Q08 3Q09 Var. R$
EBITDA - Car rental and fleet rental
157.2
(4.3)4.2331.2
9.7
340.9
(132.2)
(15.9)
(88.3)
(13.3)
EBITDA Consolidated
(26.5)
(41.6)
(37.4)
(79.0)
(2.6)
0.5
78.0
133.9 116.3 (17.6)
39.3
(39.2)
(0.6)
13.3
(79.2)
14.6
(29.5)
115.6 111.3
EBITDA - Used car sales 18.3 5.0
Depreciation of revenue-earning vehicles (22.9) (62.1)
Other depreciation (4.7) (5.3)
Financial expenses, net (36.1) (22.8)
Income tax and social contribution (20.1) (5.5)
Net income 50.1 20.6
Net income (R$ millions)
Main impacts on results: drop of Seminovos’ EBITDA and increase of fleet depreciation.
- 58.9%
- 50.4%
11
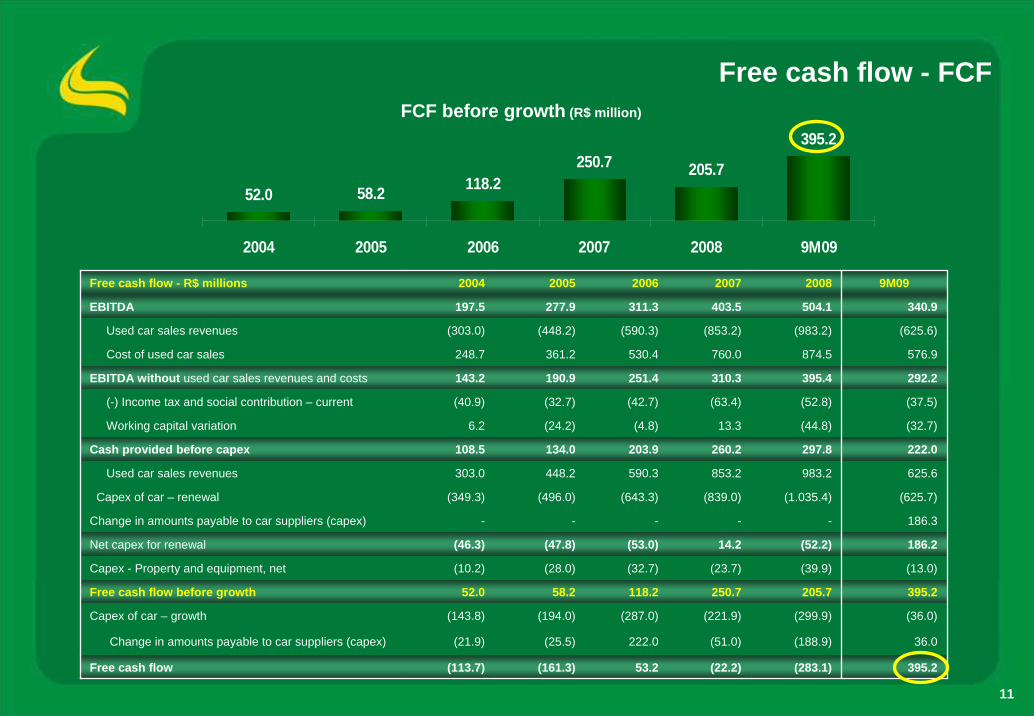
52.0 58.2 118.2250.7 205.7
395.2
2004 2005 2006 2007 2008 9M09
Free cash flow - FCF
Free cash flow - R$ millions 2004 2005 2006 2007 2008 9M09
504.1 340.9
(625.6)
576.9
292.2
(37.5)
(32.7)
222.0
625.6
(625.7)
Change in amounts payable to car suppliers (capex) - - - - - 186.3
186.2
(13.0)
395.2
(36.0)
36.0
395.2
(983.2)
874.5
395.4
(52.8)
(44.8)
297.8
983.2
(1.035.4)
(52.2)
(39.9)
205.7
(299.9)
(188.9)
(283.1)
EBITDA 197.5 277.9 311.3 403.5
Used car sales revenues (303.0) (448.2) (590.3) (853.2)
Cost of used car sales 248.7 361.2 530.4 760.0
EBITDA without used car sales revenues and costs 143.2 190.9 251.4 310.3
(-) Income tax and social contribution – current (40.9) (32.7) (42.7) (63.4)
Working capital variation 6.2 (24.2) (4.8) 13.3
Cash provided before capex 108.5 134.0 203.9 260.2
Used car sales revenues 303.0 448.2 590.3 853.2
Capex of car – renewal (349.3) (496.0) (643.3) (839.0)
Net capex for renewal (46.3) (47.8) (53.0) 14.2
Capex - Property and equipment, net (10.2) (28.0) (32.7) (23.7)
Free cash flow before growth 52.0 58.2 118.2 250.7
Capex of car – growth (143.8) (194.0) (287.0) (221.9)
Change in amounts payable to car suppliers (capex) (21.9) (25.5) 222.0 (51.0)
Free cash flow (113.7) (161.3) 53.2 (22.2)
FCF before growth (R$ million)
12
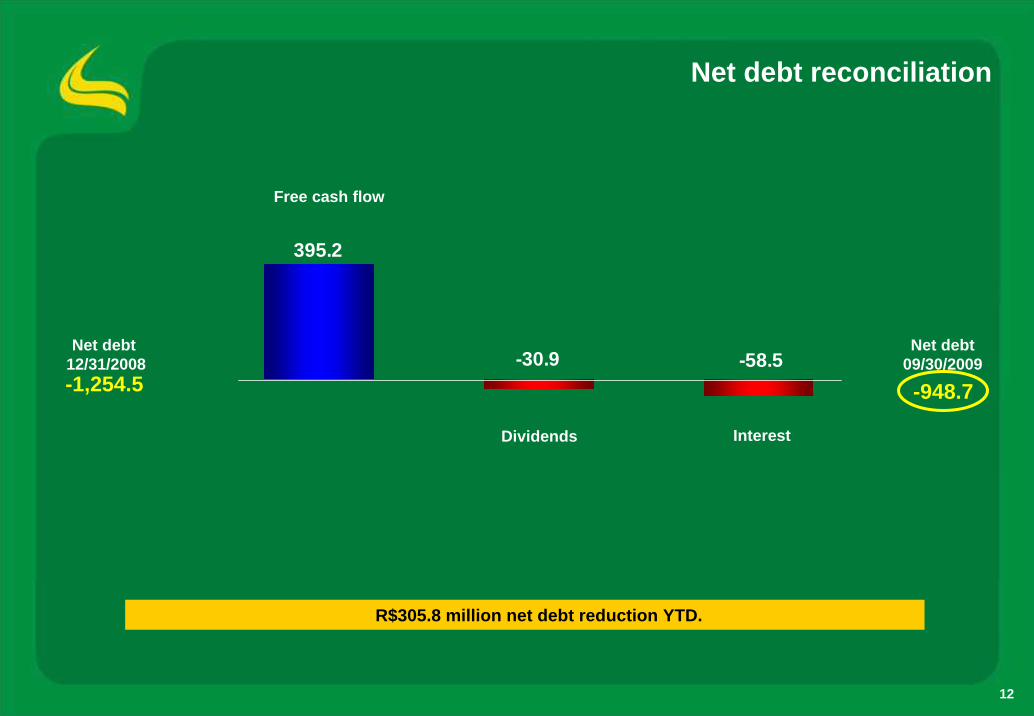
-58.5-30.9
395.2
-1,254.5 -948.7
InterestDividends
Net debt12/31/2008
Net debt 09/30/2009
Net debt reconciliation
Free cash flow
R$305.8 million net debt reduction YTD.
13
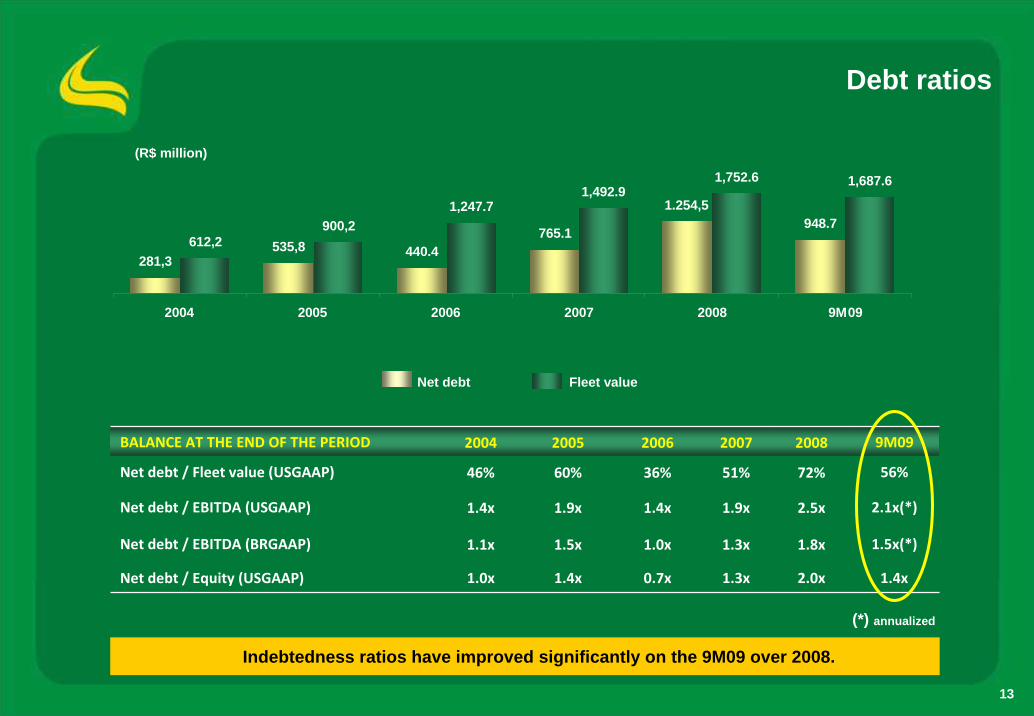
440.4765.1
948.71,247.7
1,492.91,752.6 1,687.6
1.254,5
535,8281,3
612,2900,2
2004 2005 2006 2007 2008 9M09
Debt ratios
BALANCE AT THE END OF THE PERIOD 2004 2005 2006 2007 2008 9M09
Net debt / Fleet value (USGAAP) 46% 60% 36% 51% 72%
2.5x
1.8x
2.0x
56%
Net debt / EBITDA (USGAAP) 1.4x 1.9x 1.4x 1.9x 2.1x(*)
Net debt / EBITDA (BRGAAP) 1.1x 1.5x 1.0x 1.3x 1.5x(*)
Net debt / Equity (USGAAP) 1.0x 1.4x 0.7x 1.3x 1.4x
(R$ million)
Net debt Fleet value
Indebtedness ratios have improved significantly on the 9M09 over 2008.
(*) annualized
14
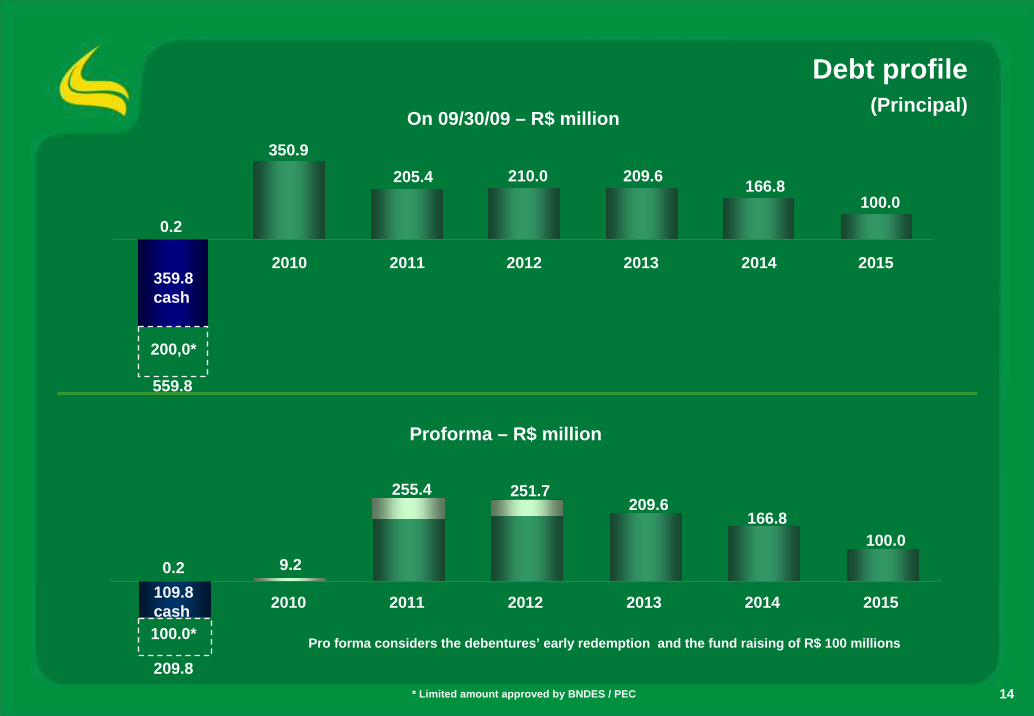
Debt profile(Principal)
On 09/30/09 – R$ million
Pro forma considers the debentures’ early redemption and the fund raising of R$ 100 millions100.0*
209.8
0.2 9.2
255.4 251.7209.6
166.8100.0
109.8cash 2010 2011 2012 2013 2014 2015
0.2
359.8cash
350.9205.4 210.0 209.6 166.8
100.0
2010 2011 2012 2013 2014 2015
200,0*
559.8
Proforma – R$ million
* Limited amount approved by BNDES / PEC
15
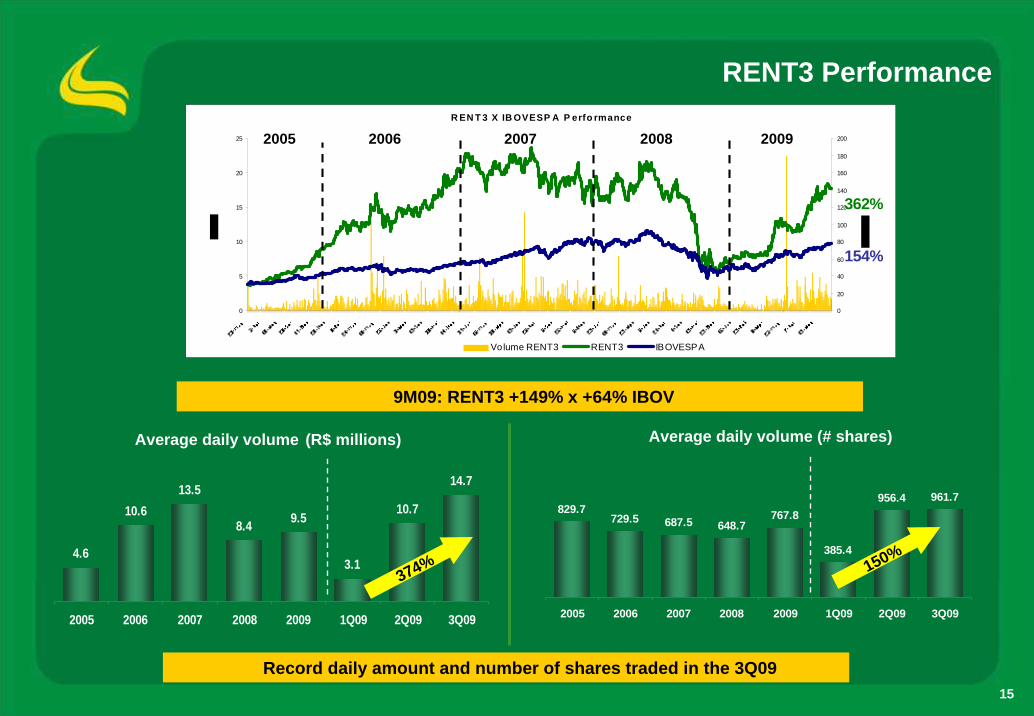
4.6
10.613.5
8.4 9.5
3.1
10.7
14.7
2005 2006 2007 2008 2009 1Q09 2Q09 3Q09
Average daily volume (R$ millions) Average daily volume (# shares)
RENT3 Performance
829.7729.5 687.5 648.7
767.8
385.4
956.4 961.7
2005 2006 2007 2008 2009 1Q09 2Q09 3Q09
Record daily amount and number of shares traded in the 3Q09
9M09: RENT3 +149% x +64% IBOV
374% 150%
R EN T 3 X IB OVESP A P erfo rmance
0
5
10
15
20
25
0
20
40
60
80
100
120
140
160
180
200
Volume RENT3 RENT3 IBOVESPA
362%
154%
2005 2006 2007 2008 2009
16
Macroeconomic scenario
4.5% GDP growth in 2010 (Focus)
5.1% real interest rate in 2010 (Focus)
2014 Soccer World Cup in Brazil
2016 Olympic Games at Rio de Janeiro
17
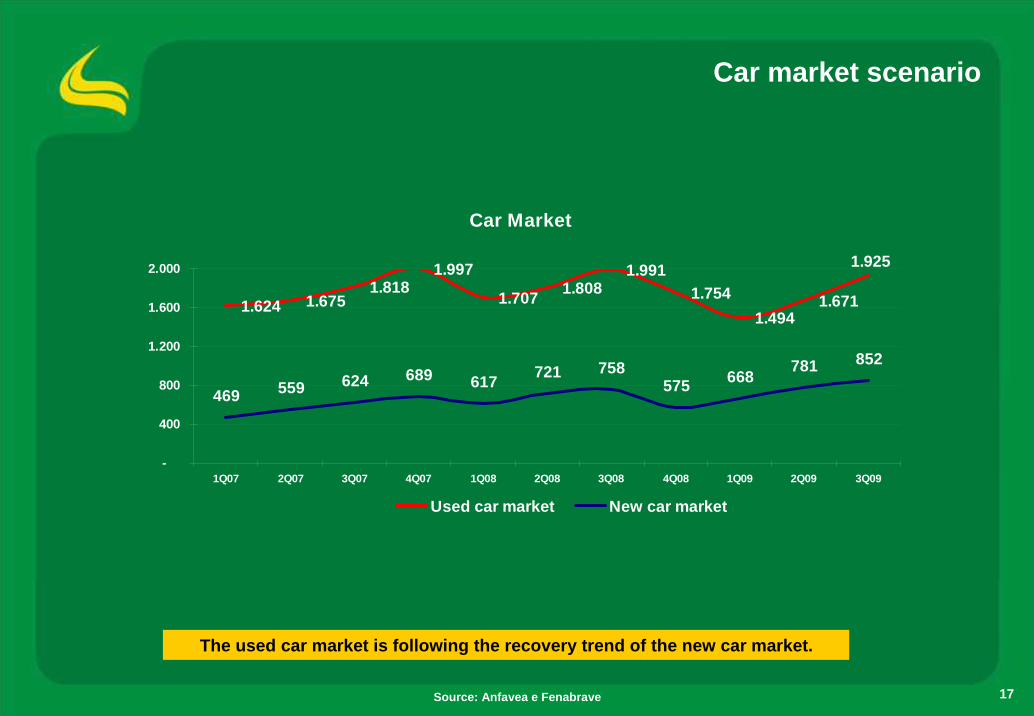
Car market scenario
The used car market is following the recovery trend of the new car market.
Source: Anfavea e Fenabrave
Car Market
1.624 1.6751.818
1.997
1.707 1.8081.991
1.7541.494
1.671
469 559 624 689 617 721 758575 668 781 852
1.925
-
400
800
1.200
1.600
2.000
1Q07 2Q07 3Q07 4Q07 1Q08 2Q08 3Q08 4Q08 1Q09 2Q09 3Q09
Used car market New car market
18
Thanks!