waka māori: he pūrongo rangahau/ waka māori: survey report maori survey report.pdf · 6 waka...
TRANSCRIPT
1
2
3
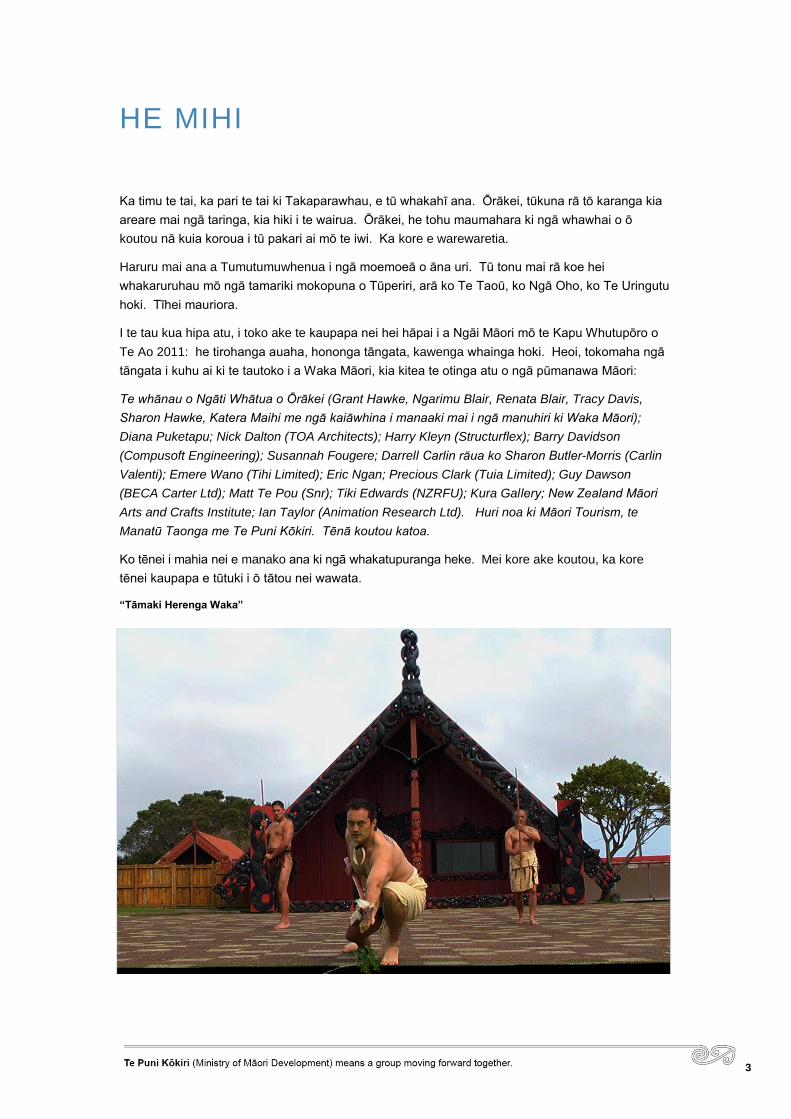
HE MIHI
Ka timu te tai, ka pari te tai ki Takaparawhau, e tū whakahī ana. Ōrākei, tūkuna rā tō karanga kia
areare mai ngā taringa, kia hiki i te wairua. Ōrākei, he tohu maumahara ki ngā whawhai o ō
koutou nā kuia koroua i tū pakari ai mō te iwi. Ka kore e warewaretia.
Haruru mai ana a Tumutumuwhenua i ngā moemoeā o āna uri. Tū tonu mai rā koe hei
whakaruruhau mō ngā tamariki mokopuna o Tūperiri, arā ko Te Taoū, ko Ngā Oho, ko Te Uringutu
hoki. Tīhei mauriora.
I te tau kua hipa atu, i toko ake te kaupapa nei hei hāpai i a Ngāi Māori mō te Kapu Whutupōro o
Te Ao 2011: he tirohanga auaha, hononga tāngata, kawenga whainga hoki. Heoi, tokomaha ngā
tāngata i kuhu ai ki te tautoko i a Waka Māori, kia kitea te otinga atu o ngā pūmanawa Māori:
Te whānau o Ngāti Whātua o Ōrākei (Grant Hawke, Ngarimu Blair, Renata Blair, Tracy Davis,
Sharon Hawke, Katera Maihi me ngā kaiāwhina i manaaki mai i ngā manuhiri ki Waka Māori);
Diana Puketapu; Nick Dalton (TOA Architects); Harry Kleyn (Structurflex); Barry Davidson
(Compusoft Engineering); Susannah Fougere; Darrell Carlin rāua ko Sharon Butler-Morris (Carlin
Valenti); Emere Wano (Tihi Limited); Eric Ngan; Precious Clark (Tuia Limited); Guy Dawson
(BECA Carter Ltd); Matt Te Pou (Snr); Tiki Edwards (NZRFU); Kura Gallery; New Zealand Māori
Arts and Crafts Institute; Ian Taylor (Animation Research Ltd). Huri noa ki Māori Tourism, te
Manatū Taonga me Te Puni Kōkiri. Tēnā koutou katoa.
Ko tēnei i mahia nei e manako ana ki ngā whakatupuranga heke. Mei kore ake koutou, ka kore
tēnei kaupapa e tūtuki i ō tātou nei wawata.
“Tāmaki Herenga Waka”

4 Waka Māori Survey Report February 2012
5
EXECUTIVE SUMMARY
Rugby World Cup (RWC) 2011 was held in New Zealand over September and October 2011. The
Government’s priorities for RWC 2011 were: to support the delivery of a successful tournament; to
maximise the leverage opportunities; and to capture legacy benefits for all New Zealanders.
These priorities were largely delivered through the REAL New Zealand festival.
Waka Māori was a Māori showcase pavilion supported by Government to:
contribute to the vibrancy and energy of the Auckland waterfront;
provide a unique venue for hosting events that was quintessentially Māori, South Pacific and
New Zealand in form; and
provide a facility for future hosting opportunities at key international events promoting New
Zealand.
This survey was developed to gauge visitors’ perceptions about Waka Māori. This survey also
aimed to provide insight into Waka Māori’s contribution to the economy, in line with Government’s
interest in determining the economic impact of RWC 2011 to New Zealand.
The top line findings from this survey include:
397,000 visits to Waka Māori;1
as a venue, visitors rated Waka Māori very highly for ease of access including for disabled
persons;
visitors were “very satisfied” with Waka Māori and rated this experience as high as, or higher
than, other RWC 2011 events and activities;
an estimated $9m of direct spend as a result of visitors’ attendance at Waka Māori;
84 percent of visitors reported that their Waka Māori experience was worth more than the
amount they had spent there;
88 percent of visitors agreed that Waka Māori played an important role in portraying Māori as
a positive contributor to the New Zealand economy;
Waka Māori had a positive influence on international visitors’ decisions to revisit New Zealand
in the future; and
survey ratings support the rationale behind Waka Māori.
1 180,000 people attended the Waka; 217,400 visits were recorded at Herenga Waka, the Artisans’ Village.
6 Waka Māori Survey Report February 2012
NIKAU – the off-spring of Tane and Tunarangi, nikau provided a rich array of
benefits for Māori including thatching and weaving materials (leaves), storage
containers (outer trunk), necklaces (berries) and food (young shoots).
7
CONTENTS
HE MIHI ..................................................................................................... 3
EXECUTIVE SUMMARY............................................................................ 5
BACKGROUND ......................................................................................... 9
INTRODUCTION ...................................................................................... 10
Description of Waka Māori ................................................................................................... 10
Visitor Numbers to Waka Māori ........................................................................................... 12
SURVEY OBJECTIVES & METHODOLOGY .......................................... 13
TE WAKA ................................................................................................ 14
Visitors to Waka Māori were Satisfied with the Overall Quality of the Venue ....................... 14
WAKA NGAHAU ..................................................................................... 16
Overall, Visitors were Very Satisfied with Waka Māori ......................................................... 17
TV and ‘Word of Mouth’ Boost Waka Māori Visits ................................................................ 18
Waka Māori seen as Welcoming, Educational, Informative, Entertaining and Unique ......... 18
Time Spent at Waka Māori ................................................................................................... 18
Positive Opinions of Waka Māori both Before and After Attendance ................................... 19
WAKA TĀKARO ...................................................................................... 20
Māori Rugby Exhibition Popular ........................................................................................... 20
HERENGA WAKA ................................................................................... 23
Māori Artisans’ Village was Rated Highly ............................................................................. 23
WAKA PAKIHI ......................................................................................... 25
Waka Māori Direct Event-related Spend is an Estimated $9m ............................................. 26
Waka Māori Presented New Business Opportunities for Visitors at Business Functions ..... 27
Portrayed Māori as a Positive Contributor to the New Zealand Economy ............................ 28
WAKA TŪRUHI ....................................................................................... 29
Unique cultural experience for International Visitors ............................................................ 29
Waka Māori Positive Influence on Decision to Revisit New Zealand ................................... 30
Waka Māori Excellent Contributor to RWC 2011 ................................................................. 31
WAKA TĀNGATA.................................................................................... 32

8 Waka Māori Survey Report February 2012
Ratings Support the Rationale behind Waka Māori ............................................................. 32
RESPONDENTS’ PROFILE ..................................................................... 34
Age/Sex ............................................................................................................................... 34
Education ............................................................................................................................. 34
Household Income ............................................................................................................... 34
Country of Origin .................................................................................................................. 35
APPENDIX 1: OUTCOMES FRAMEWORK............................................. 36
Te Puni Kōkiri Investments in RWC 2011 ............................................................................ 36
APPENDIX 2: WAKA MĀORI LIVE PERFORMANCE PROGRAMME .... 37
9
BACKGROUND
Rugby World Cup (RWC) 2011 was held in New Zealand over September and October 2011. The
Government’s priorities for RWC 2011 were: to support the delivery of a successful tournament; to
maximise the leverage opportunities; and, to capture legacy benefits for all New Zealanders.
These priorities were largely delivered through the REAL New Zealand festival.
Aligned with these priorities, Te Puni Kōkiri developed a Māori and Iwi Engagement Strategy
(Strategy) in 2009 to guide and inform its investment into RWC 2011. In February 2010, Rugby
New Zealand 2011 (RNZ) adopted this strategy as the official RNZ strategy for Māori and iwi
engagement in the RWC 2011. In order to support Te Puni Kōkiri’s evaluation requirements,
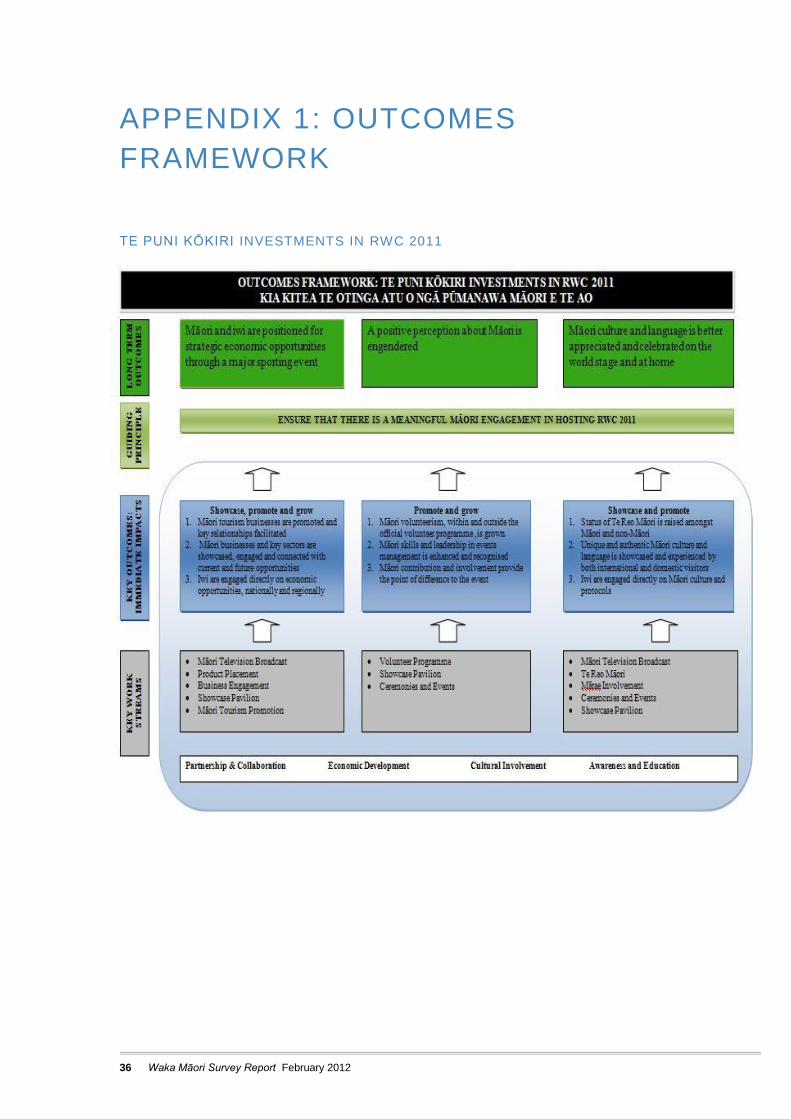
components of the Strategy were refined and resulted in the following long term outcomes for Te
Puni Kōkiri’s work (see Appendix 1):
Māori and iwi are positioned for strategic economic opportunities through a major sporting
event.
A positive perception about Māori is engendered.
Māori culture and language is better appreciated and celebrated on the world stage, and at
home.
Te Puni Kōkiri also undertook research to understand how indigenous peoples from around the
world had leveraged major events in their countries for social, economic, and political gain. The
only significant example of this was the First Host First Nations group, who activated a programme
around the Vancouver Winter Olympics in 2010 for several First Nations tribes based in Canada.
One of the pillars of their success was a showcase pavilion that became the centre for their
business engagement, and positive political activism. This example of success inspired the
development of Waka Māori.
10 Waka Māori Survey Report February 2012
INTRODUCTION
In October 2010, Ngāti Whātua o Ōrākei presented their ‘Waka Māori’ concept, which proposed to
construct a large-scale contemporary Māori canoe and use the space to host events, promote
business showcasing and add to the richness of the overall visitor experience to Auckland during
RWC 2011. Ngāti Whātua o Ōrākei objectives were to:
tell the story of Māori people through profiling NZ Māori Rugby;
create a dynamic and colourful space where Māori want to be, thereby attracting tourists to the
space;
leverage RWC for business opportunities with Pākehā, Māori and international visitors, from
Iwi Corporates to single entrepreneurs; and
raise the profile of Māori innovation, business, arts, culture and entertainment.
In March 2011, Cabinet confirmed contributions of $1.1m from Vote: Māori Affairs; up to $0.8m
from Vote: Arts, Culture and Heritage; and noted that Ngāti Whātua o Ōrākei would contribute
$0.1m (with further contributions in kind) to fund the Waka Māori project. Cabinet noted that
ownership of the Waka structure would be vested with Corporate Property Investments Ltd, a
company 100% owned by Ngāti Whātua o Ōrākei. Cabinet also noted that Waka Māori would:
contribute to the vibrancy and energy of the Auckland waterfront;
provide a unique venue for hosting events that was quintessentially Māori, South Pacific and
New Zealand in form; and
provide a facility for future hosting opportunities at key international events promoting New
Zealand.
As part of Government’s investment, Te Puni Kōkiri was tasked with securing free public events,
VIP hosting, business promotion and promotional activities to ensure public value and enjoyment
from Waka Māori, commensurate with the level of Government support.
Te Puni Kōkiri also worked with the Ministry for Culture and Heritage, NZ2011, NZ Trade and
Enterprise, Auckland City, and others involved in developing the waterfront programme, to ensure
that Waka Māori was a complementary venue to Queen’s Wharf and activities planned for the
Auckland CBD precinct.
In addition, every effort was made to ensure representation from other iwi at Waka Māori thereby
positioning this as a ‘Māori Inc’ project. To that end, Ngāti Whātua undertook regional visits during
July and August 2011 to meet with key iwi and Māori business leaders and invited them to attend
Waka Māori. Essentially, this was to participate in the opening pōhiri and business networking
functions.
DESCRIPTION OF WAKA MĀORI
The Waka itself is a New Zealand-made venue, constructed using 100% recyclable textile and
wood. The Waka is expected to have around a 25 year life span. Its total length, from the bow to
the stern post, is 74 metres, and it stands at a height of 16.6 metres. There is 501 square metres
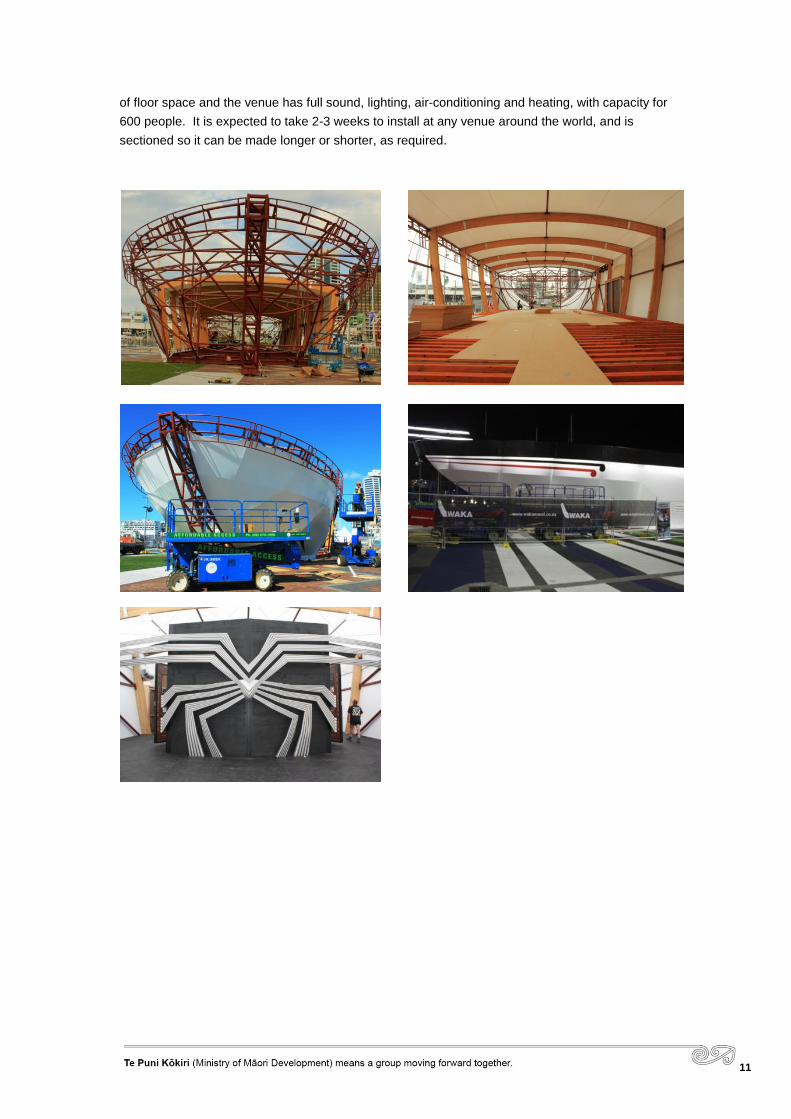
11
of floor space and the venue has full sound, lighting, air-conditioning and heating, with capacity for
600 people. It is expected to take 2-3 weeks to install at any venue around the world, and is
sectioned so it can be made longer or shorter, as required.

12 Waka Māori Survey Report February 2012
Herenga Waka (the adjacent Artisans’ Village) comprised three large pavilions. In these spaces,
Ngāti Whātua housed live carving and weaving exhibitions, traditional tattoo artists available to
work on visitors, and a contemporary Māori art gallery.
Waka Māori (the Waka venue itself and the Artisans’ Village) was located in a premium position on
Te Wero Island and the Eastern Viaduct – in the heart of the Auckland Viaduct – and was open for
11 days (from 13-23 October 2011), with free public access available for 10 days (from 14-23
October 2011).
There were five components to this event:
1. Waka Mānu (Opening Gala designed to serve as a key business networking function).
2. Waka Ngahau (a series of live entertainment shows).
3. Waka Tākaro (a Māori Rugby Exhibition and Māori Rugby Club).
4. Herenga Waka (an Artisans’ Village, exhibiting traditional and contemporary Māori art and
made available for purchase).
5. Waka Pakihi (business sector showcasing).
VISITOR NUMBERS TO W AKA MĀORI
Attendance numbers referenced in this report were recorded using conventional hand-clickers.
Staff were located at the entrance of the Waka and counted each person entering the premises.
These figures were reported to the production office on the hour each day and recorded on a
computer database.
The total counted was 179,100. An additional seven functions were held at Waka Māori, with an
estimated 1,1002 people attending. On this basis, the estimate of total attendance at Waka Māori
is rounded to 180,000.
In addition, there were 217,400 visits recorded at Herenga Waka. Counting here was conducted
slightly differently to the Waka, and reflected the physical arrangements and constraints for
entrance and exit into the three pavilions in this space. Staff were located at the entrance to each
of the three pavilions, and counted each person. For clarity, if a person visited each of the three
pavilions, this would be recorded as three ‘visits’. This method of counting ‘visits’, as opposed to
‘people’, is standard practice for events of a similar nature.
2 Four evening functions, two business breakfasts, and an NZTE hosted French/New Zealand networking function.
13
SURVEY OBJECTIVES &
METHODOLOGY
In collaboration with the Ministry for Culture and Heritage and Ngāti Whātua o Ōrākei, Te Puni
Kōkiri undertook the development and implementation of a survey to gather feedback on the
experiences of Waka Māori visitors, both domestic and international. Additionally, data indicating
the economic contribution of Government’s investment in Waka Māori was sought.
The survey was conducted as an online survey from 25 October to 15 November 2011. Waka
Māori visitors were approached as they queued at various points inside and outside the Waka and
Herenga Waka and invited to participate in the research. Contact details were collected from all
willing participants aged 15+ years so that a link to the online survey could be issued to them.
In order to ensure that survey participants were representative of all visitors, the collection of
contact details occurred over 5 full days of the 10 days Waka Māori was open to the general
public, including both weekdays and the weekend. During quieter periods all visitors were invited,
whereas in busier periods every nth visitor was invited to participate. When families or groups
entered, a ‘next birthday’ approach was used to select the respondent(s).
A total sample of 1,251 individuals provided their contact details and, of these, 482 visitors
completed the survey.
The survey results have a maximum margin of error of +/- 4.5 percent at the 95 percent confidence
level.
14 Waka Māori Survey Report February 2012
TE WAKA
VISITORS TO WAKA MĀORI WERE SATISFIED WITH THE OVERALL QUALITY
OF THE VENUE
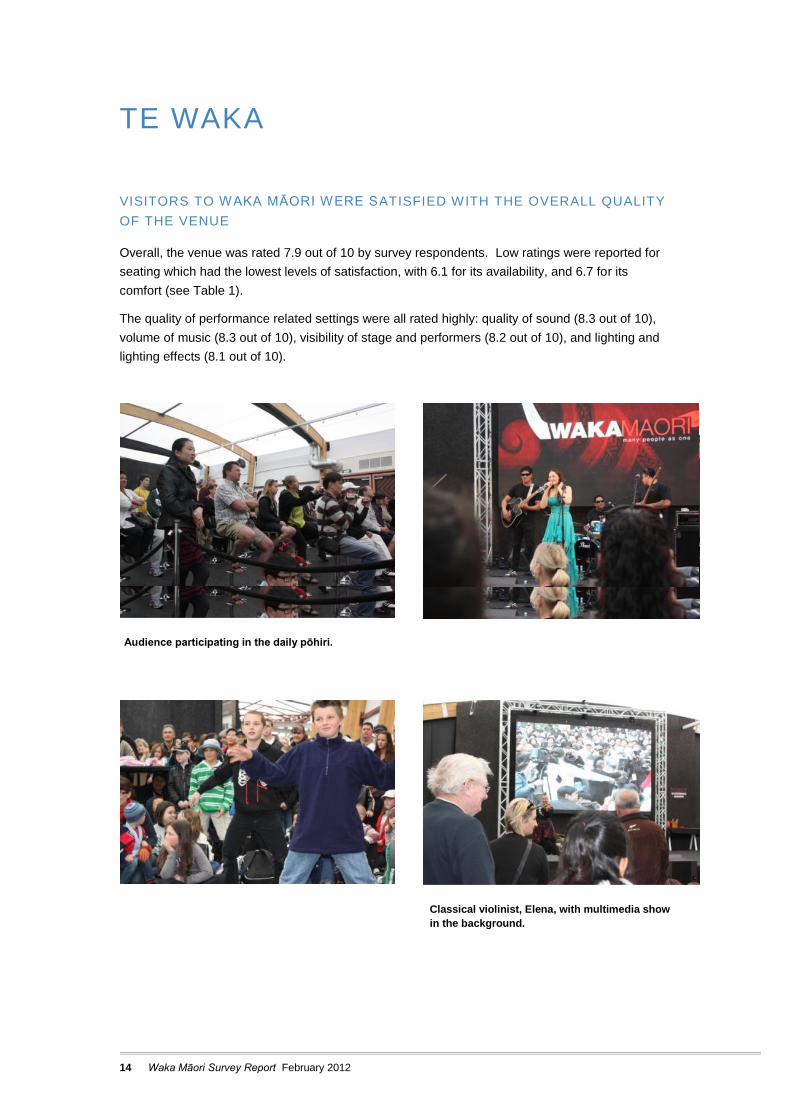
Overall, the venue was rated 7.9 out of 10 by survey respondents. Low ratings were reported for
seating which had the lowest levels of satisfaction, with 6.1 for its availability, and 6.7 for its
comfort (see Table 1).
The quality of performance related settings were all rated highly: quality of sound (8.3 out of 10),
volume of music (8.3 out of 10), visibility of stage and performers (8.2 out of 10), and lighting and
lighting effects (8.1 out of 10).
Audience participating in the daily pōhiri.
Classical violinist, Elena, with multimedia show
in the background.
15
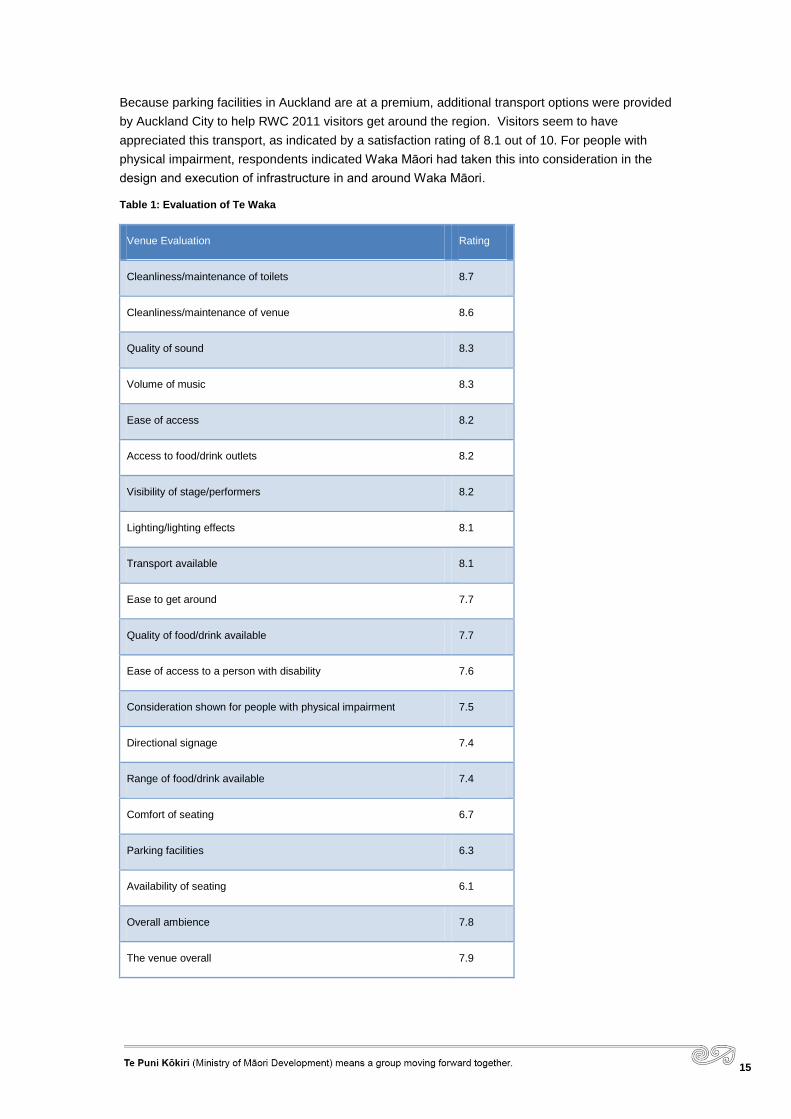
Because parking facilities in Auckland are at a premium, additional transport options were provided
by Auckland City to help RWC 2011 visitors get around the region. Visitors seem to have
appreciated this transport, as indicated by a satisfaction rating of 8.1 out of 10. For people with
physical impairment, respondents indicated Waka Māori had taken this into consideration in the
design and execution of infrastructure in and around Waka Māori.
Table 1: Evaluation of Te Waka
Venue Evaluation Rating
Cleanliness/maintenance of toilets 8.7
Cleanliness/maintenance of venue 8.6
Quality of sound 8.3
Volume of music 8.3
Ease of access 8.2
Access to food/drink outlets 8.2
Visibility of stage/performers 8.2
Lighting/lighting effects 8.1
Transport available 8.1
Ease to get around 7.7
Quality of food/drink available 7.7
Ease of access to a person with disability 7.6
Consideration shown for people with physical impairment 7.5
Directional signage 7.4
Range of food/drink available 7.4
Comfort of seating 6.7
Parking facilities 6.3
Availability of seating 6.1
Overall ambience 7.8
The venue overall 7.9
16 Waka Māori Survey Report February 2012
WAKA NGAHAU
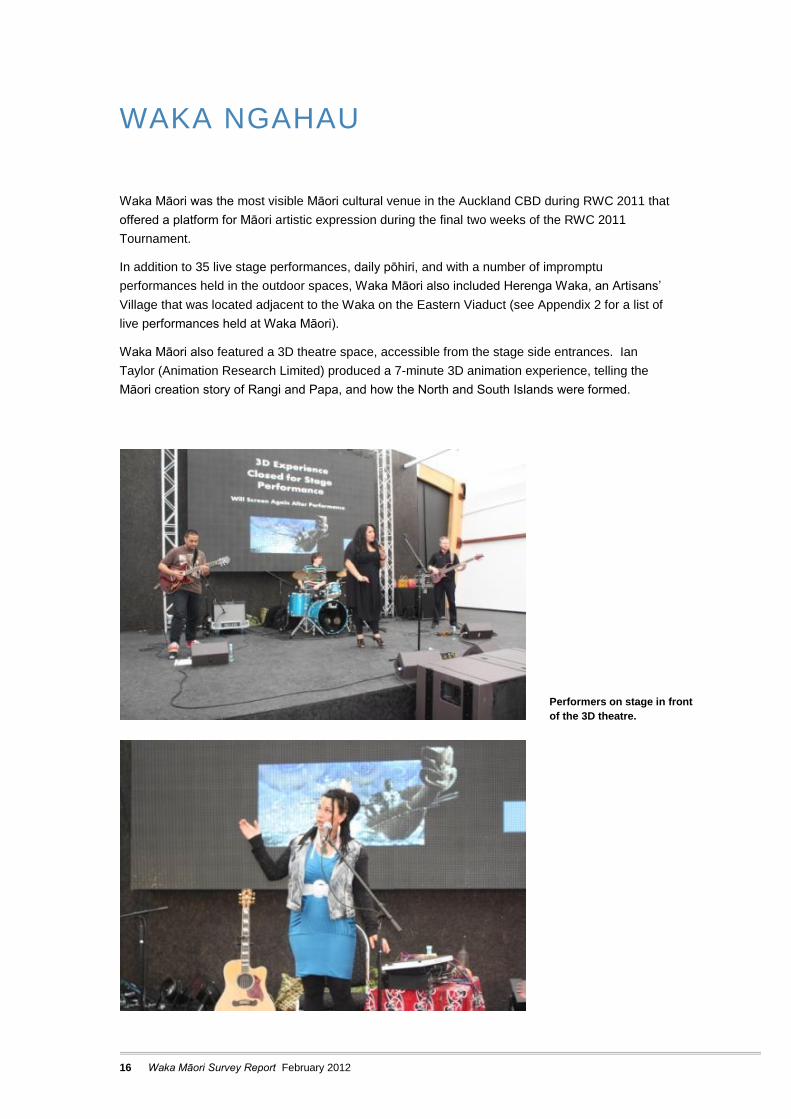
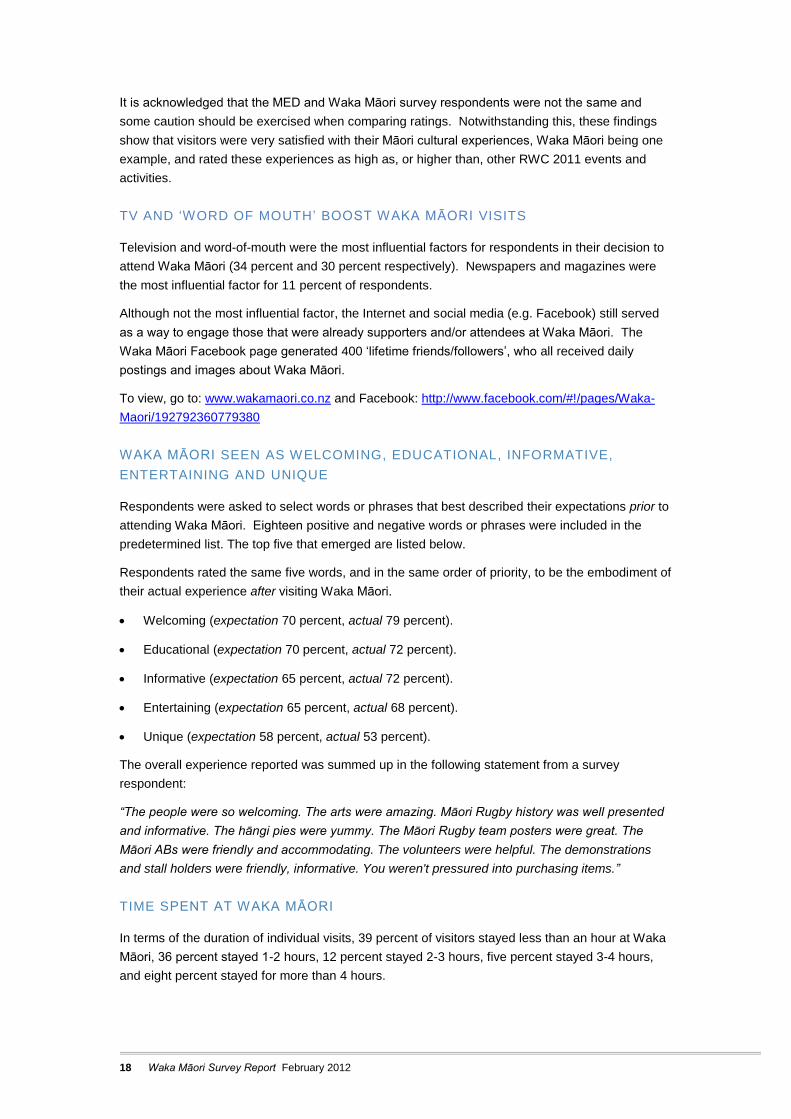
Waka Māori was the most visible Māori cultural venue in the Auckland CBD during RWC 2011 that
offered a platform for Māori artistic expression during the final two weeks of the RWC 2011
Tournament.
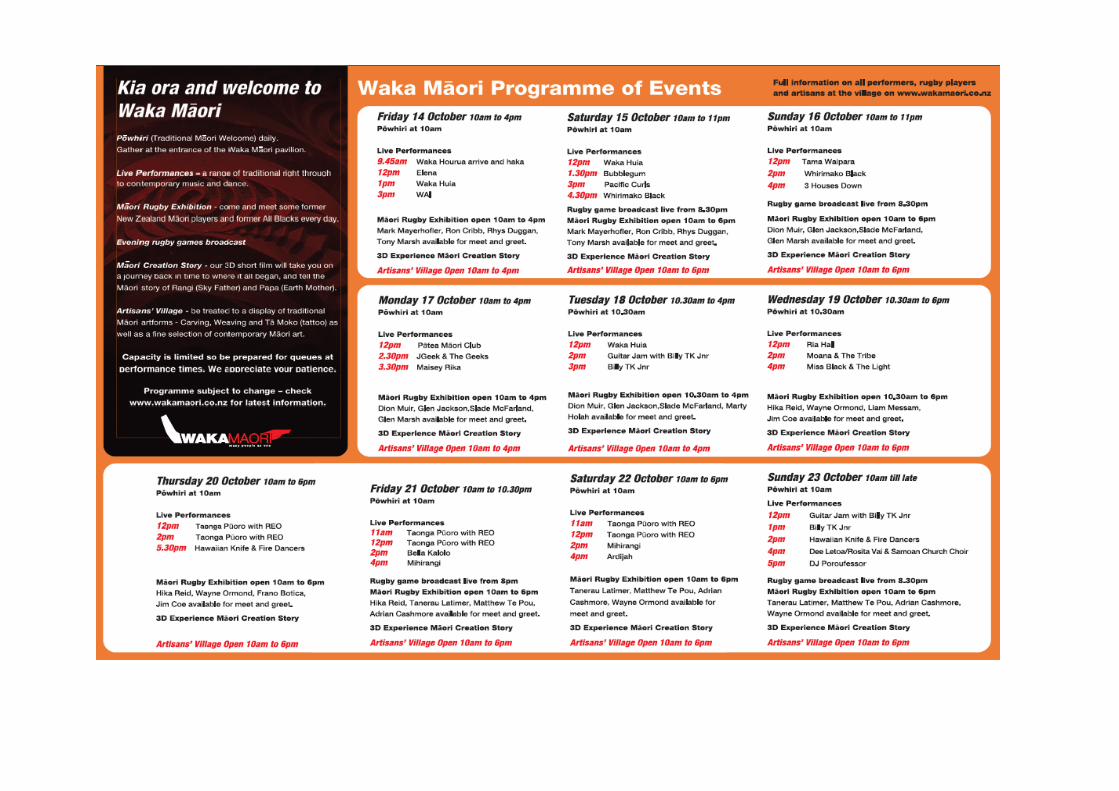
In addition to 35 live stage performances, daily pōhiri, and with a number of impromptu
performances held in the outdoor spaces, Waka Māori also included Herenga Waka, an Artisans’
Village that was located adjacent to the Waka on the Eastern Viaduct (see Appendix 2 for a list of
live performances held at Waka Māori).
Waka Māori also featured a 3D theatre space, accessible from the stage side entrances. Ian
Taylor (Animation Research Limited) produced a 7-minute 3D animation experience, telling the
Māori creation story of Rangi and Papa, and how the North and South Islands were formed.
Performers on stage in front
of the 3D theatre.

17
OVERALL, VISITORS WERE VERY SATISFIED WITH WAKA MĀORI
Respondents scored their overall satisfaction with Waka Māori highly, with an average satisfaction
rating of 8.2 out of 10. Twenty seven percent (27 percent) of respondents were extremely satisfied
with their experience, giving a 10 out of 10 rating (Fig. 1).
Fig. 1: Overall Satisfaction Rating of Waka Māori
A separate survey was undertaken by the Ministry of Economic Development (MED) that gauged
the overall satisfaction with various activities held during RWC 2011.3 In that survey, RWC 2011
ticket buyers were asked to indicate their overall satisfaction with respect to Queen’s Wharf Fan
Zone and the Cloud, the REAL New Zealand Festival and their Māori cultural experiences (see
Table 2).
The average satisfaction rating for the Fan Zone and the Cloud was 7.7 out of 10, the REAL New
Zealand Festival was 7.8 out of 10, and their Māori cultural experience was rated at 7.9 out of 10.
This indicates that Māori cultural experiences compared favourably with other event-related
experiences during the RWC 2011.
Table 2: RWC Ticket Buyers rating of Māori Cultural Experiences
3 Ministry of Economic Development. (2011). Rugby World Cup Survey Report.
18 Waka Māori Survey Report February 2012
It is acknowledged that the MED and Waka Māori survey respondents were not the same and
some caution should be exercised when comparing ratings. Notwithstanding this, these findings
show that visitors were very satisfied with their Māori cultural experiences, Waka Māori being one
example, and rated these experiences as high as, or higher than, other RWC 2011 events and
activities.
TV AND ‘WORD OF MOUTH ’ BOOST WAKA MĀORI VISITS
Television and word-of-mouth were the most influential factors for respondents in their decision to
attend Waka Māori (34 percent and 30 percent respectively). Newspapers and magazines were
the most influential factor for 11 percent of respondents.
Although not the most influential factor, the Internet and social media (e.g. Facebook) still served
as a way to engage those that were already supporters and/or attendees at Waka Māori. The
Waka Māori Facebook page generated 400 ‘lifetime friends/followers’, who all received daily
postings and images about Waka Māori.
To view, go to: www.wakamaori.co.nz and Facebook: http://www.facebook.com/#!/pages/Waka-
Maori/192792360779380
WAKA MĀORI SEEN AS WELCOMING, EDUCATIONAL, INFORMATIVE,
ENTERTAINING AND UNIQUE
Respondents were asked to select words or phrases that best described their expectations prior to
attending Waka Māori. Eighteen positive and negative words or phrases were included in the
predetermined list. The top five that emerged are listed below.
Respondents rated the same five words, and in the same order of priority, to be the embodiment of
their actual experience after visiting Waka Māori.
Welcoming (expectation 70 percent, actual 79 percent).
Educational (expectation 70 percent, actual 72 percent).
Informative (expectation 65 percent, actual 72 percent).
Entertaining (expectation 65 percent, actual 68 percent).
Unique (expectation 58 percent, actual 53 percent).
The overall experience reported was summed up in the following statement from a survey
respondent:
“The people were so welcoming. The arts were amazing. Māori Rugby history was well presented
and informative. The hāngi pies were yummy. The Māori Rugby team posters were great. The
Māori ABs were friendly and accommodating. The volunteers were helpful. The demonstrations
and stall holders were friendly, informative. You weren't pressured into purchasing items.”
TIME SPENT AT WAKA MĀORI
In terms of the duration of individual visits, 39 percent of visitors stayed less than an hour at Waka
Māori, 36 percent stayed 1-2 hours, 12 percent stayed 2-3 hours, five percent stayed 3-4 hours,
and eight percent stayed for more than 4 hours.
19
POSITIVE OPINIONS OF WAKA MĀOR I BOTH BEFORE AND AFTER
ATTENDANCE
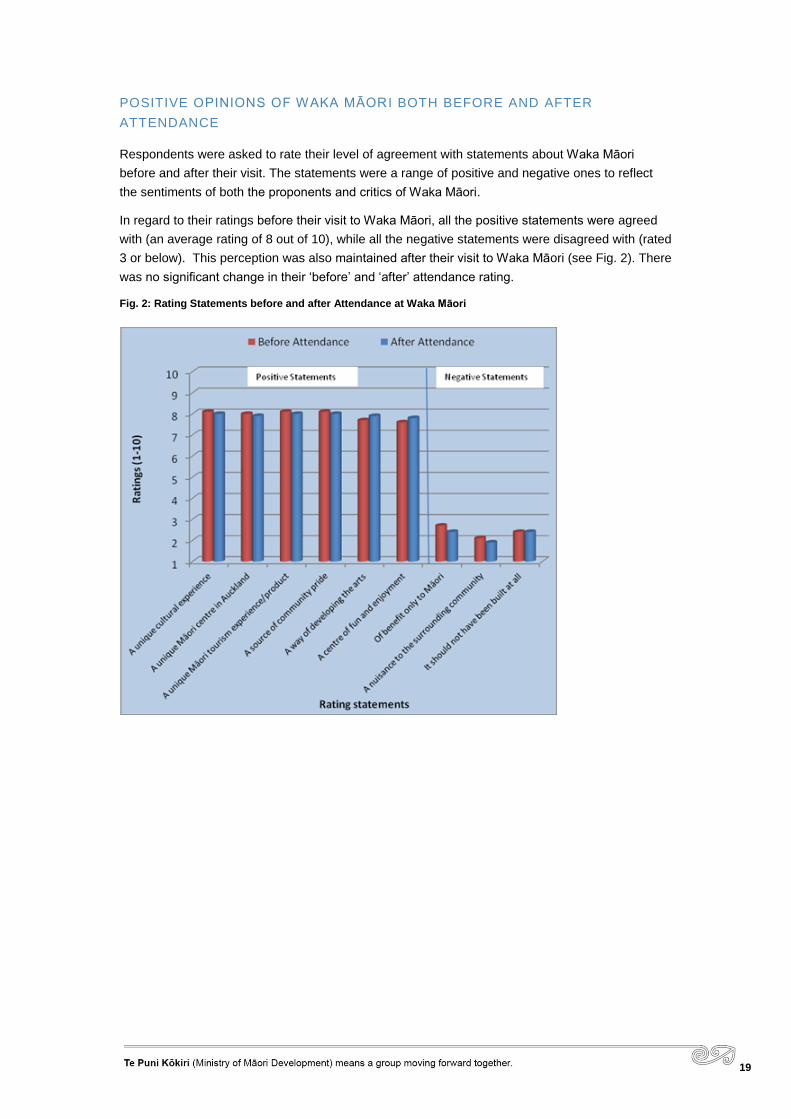
Respondents were asked to rate their level of agreement with statements about Waka Māori
before and after their visit. The statements were a range of positive and negative ones to reflect
the sentiments of both the proponents and critics of Waka Māori.
In regard to their ratings before their visit to Waka Māori, all the positive statements were agreed
with (an average rating of 8 out of 10), while all the negative statements were disagreed with (rated
3 or below). This perception was also maintained after their visit to Waka Māori (see Fig. 2). There
was no significant change in their ‘before’ and ‘after’ attendance rating.
Fig. 2: Rating Statements before and after Attendance at Waka Māori
20 Waka Māori Survey Report February 2012
WAKA TĀKARO
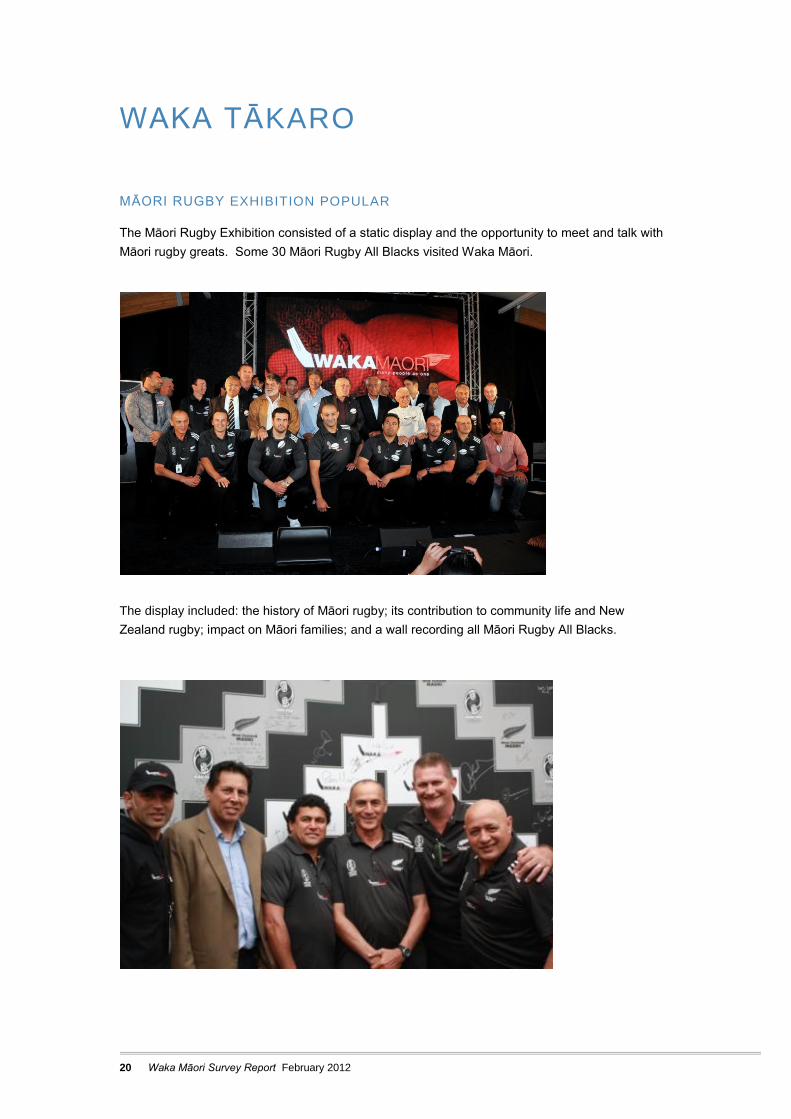
MĀORI RUGBY EXHIBITION POPULAR
The Māori Rugby Exhibition consisted of a static display and the opportunity to meet and talk with
Māori rugby greats. Some 30 Māori Rugby All Blacks visited Waka Māori.
The display included: the history of Māori rugby; its contribution to community life and New
Zealand rugby; impact on Māori families; and a wall recording all Māori Rugby All Blacks.

21
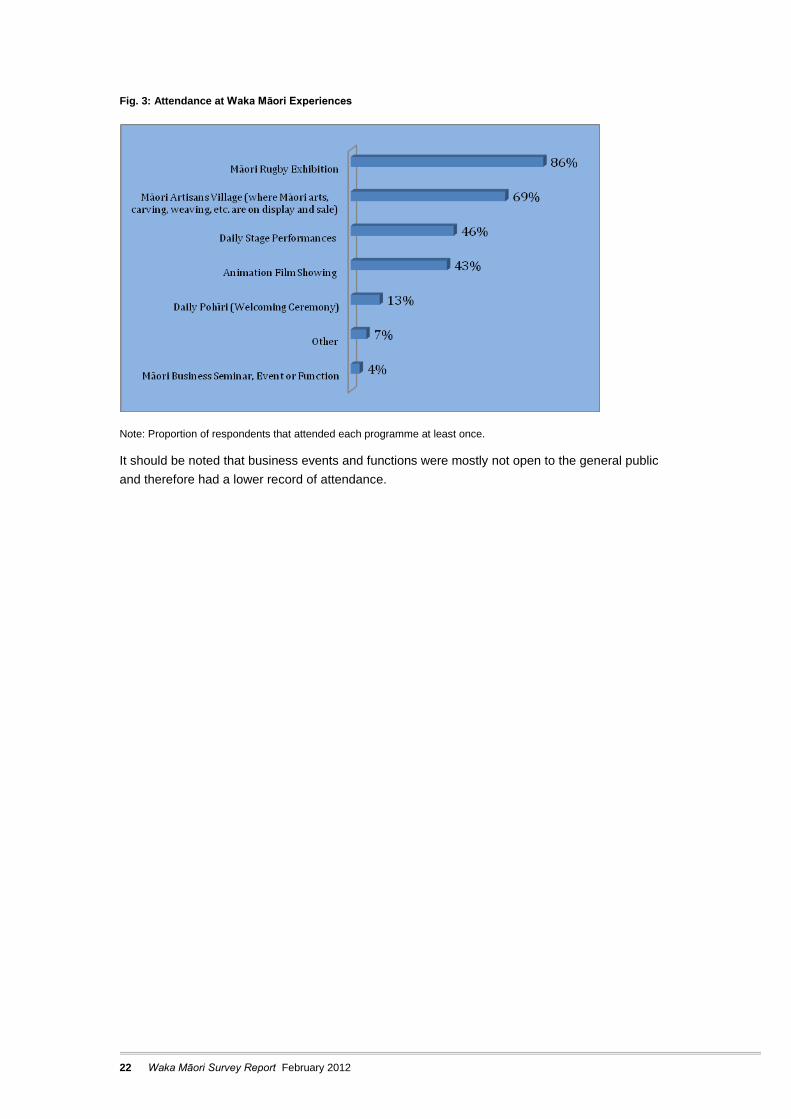
Respondents were asked which events and programmes they attended at Waka Māori. The Māori
Rugby Exhibition was by far the most popular programme at Waka Māori (86 percent), followed by
the Māori Artisans’ Village (69 percent). Just under half of respondents attended Daily Stage
Performances (46 percent) and the Animation Film Showing (43 percent).
One respondent said:
“Great for my overseas rugby mad Welsh visitors. They were ecstatic they were able to speak to
some rugby personalities.”
Māori Rugby memorabilia.
22 Waka Māori Survey Report February 2012
Fig. 3: Attendance at Waka Māori Experiences
Note: Proportion of respondents that attended each programme at least once.
It should be noted that business events and functions were mostly not open to the general public
and therefore had a lower record of attendance.
23
HERENGA WAKA
MĀORI ARTISANS’ VILLAGE WAS RATED HIGHLY
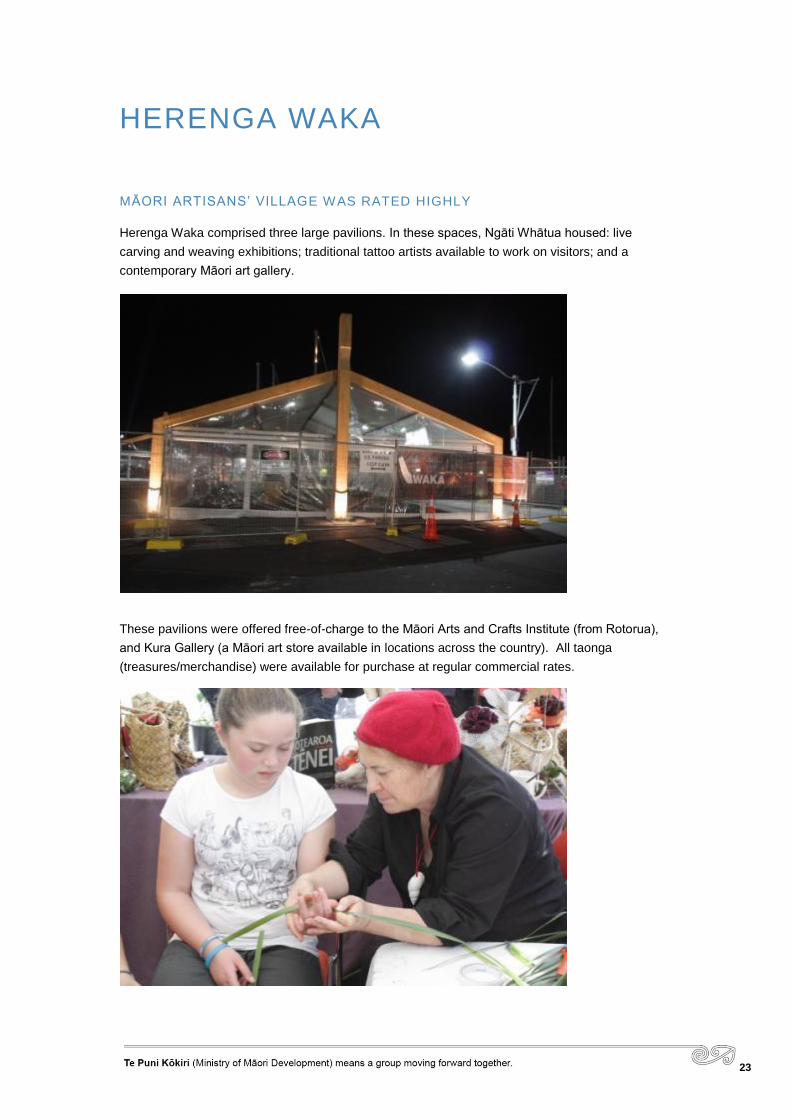
Herenga Waka comprised three large pavilions. In these spaces, Ngāti Whātua housed: live
carving and weaving exhibitions; traditional tattoo artists available to work on visitors; and a
contemporary Māori art gallery.
These pavilions were offered free-of-charge to the Māori Arts and Crafts Institute (from Rotorua),
and Kura Gallery (a Māori art store available in locations across the country). All taonga
(treasures/merchandise) were available for purchase at regular commercial rates.
24 Waka Māori Survey Report February 2012
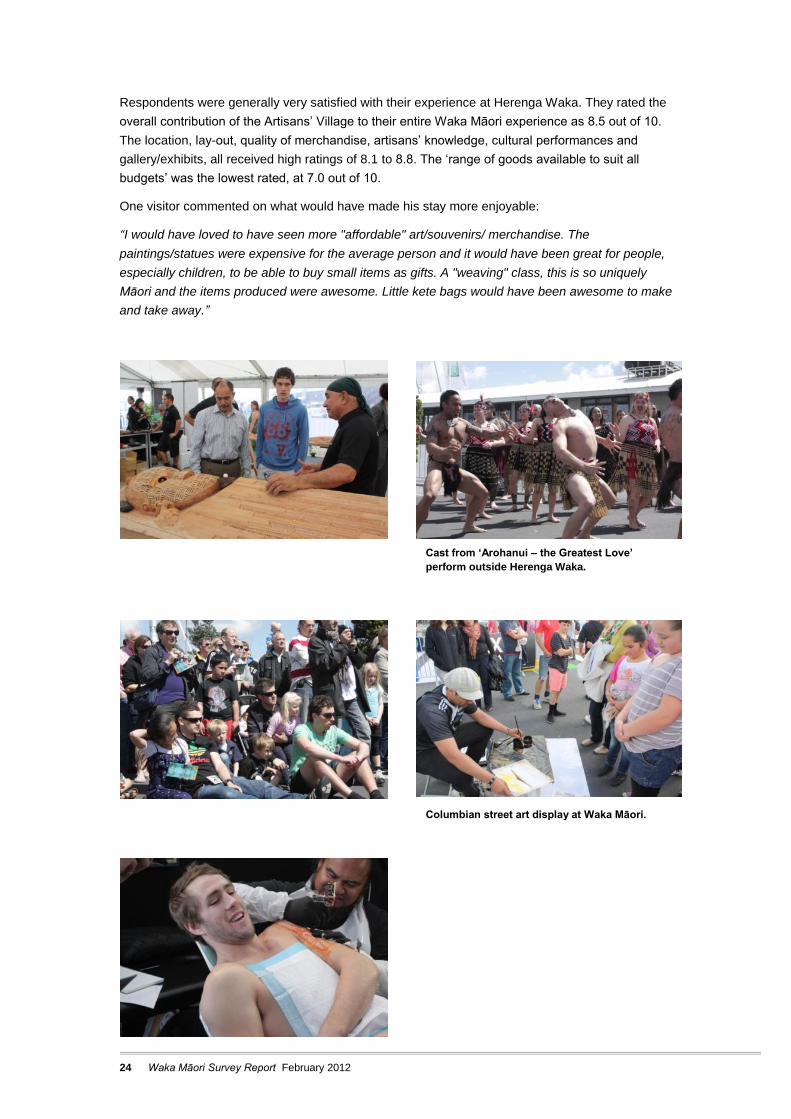
Respondents were generally very satisfied with their experience at Herenga Waka. They rated the
overall contribution of the Artisans’ Village to their entire Waka Māori experience as 8.5 out of 10.
The location, lay-out, quality of merchandise, artisans’ knowledge, cultural performances and
gallery/exhibits, all received high ratings of 8.1 to 8.8. The ‘range of goods available to suit all
budgets’ was the lowest rated, at 7.0 out of 10.
One visitor commented on what would have made his stay more enjoyable:
“I would have loved to have seen more "affordable" art/souvenirs/ merchandise. The
paintings/statues were expensive for the average person and it would have been great for people,
especially children, to be able to buy small items as gifts. A "weaving" class, this is so uniquely
Māori and the items produced were awesome. Little kete bags would have been awesome to make
and take away.”
Cast from ‘Arohanui – the Greatest Love’
perform outside Herenga Waka.
Columbian street art display at Waka Māori.

25
WAKA PAKIHI
An important objective for Waka Māori was to showcase and promote Māori business during the
time of RWC 2011. This objective also supported the focus to portray the dynamism and depth of
Māori culture today.
Waka Māori organisers and Te Puni Kōkiri worked with NZ2011, NZTE, ATEED, Tourism NZ and
others to:
host visiting business leaders at Waka Māori;
host specific functions at Waka Māori to showcase Māori commerce;
facilitate business networking opportunities at Waka Māori; and
host visiting global business columnists at Waka Māori.
Seven networking events were held at Waka Māori, along with the hosting of business leaders
from companies including Shell, Boeing, Bancorp, and Sky News.
Global financial media representatives from countries such as Russia, India, Indonesia and China
were also hosted at Waka Māori. These representatives were very important to carry messages
about Māori business via their media channels.
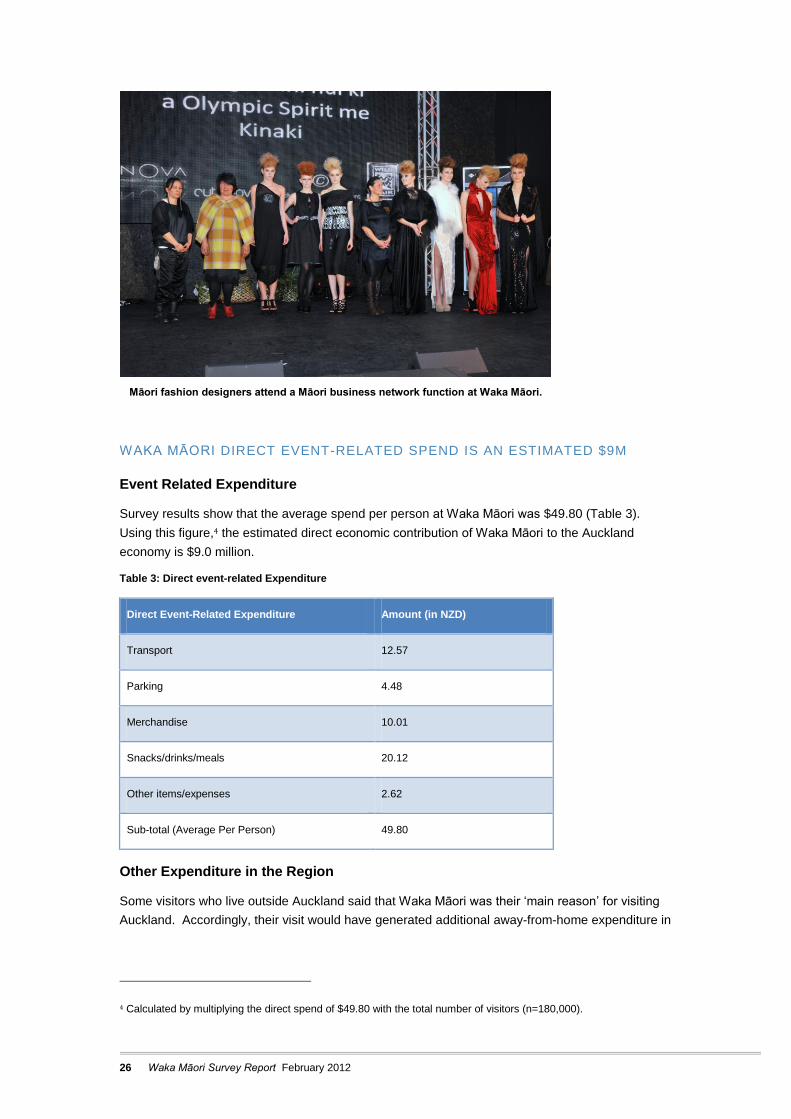
In addition to these engagements, a key connection was made between Elizabeth Emmanuel
(designer of Lady Diana’s wedding dress) and the Māori fashion designers who exhibited their
designs at the Journey through Māori Food, Wine and Business function held at Waka Māori on 18
October 2011. Mel Ferson, an NZ2011 Business Club member, facilitated the connection after
seeing the designs at the Waka function, and meeting Ms Emmanuel at Style Pasifika.
NZTE, Tana Umaga and Ngāti Whātua
Whātua o Ōrākei hosted
predominantly French food and
beverage business people, along with
key Māori food and beverage
business counterparts.
26 Waka Māori Survey Report February 2012
WAKA MĀORI DIRECT EVENT-RELATED SPEND IS AN ESTIMATED $9M
Event Related Expenditure
Survey results show that the average spend per person at Waka Māori was $49.80 (Table 3).
Using this figure,4 the estimated direct economic contribution of Waka Māori to the Auckland
economy is $9.0 million.
Table 3: Direct event-related Expenditure
Direct Event-Related Expenditure Amount (in NZD)
Transport 12.57
Parking 4.48
Merchandise 10.01
Snacks/drinks/meals 20.12
Other items/expenses 2.62
Sub-total (Average Per Person) 49.80
Other Expenditure in the Region
Some visitors who live outside Auckland said that Waka Māori was their ‘main reason’ for visiting
Auckland. Accordingly, their visit would have generated additional away-from-home expenditure in
4 Calculated by multiplying the direct spend of $49.80 with the total number of visitors (n=180,000).
Māori fashion designers attend a Māori business network function at Waka Māori.
27
the Auckland region such as accommodation, transport, parking and so on. These figures have
not been included here due to the cohort being small.
Willingness to Pay
When asked whether their experience at Waka Māori was worth more than the amount they had
spent, 84 percent of visitors reported that it was.
Of those who felt the experience was worth more than what they had paid, 60 percent said that
they were willing to pay $1-$20 extra, and 39 percent were willing to pay more than $20 extra.
This ‘willingness to pay’ approach illustrates an additional ‘unrealised’ benefit to the economy. This
feeling that the experience was worth more than what they paid could be one of the reasons for the
high satisfaction ratings that have been reported.
WAKA MĀORI PRESENTED NEW BUSINESS OPPORTUNITIES FOR VISITORS
AT BUSINESS FUNCTIONS
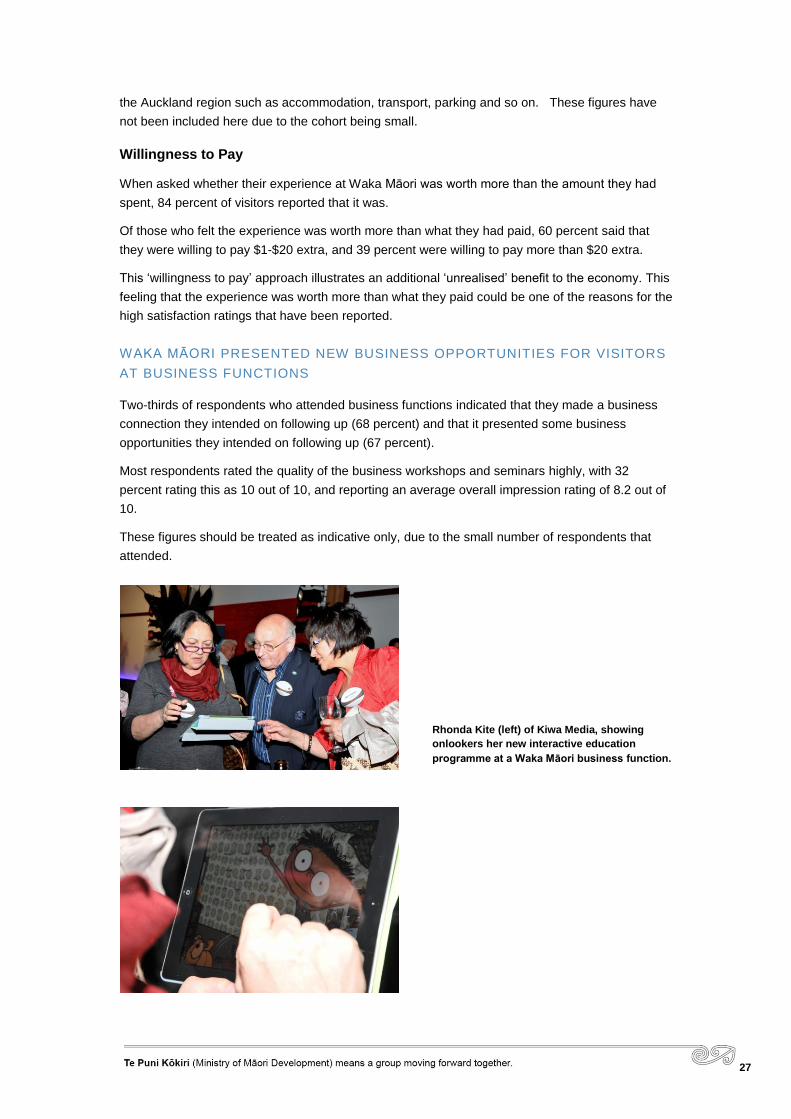
Two-thirds of respondents who attended business functions indicated that they made a business
connection they intended on following up (68 percent) and that it presented some business
opportunities they intended on following up (67 percent).
Most respondents rated the quality of the business workshops and seminars highly, with 32
percent rating this as 10 out of 10, and reporting an average overall impression rating of 8.2 out of
10.
These figures should be treated as indicative only, due to the small number of respondents that
attended.
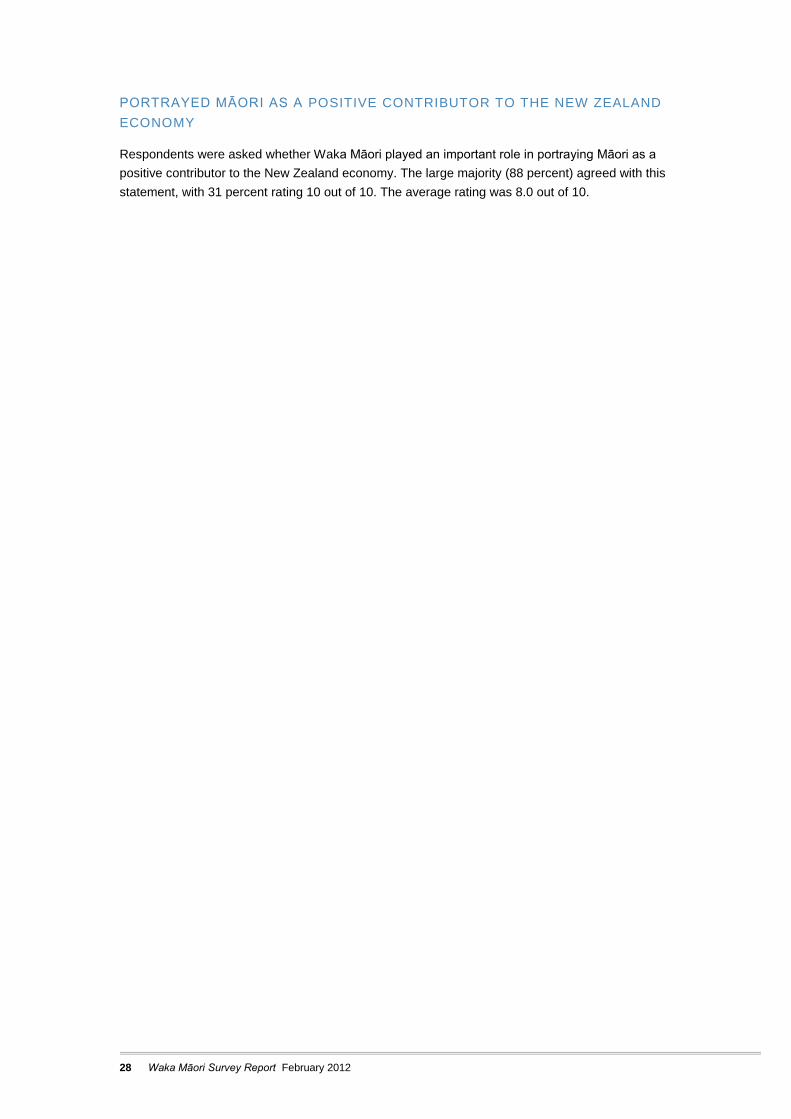
Rhonda Kite (left) of Kiwa Media, showing
onlookers her new interactive education
programme at a Waka Māori business function.
28 Waka Māori Survey Report February 2012
PORTRAYED MĀORI AS A POSITIVE CONTRIBUTOR TO THE NEW ZEALAND
ECONOMY
Respondents were asked whether Waka Māori played an important role in portraying Māori as a
positive contributor to the New Zealand economy. The large majority (88 percent) agreed with this
statement, with 31 percent rating 10 out of 10. The average rating was 8.0 out of 10.
29
WAKA TŪRUHI
Tourism is a substantial contributor to New Zealand’s economy and way of life. Tourism
contributes close to 10 percent of gross domestic product (GDP) as well as directly and indirectly
employing nearly one in ten New Zealanders.5 Importantly, and despite more challenging times in
the past 12 months, tourism remains one of New Zealand’s largest foreign exchange earners.
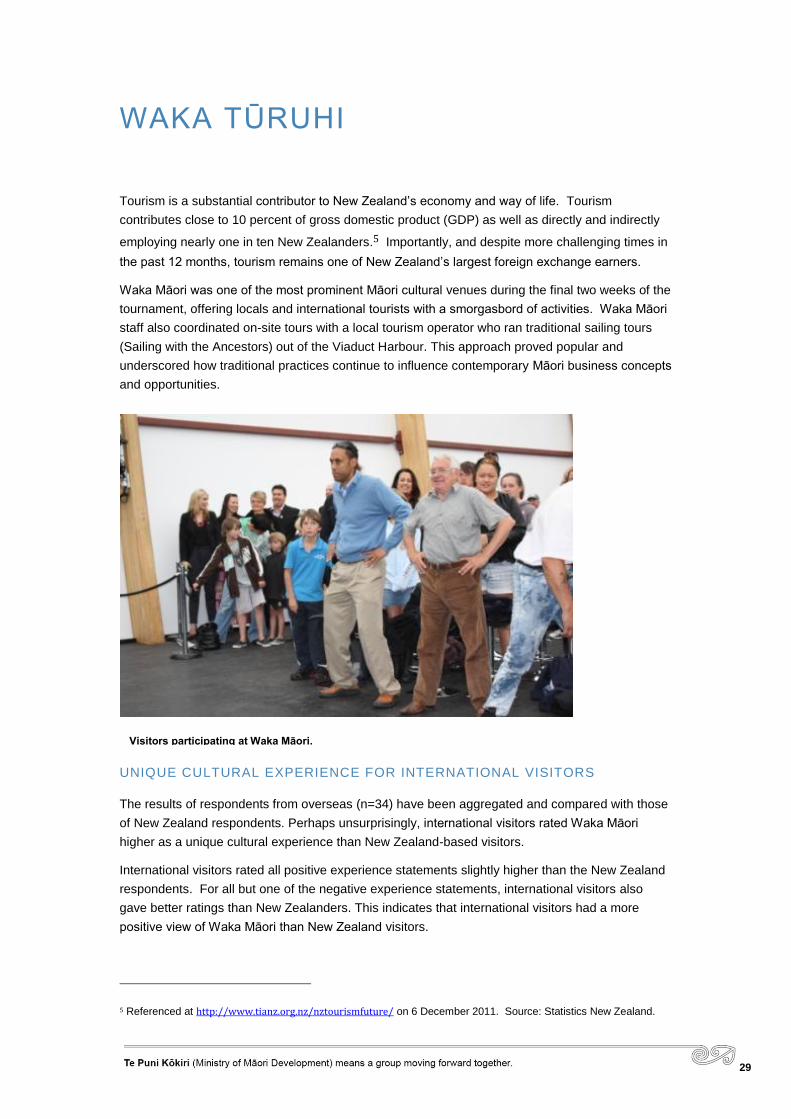
Waka Māori was one of the most prominent Māori cultural venues during the final two weeks of the
tournament, offering locals and international tourists with a smorgasbord of activities. Waka Māori
staff also coordinated on-site tours with a local tourism operator who ran traditional sailing tours
(Sailing with the Ancestors) out of the Viaduct Harbour. This approach proved popular and
underscored how traditional practices continue to influence contemporary Māori business concepts
and opportunities.
UNIQUE CULTURAL EXPERIENCE FOR INTERNATIONAL VISITORS
The results of respondents from overseas (n=34) have been aggregated and compared with those
of New Zealand respondents. Perhaps unsurprisingly, international visitors rated Waka Māori
higher as a unique cultural experience than New Zealand-based visitors.
International visitors rated all positive experience statements slightly higher than the New Zealand
respondents. For all but one of the negative experience statements, international visitors also
gave better ratings than New Zealanders. This indicates that international visitors had a more
positive view of Waka Māori than New Zealand visitors.
5 Referenced at http://www.tianz.org.nz/nztourismfuture/ on 6 December 2011. Source: Statistics New Zealand.
Visitors participating at Waka Māori.
30 Waka Māori Survey Report February 2012
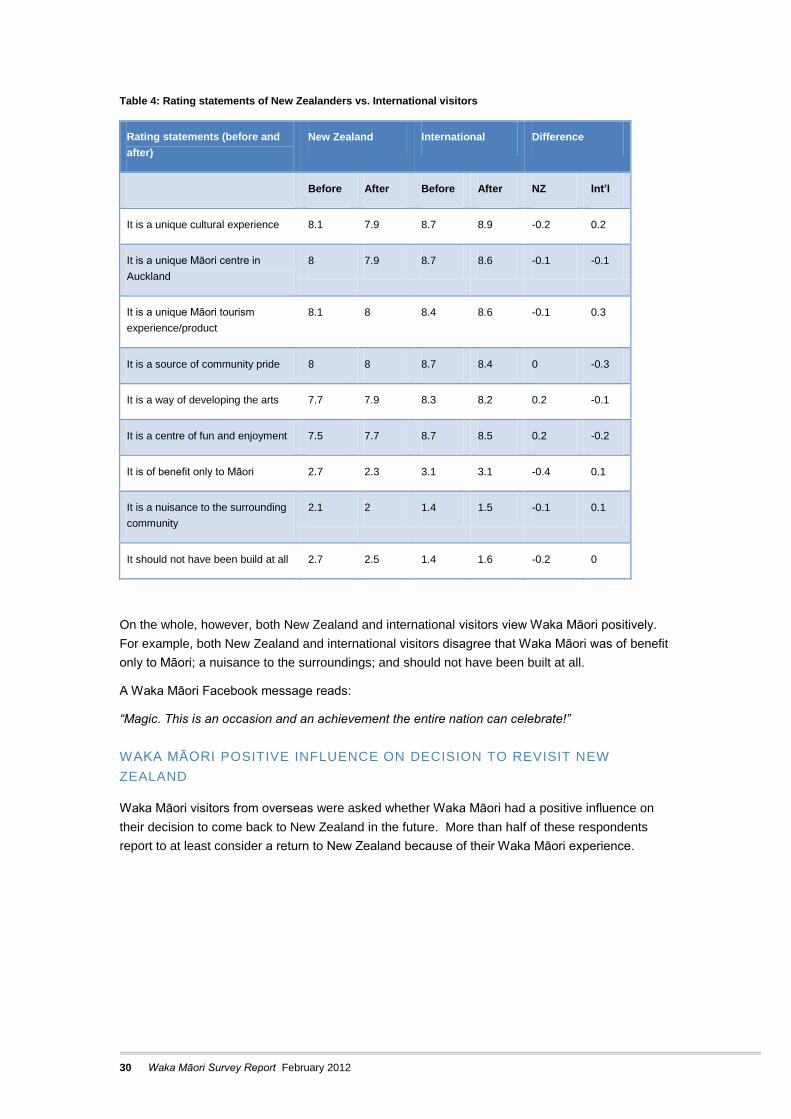
Table 4: Rating statements of New Zealanders vs. International visitors
Rating statements (before and
after)
New Zealand International Difference
Before After Before After NZ Int’l
It is a unique cultural experience 8.1 7.9 8.7 8.9 -0.2 0.2
It is a unique Māori centre in
Auckland
8 7.9 8.7 8.6 -0.1 -0.1
It is a unique Māori tourism
experience/product
8.1 8 8.4 8.6 -0.1 0.3
It is a source of community pride 8 8 8.7 8.4 0 -0.3
It is a way of developing the arts 7.7 7.9 8.3 8.2 0.2 -0.1
It is a centre of fun and enjoyment 7.5 7.7 8.7 8.5 0.2 -0.2
It is of benefit only to Māori 2.7 2.3 3.1 3.1 -0.4 0.1
It is a nuisance to the surrounding
community
2.1 2 1.4 1.5 -0.1 0.1
It should not have been build at all 2.7 2.5 1.4 1.6 -0.2 0
On the whole, however, both New Zealand and international visitors view Waka Māori positively.
For example, both New Zealand and international visitors disagree that Waka Māori was of benefit
only to Māori; a nuisance to the surroundings; and should not have been built at all.
A Waka Māori Facebook message reads:
“Magic. This is an occasion and an achievement the entire nation can celebrate!”
WAKA MĀORI POSITIVE INFLUENCE ON DECISION TO REVISIT NEW
ZEALAND
Waka Māori visitors from overseas were asked whether Waka Māori had a positive influence on
their decision to come back to New Zealand in the future. More than half of these respondents
report to at least consider a return to New Zealand because of their Waka Māori experience.
31
Table 5: Influence of Waka Māori on decision to revisit NZ
Will you consider returning to New Zealand because of the experience? Percentage
I will definitely return because of it 26%
I might return because of it 31%
It is not relevant to my decision 37%
I might not return because of it 0%
I will definitely not return because of it 6%
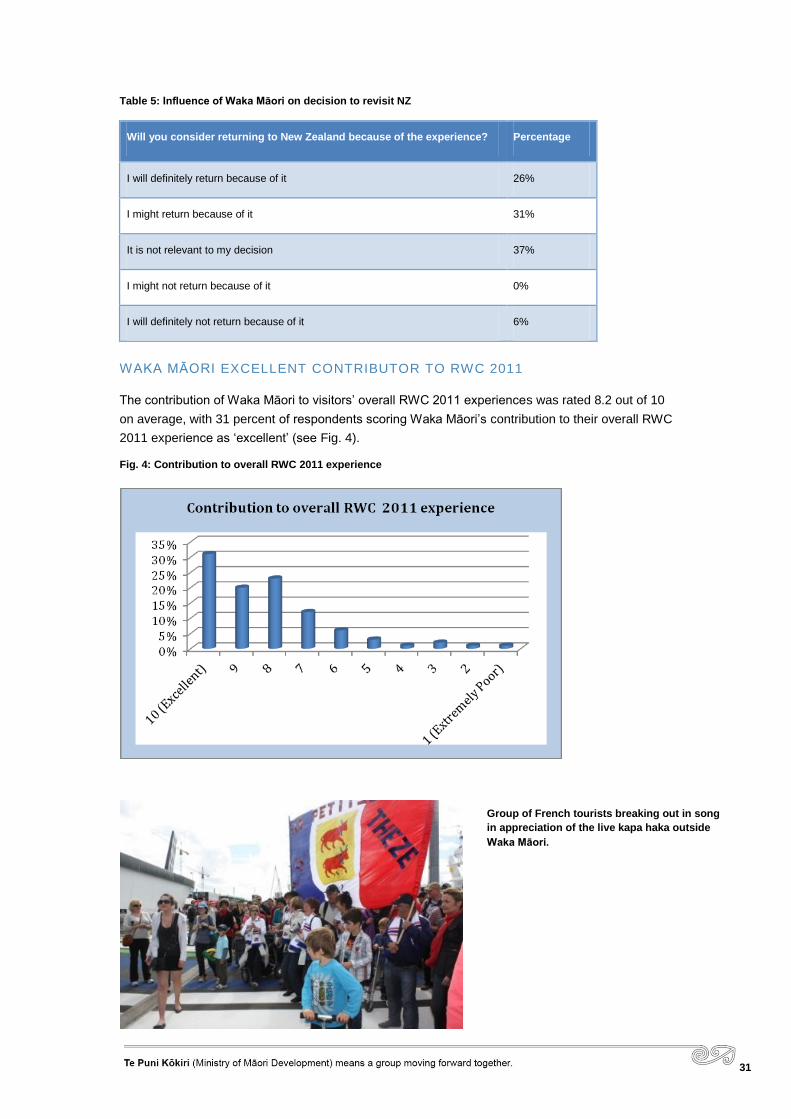
WAKA MĀORI EXCELLENT CONTRIBUTOR TO RWC 2011
The contribution of Waka Māori to visitors’ overall RWC 2011 experiences was rated 8.2 out of 10
on average, with 31 percent of respondents scoring Waka Māori’s contribution to their overall RWC
2011 experience as ‘excellent’ (see Fig. 4).
Fig. 4: Contribution to overall RWC 2011 experience
Group of French tourists breaking out in song
in appreciation of the live kapa haka outside
Waka Māori.
32 Waka Māori Survey Report February 2012
WAKA TĀNGATA
RATINGS SUPPORT THE RATIONALE BEHIND WAKA MĀORI
The survey also presented some statements that sought to gauge the community and cultural
impact of Waka Māori.
The ratings confirmed the rationale behind the construction of this unique structure in Auckland,
that is: visitors viewed it as a celebration of the rich Māori culture and heritage; it plays an
important role in educating people about Māori culture; it plays an important role in portraying
Māori as a positive contributor to New Zealand economy; and it was an opportunity for shared
experience by both domestic and international visitors (see Table 7).
Further analysis of the highest rating statements on cultural impacts shows that, of those that rated
the statement that Waka Māori ‘celebrated the rich Māori culture and heritage’, 32 percent of them
‘strongly agree’ and only 2 percent ‘strongly disagree’. The overall positive rating was 91 percent
and the overall negative rating was at 9 percent.
In regard to the statement that Waka Māori plays an important role in portraying Māori as a
positive contributor to the New Zealand economy’, 31 percent ‘strongly agree’ with this statement
and 2 percent ‘strongly disagree’. The overall positive rating was 88 percent.
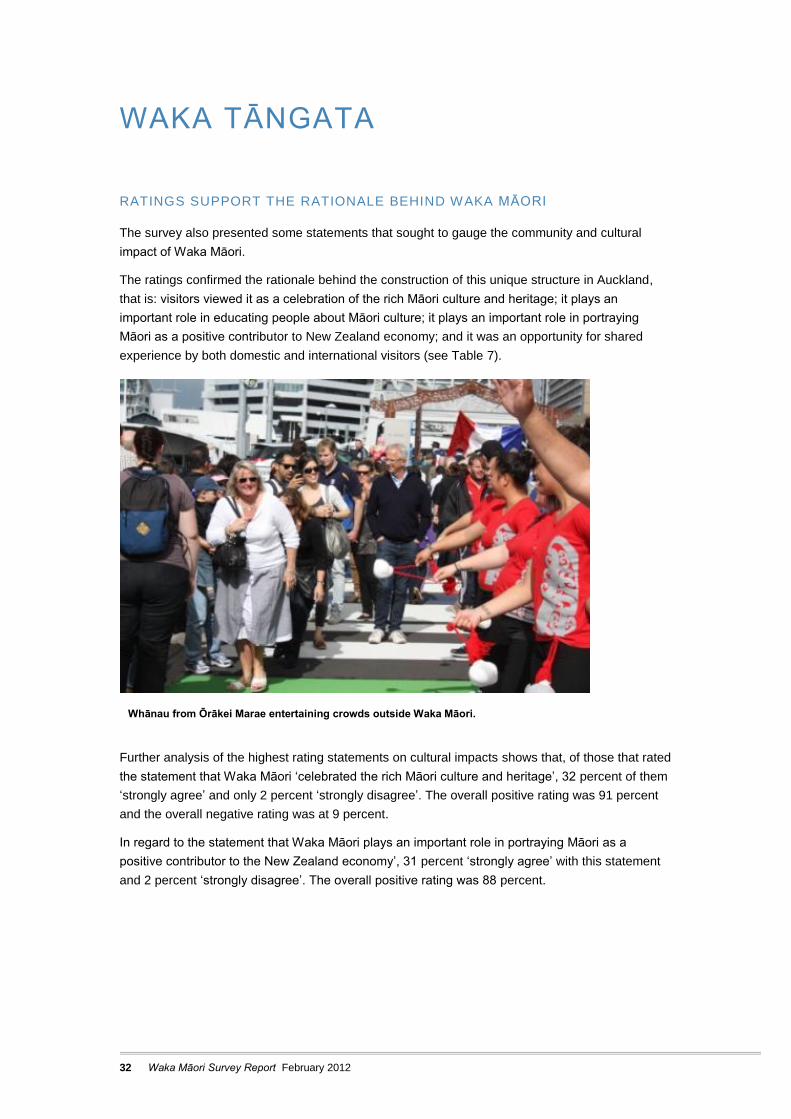
Whānau from Ōrākei Marae entertaining crowds outside Waka Māori.

33
Table 6: Rating of community and cultural impact statements
Statements Rating
Celebrated rich Māori culture and heritage 8.2
It plays an important role in portraying Māori as a positive contributor to New
Zealand economy
8.0
Plays an important role in education 8.0
Opportunity for shared experience 8.0
Spending time with friends and family 7.8
Makes New Zealand a vibrant and exciting place 7.7
It helps define the indigenous people of New Zealand 7.7
Makes Auckland a vibrant exciting place 7.6
It provided me with an authentic Māori cultural experience 7.5
Gives a sense of local community identity 7.5
Used technology in smart and innovative ways 7.5
It provided me with a better understanding of Māori culture 7.3
Helps to understand NZ culture and heritage 7.1
Reflected who I am and helped me feel connected 6.6
Inspired to get involved 6.1
Greater sense of identity 6.0
Challenged my ideas 5.9
Matt Te Pou, former Māori All Blacks coach, was reported in the media saying:
“There are games on all around the country, but as teams get knocked out, the cup moves to
Auckland. As tangata whenua, Ngāti Whātua have given all Māori an opportunity to showcase our
people, our land, our culture, te reo and, through Waka Māori, the Māori Rugby exhibition.”

34 Waka Māori Survey Report February 2012
RESPONDENTS’ PROFILE
AGE/SEX
Three-quarters (78 percent) of respondents were aged 30-59 years and 8 percent were under 30
years. The majority were women (68 percent) compared to men (32 percent).
Fig. 5: Age distribution of survey respondents
EDUCATION
Overall, respondents were well educated with 64 percent having undergraduate or post-graduate
qualifications, and 11 percent with trade qualifications. For one-fifth (21 percent), their highest
qualification was a secondary level qualification.
HOUSEHOLD INCOME
Respondents most frequently came from middle to high-income households. Just over one-half of
visitors (52 percent) had incomes between $40,000 and $120,000, and 20 percent of visitors had
household income of more than $120,000.
Table 7: Household Income of Respondents
Household Income (in NZD) Percentage
Less than $20,000 3%
$20,000-$39,999 6%
$40,000-$79,999 31%
$80,000-$119,999 21%
35
$120,000-$159,999 10%
$160,000-$199,999 4%
$200,000 or more 6%
Would rather not say 19%
COUNTRY OF ORIGIN
The majority of respondents were from New Zealand (93 percent). They were from a spread of
regions across the country, but the majority were Auckland residents. Seventy eight percent of
respondents from overseas were most frequently from Australia and the United Kingdom.
Based on the attendance figures recorded of 180,000, it is estimated that 12,600 international
visitors went to Waka Māori.
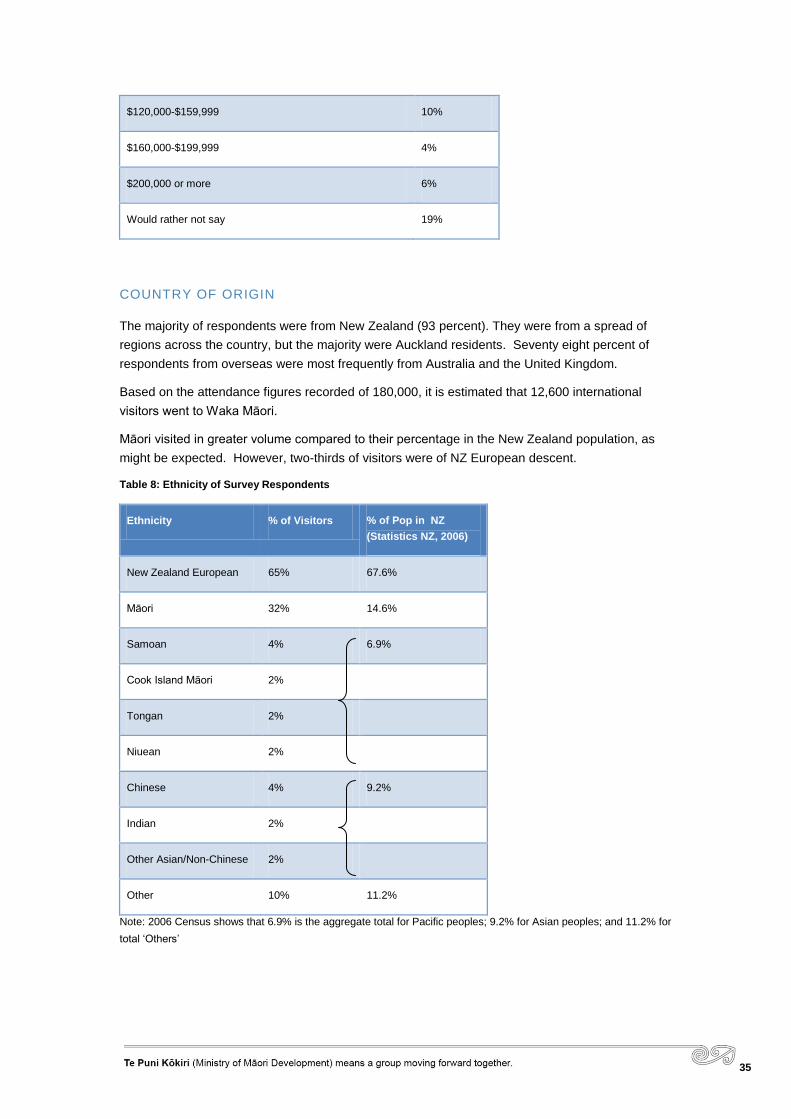
Māori visited in greater volume compared to their percentage in the New Zealand population, as
might be expected. However, two-thirds of visitors were of NZ European descent.
Table 8: Ethnicity of Survey Respondents
Ethnicity % of Visitors % of Pop in NZ
(Statistics NZ, 2006)
New Zealand European 65% 67.6%
Māori 32% 14.6%
Samoan 4% 6.9%
Cook Island Māori 2%
Tongan 2%
Niuean 2%
Chinese 4% 9.2%
Indian 2%
Other Asian/Non-Chinese 2%
Other 10% 11.2%
Note: 2006 Census shows that 6.9% is the aggregate total for Pacific peoples; 9.2% for Asian peoples; and 11.2% for
total ‘Others’
36 Waka Māori Survey Report February 2012
APPENDIX 1: OUTCOMES
FRAMEWORK
TE PUNI KŌKIRI INVESTMENTS IN RWC 2011

37
APPENDIX 2: WAKA MĀORI LIVE
PERFORMANCE PROGRAMME
38 Waka Māori Survey Report February 2012

39
40 Waka Māori Survey Report February 2012